127
Beam-to-Column Connections A STUDY OF THE BEHAVIOR OF TO-COLUMN CONNECTIONS by Joh n W. P.eters George C. Driscoll, Jr. Fritz Engineering Laboratory Report No. 333.2

Beam-to-Column Connections
A STUDY OF THE BEHAVIOROF BEAM~TO-COLUMN
CONNECTIONS
byJohn W. P.eters
George C. Driscoll, Jr.
Fritz Engineering Laboratory Report No. 333.2

Beam-to-Column Connections
A STUDY OF THE BEHAVIOR OF
BEAM-TO-COLUMN CONNECTIONS
by
John W. Peters
George C. Driscoll, Jr.
This work has been carried out as part
of an investigation sponsored jointly by
the American Iron and Steel Institute and
the Welding Research Council
Fritz Engineering Laboratory
Department of Civil Engineering.
Lehigh University
Bethlehem, Pennsylvania
June 1968
Fritz Engineering Laboratory Report No. 333.2

ii

Page
7 • DESIGN SUGGESTIONS 64
8 • NOMENCLATURE 68
9. TABLE-S 70
10. FIGURES 79
11. REFERENCES 117
12. ACKNOWLEDGEMENTS 118
iii

ABSTRACT
This report presents the results of a theoretical
and experimental investigation on fully rigid beam-to
column connections. Of primary importance is the effect
of high axial load in a column on the behavior bf beam
to-column connections.
Both upper and lower bound theoretical plastic·
analysis relations are derived and discussed. The theo
retical investigations are compared against actual test
resul ts-.
The results of an. experimental investiga.tion are
presented and discussed. Conclusions are made as to how
a connection behaves plastically.
The report is concluded with the presentation of
a practical design method for some types of beam-to
column connections.
iv

1. INTRODUCTION
In a mUlti-story frame, methods have been found
to predict the behavior of the frame and most of its
components. (1) However, the plastic method of analysis
and design presently used neglects the combined effect
of shear and axial load on the behavior of beam-to~
1 · (2)co umn connectlons.
During tests on mUlti-story frames at Lehigh
University, it was observed that high column axial load
and shear resulting from beam moments significantly
affect the behavior of beam-to-column connections. (3)
In some instances the diagonal stiffener, which was
used in an exterior connection to resist the shear
caused by a large beam moment, actually yielded before
the plastic moment was reached in the beam. This be-
havior was observed in the lower stories of a frame
where axial load was higher. In a test in which dia-
ganal stiffeners were not used for an exterior connection,
the shear deformation was largest in the connection with
the highest axial load even though the shear force was
the same in all the connections.
As a result of the observations from the frame tests
and because of other unanswered questions about beam-to-
column connections, a project on Beam~to-Column Connections

-2
was initiated at Lehigh University in 1966 by the American
Iron and Steel Institute and the Welding Research Council.
This thesis is based on information obtained and work
done on the research project.
1.1 Background
There are basically two types of beam-To-column
connections. Both are characterized by the intersection
of beam and column elements into a single joint. Interior
and exterior beam-To-column connections form the two basic
types of connections covered in this report (see Figure 1).
Under normal conditions a beam-to-column connection
is subjected' to axial load, moment, and shear from both of
its component elements the beam and the column. Figure 2
shows an explod~d view of an exterior connection subjected
to the most general two-dimensional loading. A simplifica
tion can be made to the force system by noting that the
axial load in the beam is generally low even when the frame
is laterally loaded. The beam moment is also changed into
two concentrated forces acting as a couple through the two
beam flanges. This couple is the major factor in causing
a highly stressed shear condition to occur in the central
web region of the connection (this region will be referred
to as the web panel). lfthe effect of the beam moment is
concentrated in the beam flanges, ~ormal stresses will only
be applied to two of the four sides of the web panel. The

-3
normal stresses result from the column moments and axial
loads. The lower normal stress on the web panel will be
larger than the upper normal stress.
to the shear in the beam.
This effect 'is due
When any of the forces applied to a beam-to-column
connection reach a critical magnitude, the connection may
fail in any of four failure modes. Three of the most
common failure modes for beam-to-column connections are
shown in Figure. 3. Figure 3a shows a compressive type
failure in which the concentrated compressive force from
the beam couple crushes a zone of the column web. A
tension failure, as is shown in Figure 3b, is characterized
by the pUlling out of a column flange due to the concentra-
ted tensile force from the beam couple. The third effect
is that in which a shear displacement occurs. This type
of failure is shown in Figure 3c and can be described as
"shear racking". It is believed that this type of failure
is most sensitive to the action,of axia~ load. Therefore,
a shear failure mode is of prime importance, when the
effect of high axial load is being studied in beam-to-
column connections. Buckling is the fourth possible fail-
ure mode. Howe v e r, a 1m 0 s t a 11 p r act i cal connee t'ion s are
made of thick enough elements that this type of failure
will be neglected in the study to be ,presented. Previous
work has resulted in suggestions for proportions 'adequate
to prevent buckling failures.(l)

-4
1.2 Past Work
Previous work done in the area of beam-to-column
connections has not considered the combined effect of
high axial load and shear resulting from beam moments.
Solutions were developed by Beedle, et ale for the
problem of shear failure of a corner connection neglect
ing the effect of axial load.(~) A slight modification
of this formula is presently being used for the design
of beam-to-column connections of multi-story frames. (1)
The additional problem of instability or localized fail-
ure of a beam-to-column connection was studied by Jensen,
et al.(5) Figure 3 shows the relationships presently
being used and the ,type of failure they are designed to
prevent. The solutions which are presently available
provide a satisfactory prediction of beam-to-column con-
nection behavior with low axial load in the column.
There is very little literature available which
deals with the ultimate strength under the combined shear-
axial load-moment interaction fo~ connections. However,
in Reference 6 a group from the University of Tokyo has
examined in great detail the elastic solution of the
combined shear-axial load-moment interaction for beam-to-
column connections.
Work is currently being conducted at the University
of California at Berkeley on the behavior of beam-to-column
connections subjected to lateral loadings and high axial

loads in the column.
-5
An attempt is being made at California
to solve the connection behavior problem using a finite
element type approach. If this should prove successful,
it could serve as a valuable check to the methods presented
in this report or prove as a valuable aid in developing
more accurate design relationships.
This report makes use of the findings and many of the
results and procedures described in Reference 5.

2. THEORETICAL APPROACH
The theoretical work presented is ,an attempt to
'consider the combiried effects, of shear, axial load~ and
moment on the behavior of be'am-to-co ;.umn connections.
The manner in which this problem was approached. has taken
two paths. As in most plastic analysis approaches, both
an upper and a lo~er bound type solution' should be
performed.
All plastic analysis methods must satisfy three
conditions: 1) fUlly yielded cross-section, 2) equilibrium,
3) failure mechanism. The difference between the upper
and lower bound solutions is in the conditions from which
the bound solution is started.
The lower bound solution is starte~ by assuming a
stress distribution which will not exceed the yield condi-
tion in the element under consideration. The ultimate
load is computed by satisfying equilibrium across the
element. If the lower bound solution so calculated causes
a mechanism condition, the solution is the true solution.
The upper bound solution is started by assuming a
'mechanism 'condition which will cause failure of the element
.under consideration. The ultimate load is computed by
satisfying equilibrium across· the s~ction. If this
- 6 -

-7
ultimate load causes no violation of the yield condition
at any point on the element, the ultimate load is the
true solution.
The results of performing the two solutions outlined
will usually give a range within which the answer must lie.
The upper bound will always give a solution which is equal
to or greater than true answer. The lower bound is always
conservative and will give results lower than or equal to
the true solution. Only when the upper and lower bound
are ~qual can it be certain that the solution found is the
true solution. Therefore, this report will 'attempt to
outline upper and lower bound solutions in an attempt-to
narrow the range between the two bounds and in an attempt
to better understand the true behavior of beam-to-column
connections.
2.1 Lower Bound Approach
In order to help formulate a test prbgram and provide
an insight into the behavior of beam-ta-column connections
subjected to high axial load in the column, a preliminary
lower bound theoretical investigation was attempted .. The
preliminary investigation, has taken the same type approach
as that used to determine th~ interact-ioh of thrust, shear,
and moment in beams.(7,8) This type of solution follows
the lower bound type of solution outlined in the previous
section of this report. Using a lower bound approach, it
is necessary to begin the analysis with a description of

-8
the force distribution applied to the connection. This
is a complex problem for a solution in the elasti.c; or
~lastic range. The ~roble~ is further complicated·by
the. residual stress pattern due to welding in the fabri
cation. process. As a resul t "the 8olu~ion8 develop,·e'd· in'
this study have ~tternpted to formulate an equilibrium
solution for the strength of the connection which, :wi'll
reflect the effect of normal force in' the column 'on the
shear capacity of a c.onnection web panel.
The following is a list of assumptions made in
developing the lower bound solution:
,1. The connection under examination has no shear
stiffening.
2. All shear in the column is distributed uni
formly across its web.
3. All bending moment in the beam is taken by
the beam flanges.
4. Axial load in the beam is neglected.
5. All normal force in the beam flange is trans
mitted directly to the horizontal stiffener.
6. The flanges of the column do not contribute
any "additional strength to the connection by
their, participation in the bending deformation
of the connection.

-9
7. No specific steps have been taken to account
for residual stresses.
8. A connection will fail when its most criti-
cally stressed cross section becomes fully
yielded.
9. The yield surface of the connection is defined
by the von Mises Yield Theory.
10. Strain-hardening is not taken into account.
11. The connection is considered to be made of
an elastic, perfectly plastic material.
2.1.1 Neutral Axis of Column in the Column Flange
The lower bound solution commences by assuming as
general a stress distribution in the beam and column as
is possible. Figures 4 and 5 show the final stress dis-
tribution assumed for sections in both the beam and column.
All stresses are bounded by the full yield stress, QJ. Iny
some cases, such as in the web of the column, shear and
normal stresses must be added together. In such cases
exist.
each stress is controlled by a parameter, k or S' such
that when they are combined a condition of full yield will
It is also necessary to establish a parameter,7o'
which will define the location of the neutral axis within
a given section.
The section through the column is of prime interest,
since it should be the most critical section within the

connection (i.e. the last section to yield).
-10
This is why
a horizontal section through the column at the extreme
top of the connection has been used as the datum for
establishing the lower bound presented in this r'eport
(see section B-B, Figure 4). Figure 5 gives the stress
distributions at this section in the column for the cases
when the column has its neutral axis in its flange and in
its web, respectively.
Figure 4 shows the section cut in the beam at the
face of the column (section A-A). This section is used
only to define the magnitude of the concentrated force
from the beam couple. This force is combined in the column
web as a shear with the shear force already in the column.
The remainder of this section will be used to des
cribe the development of an interaction relationship for
the combined axial load-shear-moment interaction for a
section in the column at the very top of the connection
(see section B-B, Figure 4). The -interaction relation
will express the maximum moment, M, that can be applied
externally to a beam-to-column connection by a column as
a function of axial load in the column, beam moment at
the column face (MB
), geometry of the frame, and dimensions
of the component members. The moment, M, is the column
moment which enters a beam-to-column connection at
section B-B, Figure 4.
-11
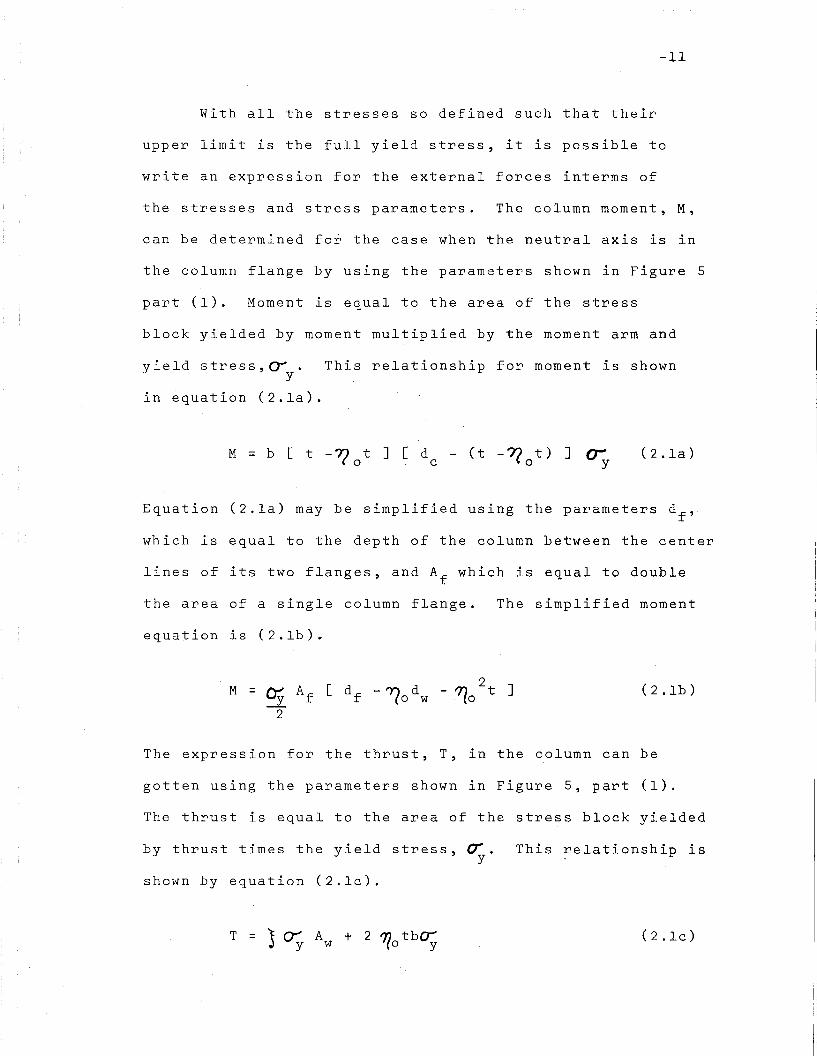
With all the stresses so defined such that their
upper limit is the full yield stress, it is possible to
write an expression for the external forces interms of
the stresses and stress parameters. The column moment, M,
can be determined for the case when the neutral axis is in
the column flange by using the parameters shown in Figure 5
part (1). Moment is equal to the area of the stress
block yielded by moment multiplied by the moment arm and
yield stress,C'. This relationship for moment is showny
in equation (2.1a).
(,2 • la)
Equation (2.1a) may be simplified using the parameters df
,·
which is equal to the depth of the column between the center
lines of its two flanges, and Af
which is equal to double
the area of a'single column flange. The simplified moment
equation is (2.1b)~
(2.1b)
The expression for the thrust, T, in the column can be
gotten using the parameters shown in Figure 5, part (1).
The thrust is equal to the area of the stress block yielded
by thrust times the yield stress, ".y
shown by equation (2.1c).
This ~elationship is
(2.1c)

-12
Remembering that Af
= 2bt and Ty
= (Af
+ Aw
) oy equation
(2.1c) may be rearranged to give equation (2.1d).
(2.1d)
At this stage, the moment M and the thrust Tare
defined in terms of the as yet unknown parameters 170
and J .Conditions for determining these unknown parameters will
be established by considering the shear stress acting
along with the normal stress and by considering the
forces entering the connection as a result of the load-
ing on- the beam and column in a structure.
First the shear stress will be considered. Figures
6a and 7a show longitudinal elements of infinitesimal
length just outside the joint for the beam and column
respectively. Because there is a moment gradient in both
the beam and the column, there are changes 6DB and ~OC in
the bending stresses from one end to the other of each
infinitesimal length of flange. To maintain equilibrium,
the shear force on the element where the web meets the
flange must equal the difference in flange forces at the
ends of the elements.
and 2.2b.
Th is is e xpr e sse din e qua t ions 12. 2a
dxBwB1:B
af (1 ) ~Oi= 2 - m
0
dx Cw"'tC
Af (1 - 7(0) A~=
2
(2.2a)
(2.2b)

-13
The moment diagrams for beam and column is shown in part (b)
of Figures 6 and 7. From these figures it is possible to
obtain !:elations for changes in stress, AcJ, for both beam
and column in terms of member dimensions. Equations (2.2c)
and (2.2d) use the moment gradients to give the expresslons
for changes of stress in the beam and column, respectively.
~OB ~ ( 2.• 2c )=dX B L
~'OC ~ (2.2d)dx C
= Jt
If equation (2.2c) and (2.2d) are substituted into
equations (2.2a) and (2.2b) re~pectively, expressions for
the shear flow in beam and column directly adjacent to the
connection are obtained.
WBl-Ba
f (1 ) fry= 2 - m0 L
wZ'cA
f (1 - "(0) :2..= 2 1
(2. 3a)
(2.3b)
Equation (2.3a) and (2.3b) express th~ shear flow in the
beam and column, respectively.
Figure 8a shows an exterior beam-ta-column connection
subjected to a general external loading condition. A beam
moment, MB , is assumed; all other external forces can be
calculated using statics. The beam shear force, VB' and

-14
column shear force, V , may be obtained from equationsc
(2.3a) and (2.3b), respectively. The beam and column
shear forces are presented in equations (2.4a) and (2.4b).
VB wB'tBd B
af (1 )
trydB (2.4a)= = - m
2 0 L
V w7: dA
f (1 '10)
cryd (2.4b)= = 2 - Tc c c c
By cutting a free body diagram, as shown in Figure 8b,
with a section passed through the connection just below the
upper horizontal stiffener, the web panel shear stress may
be 'calculated. Figure 8b only contain~ the effects of the
shears, all moments and axial loads are in equilibrium and
are removed from the sketch to simplify the presentation.
In order to establish vertical equilibrium, a small axial
load, Ap, must be added to the lower column to balance the
beam shear (i.,e.Ap = VB)' To establish rotational equili-
brium of the free body, moments are taken about the rnid-
point of the external side of the connection, point o.
It is from this rotational equilibrium that the web panel
shear stress, l:, is calculated (see equation 2. 5a) .
dc
2V
c(2.5a)
If equations (2.4a) and (2.4b) are substituted into equation
(2.5a),expression (2.5b) presenting a relationship for· web
panel shear, L, is obtained.

T = 12w
-15
(2.5b)
Because of the presence of shear stress in the web,
the web panel is only able to carry a reduced portion ) of
the full ~ as is expressed in equation (2.6) and shown iny
Figure 5, part (1).
( 2 .6)
Equation (2.5b) and (2.6) are the basic stress expres-
sions for the web panel. These expressions must be combined
using the von Mises Yield condition for a uniaxial plane
st·ress condition as given in equation (2.7)
= 0- 2Y
( 2 .7)
By substituting equations (2.5b) and (2.6) into (2.7) to
obtain equation (2.8), an expression is obtained for S'the percentage of P which can be present along with the
y
given web shear to produce the full yield condition.
= (2 .8)
~quation (2.8) can be solved for ~o' the percentage of the
column flange not yielded by moment.
( 2 • 9 )

..... 16
It should be noted that ~o~l. Therefore, the last term
of equation (2.9) should always be prefaced by a negative
sign.
Equation 2.9 may be substituted into equation (2.1d)
to obtain an expression for thrust, T.
For simplicity m is set equal to zero.o
- 2 V3 •r:-:;:i)0+ --3- wyl-S J (2.10).
This is the case
when the beam flange is fully yielded by moment. Equation
(2.10) is solved for 1. In order to simplify the equations
pres·ented, expression (2.lla) through (2.l1d) will be used.
Both A and ~ are functions of the member sizes of the
connection. The relative member sizes and the frame geo-
metry are reflected in~. Axial load and column size are
reflected by ex..
exA
f [1 +A
f ] T=
A A Tw w y
(3 = ~LA w
A = Ld
w
~ = 1 + ~ A23
(2.1la)
(2.l1b)
(2.11c)
(2.1ld)

If the equations of the (2.11) series are substituted in
equation (2.10) and it is solved for S' the result will
be equati?TI (2.12).
- (et-,I.9)
(2.12 )
Substitution of equation (2.10) into equation (2.7),
remembering that m is zero, gives:o
A
"'10 = 1 - A; (3 2y! i V~ -(d-I3)2(1-i A2 ) + ~)..«(j.-f3)/tP- (d..-{3)2
i
(2.13)
An expression for the 'plastic moment of a wide-flange
section is given in equation (2.14)
(2.14)
The interaction relation for the case when the neutral
axis of the column is in the column flange can be obtained
by substituting expression (2.13) and (2.14) into the
moment expression, (2.1b).
M 2Af [ d f t
I?o 2Jpm= -A- d
w- '70 - d (2.15)
MP w w
1 + 2A
f
[:: JAw

-18
The 1 i mit s 0 fin t era c t ion reI a t ion (2. 1 5) are fro m 0 ~ 710 ~ 1
(i.e. when the neutral axis is in the column flange). The
moment, M ,is the column moment which can be applied topm
an unstiffened connection, with the neutral axis of the
column in its flange, in order to cause "shear racking"
of the connection.
2.1.2 Neutral Axis of Column in the .Column Web
The procedure followed in calculating the moment,
shear, and thrust interaction relation when the column
has its neutral axis in the web is similar to that des-
cribed for the case when the neutral axis is in the column
flange. The difference in the two cases is the starting
stress distributions. For the case under consideration
in this section, the stress block used is shown in part (2)
of Figure 5.
Equilibrium of the stress blocks resulting from bend-
i?g moment and the stress blocks resulting from thrust for
Figure 4 and case 2 of F~gure 5 will give equations (2.16a)
and (2.16b) in the same manner as was done for equations
(2.1b) and (2.1d). In this instance, an additional para-
meter y gives the distance of the neutral axis in theo
web from the centerline of the web.
dY ) (~ + Y )020
(2.l6a)
T = 2y (J w l:a y J (2.l6b)

-19
The shear equation is basically the same as equation
(2.5b) with the exception that in this case ~o" = o.
When '10
= 0 the full column flange takes bending m-oment,
which is the case if the neutral axis is in the column
web.
a (1 - m ) u::A f 0 Y
roe = f rr. -2w;' y 2wL
(2.l6c)
In order to establish the yield condition in the web
panel~ it is necessary to write expressions for the normal
and shear stress, respectively. The normal stress in the
web panel is the result of both moment and axial load as
is shown in Figure 5, part (2). However, the normal stress
is assumed equal to the reduced value Sa; for the entire
width of the web panel as indicated by equation (2.17a).
CT= (2.17a)
The expression for shear in the web panel can be gotten from
equation (2.16c) and is restated as equation (2.17b).
7:=ay2W (2.17b)
The normal and shear stresses are combined" to establish the
yield condition in the web panel. Von Mises Yield Condition
is used for the yield criterion. Using equations (2.17a),
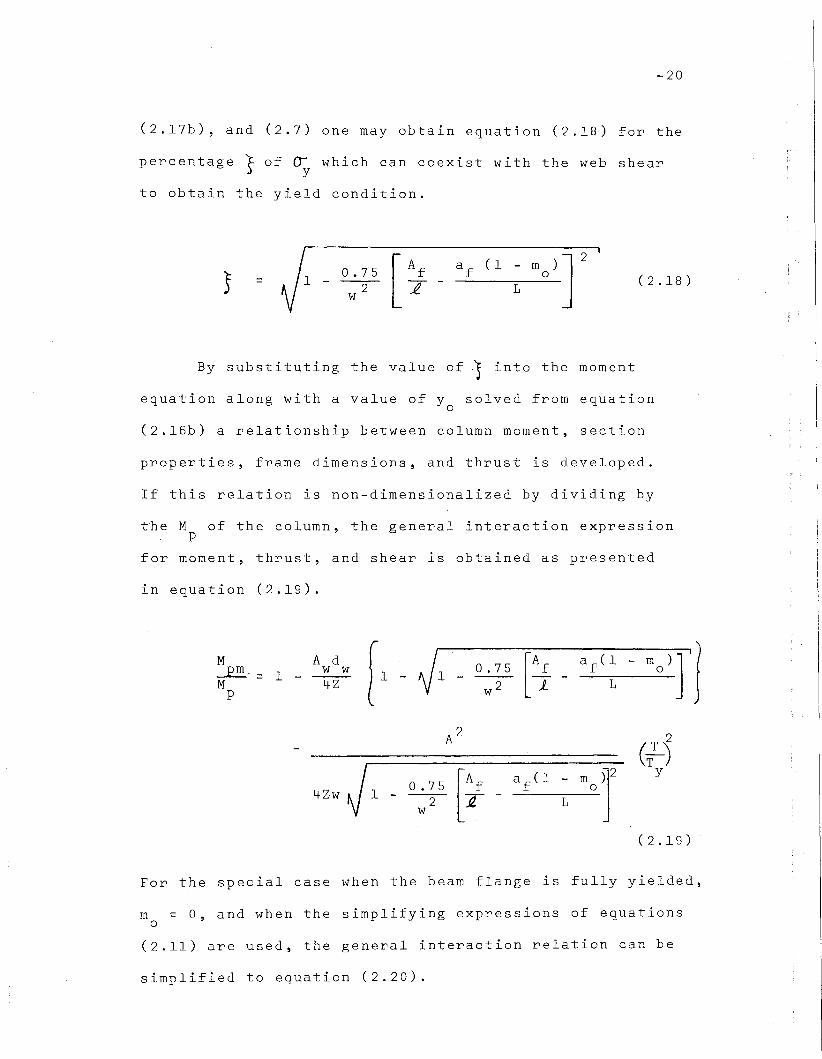
-20
(2.17b), and (2.7) one may obtain equation (2.18) for the
percentage ~ of a; which can coexist with the web shear
to obtain the yield condition.
= (2.18)
By substituting the value of·1 into the moment
equation along with a value of y solved from equationo
(2.16b) a relationship between column moment, section
properties, frame dimensions, and thrust is developed.
If this relation is non-dimensionalized by dividing by
tbe M of the column, the general interaction expressionp
for moment, thrust, and shear i~ obtained as presented
in equation (2.19).
MAdMPm
= 1 - :zwp
1 -a .75
- ---w2
a (1 f
L
A2
CTT
)
Jl [~fa (1 - moT
y
4Zwo .75 f
- --2- Lw
(2.19)
For the special case when the beam flange is fully yielded,
m = 0, and when the simplifying expressions of equationsa
(2.11) are used, the general interaction relation can be
simplified to equation (2.20).

-21
[1- Vl - [A f - fiAwJ 2J-
A2 [i J2 ( 2 .20 )M A dpm
1 - w w 0.75 y= 4.Zw
2i.
2M4ZWJ1-O.75
2 •P [A f - AwJ
w212
dThe limits of interaction relation (2.20) are from O~Yo1f: 2w
(i.e. when the neutral axis of the column is in its web).
It should be noted that equations (2.l6c) and (2.18)
correspond to the similar equations (2.5b), and (2.8), which
were developed for the' case when the neutral axis of the
column is in its flange, if 10 is substituted into the
later group of equations~
The interaction curve for a beam-to-column connection
is composed of the two solutions just outlined (see
Figure 9). At low axial loads, the neutral axis of the
column cross-section is within its web. The parabolically
shaped curve of Figure 9 corresponds to the case of the
neutral axis in the column web. As axial load is increased,
the neutral axis shifts out of the column web into the col-
umn flange; this corresponds to the almost straight line
curve of Figure 9. The two curves should become tangent
at the point where the neutral axis shifts from the web
to the flange. The curves presented in this report show
a slight displacement with respect to each other. It is
suspected that this discrepancy is due to the fact that
the flanges are really tapered rather than rectangular
and each section has fillets at the flanges.

-22
Figure 9 is an interaction curve for a beam-to
column connection made of a 6WF25 column and l2B16.5 beam.
The dimensions of the connection subassemblage can be
varied and for all practical lengths the interaction
curves will be essentially constant and equal to that of
Figure 9. The curve shown is one of a family of curves.
As the beam moment is changed (i.e. different m values),a
the curves change. However, the family of curves is very
similar to the single interaction curve presented.
Figure 9 considers the case of a full plastic moment in
the beam.
Figure 9 also shows points which represent the ulti
mate loads reached by certa~n gaged bonn~ctions from the
braced multi-story frame tests conducted at Lehigh
University and ~escribed in reference (3). The failure
criterion was qualitative. A connection was considered
to have failed if large diagonal displacements occurred
at the highest load recorded. It should be noted that
the interaction curve is in the transition region between
the failed and unfailed connections.
If the various component members of a beam-to-column
connection are varied, the scatter band for different rela
tive member sizes is small (see Figure 10). In figure
10 interaction curves for a representative light and a
heavy connection are plotted. A connection may be
designated as light or heavy depending upon the column

size.
~23
It can be noticed from this figure that light con-
nections offer greater relative strength at low thrust.
However, as thrust increases the interaction curves for
light and heavy connections qonverge, until at about 0.6
PIP they coincide.y
Tables I through 6 present values for the lower bound
interaction solution just presented for some selected beam-
to-column connections. The connections were selected to
illustrate the effect of member geometry, frame dimensions,
and beam moment on the beam-to-column interaction curve.
The tables are set up for a given member size, frame geo-
metry, and beam moment (i.e. m ).o
There are two column
moment ratios, M/M , given for each axial load ratio, PIP .•P Y
The first M/M ratio is for the case of the neutral axisp
of the column in its flange. The second column moment
ratio is for the case when the neutral axis of the column
is in its web. If for a given table the lower of the
moment ratios for each axial load is plotted against the
axial load ratio,a beam-to-column interaction curve is
obtained. Also presented in the tables is the parameter
shown in Figure 5 as S. Xi is the pe~cent of <r in they
column web which when combined with L will give a fully
yielde.d condition in the web panel.
Tables I to 3 show the effect of the size of the beam
moment (Table 1, m = 0, Table 2, m = 0.5, and Table 3,o 0
m = 1.00).o
If Table 1, 2, and 5 are compared, one may

-24
determine the effect of frame dimensions on the interaction
curve for a given connection. By the comparison of Table 1
and 6, one may determine the effect of relative member size
upon a given frame connection geometry.
If the comparisons described above are made, it can be
noted that all the tabulated results would generate inter
action curves which would be very similar (i.e. within 5 to
10 percent of each other). since the results have been non-
dimensionalized, it_may be anticipated that a simple, workable
design formula may be d~veloped for beam-To-column connections
by taking advantage of the similarity in the results.
2 . 2 . Upper Bound Approach
The upper bound approach to analysis of a beam-to
column connection was formulated in order to provide a
check for the previously described lower bound and to pro
vide a more realistic approach to' the problem (i.e. in
developing an interaction relationship for an actual fail
ure mechanism as observed from a tested specimen). An upper
bound approach could easily be modified to consider the
effects of any type of connection stiffening.
The upper bound approach used here is an energy
approach. A connection is given a displacement which
will cause a mechanism condition to exist within the
connection. Using this displacement, the internal and
external work expressions are calculated. The following

-25
is a list of assumptions made in this energy formulation:
1. The connection is considered to be made of
an elastic perfectly plastic material.
2. The yield surface of the connection is defined
by the von Mises Yield Theory.
3. The material is not considered to strain-
harden.
4. The connection is analyzed as a plane strain
case.
5. The axial load in the beam is neglected.
Equilibrium of the connection is established by equating
internal and external work. In order to obtain the best
upp~~ bound approach it is necessary to minimize the
total energy expression with respect to a moment for a
given thrust .. This procedure should then give the lowest
upper bound answer for a given displacement mode.
The upper bound. procedure just described may be
illustrated for an exterior beam-to-column connection
neglecting the effect of axial load.. -
Consider an exterior
connection which is deformed causing a shear displacement.rate, <5, (see Figure 11). The shear displacement is a
lateral displacement of one edge of the connection with
respect to the other edge.
called shear racking.
This displacement will be

-26
Four discrete yielding points in the column flanges
at the four corners of the connection are .shown in Figure 11.
A detailed view of the flange yield concentration is shown
as an inset. This yield concentration is the major dif-
ference between the solution presently recommended for
h 1 · d· f b ' · (1) dt e p astlc eSlgn 0 eam-to-column connectlons an
the solution outlined in this report. The relation pre-
sently used to predict shear failure of a connection was
developed originally for a portal frame. In portal frames
the members adjacent to the connection usually are sub-
jected to a moment in the range of a full plastic moment.
Therefore, the beam flanges would be fully yielded and
offer no stiffness to the web panel. However, in a multi-
story frame with large axial loads in the columns, less
of the overall column strength is being taken by the bend-
ing moment. Therefore, the column flange will offer some
additional stiffenes8 to resist column bending.
To calculate the bound solution for a mechanism suqh
as those shown in Figures 11 or 12, it is necessary to
have some expressions.to compute the internal and external
work done by the assumed mechanism as it goes through a
given displacement.
Computation of the exte~nal work done by mechanism
motion is the most direct and easiest to visualize. The
external work, WE' is equal to the algebraic sum ·of all
external forces times their respective displacements in
the direction of the forces.

.... 27
The expression for internal wO'rk done by a mechanism
motion is more complex and difficult to visualize.
However, if certain basic theorems of the theory of plas-
ticity and tensor notation ar,e used, simple expressions
for the internal energy dissipated may be developed.
Before any energy dissipation will be expressed, certain
plasticity concepts should be realized. The energy dis-
sipated by an element will be expressed as a function of
the strains,~.. , in the element. The subscripts i and1J
j vary from 1 to 3. These 'strains may be directly related
to the displacement to which the given element is sub-
jected. The strains, £ .. , in an element may be broken1J
e fdown into elastic strains,~.. , and plastic strains,~.. ,
1J 1J
as is shown in Equation (2.21).
,. = e p~ •• ~ •• +E:. ••1J 1J 1J
(2.21)
Since elastic strains are determined uniquely by stress,
there is no change in stress and correspondingly no
eelastic change in strain at the limit load (i.e. ~ .. =
1J
constant,at the limit load). If the first partial deri-
vative of equation (2.21) is taken with respect to time,
Equation (2.22) is
•an expression for strain rate, E .. ,
J.Je • eE .. is a constant, e: .. equals zero.1J 1J
in an equation for the strain rate.
is obtained. Since
•E .. =
1J
d (E.. · )1J _d t -
• pE. · ·1J
(2.22)

Since an expression for strain rate ~ is much simpler'-i j
than an expression for strain, £ .. , at ultimate load, the1J
internal energy will be expressed as a function of a
strain rate. By definition, the energy dissipation per
unit v,olume of the given element will be expressed as D.
D will then be expressed as a function of strain rate
• .p(i . e . D (E: •. ) - D(E .. )).
1J 1J
Figures 11 and 12 show all displacements as displace-
ment rates. This procedure makes the calculation of the
unit energy dissipation, D(~~.), possible by calculating. 1J
• Pthe plastic strain rates, € .• , directly from the displace
1J
ment rates assumed (i.e. ~ in Figure 11).
If the von Mises Yield Criterion is assumed to govern
yielding, an expression for the unit internal energy dis-
sipation can be derived using tensor manipulation and
various properties of the strain tensor. The resulting
unit internal work expression is given as equation (2.23).
• PD (E .. )
1.J = k ~2. 0(2.23)
A complete derivation of equation (2.23) is given in
Chapter 8 of reference 10. The quantity k , is ano
invariant of the stress tensor.
If for the case of plane strain, two normal principal
strains ~l and c2
are given, it can be proved that there

is no volume change during plastic deformation.
-29
Therefore,
Using this fact and substituting E~ and Ef2 into equation
(2.33) one obtains equation (2.24).
D(€.P. )1J
(2.24)
From a Mohr's Circle of strains it-can be proved that the
absolute value of the maximum shear strain rate is twice
the absolute value of the maximum normal strain rate.
Therefore, equation (2.25) relating unit ener~y dissipation
to shear strain rate may be directly obtained from this
relationship and equation (2.24) .
( • p) =D E. ..1J
•(2.25)
Equations (2.24) and (2.25) are the basic relations used
to calculate the internal energy dissipation per unit
volume of a structural element strained inelastically by

normal strains and shear strains, respectively.
.... 30
To obtain
the total internal work of an element, WI' the unit energy
• pdissipation, D(E .. ), must be multiplied by the volume of
lJ
the element.
With equations (2.24) and (2.25) in mind, it is now
possible to attempt an upper bound solution for a beam-
to-column mechanism such as is shown in Figure 11. When
the joint is subjected to a displacement rate, 6" , the
web of the column is subjected to a shear strain rate. .~ =6/d
Bwhich deforms a volume wdwd
B, Four stations on
the flanges at the corners of the web panel are bent in
pie-shape sectors through normal strain rates averaging
•E
1= 1.0. The volumes of the deformed' material for the
2·four sectors total 2bt cf Id
B, Substituting the strain
rates into equation (2.25) and (2.24) and mUltiplying
each energy term by the volume affected gives equation
(2.26) for the total internal energy due to the shear
racking shown in Figure 11.
= k 6"o
( 2 • 2.6 )
The first term in the brackets of equation (2.26)
is the additional strength of the connection contributed
by the yielding concentrations in the column flange. If
the quantities which make up this additional strength
term are noted, one may observe that this additional

-31
strength is directly proportional to the area of a single
column flange, tb, and the column flange thickness, t,
and inversely proportional to the depth of the beam, dB'
The constant k is an invariant of the stress tensor ando
is defined by the von Mises Yield Condition to equal the
shear yield stress as shown by equation (2.27).
k =o(2.27)
Th.e calculation of the external work done by the
forces shown in Figure 11 is given in equation (2.28).
The external work, WE' is equal to the sum of all exter
nal forces times their respective displacement rates
(i.e. in Figure 11, the shear force V has a displacement
rate ~ opposite in sense ~o its own direction and the.moment M
Bhas a rotation rate &/d
B,)
= (2.28)
Equating the internal and external energy expressions,
assuming the columns are bent in symmetric double curva-
ture and the beam moment is distributed equally to the
upper and lower column at a connection, will yield
equation (2.29).
M =[
Wd + 4t2bJW dB
[d~ - 2~](2.29)

.... 32
It is important to note that this expression is the same
as the relation presently used in the plastic design of
connections for mUlti-story frames with the exception of
4t2
bthe column flange bending term, --d--- If expression
B(2.29). were plotted on an interaction curve with moment
and axial load the variables, it would be a straight line
of zero slope.
In order to include axial load in the upper bound
solution another independent displacement mode must be
used which includes the thrust in at least one of its work
expressions.
Figure 12.
An axial load failure mode is shown in
Equations (2.30) and (2.31) give the internal
and external work, respectively, for the axial shortening
mode of Figure 12. Equation (2.30) is gotten by applying
This rate and a deformed
equation (2.24) to the displacement mode of Figure 12.
The rate £1 averages to P/dB
•
volume of AdB
results in an internal energy rate given by
equation (2.30).
( 2 .30 )
Since the only work done by the external forces of the
axial displacement mode of Figure 12 is done by the axial
loads, they must be determined as accurately as possible.
The lower column axial load contains the upper column
thrust, P, and the beam shear, S .
-33
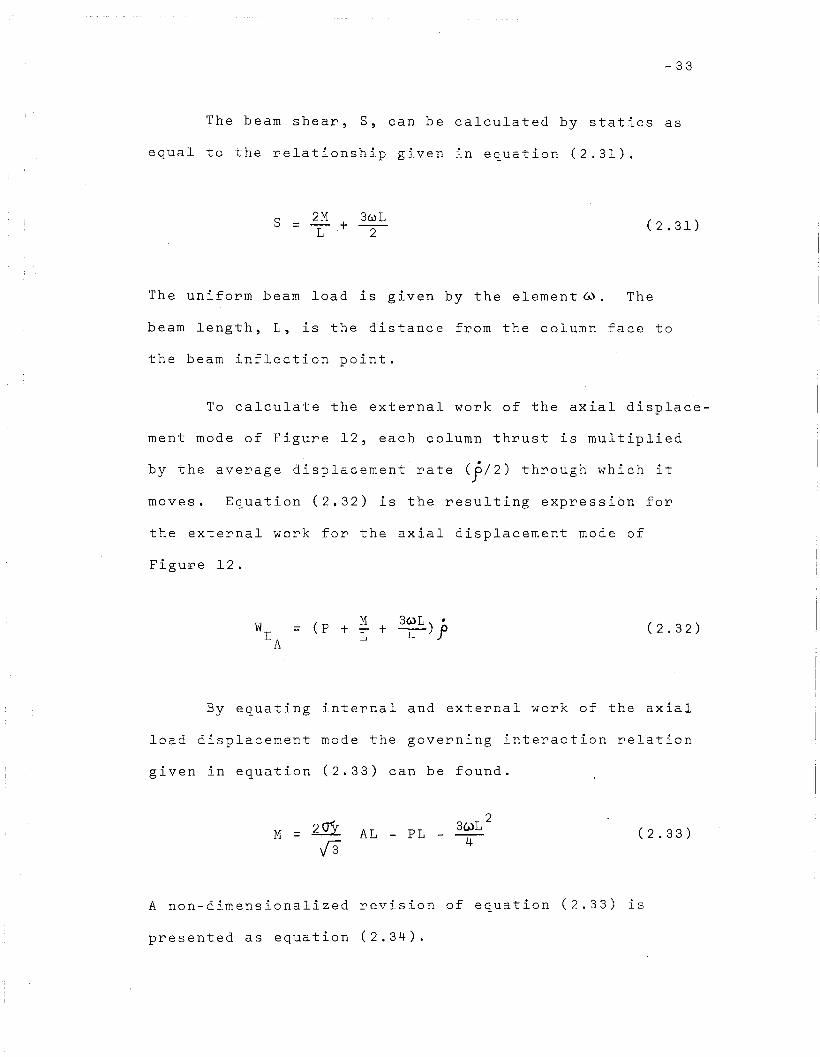
The beam shear, S, can be calculated by statics as
equal to the relationship given in equation (2.31).
s = 2M 36)LL + 2 ( 2 . 31)
The uniform beam load is given by the element (L) .- The
beam length, L, is the distance from the column face to
the beam inflection point.
To calculate the external work of the axial displace-
ment mode of Figure 12, each column thrust is multiplied
by the average displacement rate <f/2) through which it
moves. Equation (2.32) is the resulting expression for
the external work for the axial displacement mode of
Figure 12.
M 36)L·= (p + L + --4--)f (2.32)
By equating internal and external work of the axial
load displacement mode the governing interaction relation
given-in equation (2.33) can be found.
M = 2crY
133~L2
AL - PL - -4- (2.33)
A non-dimensionalized revision of equation (2.33) is
presented as equation (2.34).

MM
P= AL
Z
.... 34
(2.34)
It should be recalled that A and Z are the area and
plastic modulus, respectively, of the column, with L
equal to the distance from the inflection point of the
beam to the column face.
By adding the work expressions developed for the two
independent displacement modes, it is possible to obtain
a total work expression which considers both shear defor-
mations and axial shortening. Equation (2.35) has been
derived in such a manner.
ko 1"~ [4~:b + Wd w] + 2Af 1= 2M;r [d~ - 2~ J+ t + [~L + pJy
Dividing equation (2.36) by j' and letting ,I{ = fld'.
(2.35)
Using equation (2.27), equation (2.36) is solved for the
ultimate moment in one column, M.
M =(2.37)

-35
Equation (2.37) is the general upper bound· solution for
an exterior beam-to-column connection. In order to obtain
the lowest upper bound~ it is necessary to optimize the
column moment in equation (2.37) with respect to~ for a
given thrust, P.
If equation (2.37) is non-'dimensionalized by divid-
ing by the M of the column, equation (2.38) is obtained.p
MM
P=
6Z (2.38)
Attempts have been made to optimize equation (2.38).
'However, all attempts thus far have been unsuccessful. It
is possible that the quantity M/M is not a minimum withp
respect to any of the displacement modes used to calculate
equation (2.38). Therefore, equation (2.38) shoUld be
used as an indicator of the important parameters and how
they affect beam-to-column connection behavior problems.

3. TEST PROGRAM
The remainder of this paper is the presentation of
a preliminary experimental study of welded beam-to
column connections. The final objective of the test
series was a better understanding of the shear, axial
load, moment interaction in a beam-To-column connection
which is loaded beyond first yield.
3.1 Connection Subassemh1age
The connection subassemblages tested in this series
were exterior connections of a frame as is shown in
Figure 14. The test specimens were all cut from the
frames of Fritz Laboratory Project 273, Plastic Design
of Multi-Story Frames. Seven connection 8ubassemblages
were s~ved. Figure I3A and 13B show the connection sub
assemblage test setups. The connection subassemblages
will be classified here according to the stiffening treat
ment of the shear panel in the column web. Some of the
connections had no web stiffening and some had diagonal
stiffening. Figure 14 shows the types of connections
tested along with their identifying test number.
Specimens with diagonal stiffening were tested in
such a manner that the web stiffening was subjected to
either tension or compression. Two of the five diagon
ally stiffened connections were tested with the stiffener
- 36 -

-37
acting in tension. Three tests on subassemblages with
tension diagonal stiffeners were chosen in order that
the third test, 333.A7, could be used as a supplement to
an earlier tension diagonal test, 333.A4, in which some
data may have been subjected to an instrumental error
which could not be traced to its source.
Two of the diagonally stiffened test subassemblages
were tested using columns with pinned ends. This type
of setup forced the connection to be subjected to the
most critical shear, moment, and thrust interactioncondi
tion. However, it made ths subassemblag~ so flexible
that the failure mode was forced outside the connection
at a relatively low external load. Since all of the dia
gonally stiffened connections were overdesigned (i.e.
stronger than the members they join), the connections
never reached a condition near their ultimate strength.
Therefore, the remaining diagonally stiffened subassem-
blages were tested with columns having fixed ends. This
increased the subassemblage stiffness, which allowed a
higher external load to be applied. The stiffening of
the connection was then subjected to h~gher loads, which
were closer to the ultimate condition, while the connec
tion was less critically stressed with the combined shear,
moment, and axial-load interaction.
The diagonally stiffened 8ubassemblages all were
the same size. The columns were 8 feet 4 inches in height

(base to base).
~38
The beams were about 2 feet 6 inches long
and were loaded vertically 2 feet from the inside column
face. This simulated a beam-to-column connection for a
multi-story frame in the inverted position. The sub-
assemblage dimensions simulate the dimensions of a frame
with columns spaced every 12 feet and a story height of
8 feet 4 inches. The dimensions of the 8ubassemblage
were chosen in order to prevent instability in any of
its members. Columns were made from either a 6WF20
(L/r = 66.6) or a 6WF25 (L/r = 65.8) depending upony y
the portion of the original frame from which they were
taken. All beams ,were made from l2B16.5 (L/r = 32)Y
sections.
The remaining two subassemblages contain' unstiffened
connections. However, due to salvage operations on the
multi-story frame from which they were obtained, the
columns of these subassemblages were very short. Both
unstiffened 8ubassemblages were tested·with the columns
having fixed ends. Both specimens of the unstiffened
group were of the same size. The columns were 5 feet in
height (base to ba~e). The beams were about 2 feet 6 inches
long and were loaded vertically 2 feet from the inside
column face. The columns were made of a 6WF25 (L/r = 40)Y
and beams of a l2B16.5 (L/r = 32).Y
ASTM - A36 steel was
used in all members of the seven tests.

-39
The unstiffened test specimens were tested to deter
mine the force description in a web panel of a" connection
as yielding progressed throughout the section. These un
stiffened test specimens also, supplied valuable test data
which eouid be used to determine if the present plastic
design connection criterion can be applied not only to
connections of low axial load values but to those with
relatively high values of thrust in the column.
The unstiffened connections were loaded in such a
manner that the present plastic design method would predict
that a shear failure would not occur in the connection web
panel. However, theory indicates that the combined effect
of high axial load and high shear will reduce the carrying.
capacity of such a connection under high axial load.
The genenal purpose of the test series presented is
three fold:
1. To help determine the stress distribution on
a connection web panel loaded into the
plastic range.
2. To determine the effect of various types of
web stiffening on both the str~ngth and stress
distribution of a connection.
3. To determine if the method presently used in
plastic-design for designing beam-to-column
connections can be applied to cases of high
axial load and beam moment.

-40
3.2 Test Setup
The test setups used are shown in Figure 13. Column
loads were applied by an 800 kip screw-type universal
testing machine with a poise-and-lever-type weighing
system'.
Two types of end connections for the columns had
been considered. Both pinned and fixed-end columns were
studied. The most desirable end condition would be pinned,
because thi's simulates the actual behavior of a column in
a real frame. However, due to the high axial load and end
shear in the column a very large pin is'required. The cost
of a machined end fixture which would supply the required
pin action was considered to be excessive for the pilot
tests.
Fixing the column end against rotation can be
accomplished by a much simpler test setup. End fixity
is d eve lop e d by b 0 1 t i ng the 'c 0 1 umn bas e pIa te s .d ir e c t ly
to the load applicator .. A setup of this type no longer
simulates usual column behavior in a frame, because the
shear force resulting from the column bending causes too
great a reduction in the shear entering the connection
from the beam flange. However, for tests whose principal
goal is to determine the behavior of a connection under
a given set of force boundary conditions, a fixed end
condition for the columns would be satisfactory.

-41
As was discussed in the previous section, five of
the test specimens were tested with the column ends in a
fixed condition. This was because either the columns were
very short or higher loads were desired in the stiffeners
of a connection. The remaining specimens were tested in
a manner which more closely simulates frame action. The
action was simulated by inserting pins at the top and
bottom of the specimen column. The pins would correspond
to the inflection points in the columns above and below a
floor level of an actual structure. In order to obtain a
inexpensive pin-end condition; use was made of the 2,000
kip capacity column pin-end fixtures available at Fritz
( 9 )Laboratory.
Columns of the subassemblage were welded to reusable
base plates. The base plates were bolted to the fixture
plate of the 2,000 kip capacity column end fixtures. A
slight modification was made to the column end fixture
described by Huber in Reference 9. A shear plate was
designed which could be bolted to the fixed base of the
fixture. The shear plate provided significant horizontal
restraint to the column and still allowed pin-end rotation.
The shear plate had a hole in it large enough to pass a
1 inch diameter bolt through it. The bolt was bolted to
the rotating pin, sandwiching the shear plate' between the
pin and the bolt head. Two shear plates were used on
each end fixture (see Figure 15),' which converted the
fixtures from a roller resisting only vertical motion to

-42
a pin resisting vertical and horizontal motion, but
still allowing rotation.
Beam loads were manually applied to a point on
the beam 2 feet from the column face, using'a 35 ton
mechanical jack. The beam loads were measured using
a calibrated aluminum dynamometer placed under the
jack.
3.3 Instrumentation
Each connection was instrumented with electrical
strain gages at selected locations on the column flanges,
stiffeners, and web panel (see Figure 16). The gages on
the web panel were rosettes. These gages indicated quan
titatively the stress distribution around the connection
in the elastic range. A preliminary study on a gaged
beam-to-column connection has indicated ~hat it is possi
ble to get strain readings from relatively inexpensive
gages well into the plasti~ range .. Despite the fact that
gage readings were obtained in the plastic range, it is
doubtful that any more than a qualitative value should be
placed on the high strains due to the localized effect
of a y i e I d 1 i n epa s sing t h r 0 ugh a gag e o':b the c han g e i n
gage resistance at such a high strain. However, using a
pldt of strain versus load and knowing the yield strain
of the material in question, it is certainly· possible to

-43
obtain a very good idea of the manner in which a connec
tion progresses from the elastic range toward failure.
The beam and columns of each test were instrumented
with electrical strain gages, as is shown in Figure 16,
in such a manner that moments and axial loads could be
calculated for each load increment.
Attached to all connections were rotation gages
which gave the relative rotation of the top and bottom
columns with respect to each other and the relative
rotation of the beam with respect to the column. Figure 17
shows in detail how the rotation gage was mounted on the
web of the connection. The gage was clamped to rods which
were spot welded to the member web a short distance from
the joint. The rotation gage was made of a series of
clamped rods whose relative movements were measured by
dial gages. The rotation gage was modified in tests 333.A4,
333.AS, and 333~A6. In ~he modified system, the rigid rods
were replaced by five wires stretched between the rods
which were spot welded to the web and the measuring gage.
The basic principal of the modified gage is the same as
that shown in Figure 17. Its advantage was that it was
easy to assemble and easy. to adjust when ~he gages had
to be reset. Comparable results were gotten using both
systems.
Deformations were measured along both the tension
and compression diagonal of each connection. In tests

-44
A2, A3, and A6 a modified Whittemore type gage was used
for the measurements. However, data taken with this
instrument had a wide scatter band. Therefo~e, in the
re~aining tests one Ames Dial Gage was anchored at one
end of, each diagonal of the connection. A wire was
anchored at the other end of the diagonal. The wire was
stretched taut and fastened to the dial gage. This pro-
vides an accurate measuring system which will give dia
gonal deformations with a very narrow scatt~r band.
Also checked, in test 333.A2, were out-of-plane
web movements. These measurements were taken to deter-
mine if web buckling was significant and should be con
sidered when the ultimate strength of a connection is
calculated. It was found that for the seven tests COTI-
ducted, out-of-plane web movement was insignificant and
therefore, not an important factor in the ultimate strength
of. the connections tested.
Rotations of the beam and .column ends were mea~
sured using 20 inch level bars. These measurements gave
an absolute value for all end rotations. The pedestal
was also gaged in order to determine its absolute rotation.
Beam deflection was measured using a ,mechanical dial
gage which was fixed to the base of the testing machine
at one end and the beam on the other end. This measure
ment served as a criterion measurement by which it was

-45
possible to determine if the connection was in an equili
brium state in the plas~ic range. This measurement was
chosen to be the criterion measurement because it was
the most direct deformation reading obtainable and re
flected the entire behavior of the subassemblage.
3.4 Testing Procedure
Figures 13A and 13B show a subassemblage ready to
test. Testing was begun by aligning the subassemblage
column until strain gages on the top and bottom column,
located at the four corners of the column read within
about 10% of each other at a given cross section during
the application of a modest thrust on the column. When
the column-was aligned a zero datum set of readings was
takeIl.
The actual subassemblage test was begun by incre
mentally building up the column axial load to the pre~
determined axial load for the test. Beam load was then
applied incrementally using a mechanical jack and cali
brated dynamometer. After an incremental beam load had
been applied, the column load was finely adjusted back
to the desired axial load for the test. The beam deflec
tion was now observed and when it became steady all gages
were read. This procedure was ,repeated for each beam
load increment.

-46
Each subassemblage was tested in the same manner.
The only variable (with the exception of stiffening)
was the magnitude of the column working load. Table 7
gives a summary of the loads for the test series.

4. TEST RESULTS
This section of the report is a summa~y of the
results found from the pilot tests described in the
previous section. Since the test specimens were de
signed to remain elastic in a f~ame and not to be
tested as connections, the test results should only
be considered as a guide as to the actual behavior of
similar beam-to-column connections subjected to high
column axial load.
4.1 Subassemblage Behavior
Beam jacking load, V, was plotted versus the beam
end deflection,~, giving a general overall deformation
pattern for each subassemb1age. Figures 18 and 19 show
the load-deflection curves of all the tests conducted.
These curves ar~ characterized by an initial straight
line elastic region followed by a curving transition
zone which changes to a gently sloping curve which
eventually will be terminated by a local failure. In
none of the tests conducted in this pilot study were
the tests terminated due to a local failure in any of
the connections. All tests were terminated due to a
local failure in either the beam or column of the test
subassemblage. Whenever yielding occurred in the con-
nection, the stresses were shifted to the beam or
column to such an extent that when the actual ultimate
.:... 47 -

-48
load of the subassemblage was achieved, it was the
result of a local failure outside the connection zone.
The most typical type of failure in the subassem-
blages with 6WF20 columns was a local buckle in the com-
pression flange of the upper column just above the con-
nection (see Figure 20a). This portion of the flange
was the most highly stressed region of the upper column.
The upper column receiv'ed the beam shear as axial load
causing it to be the most highly stressed of the two
columns. The local buckle in the column was always pre-
ceeded by the formation of plastic hinges in both the
upper and lower column just above and below the con-
nection, respectively.
noticed at these hinges.
Extremely large rotations were
The rotations were high enough
A column
to put tension in the column's tension flange when the
column had a piP of as high as 80 percent.y
plastic hinge never progressed through the entire cross
section in any of the tests conducted. This was due to
the fact that a local buckle occurred in the column com-
pressive flange before the full hinge could form. It
should be noted that the local buckle was only noticed
in the 6WF20 columns (bit = 16.4).
The heavier 6WF25 columns (bit = 13.3) did not show
any signs of a local buckle in either column. This is
due to the smaller bit ratio of the 6WF25 column as com-
pared to a 6WF20 column. The most typical failure mode

-49
in the heavier column (6WF25) subassemblages was one in
which a localized failure occurred in- the beam. There
were three of the 6WF25 column subassemblages tested.
Of these three specimens, two failed with a local buckle
in the beam flange (one of these two tests had a tension
beam flange weld failure at the column face, which pre
cipitated the local buckle in the beam compression flange).
The third test was terminated because it was considered
unsafe to continue the test due to the fact that the high
angle of deformation of the beam might cause the mechani
cal jack and the pin, through which load was applied, to
slip. Figure 20b shows a test which has its ultimate
strength limited by a local buckle in the beam flange.
It should be noted that in all tests where a local fail
ure occurred in the beam, at least some portion of a
plastic hinge had formed in the beam.
Table 8 gives a summary of the failure modes and
ultimate loads for all tests conducted. Also given in
the table is the beam shear which will cause a plastic
moment and a reduced plastic moment in the beam and
column, respectively ..
If Figure 18 is examined, one may observe ~hat the
two tinstiffened test 8ubassemblages behave similarly in
the elastic range up to a point where the subassemblage
~ith the higher stressed column begins to deflect at a
higher rate. This is due to the earlier formation of

column hinges in the higher stressed column.
-50
However, as
beam load increases the load-deflection curves tend to
become asymptotic at the ultimate load. This is caused
by the nature of the failure which causes the ultimate
load. In both cases the ultimate load is the result of
a local beam failure. The beam· failure load is independ-
ent of the axial load in the column. However, these two
curves will never become equal because the column with the
higher axial load goes through a greater hinge rotation
causing more beam rotation. As a result of the additional
beam rotation a slightly lower beam load is required to
cause a local beam failure.
Figures 19 and 21 give a comparison of the load
deflection curves for diagonally stiffened test specimens.
Since all of the ultimate failures in this group of tests
were the result of a local buckle in th~ column flange,
the ultimate load of each specimen is independent of the
direction of the diagonal stiffening. This is shown by
Figure 21. Figure 19 shows that the ultimate load for
this group of tests is indirectly proportional to the
axial load or in some manner related to the reduced plastic
moment of the column.
If only the overall subassemb1age behavior is
examined, one may conclude that all specimens tested
performed satisfactorily (i.e. all failures occurred in
regions outside the connection zone).

-51
4.2 Conuection Behavior
Connection behavior may be observed by plotting
beam load, V, versus the diagonal deformation of the
connection. Figure 22 shows a photograph and a sketch
of the system used to measure the diagonal deformations.
This is the most localized and direct measurement found
which could give an indication when shear racking occurs
in the connection. The shear racking load is defined in
this report as the load at which the beam load-diagonal
deflection curve becomes nearly horizontal.
Figures 23 to' 26 are the beam load-diagonal defor-
mation curves for the pilot tests conducted. The curves
are characterized by an initial straight line elastic
region followed by a transition zone in which the con-
nection changes from elastic to plastic behavior. In most
tests, the diagonal deformations reach a plastic or s~ear
racking state in which the curve becomes horizontal.
Figur'8 23 is a beam load-diagonal deformation curve
for test 333.A2, an unstiffened connection subjected to
an axial load of pIp = 0.8. The curve has both they
tension and compression diagonal deformation curves super-
imposed upon each other. The abscissa of this figure is
positive for the tension diagonal and negative for the
compression diagonal. As was described in Chapter 2 of
,this report, the diagonal deformations were measured in
the first four tests with a modified Whittemore type

gage.
~52
This type gage gave a wide scatter band of results,
with the general trend being shown in Figure 23. The
initial regions of the two curves shown in this figure
tend to be a straight line elastic loading curve. Both
curves· begin to decrease slope at about the 19 kip ordinate,
this is an indication of initial shear racking or initial
plastic deformation of the connection. It should be noted
that an unstiffened connection shows about 30 percent
greater deformation along the compression diagonal than
the tension diagonal. If in Figure 23 the transition zones
(i.e. V = 19 ·K and greater) of both diagonals are compared~
the compression diagonal curve seems to flatten out much
faster than the tension diagonal. This evidence tends to
indicate that yielding tends to progress along the com-
pressive diagonal of an unstiffened conn~ction before it
spreads to the tension diagonal.
Figure 24 gives a comparison of the compressive dia-
ganal deformations for two subassemblages tested which con-
tain diagonal stiffeners acting in compression. For both
tests of Figure 24 the tension diagonal deformation is not
shown but the trend is similar to Figure 23. In all tests
performed the compressive diagonal deformation recorded
was greater than the tension diagonal deformation. Figure 24
compares the deformations of two identically stiffened con-
nections subjected to different axial loads (p = o.&P andy
The lower of the two curves presented shows ap = O.8F ).Y
great increase in ductility over the upper curve which was

subjected to a 20 percent lower axial load.
- 53
This indi-
cates that, even for an "overdesigned" connection, much
more shear deformation occurs for connections subjected
to very high axial loads in the column.
Figure 25 is a comparison of the diagonal deforma
tions of two identical subassemblages with diagonal con-
nection stiffening acting in tension. It should be noted
that the data obtained for test S33.A4 is questionable due
to the possible influence of untraceable instrumental
errors. If the two curves of Figures 24 and 25 with PIP =Y
0.6 are c~mpared, the connection with a compression- dia-
gonal stiffener seems to reduce the shear racking. This
finding would seem consistent with the connection behavior
already presented in this report. It was noted earlier
that the maximum deformation occurs along the compressive
diagonal. If a stiffener is placed along the compressive
diagonal, one would expect correctly that the shear racking
would be reduced.
Figure 26 shows the load-diagonal deformatiqTI curves
for both tension and compression diagonals of test 333.A7.
This is a subassemblage made from a 6WF25 column section.
The connection itself is diagonally stiffened with the
stiffener acting in tension. It should again be noted that
the compression diagonal shows the maximum deformation.
The failure of the connection shown in Figure 26 was re-
corded and will be discussed later in this report.

-54
The first yield, beam shear load given in Table 8
was calculated from Figures 23 to 26. The first yield
load was taken as that load at which shear racking first
started in a given connection. Initial shear racking
was previously described as the first deviation from a
fully elastic condition.
By placing rosette gages at specific locations on
the web panel of the connection, it is possible to obtain
the stress distribution within a connection for any given
load. Figures 27 through 30 are the principal stress dis-
tributions for an unstiffened connection and for two dia
gonally stiffened connections for selected loads.
Figure 27 gives the principal stress distribution
for. an unstiffened t~st connection for two selected loads.
An elastic stress distribution is shown in Figure 27. In
this figure, all the principal compressive stresses are
lined up parallel and in the direction of the compression
diagonal of the connection. The effect of the column
moment can be seen by the magnitudes of the principal
compressive stresses in the upper and lower row of gages
in the connection.
The remainder of this report will use the terms
upper and lower compressive triangles. An upper compres
sive triangle for this test series will be defined as that
portion of a connection web panel which is above the compres
sion diagonal. If the connection has a tension stiffener

-55
diagonal,the upper compressive triangle will be "everything
above the tension diagonal. The remainder of the web
panel will be defined as the lower compressive triangle.
In ~n unstiffened connection first yielding occurs
along the compressive diagonal of th~ connection. Reference
should be made to Figure 28, which shows the principal
stresses at a load causing some yielding in the web panel.
As yielding spreads in an unstiffened connection, i~
progresses into the upper compressive triangle. The lower
compressive triangle has a lower compression stress due to
the tension effect of the beam moment. At the lowest
corner of the lower compressive triangle a state of pure
shear exists for a certain beam load. If this shear state.
is great enough in magnitude, yielding will occur. As
loading increases in an unstiffened connection, it spreads
in a band along the compressive diagonal into the upper
compressive triangle, anq then into the lower compressive
triangle with the initial yield in the lower compressive
triangle being at the bottom, column face corner of the
triangle.
For diagonally stiffend connections the principal
compressive stresses align themselves along the compressive
diagonal of the connection (see Figures 29 and 30). Initial
yielding of diagonally stiffened test connections occurs
along the welds used to fasten the diagonal stiffener to
the web panel. In tests performed on connections with

- 56
diagonal stiffeners acting in tension, after the initial
yielding alo?g the diagonal stiffener welds, the first web
panel yielding occurred along the compression diagonal.
As beam load was increased the yielding spread into both
the upper and lower compressive. triangles. Figure 31 is
a photograph taken of a diagonally tension stiffened
connection. It is evident from this photograph that the
major deformation and yielding occurs along the compressive
diagonal. Tests .performed on connections with diagonal
stiffeners acting in compression did not exhibit such wide
spread web panel yielding as that described for tension
diagonal stiffeners. Compression diagonally stiffened
connections did show initial yielding along the diagonal
welds. It should be noted that all tests on connections
with diagonal stiffeners acting in compression were on
subassemblages with light columns. Therefore, the web
panels of the connections tested were- never subjected to
extremely large loads due to the tests being terminated
as a result of local failures in the column flange.
Observations indicate that as the web panel-of a
connection yields and finally reaches a mechanism state,
it shifts load to the stiffening system. The connection
then appears to increase slightly in stiffness until a
complete mechanism has been reached for the entire system.

-57
It should again be mentioned that in all tests
performed, yielding was encountered in the web panels
of the test connections. However, in no case were any
of the connection's ultimate strengths' the direct result
of a failure within any connection. Therefore, it must
be concluded that strain-hardening within the connection
plays an important role in shifting the ultimate failure
zone outside the connection.

5. TEST CONCLUSIONS
The results of the tests conducted as described in
this report can be listed as follows:
1. All the connections tested showed a great
deal of post initial yield strength. None
of the subassemblages tested failed due to
a localized connection failure.
2. Strain-hardening is a very important factor
in the overall ultimate strength of a test
connection.
3. The principal compressive stresses of all
connections tested were parallel and in the
direction of the. compressive diagonal of
the connection.
4. As yielding pro g resses in a test connection
it spreads out into the web panel from an
initial yield band along the compressive
diagonal.
5. When a web panel of a diagonally stiffened
connection reaches a mechanism condition,
load is shifted to the stiffening system.
6. Axial load plays an important role in the
behavior of beam-to-column connections. It
was noted that even for connections which
58 -

were "over designed" the shear racking
deflections are proportional' to the
magnitude of the axial load in the
column of the connection.
-59

6. TEST RECOMMENDATIONS
This section presents a list of suggestions which
are intended to serve as an aid to any researchers plan-
ning tests on beam-to-column connections. The list was
assembled from the experience gained in the testing of
the seven connections described in this report. The
following is the list assembled:
1. If the ultimate str~ngth of a c6nnection
is to be studied, th~ connection must be
designed as the weakest region of the sub
assemblage to be tested.
2. If a stiffened connection is to be tested,
stiffeners should be designed so that they
will ~ail causing the ultimate load of the
connection to be reached.
3. A much higher shear condition will be in
troduced into the connection if the columns
of the subassemblage are long. Therefore,
tests with columns as long as possible are
desirable.
4. It is necessary to gage the column with enough
electrical strain gages so' that the shape
of the column moment diagram is always
defined.
- 60 -

- 61
5. When the diagonal deformations and relative
rotations of a connection are measured, a
direct reading system s~ch as an Ames dial
gage under tension from a wire gives fastest
and most accurate results.
6. When instruments are chosen to read the
electrical strain gages in the region of
the connection, it is best to have an in
strument which will record a wide range of
strains.
7. Avoid excessive grinding or welding in
the area of the web panel, in order to
prevent any localized disturbance of the
residual stress distribution in the
connection.
8. Initial alignment of a test specimen to
closer than a 10 percent difference in
strains at a cross section seems to be
impractical and unnecessary.
9. The test procedure of first building up
a working axial load then adding the beam
load incrementally, seems to be a simple
and satisfactory test method.
As a result of the pilot study presented in this
report, the following list of additional beam-To-column
connection problems has been assembled. These topics

-62
are presented in order to aid in the planning of future
beam-To-column test programs.
1. Tests should be conducted on connections
specifically designed to determine the
ultimate strength of a web panel. These
tests could be used to check the relation
ships presented in this report.
2~ A specific test series should be designed
to determine the effect the column flange
has on the ultimate strength of a beam-to
column connection.
3. A study should be started on the behavior
of interior connections.
4. A study could be started to determine
the behavior of a three-dimensional beam
to-column connection under the influence
of high axial load in the column~
5. An investigation could he conducted in order
to determine the most efficient method of
attaching the beam to the colu~n.
6. Better methods of designing web stiffening
should be examined. It is important to
know how much of the column web functions
with the transverse stiffeners so that
the stiffener size can be determined more
accurately.

-63
7. Tests on larger subassemblages could be
designed in order to determine the effect
of a "failed" connection on the rest of
the subassemblage. ,From these tests,
possibly a method could be developed to
use the "under strength" of the connection
as a reduced plastic hinge moment rather
than the nominal M of the beam or column.p
The method would then take into account
the effect of this plastic hinge behavior
on the rest of the structure. If this method
r equire s a small i norea s e in memb er size s',
but saves the fabrication cost of d~tails
and permits easy framing of perpendicular
floor members into the column web, designers
might be able to provide ~ubstantial savings
in material. These savings could be achieved
under ~he condition that this new form of
plastic hinge would give the required rota-
tion capacity to permit the necessary redis-
tribution of moment in the structure.

7~ DESIGN SUGGESTIONS
A design formula sh6uld be as simple but yet as
accurate as is possible. The results of the theoreti-
cal derivations of part 2 are somewhat complex Ln form.
Therefore, the interaction relations of formula (2.15)
and (2.20) should be simplified, if at all possible, to
improve their usefulness as design formulas.
By plotting the lower bound interaction calculations
for many connections, it is possible to obtain a composite
interaction diagram which contains the lowest points of
all the connections examined. Figure 32 is a plot of the
lowest composite interaction curve obtainable from the
connections examined. It should be noted that all the
connections examined were within about 5 percent of this
curve. Therefore, it should be possible to develop a
design equation for beam-To-column connections by obtaining
the equation of the lowest composite interaction curve.
Design equation (7.1) is obtained by fitting a parabola
to the data of Figure 32.
Equation (7.1) is an exact least squares fit to the curve
of Figure 32. A parabola was chosen fo~ the design curve
64 -

-65
because ?oth equation (2.15) and (2.20) are parabolas.
I f astra igh t 1 ine de s;ign formula would h ave been c has en ,
too much of the strength of the connection would be
wasted.
It is possible to approximate equation (7.1) con-
servative1y with equation (7.2).
MM
p
(_p_' ) ( P ,2= 0.95 - 0.75 - 0.25 --'P P
Y Y( 7 .2)
Figure 33 is a comparison of design equation (7.2) to the
lowest composite interaction curve obtained. Equation (7.2)
is about 5 percent conservative for low values of column
axial load (i.e. pip). As axial load increases, equationy
(7.2) and (7.1) become almost equal.
If equation (7.2) is compared to the interaction
curves obtained from equations (2.15) and (2.20), it is
possible to note that as axial load increases the inter-
action curves become more similar (see Figure 34), The
two upper curves of Figure 34 are typical interaction
curves obtained from the equations of part 2 of this
report for two given connections.
Table 8 gives a summary of the test results as
predicted by the various interaction relationships. The
analysis and·design relations can only be applied to the
unstiffened test connections. Therefore, there are some

-66
blank columns in this table. The difference between the
lower bound prediction of part 2 and the design formula
(7.2} is less than 1 kip for both tests. These two pre-
diction values should be compared to the first yield
value in the table. The first yield value is that load
at which shear racking begins.
Since the present formula limiting the shear defor-
mation of beam-to-column connections is being used suc-
cessfully on columns with low thrust,it would seen appro-
priate to make use of the present design method for lo~
axial load conditions.
A possible design method"would be as follows:
For a given size of beam and column, substitute
the member dimensions into the formula presently used
for the design of beam-to-column connections, equation
( 7 .3) •
M _ :/lM 6Z
P
(wd )c (7 .3)
Also substitute the relative axial load in the column into
equation (7.2).
MM
p= 0.95 - 0.75 (~) - l.25 (~)2
P P"y Y

- 67
The smaller of these two M/M values should be used asp
the design value for column moment. The moment, M, cal-
culated is the column end moment at one side of the
connection. To check if the connection is sufficiently
strong to carry the external loads, one must double the
column moment, M, and if this value is greater than the
applied beam moment the connection will carry the applied
load. This procedure is summarized in relation (7.4).
2M ~ Applied Beam Moment (7.4)
If relation (7.4) is not satisfied the connection must be
stiffened.
The design procedure outlined results in the design
interaction curve of Figure 35. The horizontal line is
the present ultimate strength prediction of a beam-to-
column con~ection. The remainder.of the curve is equati~n
(7.2), a modified design curve based upon the analysis of
.p art 2 0 f t his rep 0 r t .


af
a w
df
dB
d Bw
dc
d w
L
1
t
w
mo
~o
k
8. NOMENCLATURE
= Area of column
= Area of column flanges (2)
= Area of column web
= Area of beam
= Area of beam flanges (2)
= Area of beam web
= Depth of column from ~ Flange to ~ Flange
= Depth of beam
= Depth of beam web
= Depth of column
= Depth of column web
= Length of beam to point of zero moment
= Length of column to point of zero moment
= Thickness of column flange
= Thickness of column web
= Thickness of beam web
= Distance from column web ~ to yield interface
= Plastic section modulus
= Percent of beam flange not yielded by moment
= Percent of column flange not yielded ~by moment
= Percent of full yield load in beam web which
is given by axial load
= Percent of full yield load in column web which
is given by axial load
- 68 -


'"""69
M = Column moment entering the connection
MB = Moment in the beam at the column face
M = Plastic moment due to shear, bending, and thrustpm
S = Beam shear
T = Thrust in column
V = Column shear
't = Shear in column web
J = Shear displacement rate0
p = Axial displacement rate
U) = Uniform beam load
WE = Total external work
WI = Total internal work


9. TABLES
- 70 -


TABLE 1.
P/PY
6WF20 COl.UM~J" Lf;NL1TH = 60 _0012816. 5 Hl:'AM'" LENGTH = 4~ ,0 ()~A T10 rjF dEAM, FLANnE YI ELU;J) = O. nno 0
'WS8 AXIAL W~B AXIAL- ,-' -- - - - - 't.: Cf,,'U ," LaAn
~ IMP PAR A t1 ErE H MIMP PAR " r~ L: T~ R- --, -r - !~ ~ A;·-'-r~-~~D-[¥~~·FT~A-NGf:]' -~..~..-~[~A;'~"I''f\J - c'oL ~ WEB 'l

TABLE 2. BE A~1 ~ TO" CULUMN CQNNE CT ION • I NT.E: RAe TION cuR VES
6~F'2(1 COLUMN ~ LeNGTH = 60.00'-----·-----I7B"1~6;-5-·-----FrEAT~~-C:E-N'GtH= 4~. 0U
___~_~..!__.r.co_.. o_r_ r~ EAM ~~.A ~_q.E: Y. tEL 0 EO :I O. 50 0 (I
wEB AXIAL WE~ AXIAL- - - - .-~ ._- -- -L-rf'AD'- L jAn
P/PY ~/M8 PAR~MfT~R M/MP PAHAMET~R-~-r---~~I~-;---~-1~J~~(roC~·~--Tl:AN-(rE--~-~J--~--~-1-- r~,~ A, If~ Cn~. wbB',
G_OOOOU l,OHU84 O,~696U U,99784~ ........ ·T~ _._ "_,. -~ -- - _ ..• ~ ~ - _.- ~. _.~ -- .- ~. -- ..-
0.98417
O.0500U
0.10000
1,03210 O.~7335-, ~ ~ ..., .~~ ~;r-~. ~-.I:':"C""~-_;"" .._~~=-::::.':......,....~':J".- ....... -~- - .::II'"_-~~~ ~._!
u~~RJOU O.976R4_...- -- :......., ..- - _. - - .-, ...~ ....
0,97484
O.9333~ 0,,98008 0.98417
O.2000J
0.25000
lJ.7299U O.Q9059
U.9n585
U,d5410
.0" 79085
U.ll610
. O"o?986
U.98417
U.98417
U.98417
O.45QOO U.6254~ 0.99437 Ot5~211 0.98417-~ ~ _.~ -~ _ ... ~ ~ - - - ~ ............ ~.•- - ~ ~.- -~~ &- ~, - .•"- ~ - - - - - ~ - ~ - - - - - ~- - - ~ ~ ,..... +-~~
0.50UOU
0,00000
O.7000u
0,.7500U
0.80000
0.8500U
O.9000U
U,:>725U
O.465~l
O~4113'1
LJ,3575d
U.3059b
O~28416
U_3279U
u,38129
0 .• 43566
O.q959(J
0,9 9 718
(J,99d23
O,9Y95U
0.99990
Otl99Q97
0,99979
0,99<;37
O.9 9 H70
U~~2287
O.3021J
U.ln988
0.,U2614
o:;oU.12910
,.0.47408
... 1,U7780
U.9~417
0.98417
U.9 B417
0.98417
0.98417
0.9841.7
1.00000 O,49U07
- 72 -
0.98417

TABLE 3. HEAM~TO~CU~UMN CONNECTION. tNTERACTION CURVES
~WF20 CO~UMN· LtNGTH = 6U,00.~-~-----'-~·--_·_-·-···-r<2-8j~-·;;'-·:-'5-------·-8·EA-M···'~-;-_·I~~~N GTH == 45 • 00
~ATIU OF BEAM FLAi~GE Ylf::LD;() = 1.0000. ~ ----- ~ . ~ .--
WE8 AXIAL WEB AXIALLOAD LJAO
PIP Y ~ IMP fJ ARAl~ cTt: R i~ IMP PAR AMET f: H""-r N;-'-A. r'~'-·~"COT:"-;·~·[A-'N(iE' -'1 ...-.¥.--.,'[ . N.'A • 'IN COt." W~8 J
o.uOOOO
O.0500U
0.30000
0.35000
0,45000
O.5000u
0.55000
O.6000U
O.6500U
0.70000
O.,7500U
0.85000
0.90000
1.00000
1.Ut)47b
U,967t B
0,91760
U.tj6i~c
O.76b?1
(j.'l1~77
lJ~6104t!
u,5575~
U.~959Y
U.~41~1
U,,~3(J4U
0.0642/
0.02790
ot 9~j099
0,96039
U.9t'875
0,98525
O,9878U
C,9'1218
O,99b02
O,998H7
0.99948
0,99985
0.99997
O,~957b
O~9H994
O~9724~
0.94322
O~lj4979
U,70965
O.6f?20b
O.52~79
U.411A4
o,~e921
(J.LJ089t:
=U,,14874
-0.49911
-O~69181
~U.89619
.. 1!1122,
-1.33990
u.96905
U.9690,
U.96905
0.96905
O"Q690,
u.9690,
U.9690~
L.96905
0.96905
U.96905
0.96905
0,96905
U.9 6,,905
U.96905
0.96905
U,96905
U.96905
- 73 -

TABLE 4. P~AM~TO"COLUMN CONNECTION ~ INTERACTION CURVES----, - _..... ~ - - ~ - -- - -- ~ -- - - - -- - - -- - - - - - - -- - - - - - .- - ~ ... - ~ ._, - .~.,~ -' - -~ - _. ''-' -.- - ... -
6Wr20 cO~UMN ~ LENGTH = 19,801~ B16 • 5 8EAM tit LEN GT·H~~2-1~·;- QO-~--'~-
.~ _. ,_ ~~~A,T l ..~_ ..~.~F_, __~_,~_~_~, _.~._~,,~.~.Q_~_ ~Y_t_~_l~~Q.~~. __~ ... ~~ ..._O_ q.~~~.- ._..
WEB AX1AL.- -c· -- .'-'"- "L~O An
P/PY M/~P PARAMETER-".~ .. 'r ' N ~ .A, I'~I - -CO -[-~ - FLAN GE ]
W~b AXIAL.-~ -L: '0 AD - -- -
"'liMP PAHAMETEH( N.A~ tN coL~ ~EB~)
0,,00000
a .u5000
o• j. 0 00 0
0.15000
0.20000
0,30000
0.35000
0.60000
(J.7000LJ
o•"750 U(I
0,80000
O~d500tj
O.9000u
0.9500(;
l.0253~
O.9807U.,_., __...._ ... ,_. __.J~. __ , ....
0.89741
u.76077
O.5655l
U.46t:2::>
U.40'J~1
U.J014~
U,,4R521
0,77822
O.80B92
O.~8~81
O.94l'12
Ott96904
O.q9~86
O,9979t!.
0,99951
O.9B430
U.YA044
u,Y7383
0.95401
(,,9209ts
lJ.d7474
U.81528
LJ,'742f>2
0.65674
(J,,~5764
u• '+ 4 5 ~~ 4
O.1~l09
CJ.02915
.. o,5n~96
-U!l7t075
·0. Y;:?lJ75,'
-1.15997
0.85657
U,85657
U.85657
U.85657
O.8~657
1;,85657
O.R5657
U.85657
(1,85657
U.85657
U,~5657
(.1.85657
U,85657
lj,85657
U. 856~j7
tJ.e5657
I) • 8565.,
t) • A~65"
1.0000U O.54~1U 0,97404 -1~66204t- _ o....::a..:. __.. t .....",." -"""" __ .-.. "........ ~ r--.-. _ """,,,"_..-..=u.--- ......,. ~ - "'.t -¥..~
0,85657

TABLE 5.
6wr20 COLUMN ~ LENUTH = 6U.OO~--_.- ~ -._._. -r·2816:5'.~"--~--' 8EAM'" LEN 11 t H = 8 U• {I (I
QATIO OF 8EAM FLANGE YJ~LD;D = u.Ooon
p/py
WEB AXIALLOAD
~/MP PARAMETERN~ :A., I ~ ·C 0l -~-- Fl ANGEl
W~8 AXIALLOAD
~1 I ~qJ PAHAHETER[ N.A, l~ COL. WE8 ]
O.OfJOOU
0.0'500U
0 .. 10000
O.1500U
0.20000
o.~?ooo
0,30000
0.35000
oIt 45 U0 II
O.500QU
0.55000
0.00000
0_7000U
O.7500u
0,8000U
0.85000
u,8~44H O~98718
U.J6~5b O,9997H
O.J161~ O.99Q96
U,~3529 0,9 9 9 9 0~, .au .~~ .. ~ _..lL "T..lf -~"'- .•~--.-:- J...~~.l.o.' ~_,I' -:;:._-:jI;; .... ....:. - ~
0,38657 0',99960
O~9?805
O.~9(?31
U.Y750Y
U.94638
O.lq138
0,11.675
O.6~064
O.?3304
O,4t>397
U,30341
0.17137
0.U2785
-0 .1?7~~5
.. 0.29363
l;IJO~47159
e-O.66104
0.98569
fJ .9A569
U.9t\5A9
U.9856<;
0.98569
O.985~9
O.98?69
0.98569
1.00000
0.44046
0.49466
O~9990?
0,99824
O.Q9719
- 75 -
.1.29Ei27
O.985~9
0.98569
O.9A569

TABLE 6. Bt:AM-.ro",cUL,LJMN CONNECTI'ON ... J'~TERA~TIO~ CURVES- -- -- .... ~ --- -- -.-... .... ~ "-- ... , -- .......... _.~ .......... -- -- -- .-... - -- ~ ~ ........... --
O.Y6761 O.6~778
0 .. Y~5bO~ 0.62778
O.<}292!j U.6277ti
0,6f\131 0,62778
O.d1418 0'0 2 778
U.12787 'O.ti~778
o.. t) ~~ 2:3 9 0,62778
O.4C)172 U,6?778
o•J~~~88 O.t:>?778
O,lQ086 O. o~~778
O.OOH66 0.62776__.0",-
-O.:l.Q(!72 U,6~77tJ
.. 0,41328 0,62776
0.74:>16
a, ? 8 U13·
().70669
O,7A21:>
U,d04?Y
U.b8J~(j
U~9?un7
u.o7Jnl O,841J7H
u.. 71d41
Ut,7J6U 0,891)42~---",.---_._- -----~--
O.10uOt)
O,40QOO
0,00000
O•. 1500tJ
O.0500tJ
O.J5000
O~45000
O.~OOOLJ
U.25LJOU
0.2000u
0.60000
O.6500u Ult42~26 -O.O~~02 0,62778
0.70000 O.6277~
0,75000 -1.19003 U,,6~778
O.l30000 Ull 251yl -1,4A730 0.62778
lJ,~lQ1Rl 0,99016 0.62778
U.12993 0.99563 0,62778
O.0605~ U.62/78
'- 76 -

-77
TABLE 7. CONNECTIONS TE'STED
Test Col. Size Stiffening. L/ry P/Py End Fixture
333.AI 6WF25 None 40,t: 0.60 Fixed
333.A2 6WF25 HC 40": 0.80 Fixed
333.A3 6WF20 HCT 67 a .60 PinnedDT
333.A4 6WF20 HCr 67 0.80 FixedDT
333.AS 6WF20 HCT 67 0.80 FixedDC
333.A6 6WF20 HCr 67 0.60 PinnedDC
333.A7 6WF25 HeT 66 0.80 FixedDT
He = Horizontal stiffening in compression
HeT = Horizontal stiffening in both compression and tension
DT = Diagonal stiffening in tension
DC =. Diagonal stiffening in compression
* Due to salvage operations these columns are 5 feet in length

Table 8 S~mm~ry of Tes~ Results 1-....Jro

10. FIGURES
- 79 -

-80
",.., "-,( f
I ' ...... ,/,,/
rr Tr ""7? 7'77"7-
Typical Multi-Story Frame
ExteriorBeam-to-ColumnConnection
InteriorBeam-to-ColumnConnection
FIGURE 1. Types of Beam-to-Column Connections and TheirRelative Position Within.a Frame

-81
~~-pP+V
F = 2 MdB
-a p
v
WebPanel
FIGURE 2. An Exploded View of an Exterior Beam-to-ColumnConnection Subjected to a General Loading

-82
(a) Compressive Fai lure
We =
(b) Tension Failure
(c) Shear Failure
FIGURE 3. The Three Most Common Types of ConnectionFailure Modes are Presented Along With theRelationship Presently Being Used for 'Design

B
·...........--A
B
I~""A
-83
.1_ cry
1= -- -II
T T cry
tf Motb
kCiy Tb
AxialLoad
___________1__cry
Moment Shear
FIGURE 4. Stress Distribution in Beam of an ExteriorConnection (See Section A-A),

-84
-
-...--
I~~ ~ U 't.
I II t 7]0 I t I I t I
I II II I I III I I I
Icry II I cry III I ecry
I II I MomentI II I
II II II IIcry II II cr. cry II ILJ]Y ecry OJ Axial
I II II I Load
I II T II ILJ lLJ
T
Shear
1) NA in Column Flange 2) NA in Column Web
FIGURE 5. St~ess Distribution in Column of an ExteriorConnection (See Section B-B),

-85
Of ofTO-mo) (O"Y+~O"YB)~"'--- ~ T (1- mo) O"Y
--..- ............ --;II"'" T4IIIlIIL- B
~I
a) An Infinitely Short Element Cut From the Beam
Beam InflectionPoint
(O"Y+~YB)CTy
IIIII
~............---L------_ICTy dXB
L
b) Moment Diagram of the Beam
FIGURE 6. Shear Expression for the Beam

-86
a) An Infinitely Short Element Cut From the Column
(O"y +~ O"y C )
Colu mn InflectionPoint
b) Moment Diagram of the Column
FIGURE 7. Shear Expressions for the Column

-87
M~
Vc ......-----
-_.......... Vc"--/ M
a) General Diagram of Forces on an External Connection
dBWeb
/:::,. p:: VB0 Panel
Va
/:::"P... Vc
b) Free Body Diagram Used to Calculate the Shear Stressin the Web Panel.
FIGURE 8. Free Body Diagrams Used for the Calculation ofthe Shear in' the Web Panel

-88
FIGURE 9. Shear-Moment-Axial Load Interaction CurveDeveloped from the preliminary lower boundinvestigation. Data from previous frame testsis also shown.

1.0
0.8
0.6
.........
'" " {6 YF 20 Column'/ 12 B 16.5 Beam
-89
{14 YF 426 Column36 w= 236 Beam
0.4
0.2
o 0.2 0.4 0.6 0.8 1.0
FIGURE 10. Shear-Moment-Axial Load Interaction Curve forBeam-to-Column Connections Made from DifferentMember Dimensions(Column Length = 60", Beam Length = 30")

p
M--+-~V
. I81
.a=~
dB
V -----+---
M
P+S
FIGURE 11. Upper Bound Displacement Mode NeglectingAxial Shortening
-90

p
-91
s
w
~ ~ ---_ ....."""""l"
""'-" " '"
",
/,/
//
...".~--_ .....
p+s
FIGURE 12. Upper Bound Displacement Mode Consideringthe Effect of Axial Load

Jack
AluminumDynamometer
Top EndFixture
Specimen
BottomEnd Fixture
-92
FIGURE 13A. Test Setup with Pinned-End Column Fixtures

-93
TestingMachine Head
Specimen
Jack
AluminumDynamometer Pedestal
FIGURE 13B. Test Setup with Fixed-End Columns

()t=:==::::::tI
..~
II
\
- - -
)
-94
a) Exterior Connection,No StiffeningTest AI, A2
,b) Exterior Connection,Horizontal Stiffening
) )
d) Exterior Connection,Diagonal Stiffening
in TensionTest A3, A4, A7
c) Exterior Connection,Diagonal Stiffening
in CompressionTest AS, A6
( )
e ) Interior Connection
FIGURE 14. Types of Beam-to-Column Connections

-95
Specimen
CylindricalBearing
ColumnBase Plate
..... .....o Shear
Plate
WedgesAligning
Base Plate
SCHEMATIC VIEW
FIGURE 15. View of End Fixtures

-96
--- - ..=
I I I I.... -!... -
71 I
I I 71
~ ~ I
I I I I I
I
<t
FIGURE 16. Electrical Strain Gage Locations

filet> Rod
Dial Gage
Specimen
I II
"2 et> Rod
Dial Gages
FIGURE 17. Web Panel Rotation Gage
-97
Dial Gage
1-" <P Rod2

40
30
BEAMSHEAR
V 20(KIPS)
10
AI
A2
o 0.5 1.0 1.5 2.0 2.5 3.0
BEAM DEFLECTION (I N.)
FIGURE 18. Beam Load-Deflection Curve for theUnstiffened Test Connections
ILOco

35
30
25
BEAMSHEAR 20
V(KI PS)
15
10
5
o 0.5 1.0BEAM
pp-=o.a
y
1.5DEFLECTION ~ (IN.)
Pp=O.6
y
"'A4
2.0
A7
2.5
FIGURE 19A. Beam Load-Deflection Curves for Test Connections WithDiagonal Stiffeners Acting in Tension
ItolD
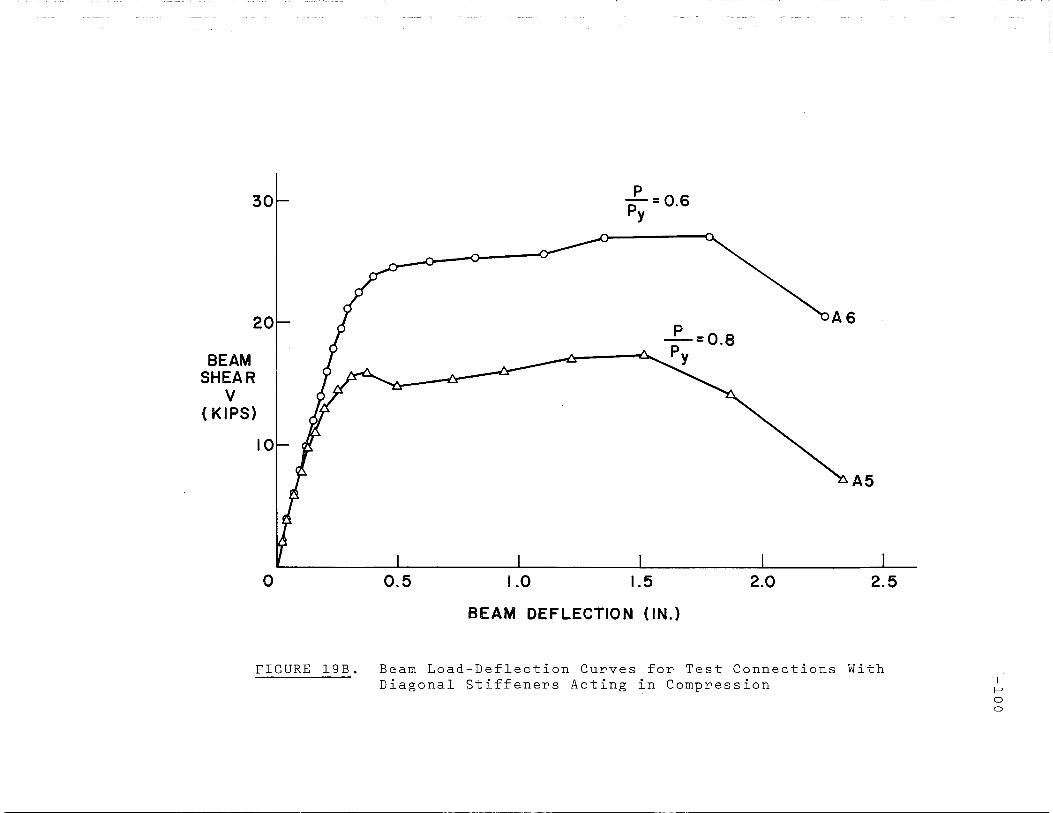
30
20
BEAMSHEA·R
V( KIPS)
10
o 0.5 1.0
.L=O.6Py
1.5 2.0
A5
2.5
BEAM DEFLECTION (IN.)
FIGURE 19B. Beam Load-Deflection Curves for Test Connections WithDiagonal Stiffene~s Acting in Comp~ession
I~
oo

a) Failure Mode of a DiagonallyStiffened Connection
b) Local Buckle in the BeamFlange
FIGURE 20. Failure Modes of the Test SpecimensI
f--'oI--'
J

2.52.01.0 1.5
BEAM DEFLECTION (IN.)
0.5
5
o
301Tension DiagonalStiffener
251 -
A3
I r20~ II
Compression
BEAM
S·tiffener
SHEARV 15
°A6
(KI PS) I II
10 L- II
Pp=O.S
y
FIGURE 21. Beam Load-Deflection Curve Comparing the Results for theTest Connections with Diagonal Stiffeners in Tension andCompression
It-'ot'V

-103
Tension Diagona I
Compressive Diagonal
a) Diagonal Deformations Measured on Test Specimens
b) Photo of Equipment Used to Measure Relative Rotationsand Diagonal Deformations of a Connection
FIGURE 22. Equipmen~ to,Measure Connection Behavior

40
BEAMSHEAR
V(KIPS)
30
20
10
o 0.05
6 Tension Diagonal
o Compression 0 iagona I
L=0.8Py
0.10 0.15 0.20
DIAGONAL DEFORMATION (IN.)
0.25
FIGURE 23. Diagonal Deformations of Test 333.A2 an UnstiffenedConnection
'" ~'~Y~~.~YN'~·=,~~~~~~~
II-Ja+

BEAMSHEAR
V(KIPS)
o
A6
Pp=o.ay
0.05 0.10 0.15 0.20 0.25
COMPRESSIVE DIAGONAL DEFORMATION (IN.)
A5
FIGURE 24. Diagonal Deformations of the Test Specimens withDiagonal Stiffeners Acting in Compression
If-Jo01

-106
30
20
BEAMSHEAR
V(KIPS)
o 0.05
:y =0.8
0.10
A4 A3
0.15
COMPRESSIVE DIAGONAL DEFORMATION (IN.)
FIGURE 25. Diagonal Deformations of the Test Specimens.with Diagonal Stiffeners Acting in Tension

6. Tension Diagonal
o Compression Diagonal
BEAMSHEAR
V(KI PS)
40
30
o ±0.05 ±O.IO
DIAGONAL
Pp=0.8
y
±0.15 ±0.20
DEFORMATION (IN.)
±0.25
FIGURE 26. Typical Load-Diagonal Deformation Curve for BothDiagonals of a Diagonally Stiffened Connection(Test 333.A7)
IJ--lo....J

-108
Stress Sea 1e1"=40 ksi
(ksi)o 20 40
FIGURE 27. Principal Stresses in the Web Panel of anUnstiffened Connection Subjected to an ElasticLoading Condition

Stress ScaleIII =40 ksi
· (·,k si)o 20 40
-109
FIGURE 28. Principal Stresses in the Web Panel of anUnstiffened Connection Subjected to anInelastic Loading Condition

-110
Stress Sea IeIII =40 ksi
(ksi)o 20 40
FIGURE 29. Principal Stresses in the Web Panel of aConnection with a Diagonal Stiffener Actingin Tension

-Ill
Stress Sea IeI" =40 ksi
(ksi)o 20 40
FIGURE 30. Principal Stresses Within the Web Panel of aConnection with a Diagonal Stiffener Actingin Compression

-112
FIGURE 31. A Photograph of Test 333.A7 Showing aDiagonally' Stiffened Connection and theway that YiBlding Spreads in the Connection

-113
1.0
0.8
0.6
M~Mp
0.4
0.2
o 0.2 0.4 0.6 0.8 1.00
FIGURE 32. The Lowest Composite Interaction CurveObtained from Selected Practical SizedConnections

Lowest CompositeInteraction Curve
1.0
0.8
0.6
0.2
o
DesignCurve
0.2 0.4 0.6 0.8
-114
1.0
FIGURE 33. A Comparison of the Design Formula toLowest Composite Interaction Curve ofSelected Practical Sized Connections

-115
1.00.8
Actual Interaction Curve
{14 'IF 426 Column30 'IF 230 Beam
0.60.40.2
DesignCurve
Actual Interaction Curve........ "", {6 'IF 20 Column
,,/ 12 816.5 Beam
~
o
1.0
0.4
0.2
0.8
Mi'M 0.6
P
FIGURE 34. A Comparison of the Design Formula to the ActualBeam-to-Column Connection Interaction CurvesCalculated from Part (2) of this Report

Solution PresentlyBeing Used
Lower BoundDesign Equation
FIGURE 35. Final Design Interaction Curve for Beamto-Column Connections
-116

11. REFERENCES
1. Driscoll, G.e., Beedle, L. S., Galambos, T. V., Lu, L. W.. ,Fisher, J. W.~ Ostapenko, A. and Danie~s, J. H.
LECTURE NOTES--"PLASTIC DESIGN OF MULTI-STORYFRAMES", Fritz Laboratory Report No. 273.20, LehighUniversity, 1965.
2. Fisher, J. W.WELDED CONNECTIONS, Structural Steel Design~ Chapter19, ed. L. Tall, Ronald Press, New York, 1964.
3 • Yura, J-. A.THE STRENGTH OF BRACED MULTI-STORY FRAMES, FritzLaboratory Report No. 273.28, Lehigh University,September, 1965.
4. Beedle, ·L. S., Topractsoglou, A. A. "and Johnston, B. G.CONNECTIONS FOR WELDED CONTINUOUS PORTAL FRAMES,Progress Report No.4, Welding Journal R-esearc-hSupplement, JUly and August, 1951, November, 1952.
5. Graham, J. D., Sherbourne, A. N.~ Khabbaz~ -R. N. andJensen, C. D.
WELDED INTERIOR BEAM COLUMN CONNECTIO-NS, WRCBulletin Series No. 63, 1960.
6. Naka, T., Kato, B. and "Watabe, M.RESEARCH O~ THE BEHAVIOR OF STEEL BEAM~TO-COLUMN
CONNECTIONS, Laboratory for Steel Structure,University of Tokyo, 1966.
7 • Horne, M. R.THE FULL PLASTIC MOMENTS OF SECTIONS SUBJECTED TOSHEAR FORCE AND AXIAL LOAD, British Welding ResearchAssociation Report No. FE.l/51/57, March, 1957.
8. Kusuda, T. and 'Thurlimann, B.STRENGTH OF WIDE FLANGE BEAMS UNDRR COMBINEDINFLUENCE OF MOMENT, AND AXIAL FORCE, PROGRESSREPORr No. 27. Fritz Laboratory Report No. 248.1,May, 1958.
9 .- Hub e r, A. W.FIXTURES FOR TESTING PIN-ENDED COLUMNS, FritzLaboratory Report No. 220A.24, Lehigh University,July, 1956.
10. Prager, W. and Hodge, P. G.THEORY OF PERFECTLY PLASTIC SOLIDS, John Wiley andSons, Inc., New York, 1961.
- 117 -

12. ACKNOWLEDGEMENTS
This report was prepared in connection with a
research project on beam-to-column connections conducted
by the Department of Civil Engineering, Fritz Engineering
Laboratory~ Lehigh University, Bethlehem, Pennsylvania.
Dr. David A. VanHorn is the Chairman of the Department
and Dr. Lynn S. Beedle is the Director of the Laboratory.
The work described here was sponsored jointly by
the American Iron and Steel Institute and the Welding
Research Council.
Sinc~re appreciation is express~d for the unselfish
help extended to the authors by their colleagues, Messrs.
J.ames o. Armacost, III, and .Leo H. Van Zuilen.
Finally, the authors wish to .express their thanks
to Mr. Kenneth Harpel, laboratory foreman, and his staff
for their aid iri the test program, Mr. Rlchard Sopko for'
the preparation of photographs, Miss Sharon Gubich for
her help with the drawings, and Mrs. Diane Kroohs for
her care in typing the manuscript.
\.
118


