Page 1
A STUDY ON ABRASION RESISTANCE OF CONCRETE PAVING BLOCKS
A THESIS SUBMITTED TO THE GRADUATE SCHOOL OF NATURAL AND APPLIED SCIENCES
OF MIDDLE EAST TECHNICAL UNIVERSITY
BY
ONUR ASLANTAŞ
IN PARTIAL FULFILLMENT OF THE REQUIREMENTS FOR
THE DEGREE OF MASTER OF SCIENCE IN
CIVIL ENGINEERING
DECEMBER 2004
Page 2
Approval of the Graduate School of Natural and Applied Sciences
Prof. Dr. Canan Özgen
Director
I certify that this thesis satisfies all the requirements as a thesis for the degree of Master of Science.
Prof. Dr. Erdal Çokça Head of Department
This is to certify that we have read this thesis and that in our opinion it is fully adequate, in scope and quality, as a thesis for the degree of Master of Science.
Asst. Prof. Dr. İsmail Özgür Yaman Supervisor
Examining Committee Members Prof. Dr. Turhan Y. Erdoğan (METU, CE)
Prof. Dr. Mustafa Tokyay (METU, CE)
Asst. Prof. Dr. İ. Özgür Yaman (METU, CE)
Dr. Murat Güler (METU, CE)
Dr. Korhan Erdoğdu (Ash Plus A.Ş.)
Page 3
iii
PLAGIARISM
I hereby declare that all information in this document has been obtained and presented in accordance with academic rules and ethical conduct. I also declare that, as required by these rules and conduct, I have fully cited and referenced all material and results that are not original to this work. Name, Surname: Onur, Aslantaş
Signature:
Page 4
iv
ABSTRACT
A STUDY ON ABRASION RESISTANCE OF CONCRETE PAVING BLOCKS
Aslantaş, Onur
M.Sc., Department of Civil Engineering
Supervisor: Assistant Prof.Dr. İ. Özgür Yaman
December 2004, 93 Pages
Concrete block pavement (CBP) can be an alternative pavement to asphalt and
concrete pavements. CBP is formed from individual concrete paving blocks (CPBs)
that fit next to one another on a suitable sub base leaving a specific joint space
among them to be filled with jointing sand.
CBP differ from other pavements according to their mechanical behavior,
manufacturing technique, structural design, installation technique and structural
behavior. For a serviceable pavement all of these subjects have to be studied. The
literature about the mechanical behavior of CPBs is not adequate. This study aims to
determine the performance of CPBs formed from different mixes prepared with a
white portland cement.
For this purpose, 10 mixes with different cement contents and W/C ratios and 2
mixes from a commercial CPB manufacturer were tested. The compressive strength,
Page 5
v
tensile splitting strength, abrasion resistance, density and % water absorption tests
were performed on each mix at 7, 14, 28 days.
It was concluded that, the cement content in the mix, optimum water volume
for a given cement content, the way the manufacturing equipment is operated and
their interaction was effective on the mechanical properties of CPBs. It was also
observed that there was no handicap to stop the abrasion resistance test at 8*22
revolutions instead of 16*22 revolutions given in TS 2824.
Keywords: Concrete paving block, concrete block pavement, abrasion
resistance, white portland cement
Page 6
vi
ÖZ
BETON PARKE TAŞLARININ AŞINMA DİRENCİ ÜZERİNE BİR ÇALIŞMA
Aslantaş, Onur
Yüksek Lisans, İnşaat Mühendisliği Bölümü
Tez Yöneticisi: Yrd. Doç. Dr. İ. Özgür Yaman
Aralık 2004, 93 Sayfa
Parke taşı yol döşemesi asfalt ve beton yol döşemelerine alternatif olabilir.
Parke taşı yol döşemeleri, uygun alt taban üzerine birbiri yanına aralarında ek kumu
ile doldurulmak üzere belirli ek mesafeleri bırakılmış tekil parke taşlarından oluşur.
Parke taşları mekanik davranışı, üretim tekniği, yapısal dizaynı, yerleştirme
tekniği ve yapısal davranışı bakımından diğer yol döşemelerinden ayrılır.
Kullanılabilir bir yol döşemesi için bütün bu konuların çalışılması gerekir. Parke
taşlarının mekanik davranışı ile ilgili yazın yeterli değildir. Bu çalışma beyaz
portland çimentosu ile hazırlanan farklı karışımlardan oluşturulmuş parke taşlarının
performansını belirlemeyi amaçlamaktadır.
Bu amaçla, farklı çimento miktarları ve su çimento oranlarında 10 karışım ve
ticari bir parke taşı üreticisinin 2 karışımı test edildi. Basınç dayanımı, yarma
Page 7
vii
dayanımı, aşınmaya karşı direnç, yoğunluk ve % su emme testleri bütün karışımlarda
7, 14, 28 günlerinde yapıldı.
Sonuç olarak karışımdaki çimento miktarı, belirli bir çimento miktarı için en
uygun su hacmi, üretim aletinin nasıl işletildiği ve bunlar arasındaki etkileşimin
parke taşlarının mekanik özellikleri üzerinde etkili olduğu gözlenmiştir. Ayrıca
aşınmaya karşı direnç testinin TS 2824' te belirtilen 16*22 devir yerine 8*22 devirde
durdurulmasında hiçbir dezavantaj olmadığı da gözlemlenmiştir.
Anahtar Kelimeler: Parke taşları, parke taşı yol döşemesi, aşınma direnci,
beyaz portland çimentosu
Page 8
viii
To My Parents,
Mehmet & Cevriye ASLANTAŞ
Page 9
ix
ACKNOWLEDGMENTS
I would like to express my sincere gratitude to Asst.Prof.Dr. İ. Özgür YAMAN for
his valuable supervision, precious help, invaluable suggestions and continuous
support throughout the research.
I would like to thank ÇİMSA for supplying the Böhme Abrasion Equipment. I also
would like to thank Mr. Önder KIRCA from ÇİMSA for his kind help, technical
assistance and support.
I would like to thank Özkul Beton Elemanları San. ve Tic. LTD. ŞTİ. managers Suat
ÖZKUL and Ahmet ÖZKUL for their support and kind helps. I am especially
thankful to Özkul Beton Elemanları San. ve Tic. LTD. ŞTİ. staff Hüseyin OLGUN,
İsmail DAĞAŞAR, İsa PINAR and Mehmet CEYHAN for their kind helps during
manufacturing and post manufacturing process of concrete blocks.
I would like to expand my thanks to Mustafa ŞAHMARAN and Materials of
Construction staff for their close and friendly assistance.
Finally, special thanks go to my friends that all of whom couldn't be mentioned here.
Page 10
x
TABLE OF CONTENTS
PLAGIARISM ........................................................................................................... iii ABSTRACT .............................................................................................................. iv ÖZ .............................................................................................................................. vi DEDICATION ......................................................................................................... viii ACKNOWLEDGEMENTS ....................................................................................... ix TABLE OF CONTENTS .............................................................................................x LIST OF TABLES ................................................................................................... xiv LIST OF FIGURES ................................................................................................. xvi CHAPTERS 1. INTRODUCTION .................................................................................................. 1
1.1 General .........................................................................................................1 1.2 Objective and Scope .....................................................................................2
2. LITERATURE REVIEW & BACKGROUND ...................................................... 4
2.1 History of Concrete Block Pavement .............................................. 4
2.2 Features of Concrete Block Pavements....................................................... 5
2.2.1 Aesthetic Appeal ................................................................................. 5
2.2.2 Construction and Maintenance............................................................. 8
2.2.3 Structural and Operational Characteristics .......................................... 8
Page 11
xi
2.3 Concrete Flag Paving ................................................................................ 10
2.4 Production of Concrete Blocks ................................................................. 12
2.4.1 Material Properties ............................................................................ 13
2.4.1.1 Portland Cement .................................................................... 13
2.4.1.2 Aggregates ............................................................................. 13
2.4.1.3 Pigments ................................................................................ 16
2.4.1.4 Chemical Admixtures ............................................................ 16
2.4.2 Proportioning of CPB Mixes ............................................................. 17
2.4.2.1 Aggregate Grading ................................................................ 17
2.4.2.2 Cement Content ..................................................................... 17
2.4.2.3 Water Content ........................................................................ 18
2.4.3 Manufacturing Equipment and Manufacture .................................... 19
2.4.3.1 Batching Equipment .............................................................. 19
2.4.3.2 Mixer ..................................................................................... 19
2.4.3.3 Molding Equipment ............................................................... 20
2.4.3.4 Curing Chamber .................................................................... 22
2.5 Mechanical Properties of Paving Blocks ...................................................23
2.5.1 Abrasion Resistance .............................................................................24 2.5.2 Resistance to Freezing and Thawing ....................................................27 2.5.3 Resistance to Deicing Chemicals .........................................................30 2.5.4 Compressive Strength ...........................................................................31 2.5.5 Tensile Strength ....................................................................................32 2.5.6 Slip and Skid Resistance ......................................................................33
2.6 Structural Design of Concrete Paving Block ............................................ 34
2.6.1 Sub Layers ......................................................................................... 37
Page 12
xii
2.6.2 Bedding Course ................................................................................. 39
2.6.3 Edge Restraint ................................................................................... 40
2.6.4 Concrete Blocks ................................................................................ 43 2.6.5 Drainage ............................................................................................ 47
2.7 Installation of Concrete Block Paving ...................................................... 49 2.7.1 Sub grade Preparation ....................................................................... 49
2.7.2 Sub base and Base Preparation .......................................................... 50
2.7.3 Preparation of Restraints ................................................................... 51
2.7.4 Bedding Course Preparation .............................................................. 51
2.7.5 Pavers Installation ............................................................................. 52
3. EXPERIMENTAL STUDY ................................................................................. 54
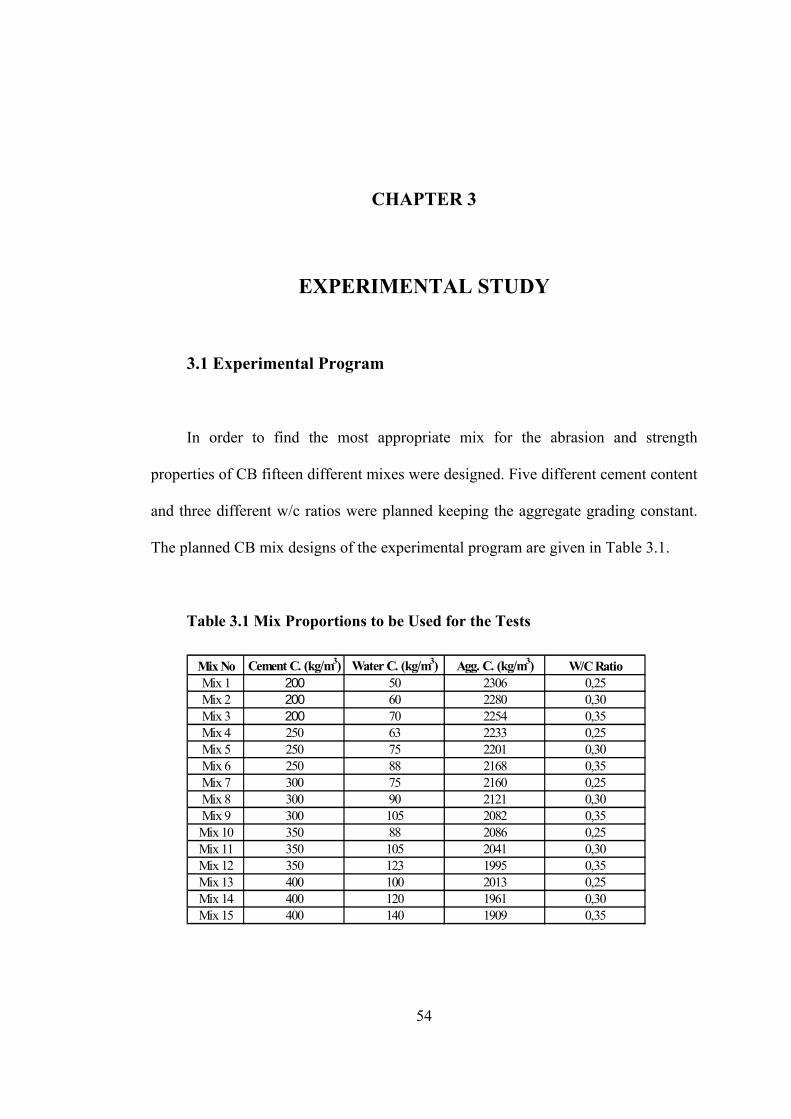
3.1 Experimental Program .............................................................................. 54 3.2 Materials Used .......................................................................................... 55
3.2.1 White Portland Cement ..................................................................... 55 3.2.2 Aggregates ......................................................................................... 56
3.2.3 Mixing Water .................................................................................... 59
3.3 Experimental Procedures and Data ........................................................... 59
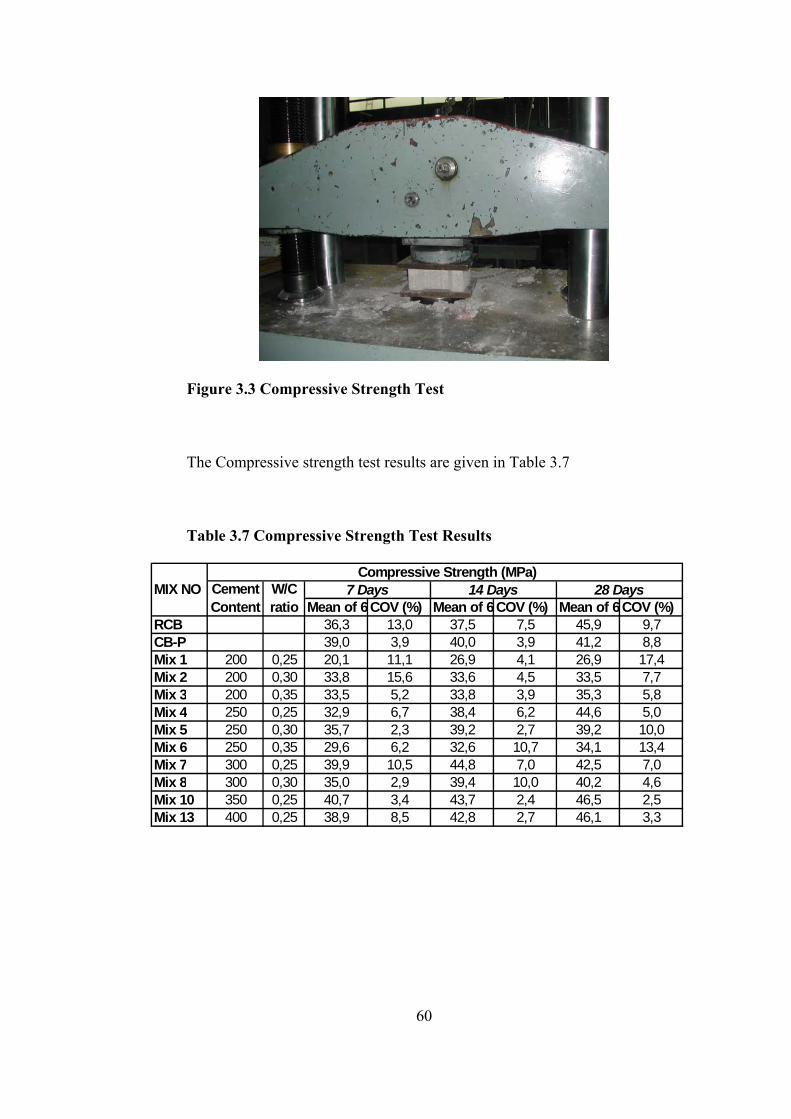
3.3.1 Compressive Strength Tests............................................................... 59 3.3.2 Tensile Splitting Strength Tests......................................................... 61
3.3.3 Abrasion Resistance Tests ................................................................. 62
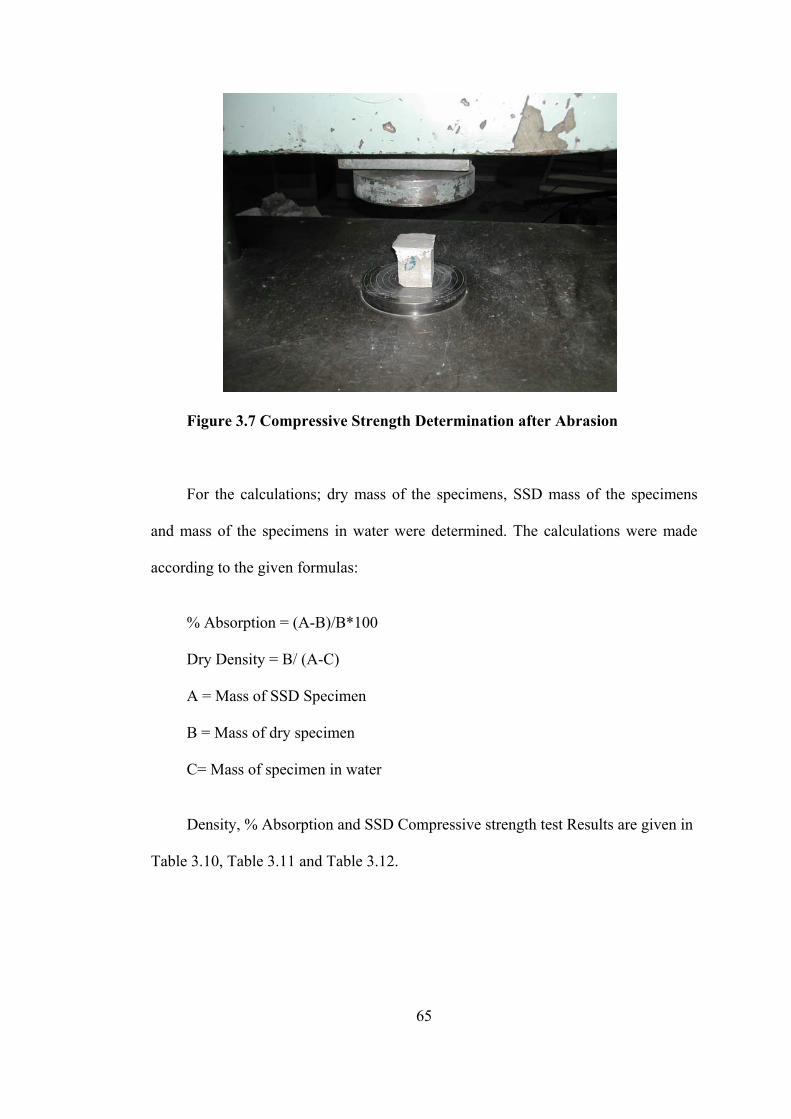
3.3.4 Water Absorption, Density and SSD Compressive Strength Tests ... 64
4. DISCUSSION OF RESULTS ............................................................................. 68
4.1 Effects of Cement Content on the Properties of CBs ............................... 68
4.1.1 Compressive Strength ....................................................................... 68
Page 13
xiii
4.1.2 Abrasion Resistance........................................................................... 70
4.1.3 Other Performance Parameters .......................................................... 71 4.2 Correlations between Performance Tests ................................................. 73
4.3 Evaluations of the Abrasion Test ............................................................. 76
5. SUMMARY AND CONCLUSIONS.................................................................... 85
5.1 Summary ................................................................................................... 85
5.2 Conclusions .............................................................................................. 85 5.3 Recommendations for Future Studies ...................................................... 87
6. REFERENCES ..................................................................................................... 88
Page 14
xiv
LIST OF TABLES Table 2.1 Comparison of Concrete Paving Block with Asphalt and Rigid Concrete [Aeon's Construction Products Limited 2003]..............................................................6 Table 2.2 TS, ASTM and BS Physical Requirements for CPB [TS 2824, ASTM C 936, BS 6717].............................................................................................................. 9 Table 2.3 Standard Dimensions of Flags [Pritchard and Dawson 1999]....................11 Table 2.4 The Required Transverse Strengths of Flags [Pritchard and Dawson 1999] .....................................................................................................................................11 Table 2.5 Minimum Concrete Thickness for Various Stone Size [Concrete Manufacturers Association Publication 2002]............................................................14 Table 2.6 Recommended Aggregate Grading for Making Paving Blocks [Cement and Concrete Institute]...................................................................................................... 15 Table 2.7 Bulk Characteristics of Concrete Pavers [Ghafoori and Smith 1996].......................................................................................................................... 29 Table 2.8 Strength Requirements for Pavers [Bullen 1994]...................................... 33 Table 2.9 Pendulum Values [Pritchard and Dawson]................................................ 34 Table 2.10 Laying Course Material Categories [Pritchard 2001].............................. 39 Table 2.11 Laying Course Material Grading [Pritchard 2001].................................. 40 Table 2.12 Paving Unit Shape, Thickness and Laying Pattern [Concrete Masonry Association of Australia 1997b]................................................................................ 46 Table 2.13 Jointing Course Sand Grading [Pritchard 2001]...................................... 53 Table 3.1 Mix Proportions to be Used for the Tests.................................................. 54 Table 3.2 The Chemical Properties of Cement.......................................................... 56 Table 3.3 The Physical and Mechanical Properties of Cement................................. 56
Page 15
xv
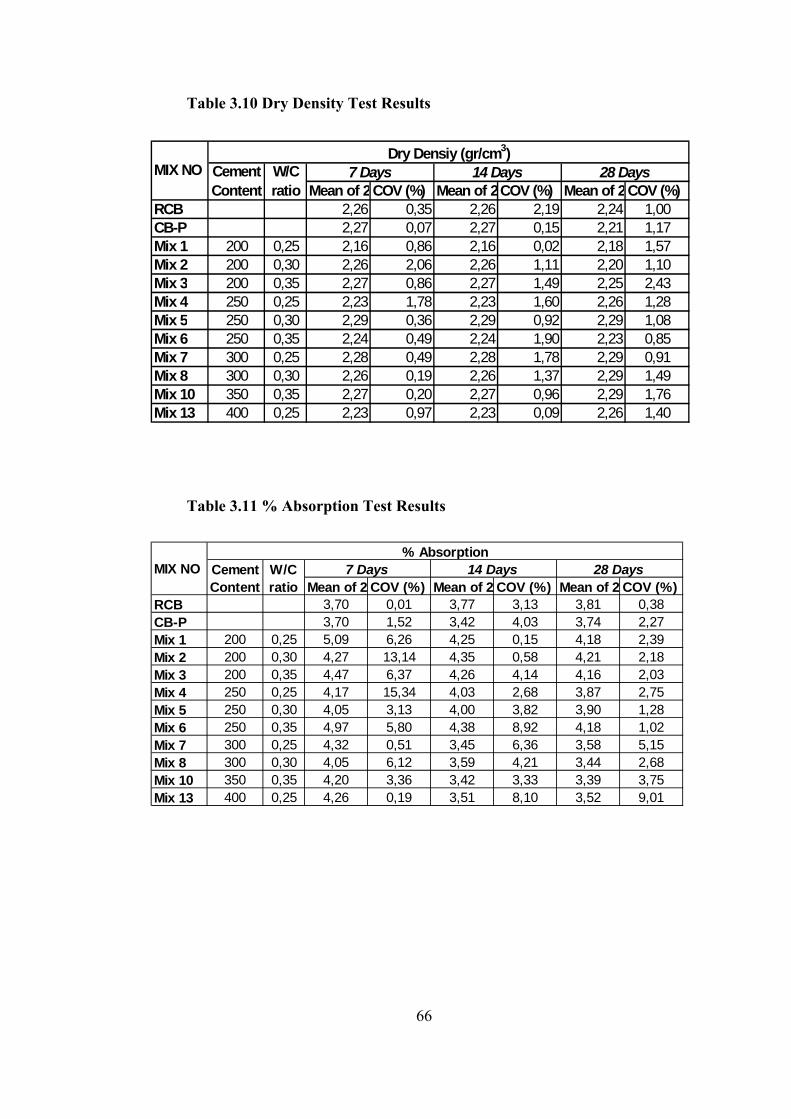
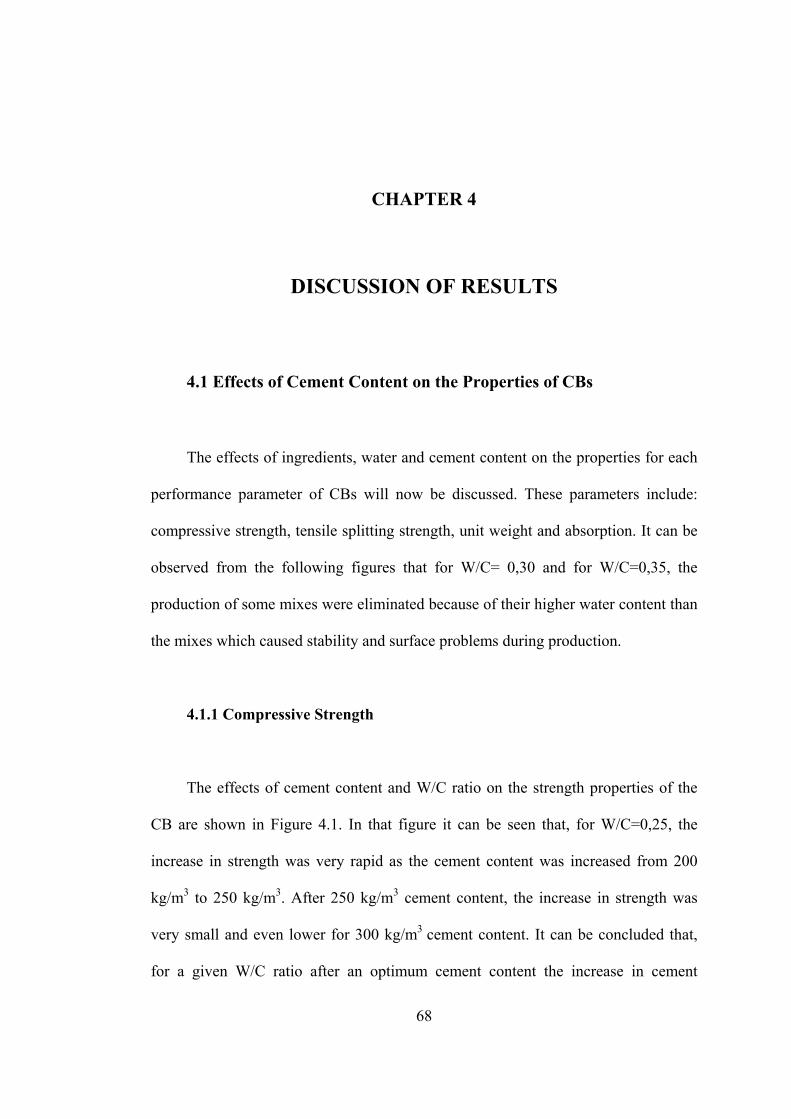
Table 3.4 Properties of Aggregates............................................................................ 56 Table 3.5 Aggregate Grading..................................................................................... 57 Table 3.6 Volumetric Percentages for Combined Grading.........................................57 Table 3.7 Compressive Strength Test Results........................................................... 60 Table 3.8 Tensile Splitting Test Results.................................................................... 62 Table 3.9 Abrasion Resistance Test Methods............................................................ 64 Table 3.10 Dry Density Test Results......................................................................... 66 Table 3.11 % Absorption Test Results...................................................................... 66 Table 3.12 SSD Compressive Strength Test Results..................................................67 Table 4.1 Slopes of Regression lines after Each Number of 22 Revolutions.............84 Table 4.2 Relative Change of Slopes with Respect to 8*22 Revolutions.................. 84
Page 16
xvi
LIST OF FIGURES
Figure 2.1 Paving Block Applications [Interpave 2003]..............................................7 Figure 2.2 Paving Block Applications for Traffic Management [Interpave 2003].......7 Figure 2.3 Concrete Flag Paving Applications [Interpave 2003]...............................10 Figure 2.4 Production of CB by the Dry-Mixing Method..........................................12 Figure 2.5 Aggregate Silos and Weigh Batching........................................................19 Figure 2.6 Pan Type Mixer.........................................................................................20 Figure 2.7 Stationary Equipment................................................................................21 Figure 2.8 Production with Manual Equipment.........................................................22 Figure 2.9 Curing Chamber........................................................................................23 Figure 2.10 Typical Block Paving [Concrete Masonry Association of Australia 1997b].........................................................................................................................37 Figure 2.11 Domestic Light Traffic Areas - Adjacent to a Building [Pritchard and Dawson 1999].............................................................................................................41 Figure 2.12 Light Vehicle and Pedestrian Traffic [Pritchard and Dawson 1999]..... 41 Figure 2.13 Estate Roadway - Light Industrial [Pritchard and Dawson 1999]...........42 Figure 2.14 Estate Roadways - Parking Areas [Pritchard and Dawson 1999]...........42 Figure 2.15 Heavy Industrial Traffic [Pritchard and Dawson 1999]..........................42 Figure 2.16 Typical Shapes of Paving Blocks[Concrete Masonry Association of Australia 1997b]..........................................................................................................44
Page 17
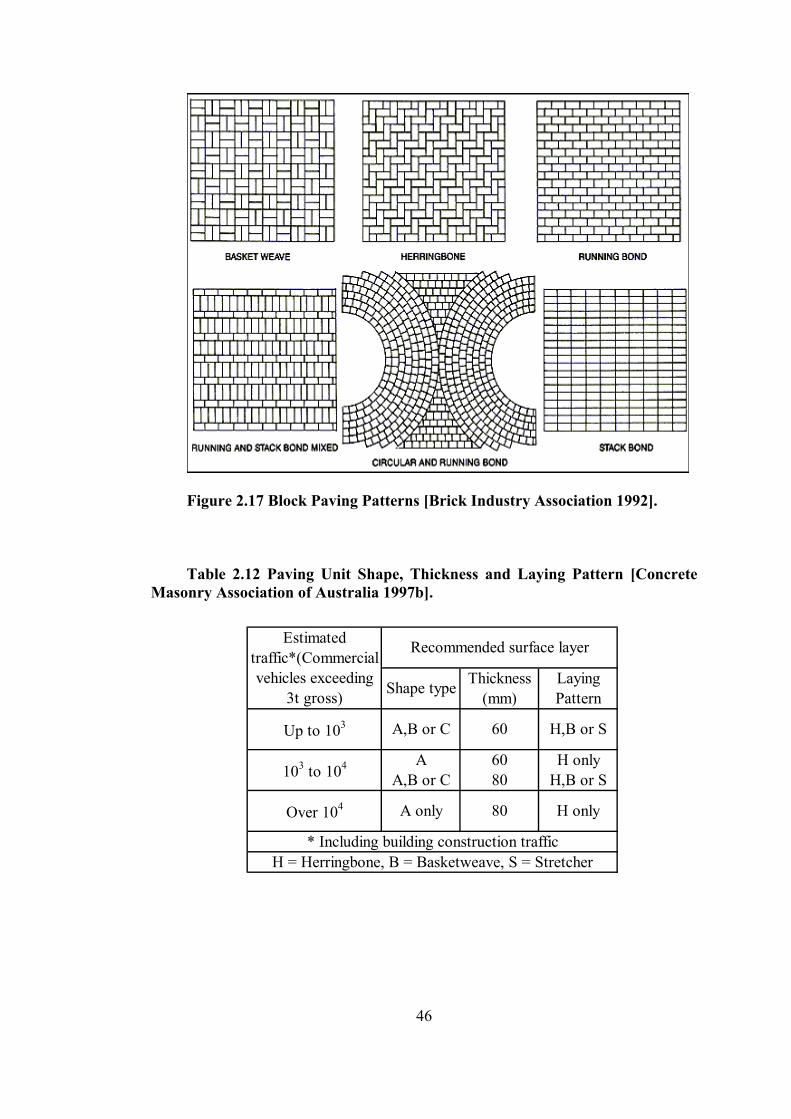
xvii
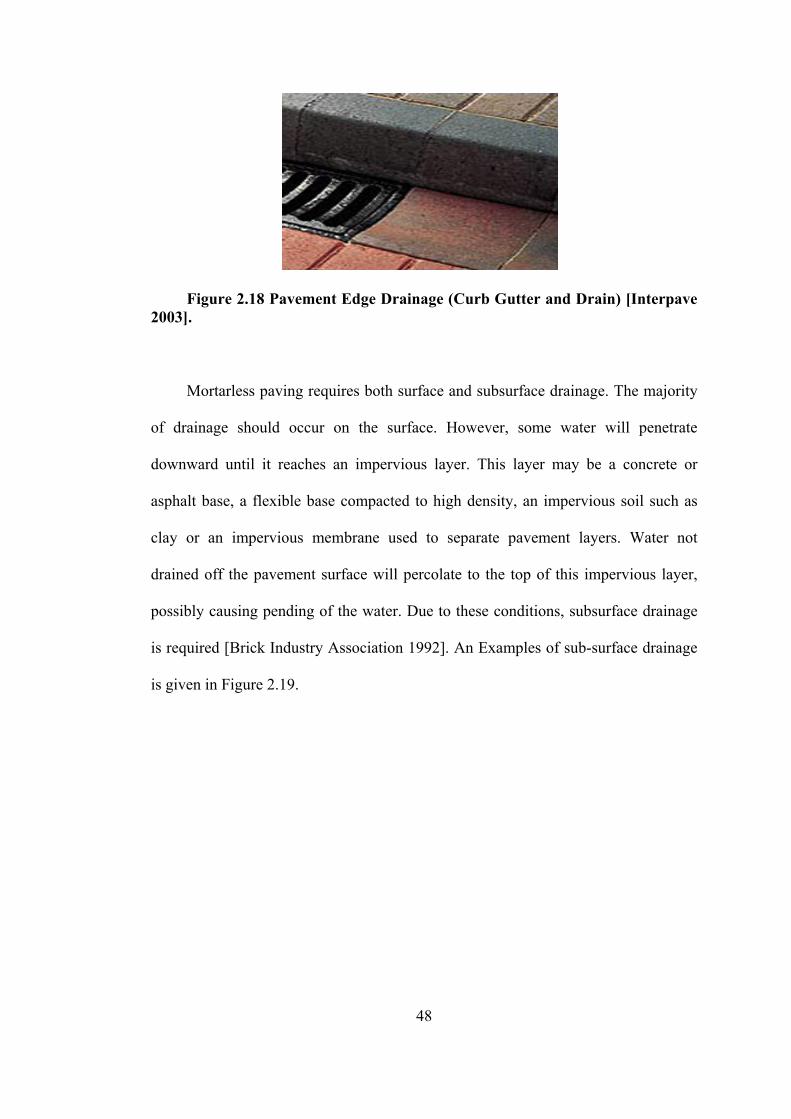
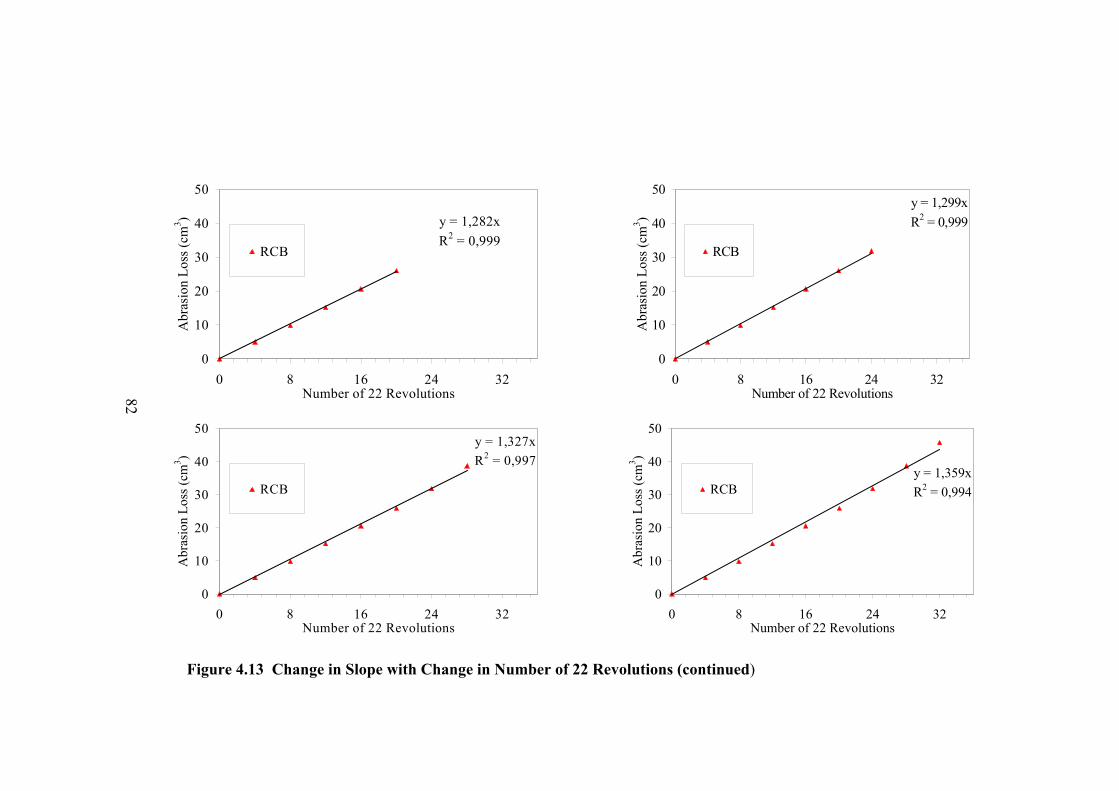
Figure 2.17 Block Paving Patterns [Brick Industry Association]...............................46 Figure 2.18 Pavement Edge Drainage [Interpave 2003].............................................48 Figure 2.19 Draining directly into Subsurface [Concrete Masonry Association of Australia 1997c]......................................................................................................... 49 Figure 2.20 Setting Bed Preparation and Installation of Blocks................................ 52 Figure 3.1 Combined Aggregate Grading and TS 706 Limits................................... 58 Figure 3.2 Combined Aggregate Grading and Recommended Aggregate Grading..58 Figure 3.3 Compressive Strength Test....................................................................... 60 Figure 3.4 Splitting Apparatus................................................................................... 61 Figure 3.5 Tensile Splitting Strength Test ................................................................ 61 Figure 3.6 Böhme Testing Apparatus........................................................................ 63 Figure 3.7 Compressive Strength Determination after Abrasion .............................. 65 Figure 4.1 Compressive Strength Test Results.......................................................... 69 Figure 4.2 Abrasion Resistance Test Results..............................................................71 Figure 4.3 Tensile Splitting Strength Test Results.....................................................72 Figure 4.4 Density Test Results................................................................................. 72 Figure 4.5 Absorption Test Results........................................................................... 73 Figure 4.6 Compressive Strength-Abrasion Loss Relation........................................ 74 Figure 4.7 Density-Compressive Strength Relation.................................................. 74 Figure 4.8 Density-Tensile Splitting Strength Relation............................................. 75 Figure 4.9 Density-Abrasion Loss Relation............................................................... 75 Figure 4.10 Density-% Absorption Relation............................................................. 76 Figure 4.11 Abrasion Resistance Test Results of Concrete Blocks........................... 78 Figure 4.12 Abrasion Test Results of Özkul Mixes................................................... 80 Figure 4.13 Change in Slope with Change in Number of 22 Revolutions.......... 81, 82
Page 18
1
CHAPTER 1
INTRODUCTION
1.1 General Concrete block pavements (CBPs) are formed from individual solid blocks that
fit closely next to one another to form a pavement surface. A typical CBP is placed
on a thin bed of sand overlaying a sub base. CBP can be placed with a variety of
shapes and patterns. There are joint spaces between blocks. These spaces are filled
with sand having suitable grading. The blocks are restrained from two sides by edge
restraints.
CPBs are manufactured from semi-dry mixes. During manufacturing process
vibration and pressure is applied to the mix. By this process dense and strong CPB
can be achieved to form strong and durable paving surfaces. Moreover interlocking
behavior of CBP gives the ability of spreading loads to larger areas.
CBP has several advantages over asphalt and concrete pavements in their
structural, aesthetics, construction and maintenance, operational and economical
characteristics which will be presented in detail in Chapter 2.
Page 19
2
Like other pavement surfaces, the design of CBP is based upon environmental,
traffic, sub grade support and pavement materials conditions and their interactive
effect. Therefore, CBP needs an in depth design process to achieve good
performance.
1.2. Object and Scope The performance of CBP depends on mechanical properties of concrete blocks
and structural design of the pavement, for a serviceable CBP, both factors have to be
studied. CBP in our country shows some performance problems that can be grouped
into two: structural design and mechanical deficiencies of concrete blocks.
Inadequate sub layers thicknesses and material properties, inadequate drainage,
incorrect joint sand gradation and joint spacing are items that can be count in
structural design deficiencies. Mechanical deficiencies are: inadequate abrasion
resistance, compressive strength, and indirect tensile strength, freezing-thawing and
de-icing chemical resistance.
Concrete blocks are manufactured by dry mixes that are exposed to vibration
and pressure during the manufacturing process. The literature about mix design of
concrete blocks which are produced by this special manufacturing technique with
different cement types is quite inadequate.
The objective of this research is to form the background knowledge about CBP
to exterminate the performance problems and to evaluate the abrasion and
mechanical properties of Concrete Blocks (CBs) produced by a white portland
cement.
Page 20
3
For this purpose, in Chapter 2 detailed knowledge about structural design of
CBP and mechanical properties of concrete blocks will be given. Than the research
will concentrate on the mechanical properties of concrete blocks which will be
discussed in Chapter 3. Mix designs with different W/C ratios and cement contents
will be prepared to form most appropriate mix design for CBs. White Portland
cement will be used for mix designs. Abrasion resistance, compressive strength,
tensile splitting strength, unit weight and % absorption will be the performance
criteria’s to be tested. The designed specimens will be compared with concrete
blocks in use which were produced by concrete paving blocks producers. In Chapter
4 detailed discussions about the findings of this research will be presented. Chapter 5
will present a summary, conclusion and suggestions for possible future research.
Page 21
4
CHAPTER 2
LITERATURE REVIEW AND BACKGROUND
2.1 History of Concrete Block Pavement
Road paving with tightly fitted stones resting on a flexible granular base dates
back to the Roman Empire. Even though, stones are still being used as paving
material the modern version of this road technique utilizes concrete blocks instead.
[Rada et. al. 1990]. The use of CBP for roads began in the Netherlands after the
Second World War. Brick paving was the traditional surface material in the
Netherlands before the Second World War. Because of the coal shortages brick had
been unavailable as a result CBP had been used as a substitute. The substitution
became hugely successful. After the war, the roads of Rotterdam were almost
entirely constructed from concrete block paving [Pritchard and Dawson 1999]. This
technology quickly spread to Germany and Western Europe as a practical and
attractive method useful for both pedestrian and vehicular pavement [Rada et. al.
1990]. Over the past 40 years CBP has gained rapid popularity as an alternative to
conventional concrete and asphalt pavements. The CBP is now a standard paving
surface in Europe where over 100,000,000 m2 are placed annually [Ghafoori and
Mathis 1998].
Page 22
5
2.2 Features of Concrete Block Pavements Concrete paving blocks are utilized in a variety of commercial, municipal and
industrial applications. The primary reasons for selecting CBP over other paving
surfaces are low maintenance, ease of placement and removal, reusage of original
blocks, aesthetics appeal, and immediate usage after installation or repair [Ghafoori
and Mathis 1998]. A comparison of the advantages and disadvantages of CBP over
rigid and flexible pavements is given in Table 2.1. As seen in that table CBPs are
able to withstand heavy loads and resists aggressive environments as good as a rigid
concrete pavement. Beside that, with its wide range of colors, textures and patterns,
CBPs provide excellent aesthetic appearance opportunities.
2.2.1 Aesthetic Appeal Concrete block paving is available in a constantly expanding variety of colors,
shapes and textures and can be installed in numerous bonds and laying patterns
[Interpave 2003]. Concrete pavers offer unique aesthetic benefits when compared to
other forms of pavement in their ability to integrate and harmonize with both the
built and natural environment [Concrete Masonry Association of Australia 1997a]. In
Figure 2.1 some applications of paving blocks are provided [Interpave 2003].
Page 23
Table 2.1 Comparison of Concrete Paving Block with Asphalt and Rigid Concrete [Aeon's Construction Products Limited 2003]. ATTRIBUTE SEGMENTAL PAVERS ASPHALT RIGID CONCRETE
StrengthGood compressive strength. Can be controlled as required Poor Good
Resistance to weathering
Good Poor Good
Load transferGood Poor Good
Speed of construction
Fast Fast Slow (Requires curing)
Trenching and reinstatement
Readily excavated by hand methods
Requires use of jackhammer
Difficult and expensive to excavate and restore
RecyclingEasily accomplished without reprocessing
Materials requires to be reprocessed
Expensive, material requires reprocessing
AppearanceVery good Poor Moderate-only limited control
of colour and texture
DurabilityGood Moderate Good
Resistance to heavy axle loads
Very good Good Very good
Concentrated wheel loads
Very good Poor Very good
Fuel and oil skidding
Good; Satisfactory up to 60 Km/h
Poor; Satisfactory
Good; Good
Inıtial costModerate Low High
Maintenance costLow High High
Salvage volueHigh, easily recycled Medium Low
ECONOMY
STRUCTURAL FEATURES
CONSTRUCTİON AND MAINTENANCE
AESTHETICS
OPERATIONAL
6
Page 24
Figure 2.1. Paving Block Applications [Interpave 2003] CBPs offer numerous opportunities in residential and pedestrian areas by their,
light reflection, water absorption, noise generation features and are often used for
traffic management (Figure 2.2.) [Concrete Masonry Association of Australia 1997a,
Interpave 2003].
Figure 2.2. Paving Block Applications for Traffic Management [Interpave
2003].
7
Page 25
8
2.2.2 Construction and Maintenance
Maintenance cost can be kept low as it is possible to rehabilitate areas of
concrete segmental pavement without heaving to purchase a new surface [Concrete
Masonry Association of Australia 1997a]. Repair to underground utilities or local
deformations in the base materials can be accessed by simply removing and
replacing the concrete blocks (pavers). Pavement materials are not wasted and
jackhammers or heavy equipment are not required [Ackerstone 2003].
2.2.3 Structural and Operational Characteristics The uniquely flexible surface course of concrete block paving, with its
characteristic interlock, prevents the block from moving in isolation and dissipates
applied loads sideways and diagonally downwards through the sub-base to the
foundations. Combined with the high compressive strengths of the blocks, this
provides a working surface with remarkably high load bearing capacity. Plate-
bearing tests have shown that block paving with its bedding sand performs
significantly better than a similar thickness of bituminous surface [Interpave 2003].
Concrete block paving is extremely durable. It withstands severe frost attack
and repeated freeze-thaw cycles and can be used in harsh environments. It can be laid
on airfields or highways where temperatures fall below –30 degrees centigrade
[Interpave 2003]. Physical requirements of CPB as specified by TS, ASTM and BS
are given in Table 2.2.
Page 26
9
ote: A2 abrasion class is for areas to be subject to vehicular traffic exceeding 1.5 msa. S2 skid resista
Concrete block pavements are highly resistant to the effects of braking,
swelling or acceleration of vehicles. Because of these features and their immunity to
softening by fuel and oil spillages, concrete segmental pavements are suited for use
at bus stops, bus depots and terminals, intersections, pedestrian cross-walks, in heavy
duty pavements and aircraft aprons [Concrete Masonry Association of Australia
1997a].
Table 2.2. TS, ASTM and BS Physical Requirements for CPB [TS 2824, ASTM C 936, BS 6717]
Skid Resistance _____ _____For S2 Class
C scale units>35 For S3>45
Absorption Individual Unit Abs<%6
Average Absorption<%5
Individual unit<%7_____
Resistance to Frz-Thw. Weight Loss< 0.5kg/m2 Weight Loss< %1
(Subject to 50 cycles)
W2 Weathering Class: Mass Loss < 1kg/m2
Ind. Loss<1.5 kg/m2
Abrasion Resistance
V. Loss< 15cm3/50cm2
(Exp. to Severe Abr.)
V. Loss<15cm3/50cm2
Average Thick. Loss<3mm
For A2 Abrasion Class: Dgr. of Abr.< 23mm
Indirect Tensile Str.
Average Str.>3.5 MPa Individual Str.>2.8MPa (Tensile Splitting Str.)
_____Average Str.>3.9 MPa Individual Str.>2.9MPa (Three Point Bending)
Compressive Strength _____ Average Str>55MPa
Individual Str.>50MPa _____
Dimensional Requirements Length/Thickness<4
Length/Thickness<4 Surface Area<0.065m2
tmin>60mmSurface Area<295 mm2
TS 2824 ASTM C 936 BS 6717 Part 1
Nnce class is suitable for use in pedestrian areas and paving blocks of class S3 are suitable for use
in vehicular areas [BS 6717].
Page 27
2.3 Concrete Flag Paving In British Standards, a concrete paving block is defined as a precast concrete
element whose work size fits within a (295mm) square. Any larger precast paving
unit is named as flag [Pritchard and Dawson 1999]. In Turkish Standards concrete
paving blocks referenced to TS 2824. In this standard there is not an area limit. But,
the length/thickness ratio is limited. This ratio must be equal to or smaller than 4.
The concrete blocks out of this range are referenced to TS 213. Typical flag paving
applications can be seen from Figure 2.3.
Figure 2.3. Concrete Flag Paving Applications [Interpave 2003].
The standard dimensions of concrete flags are given in Table 2.3. Flag paving
has similar usage, design and construction properties with block paving. The main
difference is flag paving has larger dimensions. Three point bending becomes
important for flag paving as opposed to tensile splitting strength. The required
transverse strength of British Standard flags tested in three point bending to BS 7263
Part 1 is given in Table 2.4.
10
Page 28
11
able 2.4. The Required Transverse Strengths of Flags [Pritchard and Daws
A flag paved area is primarily designed for pedestrian use. However by careful
selection of the appropriate flag in conjunction with the correct method of bedding,
certain sizes of flags can sustain trafficking by light vehicles and frequent overrun by
commercial vehicles. For lighter trafficked, mainly pedestrian areas a mortar laying
course is sufficient but for areas subject to regular vehicular overrun small element
flags bedded on a sand laying course, with sand joints, are necessary. It is essential to
maintain the structural integrity of the surface course to prevent water penetration
leading to deterioration of the sub-layers and sub grade or loss of interlock resulting
in direct wheel loading to the underlying sub-layers [Pritchard 2001].
Table 2.3. Standard Dimensions of Flags [Pritchard and Dawson 1999].
ABCDEFG
Flag Type
600 x 900
Nominal size (mm) Work size (mm) Thickness (mm)
450 x 450400 x 400300 x 300
598 x 448
448 x 448 398 x 398298 x 298
600 x 450600 x 600600 x 750
598 x 598598 x 748598 x 898
50 or 6350 or 6350 or 6350 or 7050 or 6550 or 60
50 or 63
Ton 1999].
50 mm 60 mm 63 mm 65 mm 70 mmA 8.3 12.7B 11.1 16.9C 11.1D 11.1E 9.6 18.8F 9.1 15.4G 9.6 13.8
Flag typeMinimum failing load (kN)
Page 29
2.4 Production of Concrete Blocks There are two common methods of producing precast concrete: a) Wet mix, b)
Dry mix. In wet mix fresh concrete is placed and compacted into moulds, stripping
the moulds when adequate strength has been reached. However in a dry mix, a semi-
dry cohesive concrete mix is placed in the mould, which is later, compacted and
extruded (pushed out) from the mould, right after compaction. (Figure 2.4). The units
are then cured and stored. This latter process is commonly used in the manufacture of
concrete masonry and paving units as it is the most economic way of producing large
volumes of bricks, blocks and pavers [Concrete Manufacturers Association
Publication 2002].
Figure 2.4 Production of CB by the Dry-Mixing Method
12
Page 30
13
2.4.1 Material Properties The materials used in the production are Portland Cement as the binder, coarse
aggregate and water as the other mix ingredients. In this section requirements for
these material preparation will be briefly discussed.
2.4.1.1 Portland Cement Portland cement is the binder used for the production of concrete blocks just
like any other concrete products. In choosing a portland cement for the manufacture
of CBPs, rate of strength gain and sensitivity to curing should be considered
[Concrete Manufacturers Association Publication 2002].
2.4.1.2 Aggregates Aggregates form the bulk of CB. They significantly affect the cost and quality
of the final product and the ease with which the products are manufactured and
finished. Aggregates used are mostly derived from solid rock, which is crushed or
has been broken down by weathering. Alternative aggregates or waste products such
as furnace clinker and furnace bottom ash, fly ash, crushed burnt clay brick and slag
are also used extensively in the manufacture of concrete masonry units, where
available. All sources of these aggregates should be checked to see if they are of
adequate quality. This might be done by testing the aggregates in a laboratory or by
reference to the successful service performance of the aggregates in concrete, say
over a 5-year period [Concrete Manufacturers Association Publication 2002].
Page 31
14
The performance of aggregates at the molding stage and in the hardened block
depends on the combined effects of particle size, grading, particle shape, and
hardness. Each of these properties is discussed below [Cement and Concrete Institute
2001].
a) Size
The recommended maximum nominal size of aggregate is 13.2 mm. However,
the maximum size generally used in practice is 9.5 mm. Smaller sizes (4.75 mm)
may be specifically selected to obtain a particular surface texture. Generally, the use
of coarse particles results in savings in binder provided the mix is properly
proportioned. If coarse aggregate particles are too big, or if too much coarse
aggregate is used in the mix, it may be difficult to achieve good compaction and
acceptable surface texture [Cement and Concrete Institute 2001]. The size of stone
should not exceed about one quarter of the thickness of the concrete item being
precast [Concrete Manufacturers Association Publication 2002] . The minimum
concrete thickness for various stone size is given in Table 2.5.
Table 2.5. Minimum Concrete Thickness for Various Stone Size [Concrete
Manufacturers Association Publication 2002]. Stone size (mm) 6.7 9.5 13.2 19.0 Minimum concrete thickness (mm) 30 40 50 60
b) Grading
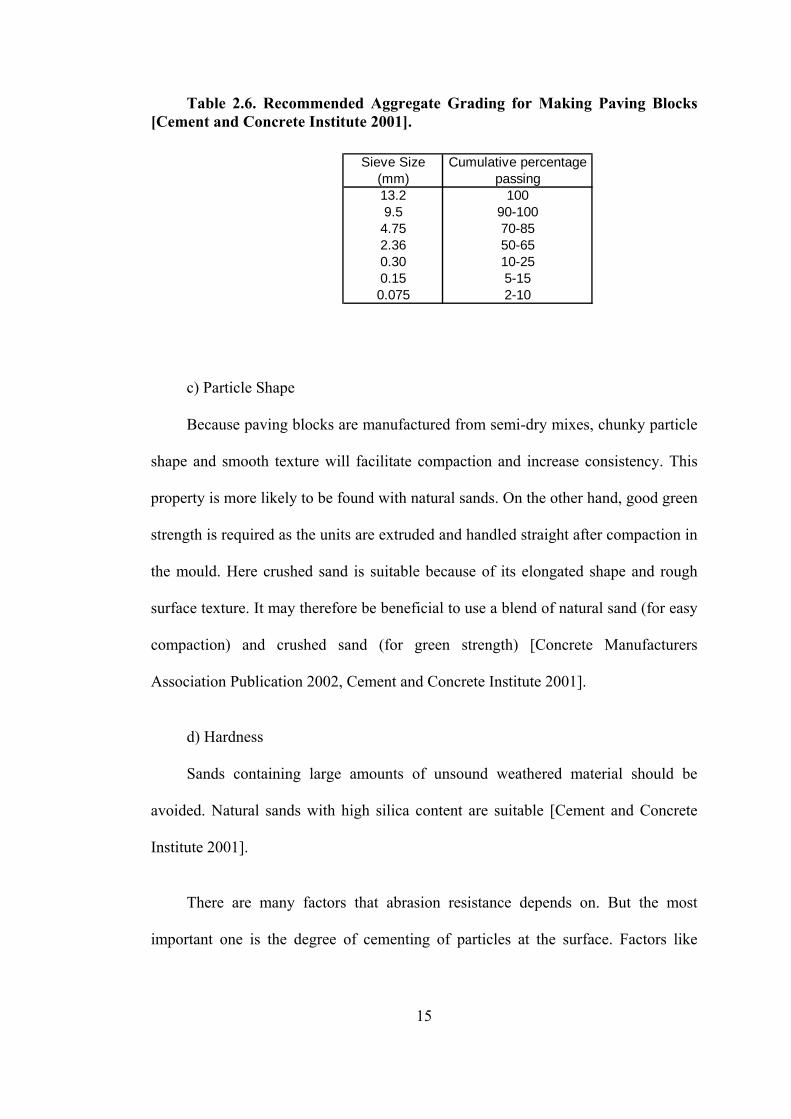
Continuous grading will facilitate compaction. Guidelines for grading are given in Table 2.6.
Page 32
Table 2.6. Recommended Aggregate Grading for Making Paving Blocks [Cement and Concrete Institute 2001].
0.075
10090-10070-8550-6510-255-152-10
4.752.360.300.15
Sieve Size (mm)
Cumulative percentage passing
13.29.5
c) Particle Shape
Because paving blocks are manufactured from semi-dry mixes, chunky particle
shape and smooth texture will facilitate compaction and increase consistency. This
property is more likely to be found with natural sands. On the other hand, good green
strength is required as the units are extruded and handled straight after compaction in
the mould. Here crushed sand is suitable because of its elongated shape and rough
surface texture. It may therefore be beneficial to use a blend of natural sand (for easy
compaction) and crushed sand (for green strength) [Concrete Manufacturers
Association Publication 2002, Cement and Concrete Institute 2001].
d) Hardness
Sands containing large amounts of unsound weathered material should be
avoided. Natural sands with high silica content are suitable [Cement and Concrete
Institute 2001].
There are many factors that abrasion resistance depends on. But the most
important one is the degree of cementing of particles at the surface. Factors like
15
Page 33
16
surface texture, shape, cement content, compaction and curing are therefore
important [Cement and Concrete Institute 2001].
Assuming that aggregate particles are well cemented at the surface of the block,
the service life of concrete blocks can be extended by using the harder aggregate
types for most modes of wear. To enhance wear resistance, selected aggregates may
be used in a richer topping layer about 15mm thick molded simultaneously with the
base concrete [Cement and Concrete Institute 2001].
2.4.1.3 Pigments
Quality pigments are commercially available to add color to paving blocks.
Dosage, which will depend on the color selected and the natural color of the
aggregate and cement being used, is generally 5%, but not more than 10%, by mass
of the cement. Trial castings are required to determine the correct dosage because the
color of the finished product in a dry state is influenced by density, curing and
surface texture [Cement and Concrete Institute 2001].
2.4.1.4 Chemical Admixtures
Concrete paving blocks are manufactured from semi-dry mixtures which
possess poor flow properties even under vibration. Using a water-reducing or
plasticizing admixture to improve compactibility may be cost-effective [Cement and
Concrete Institute 2001].
Page 34
17
2.4.2 Proportioning CPB Mixes
Proportioning involves finding the best aggregate grading, aggregate: cement
ratio and water content, for the specific block making equipment and the way in
which it is operated. Each of these aspects is discussed in the following sections
[Cement and Concrete Institute 2001].
2.4.2.1 Aggregates Grading
In general, the aggregate should be graded to permit full compaction of the mix
with the least effort. If full compaction is not achieved, voids have a disproportionate
effect on strength [Cement and Concrete Institute 2001]. Good compaction will be
facilitated by using aggregates which are continuously graded (and have good
particle shape). A grading envelope for aggregates which has been found suitable in
South Africa was given in Table 2.6. The envelope should be used for guidance only
as it does not take particle shape into account; materials having a grading outside the
suggested envelope may give satisfactory results.
2.4.2.2 Cement Content
The cement content to achieve the required strength level will depend on the
type of cement, rate of strength gain, degree of compaction [Cement and Concrete
Institute 2001]. The only accurate method of establishing the optimum cement
content is through a series of trials, using the machine intended for production, in
Page 35
18
which cement content is varied and the physical properties monitored [Cement and
Concrete Institute 2001].
2.4.2.3 Water Content
The optimum moisture content (OMC) for molding depends on the materials
being used, quality of vibration, and molding equipment. Generally, the coarser the
particles are graded and the greater the compactive effort, the lower will be the
OMC. Using moisture content below OMC will hamper good compaction and may
necessitate longer periods of vibration which in turn will reduce output. Lack of
compaction will reduce durability. Using too much water will result in a reduction of
density and may cause units to stick in the mould and thus make extrusion difficult,
or cause deformation of the units after extrusion. It must be noted that certain
pigments, because of their particle shape, can have a significant effect on OMC
[Cement and Concrete Institute 2001].
Page 36
2.4.3 Manufacturing Equipment and Manufacture
2.4.3.1 Batching Equipment
Raw materials are first delivered to silos and bins. From here, cement and
aggregates are weighed automatically to predetermined quantities (Figure 2.5).
Figure 2.5 Aggregate Silos and Weigh Batching 2.4.3.2 Mixer
Because a semi-dry mixture is used to mould concrete paving blocks, effective
mixing can be done with pan and trough mixers. Drum-type mixers are unsuitable.
The size of the pan mixer must be related to production so that batches are used up
within a reasonable time, i.e. before workability is reduced by moisture loss or
hydration of the cement [Cement and Concrete Institute 2001]. A pan mixer is shown
in Figure 2.6.
19
Page 37
Figure 2.6 Pan Type Mixer
2.4.3.3 Molding Equipment
Unlike bricks and blocks used for masonry, paving blocks must be dense
(fullest possible compaction to be achieved). Equipment must be capable of a high
degree of compaction and satisfactory output. Therefore, a combination of vibration
and pressure is the most effective way of achieving compaction. Molding pressure
should be 10 MPa or more. The optimum period of vibration must be determined
experimentally in the plant but is usually 3 to 12 seconds. Frequency and amplitude
of vibration should be optimized for the specific materials being used and the number
of blocks being molded per cycle [Cement and Concrete Institute 2001]. Good
compaction is more difficult to achieve in thicker blocks and those that have acute
angles. For this reason concrete pavers with a thickness greater than 80 mm are
seldom manufactured [Cement and Concrete Institute 2001]. Block making
equipments can be classified into three: Stationary, egg-laying and manual.
20
Page 38
A stationary equipment (Figure 2.7.) deposits its extruded units on a pallet,
which is removed for subsequent curing. Stationary plants using the pallet system are
almost exclusively used as they are capable of providing the necessary high levels of
vibration and pressure [Concrete Manufacturers Association Publication 2002,
Cement and Concrete Institute 2001].
21
Figure 2.7. Stationary Equipment
An egg-laying type of equipment deposits its extruded units on a concrete slab,
and then moves forward to “lay” the next set of units. Units are removed from the
slab the next day, or, in cold weather, two days after manufacture unless richer mixes
are used [Concrete Manufacturers Association Publication 2002]. Manual equipment
works with the same principle as the stationary equipment (Figure 2.8). The volume
of units produced is less than the stationary equipment.
Page 39
Figure 2.8 Production with Manual Equipment
2.4.3.4 Curing Chamber
Newly molded blocks should be subjected to some form of curing. The form of
curing ranges from the prevention of moisture loss to the use of elevated temperature
and high humidity [Cement and Concrete Institute 2001].
Low-pressure steam curing was one of the earliest accelerated curing methods
used. In this system, saturated steam, at atmospheric pressure and at temperatures
above about 70°C, is introduced into insulated chambers containing racks of ‘green’
blocks (Figure 9). Hydration, the chemical reaction between cement and water which
causes hardening, is accelerated at high temperature in a vapour-saturated
atmosphere. About 70 to 80% of the 28-day atmospheric-temperature cured strength
of the concrete is developed in 18 to 24 hours by this process. Units may thus be
handled and packaged the day after molding [Concrete Masonry Association of
Australia 2000]. However this curing process increases the cost of concrete blocks.
22
Page 40
Figure 2.9 Curing Chamber
2.5 Mechanical Properties of Paving Blocks CBP comprises of concrete blocks bedded and jointed in sand. Therefore, the
overall load carrying capacity of a CBP depends on the properties of these two
constituents, concrete blocks and sand, as well as the interaction between these two.
The slope, size, thickness, laying patterns, etc., are important block parameters
influencing the overall performance of the pavements [Bikasha and Ashok 2002].
However, load carrying capacity is not the only performance parameter of a CBP.
Other serviceability requirements of CBPs can be listed as; skid resistance, abrasion
resistance and resistance to weathering such as freezing-thawing and deicing
chemicals [Dowson 1994]. The indicators of these performance requirements are:
compressive strength, flexural strength, skid resistance, abrasion resistance, freezing-
thawing and deicing chemical resistance.
The mechanical properties of concrete blocks are important for a serviceable
CBP. But, it is very important to notice that just like other flexible pavements,
deficiencies in the under laying layers can not be compensated for by the surface
23
Page 41
24
quality of the pavement [Hodgkinson 1986]. A brief review of literature on the
performance requirements of CBPs, will now be presented.
2.5.1 Abrasion Resistance Abrasion resistance of concrete pavements is a surface property that is mainly
dependent on the quality of the surface layer characteristics [Ghafoori and Sukandar
1995, Humpola 1996]. The top 1-3 mm is the most important part for the abrasion
resistance of the concrete product [Humpola 1996]. Cement content, water-cement
ratio, cement type, aggregate type, the use of pigments and curing regime are the
factors that influence abrasion resistance [Shackel 1994]. Common assumption is
that a correlation exists between CPB strength and abrasion resistance. This indirect
approach can be reasonable, but not always correct [Ghafoori and Sukandar 1995].
The strength of the whole unit can show differences with the top-layer-strength of
CPB due to unequal curing conditions [Humpola 1996]. Humpola, et. al. (1996),
studied the development of compressive strength of overnight mist cured followed by
air cured concrete pavers. Modified version of ASTM C779 developed by The
Concrete Masonry Association of Australia (CMAA) was used for their research. As
a result, Humpola, et. al. (1996), found that the strength increased up to 7 days
then became minimal when pavers void saturation level fell below the required level
for hydration. But, abrasion index measured on units from the same lot of pavers
continued to increase at ages above 180 days.
They concluded that abrasion resistance was not a function of compressive
strength and they stated that abrasion resistance is probably affected by variables
Page 42
25
such as cement content, curing regime and carbonation, all of which influence the
condition of the top surface layer [Humpola, et. al. 1996].
In another study by Humpola, the abrasion resistance of concrete blocks
subjected to different initial curing schemes was determined by Ball Race Test. It
was concluded that mist cured CBPs performed significantly better when compared
to air cured ones [Humpola 1996].
Ghafoori and Sukandar (1995), studied on concrete blocks abrasion resistance
by using ASTM C 779 (Procedure C, Ball bearings) method. An experimental
program was performed to examine various aggregate-cement ratios on bulk and
surface properties of concrete block pavers . Because of the large daily production
and lack of indoor storage capacity nearly all pavers block manufacturers use air
curing although air curing is not recommended for cement-based products. The
specimens used for their experiments were also air cured after fabrication at room
temperature 25 ± 1.7 C for 1 day and than placed outdoors [Ghafoori and Sukandar
1995].
According to this investigation:
• The abrasion resistance of concrete paving blocks is strongly affected by the
aggregate-cement ratio of the matrix. The increase in cement content results in a
more binder rich and dense block surface which in turn increases the surface quality
and the resistance to abrasion. The change in aggregate-cement ratio has a much
greater influence on abrasion resistance than compressive or splitting tensile strength
of concrete pavers
Page 43
26
• There is a correlation between depth of wear and bulk characteristics. The
proposed quadratic equations are found to be an accurate representation of these
relations.
• The testing condition of the specimen has impact on abrasion resistance. The
abrasion resistance of concrete pavers is much better under air-dry conditions than
under wet conditions. The difference is drastically reduced as the cement aggregate
ratio of the mix is increased.
• Finally, as a result of their research, they concluded that for the worst case
scenario (air-cured specimen and wet testing condition) concrete pavers with cement
content of 223 kg/m3 (11.11 percent of total dry mix) provide the surface properties
that meet the maximum limit of 3 mm required by ASTM C 936. And, the minimum
mean compressive strength of 55 MPa required by ASTM C 936 for pavers is
adequate as an indirect measure of abrasion resistance. This cement content,
however, is likely not to be sufficient for adequate freezing and thawing durability or
resistance to deicing salts.
Shackel (1994), summarized the factors affecting the abrasion resistance of
CBPs as follows:
• The abrasion resistance increases with increased cement in the mix.
• Increasing the water/cement ratio lead to a reduction in abrasion resistance.
• For pavers manufactured from off-white cements, the addition of up to a 7%
pigment produced no significant change in abrasion resistance.
Page 44
27
• Mixes with crushed aggregate tended to exhibit higher abrasion than those
manufactured using river gravel.
• Some pigments significantly increase the abrasion resistance.
• Moist curing yielded higher abrasion resistance and compressive strength
than air curing of specimens. Curing condition affected abrasion more than strength.
• Although it is possible to obtain weak correlations between abrasion
resistance and compressive strength. In particular, compressive strength did not
provide a reliable indicator of resistance to wear.
2.5.2 Resistance to Freezing and Thawing The actions of freezing and thawing can result in severe deterioration of all
cementitous products. As water in concrete freezes, hydraulic and osmotic pressures
can develop in the pores of cement paste and aggregate. If these stresses exceed the
tensile strength of the aggregate or cement paste deterioration will occur in the form
of cracking , spalling, or surface scaling [Ghafoori and Mathis 1997; Powers 1975].
Concrete is further damaged by the application of deicing agents. Utilization of
deicing chemicals like sodium chloride and calcium chloride to remove snow and ice
from roads tends to magnify the hydraulic and osmotic pressures that develop in
frozen concrete. Consequently, the potential for deterioration increases which is
usually in the form of surface scaling [ACI 1991].
Current manufacturing practice (vibration and pressure) used in fabrication of
concrete paving blocks can lead to a final product that has a low permeability which
can keep the pore structure from becoming critically saturated. However, lack of
Page 45
28
sufficient amount of entrapped or entrained air still makes paving blocks vulnerable
to freezing and thawing damage. Use of air entrainment is one possible solution, but
the strong vibration used in the manufacturing process cause an undesirable loss of
entrained air. Furthermore, the stiff consistency of the low water-cementitious ratio
mixtures using in paving block inhibits the action of air entraining and makes
measurement of the air content extremely difficult. As a result, specifying a
minimum cementitious content or aggregate-cementitous ratio is the most
appropriate method for assuring adequate freezing and thawing durability [Ghafoori
and Mathis 1998].
There are various accelerated laboratory tests on freezing and thawing
performance of concrete pavers. Ghafoori and Smith (1996) compared ASTM C 67,
ASTM C 666, ASTM C 672 and CSA-A231.2 standards used for the evaluation of
freezing and thawing durability.
For the whole testing program, Ghafoori and Smith (1996), kept the mass
ratio of coarse to fine aggregate uniform at 1:2. In their experiment, the range of
water-cement ratios was fairly narrow (0.21-0.34), governed by the moldability
characteristics of the materials in relation to the needs of the molding process. 7
different aggregate-cement ratios used in this study are shown in Table 2.7.
Page 46
29
Table 2.7 Bulk Characteristics of Concrete Pavers [Ghafoori and Smith 1996].
One of the freezing thawing durability tests was conducted following the
referred to ASTM C 67. The ASTM C 67 test method consists of placing the top of a
brick (or a concrete pavers) unit in a tray with 13mm deep water. The unit is then
subjected to 50 freezing and thawing cycles with one cycle consisting of 20 hours of
freezing at -9° C and 4 hours of thawing at 24° +5.5° C. No more than 1% loss of
material is allowed after 50 cycles in order to satisfy the test according to ASTM C
936 [Ghafoori and Smith 1996]. From the test results N. Ghafoori, D. R. Smith
(1996), observed that keeping concrete pavers mass loss from exceeding the
maximum %1 requirement was achieved with 223 kg/m3 cement content,
corresponding to a compressive strength of approximately 43.5 MPa and an
absorption of 5.7%.
The second test was conducted following the ASTM C 666 test method. In this
test, concrete samples are exposed to continuous cycles of freezing and thawing
[alternatively from 40 to 00F (4.4 to -17.80C)] with each cycle lasting only 2-5 h
[Ghafoori and Mathis 1998]. Ghafoori and Smith (1996), concluded that to complete
300 rapid freezing and thawing cycles using no greater loss than 1% as a test criteria,
Specimen Code
A/C Ratio Cement Cont. (kg/m3)
Density (kg/m3)
Absorption (%)
Comp. Str: (Mpa)
Sp. Tensile Str. (Mpa)
A 9:1 200 2101 5.86 40.32 3.365
B 8:1 223 2116 5.73 43.46 3.634
C 7:1 252 2184 4.72 51.00 4.254
D 6:1 295 2219 4.35 52.75 4.820
E 5:1 356 2255 4.09 61.23 5.667
F 4.5:1 395 2272 3.97 67.04 6.481
G 4:1 447 2317 3.76 75.00 6.688
Page 47
30
pavers required at least 395 kg/m3 cement content under ASTM C 666 conditions.
This means an increase in cement content of 57% over that required under ASTM C 67.
In other words, the exposure conditions of ASTM C 666 required a minimum
compressive strength of 67 MPa and an absorption capacity of no more than 4% to
satisfactorily ensure the requirements of rapid freezing and thawing durability.
Ghafoori and Smith (1996), also studied on CSA-A231.2-M85 which is a
standard developed by Canadian Standard Association. As a result of their researches,
Ghafoori and Smith (1996), concluded that under the exposure conditions of CSA-
A231.2-M85, a minimum cement content of 395 kg/m3 offers adequate resistance to
freezing and thawing with deicing salts. This level of cement content also provides a
compressive strength of 67 MPa and an absorption value of less than 4% like ASTM C
666 [Ghafoori and Smith 1996].
2.5.3 Resistance to Deicing Chemicals
Several standardized procedures have been developed in order to assess the deicer
salt scaling resistance of concrete. These include ASTM C 672, , and CSA-A231.2-M85.
In the ASTM only the top surface of the concrete specimens is exposed to deicing
chemicals, whereas the Canadian test requires total immersion of test samples in salt
solution. ASTM C 672, also known as ponding method is the most widely used deicer
test procedure and it is a basis for several national and international standards [Ghafoori
and Mathis 1997]. Ghafoori and Smith (1996) found that under ASTM C 672
conditions pavers with a minimum cement content of 356 kg/m3 and 395 kg/rn3 did not
display any sign of surface scaling after 50 and 200 cycles respectively. It is concluded
Page 48
31
that, minimum compressive strength of 61.3 MPa and a maximum absorption capacity of
4% ensure freezing and thawing durability with deicing chemicals [Ghafoori and
Smith 1996].
Ghafoori and Mathis (1997) also investigated the relative performance of
concrete block pavers subjected to repeated cycles of freezing and thawing with
deicing chemicals using the specifications of ASTM C 672. Based on the
experimental results Ghafoori and Mathis (1997), observed that the bulk properties
of concrete pavers strongly influenced by the aggregate-cement properties of the
matrix. A decrease in aggregate-cement ratio reduced the porosity and resulted in a
denser, strong, and less permeable product.
2.5.4. Compressive Strength Generally, concrete composes of three phases. Mortar matrix, aggregate and the
interfacial transition zone (ITZ) between the two [Akçaoğlu et. al. 2003]. The
strength of concrete is determined by the characteristics of these phases. In normal
strength concrete, the strength of mortar and the bonding of mortar and coarse
aggregate are limiting factors of strength [Özturan and Çeçen 1997].
In general, volume of all voids in concrete: entrapped air, capillary pores, gel
pores and entrained air ,if present, influences strength of concrete [Neville 1981].
The compressive strength does not provide any direct measure of paver’s durability
but does provide a simple method for deciding the overall quality of a paving unit
[Concrete Masonry Association of Australia 1986].
Page 49
32
Humpola (1996) studied on effect of type of curing and density on paver’s
compressive strength. Humpola (1996) found out that, density and compressive
strength of air and steam cured CBs performed significantly worse as compared with
mist curing ones.
Pavers must provide sufficient strength to resist handling, construction stresses
and traffic. Most specifications require the pavers to exhibit compressive strengths in
the order of 40 MPa. In some specifications the flexural strengths in the range of 3-4
MPa is also required. The test specimens (whole paver , or cube, or cylinder
extracted from pavers), the definition of strength (single, mean, characteristic), the
testing procedures, age and the number of specimens tested shows differences in
different specifications. Because of that comparison of different specifications can be
rather difficult and meaningless [Shackel 1994]. Nevertheless, a worldwide survey of
specifications suggest that, once the influence of test procedures is eliminated, the
minimum compressive strength of a single pavers should exceed 45 MPa to 50 MPa
[Huber et. al. 1984].
2.5.5. Tensile Strength The tensile strength of concrete is approximately % 10 of its compressive
strength. The tensile strength of concrete can be measured by the direct tensile
loading test. However the application of direct tensile load to the test specimens is
rather difficult. For this reason tensile strength of concrete is usually measured by the
flexural (bending) strength of concrete or by the indirect tension test like splitting test
Page 50
[Erdoğan 2002]. Strength requirements for pavers in different standards are given in
Table 2.8.
Table 2.8 Strength Requirements for Pavers [Bullen 1994].
NA
NA
NA
4.9 Mpa
5.9 Mpa min Ck
NA
South Africa
USA
50 MPa min average 45 MPa absolute min60 MPa min average 50 MPa absolute min
NA
NA
40 MPa
35 MPa min average 30 MPa absolute min55 MPa min average 50 MPa absolute min
GFR
Japan
Netherlands
New Zealand
Country Compressive Strength Flexural Strength
Canada NA
2.5.6. Slip and Skid Resistance A vehicle has to compensate the horizontal component of the forces formed
with direction or speed change of vehicle. When the horizontal force is greater than
that which can be resisted by the friction between tyre and road surface, skidding will
occur. The capability of a road pavement surface to withstand skidding force
components is known as the skid resistance. In-service skid resistance of the
pavement can be measured by the Polished Pavers Value (BS 7932: 1998 Method for
Determination of Polished Pavers Value) test. Concrete block paving with typical in-
service Polished Pavers Values (PPV) of 50 are suitable for most roads. Higher skid-
resistance blocks are available on request [Pritchard and Dawson 1999]. Normally
spoken, a surface made of concrete has enough slip and skid resistance. [Jan 1994].
33
Page 51
The property of skid is specifically for traffic and slip is specially related to
pedestrian use [Dowson 1994]. Slipperiness can be described as a condition where
there is inadequate friction between the foot and the walking surface for the
pedestrian. A walking surface needs to provide sufficient friction to give the
pedestrian confidence that his or her foot will not slide. The slip resistance of paving
products can be determined in the laboratory by ''pendulum'' test [BS 7932:1998]. It
is indicated that a pendulum value of 40 gives a safe and satisfactory walking
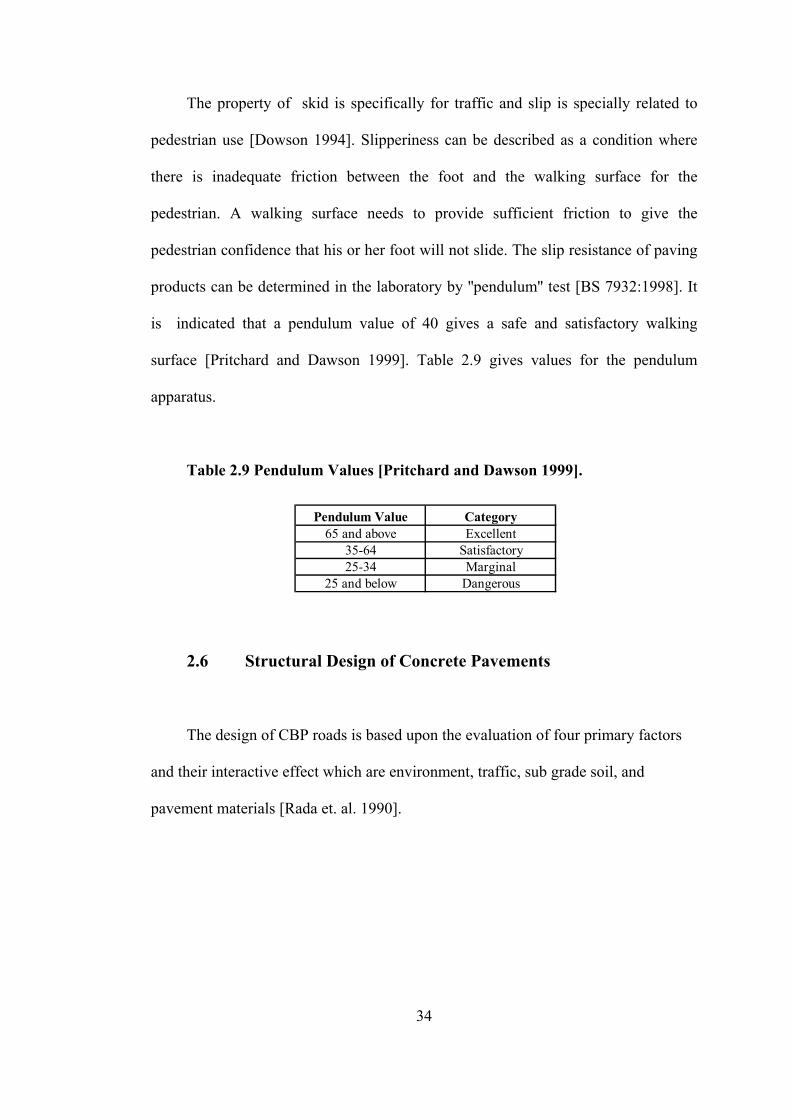
surface [Pritchard and Dawson 1999]. Table 2.9 gives values for the pendulum
apparatus.
Table 2.9 Pendulum Values [Pritchard and Dawson 1999].
25-3425 and below
ExcellentSatisfactoryMarginal
Dangerous
Pendulum Value Category65 and above
35-64
2.6 Structural Design of Concrete Pavements
The design of CBP roads is based upon the evaluation of four primary factors
and their interactive effect which are environment, traffic, sub grade soil, and
pavement materials [Rada et. al. 1990].
34
Page 52
35
a) Environment Pavement performance is significantly influenced by environmental factors.
Moisture adversely affects the load bearing capacity of the pavement by reducing the
strength of unbound granular materials and sub grade soils. Moisture causes
differential heaving and swelling of certain soils, too. Temperature can also affect the
load bearing capacity of pavements, particularly those that have asphalt-stabilized
layers. The combined effect of temperature and moisture can also lead to detrimental
effects like frost action [Rada et. al. 1990].
b) Traffic A key factor in the design of CBP is the anticipated traffic over its design life.
In most design procedures, traffic related parameters such as vehicle mix, volumes,
growth rate, directional split, and lane distributions are used to arrive at a single-
value representation of traffic for direct input into the design procedure. Typically,
traffic is represented in terms of the number of the equivalent 80-kN single axle load
repetitions [Rada et. al. 1990].
c) Sub grade Support One of the most significant factors in the design of pavements is the evaluation
of the sub grade soil strength. Many procedures for establishing this design factor are
available. For example, estimates made by the engineer based on experience, soil-
type-to-strength correlations, laboratory tests, and in situ evaluation methods such as
dynamic deflection tests [Rada et. al. 1990].
Page 53
36
d) Pavement Materials The last set of design variables that must be established is related to the
pavement structure as depicted in Figure 2.10. First, all paving materials available for
construction must be identified. Finally, all feasible material type and layer-thickness
combinations that provide sufficient structural capacity must be developed [Rada and
Smith 1990].
Although the use of concrete blocks in pavement design and construction is a
rather new development, several CBP design methods are presently available
(Eisenmann and Leykauf 1988; Houben et. al. 1984,1988; Livneh et. al. 1988; Miura
et al. 1984; Rolling 1984; Shackel 1982,1988) [Rada and Smith 1990], LOCKPAVE
(Computer software for thickness design of concrete segmental pavements developed
in Australia) [Concrete Masonry Association of Australia 1997b], BS 7533 Part 1
(Guide for Structural Design of Pavements Constructed with Clay, Natural stone or
Concrete pavers), and American Association of State Highway and Transportation
Officials (AASHTO) flexible pavement design method and other Specifications for
Highway Works can also be base for the design of CBP.
Generally, the performance of concrete block pavement depends on proper
design, proper selection of materials and good workmanship. The performance of
CBP are affected from concrete block properties, edge restraints, joints and joint
sand properties, laying pattern of concrete blocks and the sub-layers.
Page 54
Figure 2.10 Typical Block Paving [Concrete Masonry Association of
Australia 1997b].
2.6.1 Sub-Layers In any paving assembly, the base is of prime importance. The pavers, sand and
edge restraints must be placed on a properly prepared base. If the base is improperly
designed or constructed, the entire system is prone to failure [Brick Industry
Association 1992]. For the base design, attention must be given to local soils and
drainage conditions, the expected traffic, and the availability of adequate base
materials [Ackerstone 2003].
The paving surface receives the traffic wear, protects the base and transfers
loads to the base. The base and sub base (if required) provide structural support to
the paving system by distributing the load to the sub grade [Brick Industry
Association 1992]. Low strength sub grade soils can present difficulties in achieving
a firm and stable platform for the base course construction in their unmodified form
using conventional compaction techniques. In that case, chemical stabilization by
37
Page 55
38
lime, fly ash, ground granulated slag or cement or some combination of these might
be necessary [Concrete Masonry Association of Australia 1997b].
Paving assemblies are classified by the type of paving surface and the type of
base supporting the surface. Typical base system for CBP is flexible base pavements.
Flexible bases include crushed stone, gravel or coarse sand. Applications for flexible
bases range from residential patios to city streets. Flexible paving systems are
typically the most economical to install since less labor and fewer materials are
involved. The thickness of each layer in a flexible pavement depends upon the
imposed loads and the properties of each layer. A pavement subjected to heavy
vehicular traffic requires a thicker base than a pavement subjected to pedestrian
traffic. Only mortarless paving, CBP set on sand bedding course in which the joints
are filled with sand, is suitable for this type of base [Brick Industry Association
1992]. In flexible base system unbound materials like crushed stone, gravel or coarse
sand are to be used.
Other base systems, semi rigid & rigid base systems, have no regular use for
CBP but will be explained below.
● Semi Rigid Base System: This type of base consists of asphalt concrete,
commonly referred to as asphalt. Only mortarless paving is suitable over this type of
base [Brick Industry Association 1992]. Typically, an asphalt base is supported by an
aggregate sub base. Each material layer is compacted as placed. An asphalt or
bituminous setting bed is placed over the base [Brick Industry Association 1993].
● Rigid Base System: A rigid base is defined as a reinforced or unreinforced
concrete slab on grade [Brick Industry Association 1992]. Both mortarless and
Page 56
mortared paving systems may be laid over a rigid concrete base. Concrete bases may
or may not be laid over an aggregate sub base depending upon the application and
traffic. Typically, the concrete base should cure a minimum of seven days before
installation of the setting bed and pavers [Brick Industry Association 1993].
2.6.2 Bedding Course
When the quality of bedding course material and the uniformity of the bedding
course are not satisfactory localized differential settlement may occur early in the life
of the pavements. Materials such as clean graded crushed quarry fines and good
quality concreting sands have given good performance provided that the materials
have good grading [Concrete Masonry Association of Australia 1997b]. The grading
of the bedding course sand can be selected using Tables 2.10 and 2.11 depending on
the CBP application [Pitchard 2001].
Table 2.10 Laying Course Material Categories [Pritchard 2001].
2
3
Laying Course Categories Application
4
Aircraft pavements, Bus stations, Pavements with severly channalized traffic
Industrial pavements, Loading bays
Adopted highways, Roads, Petrol station forecourts, Pedestrian schemes with regular heavy traffic, Car parks with some heavy vehicles, Footways with frequent vehicle overrun
Pedestrianisation schemes with occasional heavy traffic, Car parks with no heavy vehicles
Private drives, Areas with only pedestrian traffic, Footways with occasional vehicle overrun
1A
1B
39
Page 57
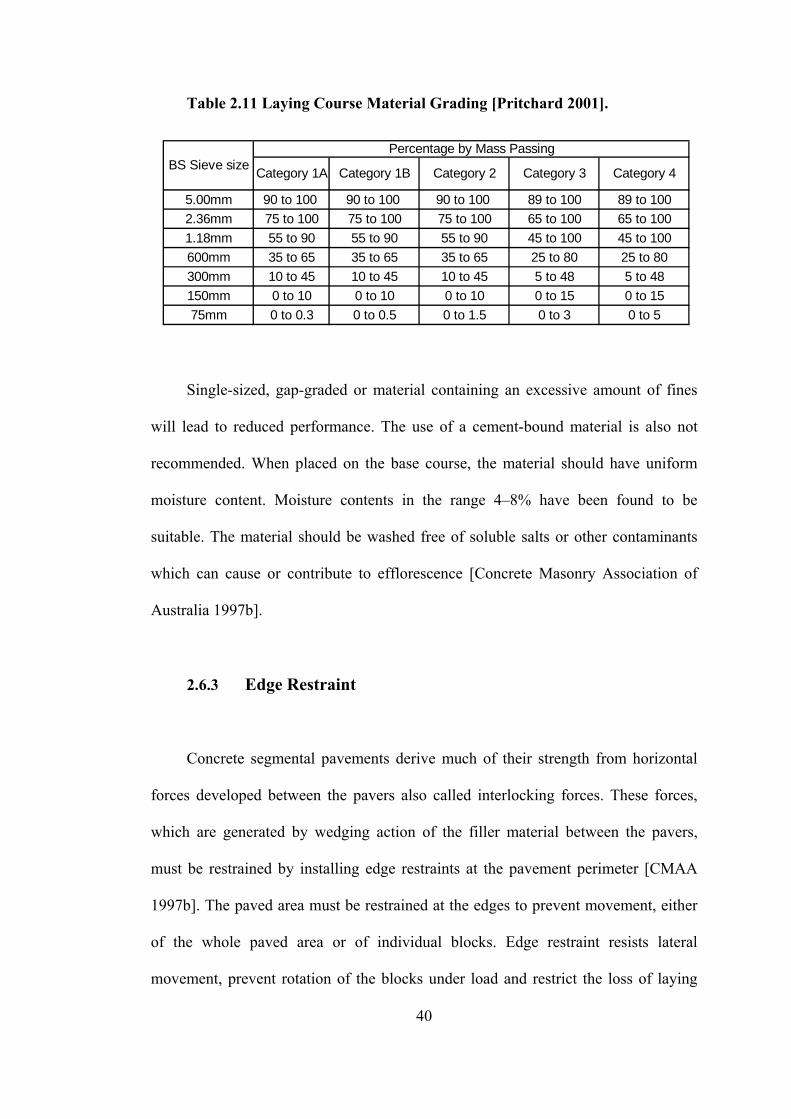
Table 2.11 Laying Course Material Grading [Pritchard 2001].
5.00mm 90 to 100 90 to 100 90 to 100 89 to 100 89 to 1002.36mm 75 to 100 75 to 100 75 to 100 65 to 100 65 to 1001.18mm 55 to 90 55 to 90 55 to 90 45 to 100 45 to 100600mm 35 to 65 35 to 65 35 to 65 25 to 80 25 to 80300mm 10 to 45 10 to 45 10 to 45 5 to 48 5 to 48150mm 0 to 10 0 to 10 0 to 10 0 to 15 0 to 1575mm 0 to 0.3 0 to 0.5 0 to 1.5 0 to 3 0 to 5
BS Sieve sizePercentage by Mass Passing
Category 1A Category 1B Category 2 Category 3 Category 4
Single-sized, gap-graded or material containing an excessive amount of fines
will lead to reduced performance. The use of a cement-bound material is also not
recommended. When placed on the base course, the material should have uniform
moisture content. Moisture contents in the range 4–8% have been found to be
suitable. The material should be washed free of soluble salts or other contaminants
which can cause or contribute to efflorescence [Concrete Masonry Association of
Australia 1997b].
2.6.3 Edge Restraint Concrete segmental pavements derive much of their strength from horizontal
forces developed between the pavers also called interlocking forces. These forces,
which are generated by wedging action of the filler material between the pavers,
must be restrained by installing edge restraints at the pavement perimeter [CMAA
1997b]. The paved area must be restrained at the edges to prevent movement, either
of the whole paved area or of individual blocks. Edge restraint resists lateral
movement, prevent rotation of the blocks under load and restrict the loss of laying
40
Page 58
course sand at boundaries. They should be suitable for their purpose and sufficiently
robust to withstand damage if accidentally overrun by vehicles [Pritchard and
Dawson 1999]. The following diagrams illustrate some typical edge restraints for
various vehicular situations.
Figure 2.11 Domestic Light Traffic Areas - Adjacent to a Building
[Pritchard and Dawson 1999].
Figure 2.12 Light Vehicle and Pedestrian Traffic [Pritchard and Dawson
1999].
41
Page 59
Figure 2.13 Estate Roadway - Light Industrial [Pritchard and Dawson
1999].
Figure 2.14 Estate Roadways - Parking Areas [Pritchard and Dawson
1999].
Figure 2.15 Heavy Industrial Traffic [Pritchard and Dawson 1999].
42
Page 60
43
2.6.4 Concrete Blocks Concrete block paving can be used for several applications. The use influences
the thickness of block required [Pritchard and Dawson 1999]. Typical block
thicknesses used for different applications are: 60 mm for residential roads and
domestic drives and 80 mm for factory floors, industrial pavements and aircraft
pavements [Pritchard and Dawson 1999].
The surface of CBP comprises concrete blocks bedded and jointed in sand. It
transfers loads to the substructure of the pavement. The load bearing capacity of
individual blocks layer depends on the interaction of individual blocks with jointing
sand to build up resistance against applied load. Complex shape blocks have larger
vertical surface areas than rectangular or square blocks of the same plan area.
Consequently, shaped blocks have larger frictional areas for load transfer to adjacent
blocks. It is reported that the shape of the block influences the performance of the
block pavement under load [Bikasha and Ashok 2002].
The blocks can be classified according to interlocking characteristics. Typical
shapes of blocks are shown in Figure 2.16 [Concrete Masonry Association of
Australia 1997b].
Page 61
a) Type A b) Type B
c) Type C Figure 2.16 Typical Shapes of Paving Blocks [Concrete Masonry
Association of Australia 1997b]. ● Type A blocks are dentate units that key into each other and, by their plan
geometry, interlock and resist the relative movement of joints parallel to both the
longitudinal and transverse axes of the unit [Concrete Masonry Association of
Australia 1997b].
● Type B blocks are dentate units that key into each other and, by their plan
geometry, interlock and resist the relative movement of joints parallel to one axis
[Concrete Masonry Association of Australia 1997b].
● Type C blocks are units that do not interlock. Several researchers indicate that the performance of CBP depends also on the
interlocking of the individual units and, to a lesser degree, on the shape and the
44
Page 62
45
thickness of the blocks. The interlocking of the pavers blocks is, in turn, influenced
by the laying pattern and the thickness of the bedding sand [Rada and Smith1990;
Bikasha and Ashok 2002].
The most important factor in choosing a bond or pattern is the use of the
pavement [Pritchard and Dawson 1999]. Typical block paving patterns is given in
Figure 2.17. In vehicular areas, either rectangular blocks in a 900 or 450 herringbone
patterns, or shaped blocks which conform to a rectangular format, should be used.
This reduces the incidence of creep and disturbance wheel loads better to the
underlying pavement construction. Stretcher (Running) bond may be used in very
lightly trafficked areas where vehicles are unlikely to make regular turns or to brake
or accelerate frequently. Basket weave bond should not be used in areas used by
vehicle [Pritchard and Dawson 1999]. The recommended paving unit shape,
thickness and laying pattern by Concrete Masonry Association of Australia (CMAA)
is given in Table 2.12
Page 63
Figure 2.17 Block Paving Patterns [Brick Industry Association 1992]. Table 2.12 Paving Unit Shape, Thickness and Laying Pattern [Concrete
Masonry Association of Australia 1997b].
Estimated traffic*(Commercial vehicles exceeding
3t gross)
Recommended surface layer
Shape type Thickness (mm)
Laying Pattern
Over 104
A,B or C
A A,B or C
A only
* Including building construction trafficH = Herringbone, B = Basketweave, S = Stretcher
60 H,B or S
60 80
80
H only H,B or S
H only
Up to 103
103 to 104
46
Page 64
47
2.6.5 Drainage
Good surface and sub-surface drainage is essential for satisfactory pavement
performance. Drainage needs to be considered during the design, specification and
construction phases of a project [Concrete Masonry Association of Australia 1997b].
Adequate drainage of flexible and rigid paving systems is an extremely important
design consideration for successful performance and durability. Ponding water can
cause deterioration of the paving in areas of repeated freeze-thaw and cause slippery
conditions. Continued saturation of the base, sub base and sub grade can reduce load
capacity due to weakening of the soil and cause deformations or rutting of the
pavement [Brick Industry Association 1992].
In mortared paving, concrete blocks are set on mortar bedding course. Drainage
in mortared paving systems is restricted to the surface by full mortar joints and good
bond between the brick paving units and the mortar. A drainage system should be
designed so standing water is kept to a minimum [Brick Industry Association 1992].
The best way to obtain drainage of the pavement is to slope the paving surface to
provide as much surface drainage as possible. A slope of 1 to 2 mm per 100 mm is
suggested. Large paved areas and vehicular traffic areas may require a slope greater
than 2 mm per 100 mm. The paving system should be sloped away from buildings,
retaining walls and other elements capable of collecting or restricting surface runoff.
To improve surface drainage, the direction of continuous mortar joints should run
parallel to the desired direction of surface runoff [Brick Industry Association 1992].
Drainage of surface runoff is shown in Figure 2.18
Page 65
Figure 2.18 Pavement Edge Drainage (Curb Gutter and Drain) [Interpave 2003].
Mortarless paving requires both surface and subsurface drainage. The majority
of drainage should occur on the surface. However, some water will penetrate
downward until it reaches an impervious layer. This layer may be a concrete or
asphalt base, a flexible base compacted to high density, an impervious soil such as
clay or an impervious membrane used to separate pavement layers. Water not
drained off the pavement surface will percolate to the top of this impervious layer,
possibly causing pending of the water. Due to these conditions, subsurface drainage
is required [Brick Industry Association 1992]. An Examples of sub-surface drainage
is given in Figure 2.19.
48
Page 66
Figure 2.19 Draining directly into Subsurface [Concrete Masonry Association of Australia 1997c].
2.7 Installation of Concrete Block Pavements There are three main operations for a successful installation of a concrete block
pavement; preparation, detailing and compaction [Pritchard 2001]. Workmanship is a
critical factor which has a great impact on the performance of pavements. Proper
preparation and compaction of the base is absolutely critical [Brick Industry
Association 1993].
49
Page 67
50
2.7.1 Sub grade Preparation One element common to all paving assemblies is the soil or sub grade.
Excavation of the sub grade to the proper elevation, removing deleterious materials,
and the sub grade compaction are preparations for the base or sub base [Brick
Industry Association 1993]. It may also be necessary to introduce drainage into the
sub-grade to lower the water table and improve the bearing capacity of sub-grade
[Pritchard 2001]. The entire sub grade should be compacted to 90-95% maximum
density [Brick Industry Association 1993].
2.7.2 Sub base and Base Preparation
The sub base and base materials should be spread and compacted in layers. The
thickness of these layers must be consistent with the capabilities of the compaction
equipment. Heavy compaction equipment such as vibratory rollers may be necessary
when constructing a street with crushed stone, whereas a plate vibrator may be used
when constructing a sand base for a residential areas. Each material should be placed
and compacted in layers no greater than 100 mm. The pavers can be placed on a
uniform thickness of bedding sand without difficulty so it is essential that the
indented surface profile of pavement is formed by the base. The final surface of the
sub base should not be open textured and may require the addition of fine material to
provide a close textured surface and therefore prevent downward migration of the
laying course, when it is laid immediately above the sub base [Pritchard 2001].
Page 68
51
2.7.3 Preparation of Restraints Edge restraints are vital for proper placing and full strength development of the
paving units. Before commencement of the laying operation, all permanent edge
restraints should be installed rigidly in position to resist possible displacement of the
paving units induced by vibration of the plate compactor during construction or the
subsequent traffic loads [Highway Department, Hong Kong 1999].
2.7.4 Bedding Course Preparation
The bedding course (setting bed) material should be spread over the base in a
uniform thickness. A screed board is often used to spread the sand. The setting bed
should not be used to fill in low spots and its thickness should not be adjusted to
bring the pavement to the correct grade. Any changes in thickness or undulations in
the sand will reflect on the pavement surface [Brick Industry Association 1993].
Nominal compacted thickness of laying course should be 50mm with a thickness
tolerance +15mm and –20mm when laid on sub base [Pritchard 2001]. To prevent
disturbance of the sand it should not be spread too far in front of the laying face of
the pavers. Prepared setting bed materials left overnight should be properly protected
from disturbance and moisture. The moisture content of the sand during installation
should be as uniform as possible, with the material moist but not saturated.
Stockpiled sand should be kept covered to prevent contamination [Brick Industry
Association 1993]. Stages of setting bed preparation and block installation can be
seen from Figure 2.20.
Page 69
Figure 2.20. Setting Bed Preparation and Installation of Blocks
2.7.5 Pavers Installation
The last step for the Concrete block is the installation over the bedding course.
Pavers could be installed either manually or by means of mechanical apparatus.
Mechanical laying by its nature is more suited to large areas with minimum
obstructions such as trees and manhole covers [Highway Department, Hong Kong
1999].
Pavers should be laid in the desired bond pattern with a 2 to 3 mm average joint
width. The joint width should not exceed 6 mm. For the pavers installation process
the following items should be considered [Brick Industry Association 1993, Highway
Department, Hong Kong 1999]:
Measures shall be taken to prevent water draining across or through the paving
area during laying, bedding and compaction of the units.
• Lay paving units so that the surface levels are within tolerances.
• Make minor adjustments to maintain the bond pattern and ensure that
the joints remain wide enough for sand filling if required.
52
Page 70
• The first row of units should be aligned against the edge restraints or
by using a straightedge or string line. Check the alignment of units
periodically and make adjustments where necessary.
• Trim paving units to shape and size to form boundaries. Do not insert
pieces of a size less than one-third of a full unit as far as possible.
• To work round any obstructions such as tree planting pits, surround
the obstruction with concrete strips to form a more regular shape first,
and then cut paving units to abut the surround .
After the pavers are installed, the laying course material and blocks should be
compacted using a vibrating plate compactor. The block paved area should be fully
compacted as soon as possible after the full blocks and cut blocks have been laid.
Blocks should not be left uncompacted overnight other than within 1.0m of an
unrestrained edge. After compaction, fine dry (preferably kiln dried) free flowing
silica sand in accordance with Table 2.13 should be brushed into the joints between
the blocks, fully filling the joints, followed by two or more applications of the
vibrating plate compactor. Additional sand should be added to top up the joint as
necessary after compaction and during the early life of the pavement.
Table 2.13. Jointing Course Sand Grading [Pritchard 2001].
50 to 10015 to 600 to 150 to 3
600mm300mm150mm75mm
BS Sieve Size % Passing (by mass)2.36mm1.18mm
10095 to 100
53
Page 71
CHAPTER 3
EXPERIMENTAL STUDY
3.1 Experimental Program
In order to find the most appropriate mix for the abrasion and strength
properties of CB fifteen different mixes were designed. Five different cement content
and three different w/c ratios were planned keeping the aggregate grading constant.
The planned CB mix designs of the experimental program are given in Table 3.1.
Table 3.1 Mix Proportions to be Used for the Tests
Mix No Cement C. (kg/m3) Water C. (kg/m3) Agg. C. (kg/m3) W/C RatioMix 1 200 50 2306 0,25Mix 2 200 60 2280 0,30Mix 3 200 70 2254 0,35Mix 4 250 63 2233 0,25Mix 5 250 75 2201 0,30Mix 6 250 88 2168 0,35Mix 7 300 75 2160 0,25Mix 8 300 90 2121 0,30Mix 9 300 105 2082 0,35Mix 10 350 88 2086 0,25Mix 11 350 105 2041 0,30Mix 12 350 123 1995 0,35Mix 13 400 100 2013 0,25Mix 14 400 120 1961 0,30Mix 15 400 140 1909 0,35
54
Page 72
55
As seen in Table 3.1, the amount of water increases with increasing cement
content and w/c ratio. As vibration and pressure was used during the production
process, some of the mixes have shown stability and surface problems after
demoulding because of high water content in the mix. As a result, the production of
the mixes: 9, 11,12,14,15 could not be performed.
In addition to the mixes given in Table 3.1, two commercially produced CBs
were also tested. The first one was a regular concrete block ( RCB) and the second
one had a iron oxide pigment to obtain a red abrasion layer color (CB-P).
Mixes are produced at a commercial concrete block plant [Özkul Beton
Elemanları San. ve Tic. LTD. ŞTİ]. Weighing and batching were done automatically.
The specimens were tested for their abrasion resistance, compressive strength ,
tensile splitting strength, absorption and density at 7,14 and 28 days of age.
3.2 Materials Used Before the mix design process, the general properties of the materials used in
the mixes were determined. These ingredients were the aggregates and the cement.
3.2.1 White Portland Cement White Portland Cement that corresponds to TS 21 BPÇ 52.5N cement
manufactured by Çimsa was used for all mixes. The chemical and physical properties
Page 73
of this cement were provided by the manufacturer. The chemical and physical
properties of the cement are shown in Table 3.2 and 3.3.
Table 3.2 The Chemical Properties of Cement
Oxides and Other Values SiO2 Al2O3 Fe2O3 CaO MgO K2O Na2O SO3 IR
Free CaO LOI
Pecentage by Weight (%) 21,48 4,17 0,18 65,16 1,33 0,48 0,21 3,85 0,14 1,50 3,09
Table 3.3 The Physical and Mechanical Properties of Cement
2 days 7 days 28 days41,2 52,3 62,7
Compressive Strength (MPa)Final Set (min)
Initial Set (min)Density (g/cm3)
Spec. Surface Area (cm2/g)
3,05 4550 120 162
3.2.2 Aggregates
Four different aggregates were used in the mix design. The specific gravity,
moisture content and absorption capacity of each aggregate was determined
following the ASTM C 127 and 128 standards. The results of these tests are given in
Table 3.4.
Table 3.4 Properties of Aggregates
Aggregate Sizes River Sand 0-3 3-7 7-15SSD Specific Gravity 2,51 2,49 2,66 2,67% Absorbtion 2,5 1,3 0,62 0,6% Moisture Content 2,8 1,5 0,28 0,18
56
Page 74
Sieve analysis tests were also performed according to ASTM C 136 and the
results are given in Table 3.5. Los Angeles weight loss as determined by ASTM C
131 was % 24,1.
Table 3.5 Aggregate Grading
River Sand % Passing
0-3 Crushed Stone
% Passing
3-7 Crushed Stone
% Passing
7-15 Crushed Stone
% Passing100 100 100 68,899,9 99,6 67,1 4,799,3 75,8 5,2 -85,5 44,3 1,7 -51,2 27,1 1,5 -14,3 17,9 1,3 -2,4 12,8 1,2 -0 0 0 0
Sieve Size
3/8'' (9.5 mm)No.4 (4.75 mm)No.8 (2.38 mm)
Pan
No.16 (1.19 mm)No.30 (0.59 mm)No.50 (0.297 mm)No.100 (0.149 mm)
The aggregates were combined in proper volumetric percentages according to
the results of sieve analysis tests as given in Table 3.6
Table 3.6 Volumetric Percentages for Combined Grading
Aggregate Type River Sand 0-3 3-7 7-15 TotalVolumetric Portion in Combined Grading 2 8 2 1,5 13,5
While proportioning the aggregates the particle size distribution have been tried
to be kept within the limiting curves of TS 706 for 8mm maximum aggregate size
and recommended aggregate grading given in Table 2.6. The gradation curves of
combined aggregate grading are given in Figure 3.1, and 3.2 The gradation between
the A-B is accepted 'very good' in TS 706.
57
Page 75
0,00
10,00
20,00
30,00
40,00
50,00
60,00
70,00
80,00
90,00
100,00
110,00
120,00
0,1 1 10 100
Sieve Sizes (mm)
% P
assi
ng CombinedGr. TS A .
TS B
TS C
Figure 3.1 Combined Aggregate Grading and TS 706 Limits
0,00
10,00
20,00
30,00
40,00
50,00
60,00
70,00
80,00
90,00
100,00
110,00
120,00
0,01 0,1 1 10 100
Sieve Sizes (mm)
% P
assi
ng
Combined Gr.Rec. Grading L.Rec. Grading U.
Figure 3.2 Combined Aggregate Grading and Recommended Aggregate
Grading
58
Page 76
59
3.2.3 Mixing Water
Groundwater which was assumed to be free from oil, organic matter and alkalis
was used for the preparation of concrete mixes.
3.3 Experimental Procedures and Data
The production of all CBs were performed at the construction site of Özkul
Beton Elemanları San. ve Tic. LTD. ŞTİ on 3 October 2004. The manufacturing
equipment was stationary equipment which applies constant pressure under a
vibration frequency. The total time of vibration and pressure was determined through
the determined thickness of the CB. In other words, vibration and pressure was
applied until the CBs reach the predetermined 80mm thickness. After demolding the
CBs were stored for a day in the warehouse under a tent. The next day all the CBs
were stored outside and were watered in the mornings for three days. At the end of
three days, the specimens were brought to METU Civil Engineering Department
Materials of Construction Laboratory. The specimens were later stored in lab
conditions until the time of test.
3.3.1 Compressive Strength Tests The compressive strength of the specimens was determined at 7, 14, 28 days of
age after capping the CB surfaces by a gypsum plaster. At each date six specimens
were tested in compression using a universal testing machine of 200 t capacity
(Figure 3.3).
Page 77
Figure 3.3 Compressive Strength Test The Compressive strength test results are given in Table 3.7
60
Table 3.7 Compressive Strength Test Results
Mean of 6COV (%) Mean of 6COV (%) Mean of 6COV (%)RCB 36,3 13,0 37,5 7,5 45,9 9,7CB-P 39,0 3,9 40,0 3,9 41,2 8,8Mix 1 200 0,25 20,1 11,1 26,9 4,1 26,9 17,4Mix 2 200 0,30 33,8 15,6 33,6 4,5 33,5 7,7Mix 3 200 0,35 33,5 5,2 33,8 3,9 35,3 5,8Mix 4 250 0,25 32,9 6,7 38,4 6,2 44,6 5,0Mix 5 250 0,30 35,7 2,3 39,2 2,7 39,2 10,0Mix 6 250 0,35 29,6 6,2 32,6 10,7 34,1 13,4Mix 7 300 0,25 39,9 10,5 44,8 7,0 42,5 7,0Mix 8 300 0,30 35,0 2,9 39,4 10,0 40,2 4,6Mix 10 350 0,25 40,7 3,4 43,7 2,4 46,5 2,5Mix 13 400 0,25 38,9 8,5 42,8 2,7 46,1 3,3
MIX NO 7 Days 14 DaysCement Content
W/C ratio
Compressive Strength (MPa)28 Days
Page 78
61
.3.2 Tensile Splitting Strength Tests
ensile splitting strength tests of concrete block specimens were determined at
7, 14
capac
3
T
, 28 days of age. For every age six specimens were tested. Thicknesses of the
specimens were determined from two points before the application of load. The load
was applied from the middle of the specimen with the apparatus shown in Figure 3.4
L = 2 0 c m 1 2 .5 4 c m
2 c m
3 .3 6 c m
1 .4 2 c m
L = 2 5 c m
Figure 3.4 Splitting Aparatus
The splitting forces were applied with a universal testing machine of 200 t
ity as shown in Figure 3.5.
Figure 3.5 Tensile Splitting Strength Test
Page 79
62
The splitting strengths of the specimens were calculated according to formula: T= 0.637*k*P/S
k= 1.3-30*(0.18-t/1000)2
T= Splitting Strength (MPa) P= Load at Failure (N)
est results are given in Table 3.8.
est Results
ns
were square with an abrasion layer dimension of 7cm. After cutting, the specimens
S= Area of Failure (mm2) t= Thickness Tensile splitting t
Table 3.8 Tensile Splitting T
3.3.3 Abrasion Resistance Tests Abrasion resistance of concrete block specimens were determined again at
7,14,28 days of age. At every age two specimens were tested. Before the day of test
the test specimens for abrasion were cut from the whole CBs. The cut specime
Mean of 6COV (%) Mean of 6COV (%) Mean of 6COV (%)RCB 1,9 9,1 1,7 10,8 1,7 11,6CB-P 1,6 10,9 2,3 14,6 2,1 20,5Mix 1 25 1,3 6,7 1,4 9,1 1,8 9,0Mix 2 7,5 1,8 8,8Mix
200 0,200 0,30 1,7 25,7 1,8
3 200 0,35 2,1 5,0 2,1 5,1 2,2 13,4Mix 4 250 0,25 2,8 4,1 2,3 8,0 2,2 14,5Mix 5 250 0,30 2,8 2,0 1,9 11,9 2,5 4,8Mix 6 250 0,35 2,0 4,9 2,4 9,5 2,6 6,6Mix 7 300 0,25 2,7 12,8 3,0 18,2 3,0 7,8Mix 8 300 0,30 1,8 8,4 2,2 9,0 2,7 6,4Mix 10 350 0,25 2,7 18,1 2,4 7,8 2,2 21,6Mix 13 400 0,25 2,3 15,6 3,1 4,5 2,2 10,5
MIX NOpplied Max Splitting Strength (Mpa)
Cement W/C 7 Days 14 Days 28 DaysA
Content ratio
Page 80
63
were put into oven (110 ± 5C0) for 24 hours before testing. The abrasion resistances
of specimens were tested by Böhme experimental method according to TS 2824. The
bottom faces of the mixes were tested. Initially, the specimens were fixed and 294 ± 3
N vertical load is applied. 20 g standard abrasive dust is placed into the rotating table
as shown in Figure 3.6
w
0 in the
Thickness m three points.
Unlike from TS 2824 the total revolutions were increased to 32*22 rather than
16*2 f abrasion must be smaller than 15cm3
for 50 cm2 abrasion area. The abrasion volume can be controlled from:
Figure 3.6 Böhme Testing Apparatus
After every 22 revolutions the path and the specimens were cleaned and ne
20 g standard abrasive dust is placed and the specimens were rotated 90
horizontal axis. The specimens were weighed initially and at every 4*22 revolutions.
easurements of the specimens also have been done from
2. According to TS 2824, total volume o
Page 81
∆V = ∆m/ρ where;
∆V = Change in Volume (cm3)
ρr = Density of Specimen (gr/cm3) ∆m=Mass change Abrasion resistance test results are given in Table 3.9 Table 3.9 Abrasion Resistance Test Results
64
ean of M 2COV (%) Mean of 2COV (%) Mean of 2COV (%)RCB 13,4 3 17,2 2,9 20,5 3,5CB-P 5,1 13,6 21,1 18,0 0,9Mix 1 200 0,25 24,1 8,3 27,6 0,9 31,2 1,7Mix 2
7,16,6 2
200 0,30 18,8 3,4 27,0 3,4 28,0 9,6Mix 3 200 0,35 22,7 33,7 27,3 5,5 30,8 6,0Mix 4 250 0,25 20,5 9,3 26,5 19,5 25,9 6,0Mix 5 250 0,30 28,2 20,5 22,9 14,1 25,0 0,2Mix 6 250 0,35 22,6 22,0 28,1 7,5 28,3 3,6Mix 7 300 0,25 24,3 22,9 20,3 35,9 25,2 0,0Mix 8 300 0,30 16,5 0,7 22,4 22,7 21,8 14,6Mix 1 350 0,35 23,8 0,30
23,5 9,6 23,1 4,5Mix 13 400 0,25 24,3 10,7 21,1 4,3 24,0 0,3
7 Days 14 Days 28 DaysMIX NOAbrasion Layer Loss After 16*22 Revolutions (cm3)
W/C ratio
Cement Content
3.3.4 Water Absorption, Unit Weight and Compressive Strength Tests After abrasion determination, same specimens were used in absorption and unit
weight determination. Immediately after absorption and unit weight determination,
the specimens were caped and tested under compression in saturated surface dry
condition (Figure 3.7). By this Procedure, the SSD mixes were tested in compression
a week later than the compressive tests for whole specimens.
Page 82
65
ecimens
and ma were made
according to
= Mass of SSD Specimen
= Mass of dry specimen
= Mass of specimen in water
3.12.
Figure 3.7 Compressive Strength Determination after Abrasion
For the calculations; dry mass of the specimens, SSD mass of the sp
ss of the specimens in water were determined. The calculations
the given formulas:
% Absorption = (A-B)/B*100
Dry Density = B/ (A-C) A B C
Density, % Absorption and SSD Compressive strength test Results are given in
Table 3.10, Table 3.11 and Table
Page 83
66
able 3.10 Dry Density Test Results
Mean of
T
2COV (%) Mean of 2COV (%) Mean of 2COV (%)RCBCB-P 2,27 0,07 2,27 0,15 2,21 1,17
0,86 2,16 0,02 2,18 1,57Mix 2 200 0,30 2,26 2,06 2,26 1,11 2,20 1,10Mix
Table 3.11 % Absorption Test Results
2,26 0,35 2,26 2,19 2,24 1,00
Mix 1 200 0,25 2,16
3 200 0,35 2,27 0,86 2,27 1,49 2,25 2,43Mix 4 250 0,25 2,23 1,78 2,23 1,60 2,26 1,28Mix 5 250 0,30 2,29 0,36 2,29 0,92 2,29 1,08Mix 6 250 0,35 2,24 0,49 2,24 1,90 2,23 0,85Mix 7 300 0,25 2,28 0,49 2,28 1,78 2,29 0,91Mix 8 300 0,30 2,26 0,19 2,26 1,37 2,29 1,49Mix 1 2,27 0,96 2,29 1,76Mix 1
0 350 0,35 2,27 0,203 400 0,25 2,23 0,97 2,23 0,09 2,26 1,40
MIX NODry Densiy (gr/cm3)
Content ratio7 Days 14 Days 28 DaysCement W/C
Mean of 2 COV (%) Mean of 2 COV (%) Mean of 2 COV (%)RCB 3,70 0,01 3,77 3,13 3,81 0,38CB-P 3,70 1,52 3,42 4,03 3,74 2,27Mix 1 200 0,25 5,09 6,26 4,25 0,15 4,18 2,39Mix 2 200 0,30 4,27 13,14 4,35 0,58 4,21 2,18Mix 3 200 0,35 4,47 6,37 4,26 4,14 4,16 2,03Mix 4 250 0,25 4,17 15,34 4,03 2,68 3,87 2,75Mix 5 250 0,30 4,05 3,13 4,00 3,82 3,90 1,28Mix 6 250 0,35 4,97 5,80 4,38 8,92 4,18 1,02Mix 7 300 0,25 4,32 0,51 3,45 6,36 3,58 5,15Mix 8 300 0,30 4,05 6,12 3,59 4,21 3,44 2,68Mix 10 350 0,35 4,20 3,36 3,42 3,33 3,39 3,75Mix 1 51 8,10 3,52 9,01
MIX NO% Absor
3 400 0,25 4,26 0,19 3,
ptionCement Content
W/C ratio
7 Days 14 Days 28 Days
Page 84
67
Table 3.12 SSD Compressive Strength Test Results
Mean of 2 COV (%) Mean of 2 COV (%) Mean of 2 COV (%)RCB 23,0 8,1 20,1 2,1 20,1 0,5CB-P 21,7 5,9 21,7 16,2 24,7 4,5Mix 1 200 0,25 16,4 1,8 17,6 12,3 19,1 3,6Mix 2 200 0,30 24,9 15,9 20,1 16,8 23,2 7,8Mix 3 200 0,35 20,4 2,7 18,8 1,3 20,0 26,3Mix 4 250 0,25 26,9 8,3 24,7 8,6 26,0 15,2Mix 5 250 0,30 25,7 15,5 26,1 15,6 25,6 3,3Mix 6 250 0,35 21,6 4,8 22,0 23,3 20,0 0,4Mix 7 300 0,25 28,3 3,9 29,7 4,4 33,3 3,3Mix 8 300 0,30 30,4 0,0 29,2 24,3 25,7 6,3Mix 10 350 0,35 25,5 18,0 32,4 5,1 30,3 10,4
MIX NOSSD Compressive Strength (Mpa)
Cement Content
W/C ratio
7 Days 14 Days 28 Days
Mix 13 400 0,25 25,6 17,5 30,6 27,1 29,9 15,6
Page 85
68
CHAPTER 4
DISCUSSION OF RESULTS
4.1 Effects of Cement Content on the Properties of CBs
The effects of ingredients, water and cement content on the properties for each
performance parameter of CBs will now be discussed. These parameters include:
compressive strength, tensile splitting strength, unit weight and absorption. It can be
observed from the following figures that for W/C= 0,30 and for W/C=0,35, the
production of some mixes were eliminated because of their higher water content than
the mixes which caused stability and surface problems during production.
4.1.1 Compressive Strength
The effects of cement content and W/C ratio on the strength properties of the
CB are shown in Figure 4.1. In that figure it can be seen that, for W/C=0,25, the
increase in strength was very rapid as the cement content was increased from 200
kg/m3 to 250 kg/m3. After 250 kg/m3 cement content, the increase in strength was
very small and even lower for 300 kg/m3 cement content. It can be concluded that,
for a given W/C ratio after an optimum cement content the increase in cement
Page 86
content was unnecessary. The trend was similar for W/C=0,30. And, increasing
cement content caused decrease in strength for W/C=0,35.
It can be also observed from Figure 4.1 that for a given 200 kg/m3 cement
content, the strengths increased as W/C ratio of the mixes was increased. This
behaviour was not observed for 250 kg/m3 and 300 kg/m3 cement contents.
Increasing W/C ratio caused decreases in strength for these cement contents. This
behaviour was related with the optimum moisture content (OMC). For a given
cement content, the compactibility of the mixes was highest at OMC. In other words,
for a given cement content the maximum strength can be achieved at OMC. And
with increasing cement content, the W/C ratio should be lowered to reach OMC.
0
5
10
15
20
25
30
35
40
45
50
0 50 100 150 200 250 300 350 400 450Cement Content (kg / m3)
Com
pres
sive
Stre
ngth
(MPa
)
W/C = 0,25W/C = 0,30W/C = 0,35
Figure 4.1 Compressive Strength Test Results
These behaviours were closely related with the operation of the CB
manufacturing machine. In manufacturing process, as the mixes cast into moulds, the
vibration continued until a target thickness was reached. If the target thickness could
69
Page 87
70
not reached, the vibration was continued to its adjusted maximum limit (9,99
seconds). As the water content in the mix increased, the mix cast in the mould also
increased with increasing mobility. When the mix amount in the mould passed an
amount that the machine could not compact to an adjust thickness the vibration
duration were continued to its maximum limit (9,99 seconds). This powerful
vibration might cause segregation in the mixes that were passed OMC. As a result,
the expected increase in strengths with increasing cement content were not observed.
4.1.2 Abrasion Resistance
The Figure 4.2 represents the results of cement content versus abrasion loss
relation. It can be observed from Figure 4.2 that for a given W/C ratio, the abrasion
losses decreased with increasing cement content.. It can be also observed from
Figure 4.2 that for a given 200 kg/m3 cement content, the abrasion losses were
decreased when the W/C ratio increased from 0,25 to 0,30. This condition was also
the same for 250 kg/m3 and 300 kg/m3 cement contents. But as the W/C ratio was
increased to 0,35 from 0,30, abrasion losses increased for both 200 kg/m3 and 250
kg/m3 cement contents. This condition reveals that the degree of cementing particles
at the surface of the CBs were decreased after W/C=0,30 was exceeded.
Page 88
0
5
10
15
20
25
30
35
0 50 100 150 200 250 300 350 400 450Cement Content (kg / m3)
Abr
asio
n Lo
ss (c
m3 )
W/C=0,25W/C=0,30W/C=0,35
Figure 4.2 Abrasion Resistance Test Results
4.1.3 Other Performance Parameters
The effects of cement and W/C ratio on the tensile splitting strength and %
absorption is shown in Figure 4.3, 4.4. As can be seen from figures, similar trends
with compressive strength described in 4.1.1 were observed for tensile splitting
strength and density at different optimum moisture content levels.
The Figure 4.5 represents the results of cement content versus absorption
relation. It can be observed from Figure 4.5 that absorption values were affected
from cement content values rather than W/C ratio. The general trend for all water
cement ratios were decrease in % absorption as cement content have been increased.
The decrease trend only have been disturbed for 400 kg/m3 cement content at
W/C=0,25.
71
Page 89
0,0
0,5
1,0
1,5
2,0
2,5
3,0
3,5
0 50 100 150 200 250 300 350 400 450
Cement Content (kg / m3)
Split
ting
Stre
ngth
(MPa
)
W/C=0,25W/C=0,30W/C=0,35
72
igure 4.4 Density Test Results
Figure 4.3 Tensile Splitting Strength Test Results
2,16
2,18
2,20
2,22
2,24
2,26
2,28
2,30
0 50 100 150 200 250 300 350 400 450Cement Content (kg / m3)
Den
sity
(g/c
m3 )
W/C=0,25W/C=0,30W/C=0,35
F
Page 90
0,0
0,5
1,0
1,5
2,0
2,5
3,0
3,5
4,0
4,5
0 50 100 150 200 250 300 350 400 450Cement Content (kg / m3)
% A
bsor
ptio
n
W/C=0,25W/C=0,30W/C=0,35
Figure 4.5. Absorption Test Results
73
ce Tests
brasion is given in Figure 4.6.
As seen in that figure as the compressive strength increases abrasion loss decreases
(abra
Moreover, correlations between density and other performance parameters
were also investigated. It can be concluded from those relations shown in Figures
(4.6,
on is given in Figure 4.6.
As seen in that figure as the compressive strength increases abrasion loss decreases
(abra
Moreover, correlations between density and other performance parameters
were also investigated. It can be concluded from those relations shown in Figures
(4.6,
4.2 Correlations between Performan
The correlation between compressive strength-a
sion resistance increases). The relation between abrasion resistance and
compressive strength could be presented by linear regression with a satisfactory
correlation.
sion resistance increases). The relation between abrasion resistance and
compressive strength could be presented by linear regression with a satisfactory
correlation.
4.7, 4.8, 4.9, 4.10) that density was closely related with all other performance
parameters with satisfactory correlation. Therefore, density, which is the easiest
parameter to determine, can be used as a quality control parameter.
4.7, 4.8, 4.9, 4.10) that density was closely related with all other performance
parameters with satisfactory correlation. Therefore, density, which is the easiest
parameter to determine, can be used as a quality control parameter.
Page 91
Figure 4.6 Compressive Strength-Abrasion Loss Relation
y = -0,4008x + 41,923R2 = 0,6607
0
5
10
15
20
25
30
0 10 20 30 40 50Compressive Strength (MPa)
Abr
asio
n Lo
ss (c
m3 )
35
y = 130,09x - 254,13R2 = 0,6272
05
10152025303540450
2,16 2,18 2,20 2,22 2,24 2,26 2,28 2,30
Density (g/cm3)
Com
pres
sive
Stre
ngth
(MPa
) 5
74
Figure 4.7 Density-Compressive Strength Relation
Page 92
Figure 4.8 Density-Tensile Splitting Strength Relation
y = -63,716x + 169,85R2 = 0,6187
0
5
10
15
20
25
30
35
2,16 2,18 2,2 2,22 2,24 2,26 2,28 2,3Density (gr/cm3)
Abr
asio
n Lo
ss (c
m3 )
y = 7,1499x - 13,77R2 = 0,5684
0,0
0,5
1,0
1,5
2,0
2,5
3,0
3,5
2,16 2,18 2,20 2,22 2,24 2,26 2,28 2,30
Density (g/cm3)
Tens
ile S
plitt
ing
Stre
ngth
(MPa
)
Figure 4.9 Density-Abrasion Loss Relation
75
Page 93
y = -6,7083x + 18,955R2 = 0,611
0,00
0,50
1,00
1,50
2,00
2,50
3,00
3,50
4,00
4,50
5,00
2,16 2,18 2,20 2,22 2,24 2,26 2,28 2,30
Density (g/cm3)
% A
bsor
ptio
n
76
from umber of 22 revolutions curve
decreases as the cement content in the mixture increases. In other words, as the
4.3 Evaluation of the Abrasion Test The abrasion test was performed by the Böhme equipment and procedure
described in TS 2824, details of which was described in Chapter 3. In the standards
the test was told to be stopped after 16*22 revolutions and the corresponding volume
loss in the concrete block was to be measured at every 4*22 revolutions. However,
each number of revolutions increase the time and cost of the test. In this part of the
experimental program the test was continued for a total of 32*22 revolutions and the
abrasion loss at every 4*22 revolutions was determined. The results of these
abrasion losses are presented in Figure 4.11 for each w/c ratio group tested. As seen
from umber of 22 revolutions curve
decreases as the cement content in the mixture increases. In other words, as the
Figure 4.10 Density-% Absorption Relatione 4.10 Density-% Absorption Relation
4.3 Evaluation of the Abrasion Test The abrasion test was performed by the Böhme equipment and procedure
described in TS 2824, details of which was described in Chapter 3. In the standards
the test was told to be stopped after 16*22 revolutions and the corresponding volume
loss in the concrete block was to be measured at every 4*22 revolutions. However,
each number of revolutions increase the time and cost of the test. In this part of the
experimental program the test was continued for a total of 32*22 revolutions and the
abrasion loss at every 4*22 revolutions was determined. The results of these
abrasion losses are presented in Figure 4.11 for each w/c ratio group tested. As seen
Figure 4.11, the slope of the abrasion loss-nFigure 4.11, the slope of the abrasion loss-n
Page 94
77
ceme nten brasion resistance increased) for
each w/c ratio considered. This tendency is only disturbed by mix 13. Although, mix
13 ha
nt co t increases, abrasion loss decreases (a
d a higher cement content than mix 10, it showed a decrease in the abrasion
resistance. It should be noted here that mix 13 had the highest water content among
all the mixes cast. This reveals that, for a given w/c ratio increasing the cement
content after a certain level will lead to decrease in abrasion resistance. The decrease
in abrasion resistance is also closely related with the operation of the CB
manufacturing equipment. Excessive increase in the water content with increasing
cement content for a given w/c ratio may lead to accumulation of undesirable water
at the surface with powerful vibration. This situation may reduce the degree of
cementing at the surface which in turn reduces the abrasion resistance.
Page 95
0
10
20
30
40
50
60
70
0 4 8 12 16 20 24 28 32 36Number of 22 Revolutions
Abr
asio
n Lo
ss (c
m3 )
C=200C=250C=300C=350C=400
Cement content (C) in kg/m3
(a) w/c = 0.25
0
10
20
30
40
50
60
70
0 4 8 12 16 20 24 28 32 36Number of 22 Revolutions
Abr
asio
n Lo
ss (c
m3 ) C=200
C=250
C=300
Cement content (C) in kg/m3
(b) w/c = 0.30
0
10
20
30
40
50
60
70
0 4 8 12 16 20 24 28 32 36Number of 22 Revolutions
Abr
asio
n Lo
ss (c
m3 ) C=200
C=250
Cement content (C) in kg/m3
(c) w/c = 0.35
Figure 4.11 Abrasion Resistance Test Results of Concrete Blocks
78
Page 96
79
It can also be seen from Figure 4.11 that, higher decrease in slope were
observed between mix 1 and mix 4 as the cement content was increased to 250 kg/m3
from 200 kg/m3. As the mix was really a dry mix at 200 kg cement content level, the
increase in water content associated with increase in cement content lead to rapid
increase in abrasion resistance for W/C=0,25. The tendency (increase in abrasion
resistance with increasing cement content) seen at W/C=0,25 was also observed for
W/C=0,30 and W/C=0,35. For all mixes, the 15 cm^3 loss limit in TS 2824 after
16*22 revolutions was exceeded. It reveals that, upper surface of the CBs should be
separately designed with an optimum water volume and the aggregates used at the
surface should be also more abrasion resistant.
Abrasion results of commercially produced concrete blocks (RCB, CB-P) are
presented in Figure 4.12. These concrete blocks were cast in two layers. The upper
layer can be termed as the abrasion layer. The abrasion layer thicknesses of these
concrete blocks were about 1.0 cm. As can be seen from Figure, the abrasion layer
did not wear down until a predescribed 16*22 revolutions in TS 2824. As the
abrasion layer wear down, the abrasion amount increased with a noticeable slope
change. The pigmented mix showed a better performance than the unpigmented mix.
This confirms that pigments used in the mixes may affect the abrasion resistance
noticeably.
Page 97
80
Figure 4.12 Abrasion Resistance Test Results of RCB and CB-P
As seen from the above Figures, for all the concrete blocks tested the abrasion
loss linearly increased with increasing number of revolutions.
This part of the experimental study investigated the feasibility of reducing the
number of revolutions of the abrasion test. In order to do this statistical analysis was
performed for the abrasion loss and number of 22 revolutions test data given above
such that, the slope of the linear regression line was calculated for 4, 8, 12, 16, 20,
24, 28, and 32 number of revolutions. The correlation coefficients between the
number of revolutions and abrasion loss was in excess of 0.99 for all the blocks
tested. As an example, the regression lines for the RCB mix are presented in Figure
4.13.
0
10
20
30
40
50
60
70
0 4 8 12 16Number of 22 Re
Abr
asio
n Lo
ss (c
m3 ) RCB CB-P
20 24 28 32 36volutions
Page 98
y = 1,235xR2 = 1,000
0
10
20
30
40
50
0 8 16 24 32Number of 22 Revolutions
Abr
asio
n Lo
ss (c
m3 )
RCB
y = 1,231xR2 = 1,000
0
10
20
30
40
50
0 8 16 24 32Number of 22 Revolutions
Abr
asio
n Lo
ss (c
m3 )
RCB
y = 1,252xR2 = 1,000
0
10
20
30
40
50
0 8 16 24 32Number of 22 Revolutions
Abr
asio
n Lo
ss (c
m3 )
RCB
y = 1,269xR2 = 0,999
0
10
20
30
40
50
0 8 16 24 32Number of 22 Revolutions
Abr
asio
n Lo
ss (c
m3 )
RCB
Figure 4.13 Change in Slope with Change in Number of 22 Revolutions
81
81
Page 99
y = 1,282xR2 = 0,999
0
10
20
30
40
50
0 8 16 24 32Number of 22 Revolutions
Abr
asio
n Lo
ss (c
m3 )
RCB
y = 1,299xR2 = 0,999
0
10
20
30
40
50
0 8 16 24 32Number of 22 Revolutions
Abr
asio
n Lo
ss (c
m3 )
RCB
y = 1,327xR2 = 0,997
0
10
20
30
40
50
0 8 16 24 32Number of 22 Revolutions
Abr
asio
n Lo
ss (c
m3 )
RCB
y = 1,359xR2 = 0,994
0
10
20
30
40
50
0 8 16 24 32Number of 22 Revolutions
Abr
asio
n Lo
ss (c
m3 )
RCB
82Figure 4.13 Change in Slope with Change in Number of 22 Revolutions (continued)
82
Page 100
83
The calculated slopes of the regression lines for each concrete block tested is
presented in Table 4.1. As seen from that table the slopes are nearly constant except
for the first row. This was an indication of a soft layer formed at the surface of the
concrete blocks, which might have formed by the accumulation of excessive water at
the surface by powerful vibration during manufacturing. Therefore, this top layer
will not represent the quality of the concrete block. However, after 8*22 revolutions
the change in slope is observed to be rather small. Therefore, the relative change of
slope with respect to 8*22 revolutions is calculated as shown in Table 4.2. From that
table, it can be seen that the relative change of slopes was rather small in all mixes
other than the deficiencies in mix 2 which might be because of an experimental error.
Therefore, it can be concluded that, the test could be stopped after 8*22 revolutions.
And the standard TS limit can be adjusted for 8*22 revolutions. By this change the
testing time could be shortened and the cost of the testing could be reduced.
Page 101
Table 4.1 Slopes of Regression Lines after Each Number of 22 Revolutions
RCB CB-P Mix1 Mix2 Mix3 Mix4 Mix5 Mix6 Mix7 Mix8 Mix10 Mix13
After 4 1,24 1,12 2,05 1,50 2,12 1,71 1,59 2,01 1,58 1,40 1,55 1,56
After 8 1,23 1,14 1,97 1,54 1,91 1,68 1,55 1,83 1,54 1,39 1,47 1,52
After 12 1,25 1,13 1,91 1,67 1,91 1,62 1,58 1,79 1,57 1,38 1,45 1,51
After 16 1,27 1,13 1,93 1,75 1,91 1,61 1,57 1,76 1,58 1,37 1,44 1,50
After 20 1,28 1,15 1,94 1,80 1,92 1,62 1,57 1,74 1,57 1,36 1,43 1,49
After 24 1,30 1,18 1,94 1,84 1,92 1,64 1,58 1,73 1,58 1,35 1,43 1,48
After 28 1,33 1,20 1,95 1,84 1,93 1,65 1,59 1,73 1,58 1,35 1,43 1,49
After 32 1,36 1,22 1,94 1,84 1,90 1,67 1,60 1,72 1,59 1,35 1,43 1,49
RevolutionSlope
Table 4.2 Relative Change of Slope with Respect to 8*22 Revolutions
RCB CB-P Mix1 Mix2 Mix3 Mix4 Mix5 Mix6 Mix7 Mix8 Mix10 Mix13
After 8 1,00 1,00 1,00 1,00 1,00 1,00 1,00 1,00 1,00 1,00 1,00 1,00
After 12 1,02 1,00 0,97 1,08 1,00 0,96 1,02 0,98 1,02 0,99 0,99 0,99
After 16 1,03 0,99 0,98 1,14 1,00 0,96 1,01 0,96 1,02 0,98 0,98 0,98
After 20 1,04 1,01 0,98 1,17 1,00 0,96 1,01 0,95 1,02 0,98 0,97 0,98
After 24 1,06 1,04 0,98 1,19 1,00 0,98 1,02 0,95 1,02 0,97 0,97 0,97
After 28 1,08 1,05 0,99 1,19 1,01 0,98 1,03 0,95 1,03 0,97 0,97 0,97
After 32 1,10 1,07 0,98 1,19 0,99 0,99 1,03 0,94 1,03 0,97 0,97 0,98
RevolutionRelative Slope
84
Page 102
85
CHAPTER 5
SUMMARY AND CONCLUSIONS
5.1 Summary CPBs differ from other pavement materials according to their mechanical
behavior. In this study, 10 mixes with different cement contents and W/C ratios and
2 mixes from a commercial CPB manufacturer were tested. The compressive
strength, tensile splitting strength, abrasion resistance, density and % water
absorption tests were performed on each mix at 7, 14, 28 days.
5.2 Conclusions From the results of this study, the following conclusions can be drawn:
● For a given cement content CBs showed best performance at a specific water
content called optimum moisture content. The above and below variations from that
level caused decreases in strengths and density of CBs. This behavior is closely
related with the way the concrete block equipment operates. As the cement content in
a mix increases to obtain higher strengths, the W/C ratio should be lowered as higher
water contents cause some stability and segregation problems.
Page 103
86
● The cement content has an important role on the abrasion resistance and
absorption. The abrasion losses and % Absorption generally decreased with
increasing cement content for a given W/C ratio.
● The compressive strength and abrasion loss have correlation between each
other. Increasing strengths have caused decrease in abrasion losses.
● From the linear regression analysis of the abrasion results, the obtained
regression line showed a perfect correlation with a correlation coefficient (R2) equal
to one. And the slopes of the regression line have not showed change in slope after
8*22 revolutions. This situation has confirmed that there was no drawback to stop
the test at 8*22 revolutions. The abrasion test might be stopped at 8*22 revolutions
and the TS 2824 limit can be adjusted for 8*22 revolutions. Since, the abrasion test is
a long time process by this change the gained time can be used to test more
specimens to increase reliability of the results.
● CBs should be cast in two layers. The mix design of abrasion layer should be
done separately. Higher cement contents with low W/C ratios might be needed to
achieve required performance limit given in TS 2824. Furthermore, the aggregates
with higher abrasion resistance might be used. The abrasion layer mix should be a
rather dry mix than the lower part of the block.
● Density ,the easily determined property, seem to correlate well with all the
performance parameters. Therefore it can be used as a rapid quality control
parameter.
Page 104
87
5.3 Recommendations for Future Studies
● Mix Proportioning of the CBs should be done according to block making
machine intended to be used and the way it is operated.
● The consistency of such dry or semi-dry mixes can be determined by a Vebe
Apparatus. This will facilitate the production of more uniform and consistent mixes.
● In this study a white portland cement (BPÇ 52.5N) were used. The effects of
other cement types can also be studied.
● Savings in cement content can be achieved by studying the curing effect on
CBs.
● As the pigments used for the upper part of the mix has an effect on the
abrasion resistance noticeably. The effects of pigments on abrasion resistance
prepared with white portland cement can be studied.
● The properties of CBs produced by other manufacturers can be determined
and compared with natural stones.
Page 105
88
REFERENCES
ACI Committee 201, ''Proposed Revision of: Guide to Durable Concrete (ACI
201.2R)'', ACI Material Journal, V.88, No.5, pp 554-551, Sept-Oct, 1991
Ackerstone, Interlocking Concrete Pavers, http:// www.ackerstone.com,
December 2003
Aeon's Construction Products Limited, Segmental Pavers,
http:// www aeonsindia.com/segment.htm, December 2003
Akçaoğlu T., Tokyay M., Çelik T., ''Effect of Coarse Aggregate Size and Matrix
Quality on ITZ and Failure Behaviour of Concrete Under Uniaxial
Compression'', Cement and Concrete Composites, Elsevier Science Ltd, 2003
ASTM C 936, Standard Specification for Solid Concrete Interlocking Paving Units,
American Society for Testing and Materials, West Conshohocken, USA,
2001
ASTM C 140 Test Methods for Sampling and Testing Concrete Masonry Units and
Related Units, American Society for Testing and Materials, West
Conshohocken, USA, 2001
Page 106
89
Bikasha C. P., and Ashok K.G., ''Structural Behaviour of Concrete Block Paving 2:
Concrete Blocks'', Journal of Transportation Engineering, Vol 128, No.2, ,
pp. 130-135, 2002
Brick Industry Association, Technical Notes on Brick Construction, Technical Notes
14, Part 1, Virginia, North America, 1992
Brick Industry Association, Technical Notes on Brick Construction, Technical Notes
14A, Part 2, Virginia, North America, 1993
BS 6717, Precast, Unreinforced Concrete Paving Blocks-Requirements and Test
Methods, 2001
BS 7533, Guide for Structural Design of Pavements Constructed with Clay or
Concrete Block Pavers, 1992
BS 7932, Method for Determination of Polished Paver Value (PPV), 1998
Bullen F., '' Controlling Quality In Concrete Segmental Paving Units'', CBP Second
International Workshop, Oslo-Norway, pp 67-75, 1994
Cement and Concrete Institute, The Manufacture of Concrete Paving Blocks,
Midrand, South Africa, 2001
Concrete Masonry Association of Australia (CMAA), Specification for Concrete
Segmental Paving Units (MA20), Australia-Sydney, 1986
Concrete Masonry Association of Australia (CMAA), Concrete Segmental
Pavements-Guide to Specifying, Australia-Sydney, 1997 a
Page 107
90
CMAA, Design Guide for Residential Access ways and Roads, Australia-Sydney,
1997 b
Concrete Masonry Association of Australia (CMAA), Concrete Segmental
Pavements-Detailing Guide, Australia-Sydney, 1997 c
CMAA, Concrete Masonry Association of Australia, Manufacture of Concrete
Masonry, Australia-Sydney, September 2000
Concrete Manufacturers Association Publication, Precast Concrete Products-Brick
and Block Making, Best Practice Guide, Part3, South Africa, January 2002
Det Wiler, R.J. , Dolgleish, B. J. and Williamson, R.B., ''Assessing the Durability of
Concrete in Freezing and Thawing'', ACI Materials Journal, V.86, No.1, Jan-
Feb pp. 29-35, 1989
Dowson A. J., ''Fact or Fiction - A review of Test Methods for CBP'', CBP Second
International Workshop, Oslo-Norway, pp. 24-43, 1994
Erdoğan, T.Y., Beton, METU Press Publishing Company, in Turkish, 688p, May
2003,
Erdoğan T. Y., Materials of Construction, METU Press Publishing Company
262p, March 2002
Ghafoori N., and Mathis R., ''Prediction of Freezing and Thawing Durability of
Concrete Paving Blocks'', Journal of Materials in Civil Engineering, V10,
No.1, pp45-51, 1998
Page 108
91
Ghafoori, N. and Sukandar, B.M., ''Abrasion Resistance of Concrete Block Pavers'',
ACI Materials Journal, V 92, No.1, pp25-36, January-February 1995
Ghafoori, N., Mathis, R., ''Scaling Resistance of Concrete Paving Block Surface
Exposed to Deicing Chemicals'', ACI Materials Journal, V 94, No.1, pp 32-38
January-February 1997
Ghafoori, N., Smith, D. R., ''Comparison of ASTM and Canadian Freeze-Thaw
Durability Tests'', The Fifth International Conference on Concrete Block
Paving, Tel-Aviv, Israel, pp. 93-101, 1996
Hauben, LJM ; Van D., Kreeft, S.G. and Leewis, M. , ''Specifications and Standards
for Concrete Paving Blocks-A Worldwide Survey Based on Inquiry'', Proc.
Second Int. Conf. on Concrete Block Paving, Delft, 1984
Highway Department, Hong Kong, Road Note 9, Precast Concrete Unit Paving
System, Hong Kong, November 1999
Hodgkinson, J. R. , ''Interlocking Concrete Road Pavements-Updated Design and
Construction Information-August 1986'' Int. Workshop on Interlocking
Concrete Pavements, Melbourne, 1-2 September, 1986
Humpola, B., ''Some Aspects of CBP Quality'', The Fifth International Conference
on Concrete Block Paving, Tel-Aviv, Israel, pp. 103-113, 1996
Humpola, B., Bullen, F., Knapton, J., ''Quick Quality Control of Concrete Block
Pavers In Australia'', The Fifth International Conference on Concrete Block
Paving, Tel-Aviv, Israel, pp. 55-64, 1996
Page 109
92
Interpave, http:// www.paving.org.uk, November 2003
Jan J. M. , ''European Standards on Concrete Blocks, Flags and Kerbs'', CBP Second
International Workshop, Oslo-Norway, pp 44-55, 1994
Mehta, Kumar, P., Concrete-Structure, Properties, and Materials, Prentice-Hall,
Inc., Englewood Cliffs, 450p, 1986
Neville, A. M., Properties of Concrete, The English Language Book Society and
Pitman Publishing, 3rd Edition, 269p, 1981
Özturan T., Çeçen C., ''Effect of Coarse Aggregate Type on Mechanical Properties of
Concrete with Different Strengths'', Cement and Concrete Research, Vol 27,
No.2, pp. 165-170, 1997
Powers, T.C. , ''Freezing Effects In Concrete'', Durability of Concrete, SP-47,
American Concrete Institute, Detroit, pp. 1-11, 1975
Pritchard C., and Dawson S., Precast Concrete Paving: A Design Handbook,
Interpave, Leicester, England, 60p, 1999
Pritchard, C., Precast Concrete Paving: Installation and Maintenance, Interpave,
Leicester, England, 64p, 2001
Rada, G. R., Smith, D. R., Miller, J.S., Witchak, M. W., ''Structural Design of
Concrete Block Pavements'', Journal of Transportation Engineering, V 116,
No.5, pp. 615-635, 1990
Page 110
93
Setzer, M.J., Auberg, R., ''Testing of Freeze Thaw and Deicing Salt Resistance'',
CBP Second International Workshop, Oslo-Norway, pp 76-88, 1994
Shackel, B., ''Developments in the Specification of Concrete Segmental Pavers for
Australian Conditions'', CBP Second International Workshop, Oslo-Norway,
pp. 56-66, 1994
TS 2824, Concrete Paving Blocks, Türk Standardları Enstitüsü, Ankara, Turkey,
1996
TS 213, Concrete Flooring Tiles, Türk Standardları Enstitüsü, Ankara, Turkey, 1994
TS 706, Concrete Aggregates, Türk Standardları Enstitüsü, Ankara, Turkey, 1980