A Study on Feasibility of Dual-Wavelength Radar
for Identification of Hydrometeor Phases
Liang Liao
Goddard Earth Sciences & Technology Center/UMBC, Greenbelt, MD 20771
Robert Meneghini
Code 613.1, NASA/GSFC, Greenbelt, MD 20771
Submitted to
Journal of Apply Meteorology and Climatology
Submitted Febuary 2010
Corresponding author information:
Dr. Liang Liao
Goddard Earth Science Technology/UMBC
Code 613.1
NASA/Goddard Space Flight Center
Greenbelt, MD 20771
301-614-5718 (phone)
301-614-5558 (fax)
Email: Liang.Liao-1@ nasa.gov
https://ntrs.nasa.gov/search.jsp?R=20110010006 2018-06-11T12:25:23+00:00Z
2
Abstract
An important objective for the Dual-wavelength Ku-/Ka-band Precipitation Radar (DPR) that
will be on board the Global Precipitation Measuring (GPM) core satellite, is to identify the phase
state of hydrometeors along the range direction. To assess this, radar signatures are simulated in
snow and rain to explore the relation between the differential frequency ratio (DFR), defined as
the difference of radar reflectivity factors between Ku- and Ka-bands, and the radar reflectivity
factor at Ku-band, ZKu, for different hydrometeor types. Model simulations indicate that there is
clear separation between snow and rain in the ZKu-DFR plane assuming that the snow follows the
Gunn-Marshall size distribution (1958) and rain follows the Marshall-Palmer size distribution
(1948). In an effort to verify the simulated results, the data collected by the Airborne Second
Generation Precipitation Radar (APR-2) in the Wakasa Bay AMSR-E campaign are employed.
Using the signatures of Linear Depolarization Ratio (LDR) at Ku-band, the APR-2 data can be
easily divided into the regions of snow, mixed phase and rain for stratiform storms. These
results are then superimposed onto the theoretical curves computed from the model in the ZKu-
DFR plane. It has been found that in 90% of the cases, snow and rain can be distinguished if the
Ku-band radar reflectivity exceeds 18 dBZ (the minimum detectable level of GPM DPR at Ku-
band). This is also the case for snow and mixed-phase hydrometeors. Although snow can be
easily distinguished from rain and melting hydrometeors by using Ku- and Ka-band radar, the
rain and mixed-phase particles are not always separable. It is concluded that Ku- and Ka-band
dual-wavelength radar might provide a potential means to identify the phase state of
hydrometeors.
1. Introduction
The Global Precipitation Measuring (GPM) mission has been proposed for mapping of
precipitation globally following the success of the Tropical Rainfall Measuring Mission
(TRMM) that measures the precipitation in tropical and sub-tropical region (Simpson et al. 1996;
Kummerow et al. 2000; Kozu et al. 2001). The Dual-wavelength Precipitation Radar (DPR)
onboard the GPM core satellite is expected to improve accuracy of estimates of precipitation rate
and also to enable the retrieval of microphysical properties of hydrometeors, such as particle size
distribution and phase state. As the GPM will fly in a higher orbital inclination (650), the radar
observations will be extended to mid- and high-latitude regions where both snow and rain
frequently occur. Moreover, because the radar algorithms for estimates of precipitation rate and
water content differ for snow and rain, it is necessary to study the feasibility of the GPM DPR
for identification of hydrometeor phase states. This capability is also useful in convective rain
where a clearly defined bright band is usually absent. Having knowledge of where regions of
snow, rain and mixed phase precipitation occur along the radar range direction is important in
determining how to allocate estimates of total path attenuation as derived either by the
radiometer or by the use of the radar surface reference technique (Meneghini et al. 2000).
Although hydrometeor identification has been studied for polarimetric radar (Ryzhkov and Zrnic
1998; Liu and Chandrasekar 2000; Dolan and Rutledge 2009), such research has not yet been
well established using non-polarimetric (co-polarization) radar. Use of radar reflectivity at one
frequency alone is not sufficient to distinguish snow from rain echoes because light to moderate
rain exhibits a similar range of reflectivities as those of snow. However, the differential
frequency ratio (DFR), which is defined as the difference of radar reflectivity factors between Ku
4
and Ka bands, provides useful information that, together with ZKu, can be useful in improving the
capability to distinguish snow and rain.
To explore the capability of the GPM DPR for separation of snow and rain, we start with
simulations of radar signatures at the DPR frequencies (Ku- and Ka-band) in snow and rain in an
effort to find distinctive characteristics based on assumed particle size distributions. To check the
model simulations we use radar measurements taken by the Airborne Second Generation
Precipitation Radar (APR-2) during the Wasaka Bay AMSR-E field campaign in 2003 over the
sea of Japan on board a NASA P-3 aircraft (Im 2003; Sadowy et al. 2003). The APR-2, operating
at approximately the same frequencies as the DPR, is also capable of obtaining the Linear
Depolarization Ratio (LDR) at Ku-band in addition to the measurements of radar reflectivity
factors and Doppler velocities at Ku- and Ka-bands. The LDR provides information that can be
used to accurately identify the mixed-phase region in stratiform storms, with which the radar
data can be easily divided into frozen, melting and liquid regions. The radar measurements from
these regions are then compared with the model computations. Thus, the potential to separate
hydrometeors among three different phases can be effectively studied.
This paper is organized as follows. In Section 2 simulations of the Ku- and Ka-band radar in
snow and rain are performed as the assumed particle size distributions are used, followed by the
description of APR-2 measurements during the Wasaka Bay field campaign in Section 3. The
capability of the Ku- and Ka-band dual-wavelength radar to distinguish phase states of
hydrometeors is analyzed in Section 4 using measured radar data. A summary is given in Section
5.
5
2. Dual-Wavelength Radar Simulations
Simulation of dual-wavelength radar signatures in snow and rain provides an important means to
look into the distinctive features of radar signals from which the phase states of hydrometeors
can be possibly identified. What follows is a brief description of the radar parameters involved in
this study.
The effective radar reflectivity factor Ze, which is related to the particle size distribution N(D)
and the backscatering cross section b(D, ) of the hydrometeors at wavelength , is given as
dDDDNK
Z b
w
e ),()(0
25
4
(1)
where the Kw, the dielectric factor, is used to designate (m2-1)/(m
2+2), where m is the complex
refractive index of water. By convention, |Kw|2 is taken to be 0.93 (Battan 1973). While Ze can
be obtained from the radar return power, b(D, ) for spheres can be directly computed from Mie
theory. The radar dual-frequency ratio (DFR) in dB, describing the difference of the radar
reflectivity at 2 wavelengths, is defined as
vu ZZDFR /log10, (2)
where Zu and Zv are the radar reflectivity factors at wavelengths u and v. In this paper u is
associated with the longer wavelength corresponding to the lower frequency (Ku-band).
For convenience, the hydrometeor size distribution is often parameterized by an analytical form
based on measured particle size spectra. The most common particle size distributions are the
exponential, gamma and lognormal distributions with 2 or 3 characteristic parameters in the
function (Bringi et al. 2002; Gorgucci et al. 2000; Gorgucci et al. 2002; Tian et al. 2010). It is
6
known, under atmospheric equilibrium conditions, that the raindrop size distribution is well
represented by the exponential relation, namely the Marshall-Palmer distribution (1948), which
is expressed as
, (3)
where
[m-3
mm-1
], (4)
[mm-1
]. (5)
N(D)ΔD is the number concentration of the raindrops with diameters in the range D to D+ΔD,
and R is the rainfall rate in mm h-1
. For snow it has been found that the size distribution of
aggregate snowflakes also yields (3) (Gunn and Marshall, 1958) but with
[m-3
mm-1
], (6)
[mm-1
]. (7)
The diameter D in (3) refers to the melted diameter of the snowflake. To compute the
backscattering cross section of snowflake in (1), the melted size diameter must be converted to
the actual diameter of the snowflake which is a mixture of ice and air. Transformation of the
snow particles from their melted to actual size depends solely on the snow mass density. Many
observations indicate that snow density ρs is inversely proportional to particle size, and can be
expressed in the form of power law, i.e.,
, (8)
where and are coefficients that are to be determined from observation. We hereafter refer the
snow density as variable snow density if it depends on particle size. Because of the considerable
variation in the density-size relations, which depends on snow type, amount of rimming and
other conditions under which the studies are undertaken, it is convenient to use the average bulk
7
density (or fixed snow density) which is independent of particle size. The average bulk
density of snow can be defined as the ratio of mass content to the total volume of the
hydrometeor:
. (9)
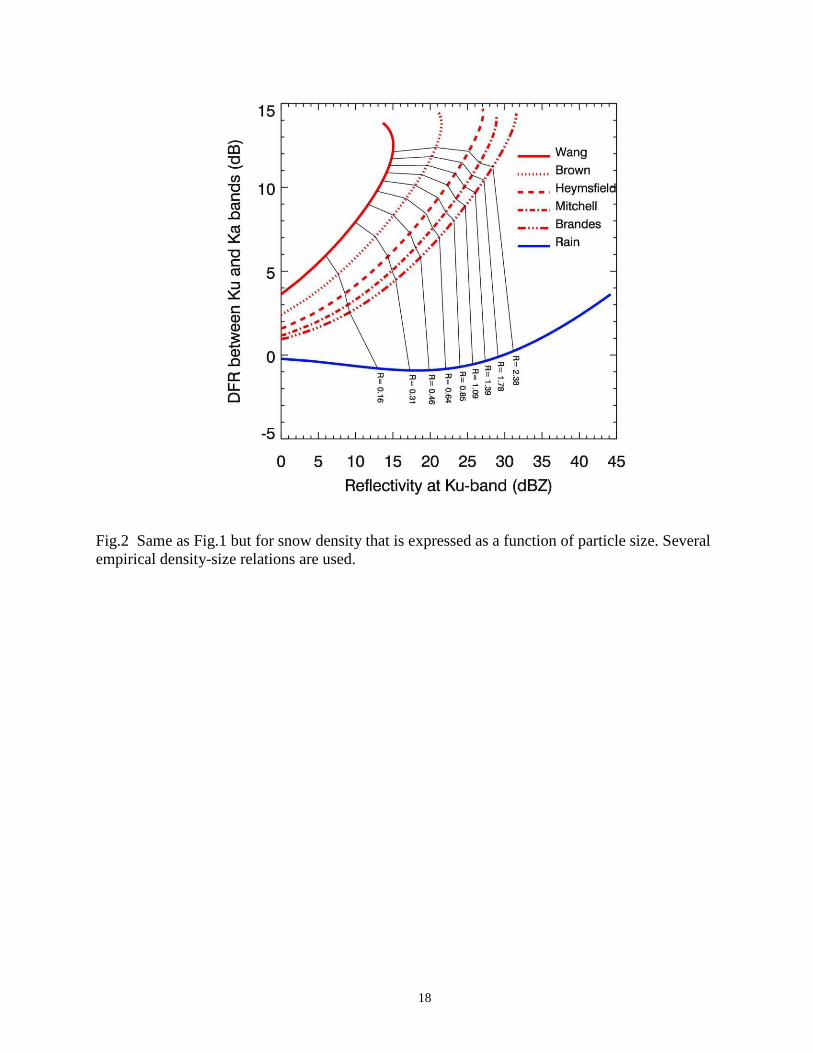
Figures 1 and 2 show the simulated radar signatures in the ZKu-DFR plane for different values of
fixed and variable snow density, respectively. In these simulations the snow size distribution is
assumed to be the Gunn-Marshall relation (1958) while the rain is assumed to follow the
Marshall-Palmer raindrop size distribution (1948) described previously. As shown in the results
for the case of fixed snow density (Fig. 1), there is a clear separation between regions of snow
(red) and rain (blue) in the ZKu-DFR space. Departures of the radar signatures from snow to rain
grow quickly as the snow density decreases, evidenced by the results of the snow densities with
values varying from 0.05 g/cm3 to 0.5 g/cm
3; these separations become increasingly pronounced
as the Ku-band radar reflectivity increases. For reference, the curves of constant rain rate (black)
are also plotted. For snow these should be interpreted as the equivalent rain rate. In a similar
manner, the results of the variable snow density are depicted in Fig.2 where several empirical
density-size relations from the results of Wang et al. (2005), Brown and Francis (1995),
Heymsfield et al. (2004), Mitchell et al. (1990), and Brandes et al. (2007) are shown as derived
from the snow density-size relations plotted in Fig.3. As in the constant snow density case, the
results clearly show that the regions of snow and rain can be separated. However, in the variable
density case, the separation is much larger than in the case of fixed snow density. The results
from Figs.1 and 2 are promising in that they suggest a clear separation between snow and rain
returns in the ZKu-DFR plane. However, these results need to be confirmed by using actual radar
measurements. This will be a focus of the remainder of the paper.
8
3. APR-2 Radar Measurements
In support of the NASA GPM mission, NASA JPL has built the 2nd
-generation Airborne
Precipitation Radar (APR-2) as a prototype for advanced dual-frequency spaceborne radar which
emulates the GPM core satellite’s Ku- and Ka-band radar (Sadowy et al. 2003). The APR-2 is
capable of making simultaneous measurements of co- and cross-polarized reflectivity factors and
Doppler velocities at the frequencies of 13.4 GHz (Ku-band) and 35.6 GHz (Ka-band). In
January and February 2003 the APR-2 on board a NASA P-3 aircraft was deployed to the
Wakasa Bay AMSR-E validation site over the sea of Japan (Im 2003). During 12 flights and
with more than 30 hours of measurements, the APR-2 collected valuable datasets for the study of
precipitation systems including snow and rain events, over both land and ocean.
Figure 4 illustrates the measurements of the APR-2 at nadir from a stratiform storm during the
Wakasa Bay field campaign on 23 January 2003. The radar reflectivity factors shown in the left
columns (Fig.4a) correspond to the Ku- (top panel) and Ka-bands (middle panel). With a fine
range resolution (30 m), the bright-band is clearly defined at an altitude around 2 km from the
surface which is identified by a strong, narrow band. The linear depolarization ratio (LDR)
measured at Ku-band (bottom panel) effectively identifies the mixed-phase region which can be
used to divide the measurements into regions of snow, melting and rain. This is based on the fact
that higher LDR is associated with melting particles. Figs.4b and 4c show the Ku- and Ka-band
radar data that correspond to snow (top), mixed-phase (middle) and rain (bottom), respectively.
Using the radar measurements associated with hydrometeors with different phases in
combination with the model simulations described in Section 3, the capability of the Ku- and Ka-
band radar technique can be tested to differentiate the phase states of the hydrometeors.
9
4. Ku- and Ka-Band Radar Phase Identification
To test if the radar measurements can be used to separate the regions of snow, mixed-phase and
rain, as indicated by the radar simulations, we superimpose the radar data onto the theoretical
model computations in the plane of DFR and Ku-band radar reflectivity factor. Shown in Fig.5
are the scatter plots of the radar data that overlay the simulated curves computed at a fixed snow
density. The data points in blue, green and red represent measurement results for the regions of
snow, mixed-phase and rain, respectively, acquired from the APR-2 measurements in stratiform
rain on January 23, 2003 shown in Fig.4. For theoretical computations the results for rain are
given by a heavy-solid line while the snow results are depicted by several thin curves that are
associated with different snow densities. Evidently, the majority of the snow and rain echoes are
consistent with the model simulations. However, a few data points of snow slip into negative
region of DFR when the Ku-band radar reflectivity factors are in the range from 10 to 15 dBZ.
These results contradict theoretical calculations that show that the DFR is always greater than 0
for snow. These negative DFR occurrences are probably the result of sampling errors (from a
finite number of samples) and from low signal-to-noise ratios. Note that the data points shown in
Fig.5 include all of the measurements of the APR-2 (from 23 equally spaced angle bins),
covering a cross-track scan ±250 from nadir. In addition, a simple attenuation correction
procedure for rain has been taken in the dataset using the surface reference technique (SRT)
(Meneghini et al. 2000). Snow attenuation, on the other hand, can be generally ignored for a
downward-looking radar. Attenuation in the melting layer can be corrected based on a melting
layer model (e.g., Liao and Meneghini 2005; Liao et al. 2009). However, because the rain height
is relatively shallow, with a depth of only about 2 km in this case, and also because of relatively
10
weak reflectivities attenuation correction, though performed, has little effect on the results shown
in Fig.5.
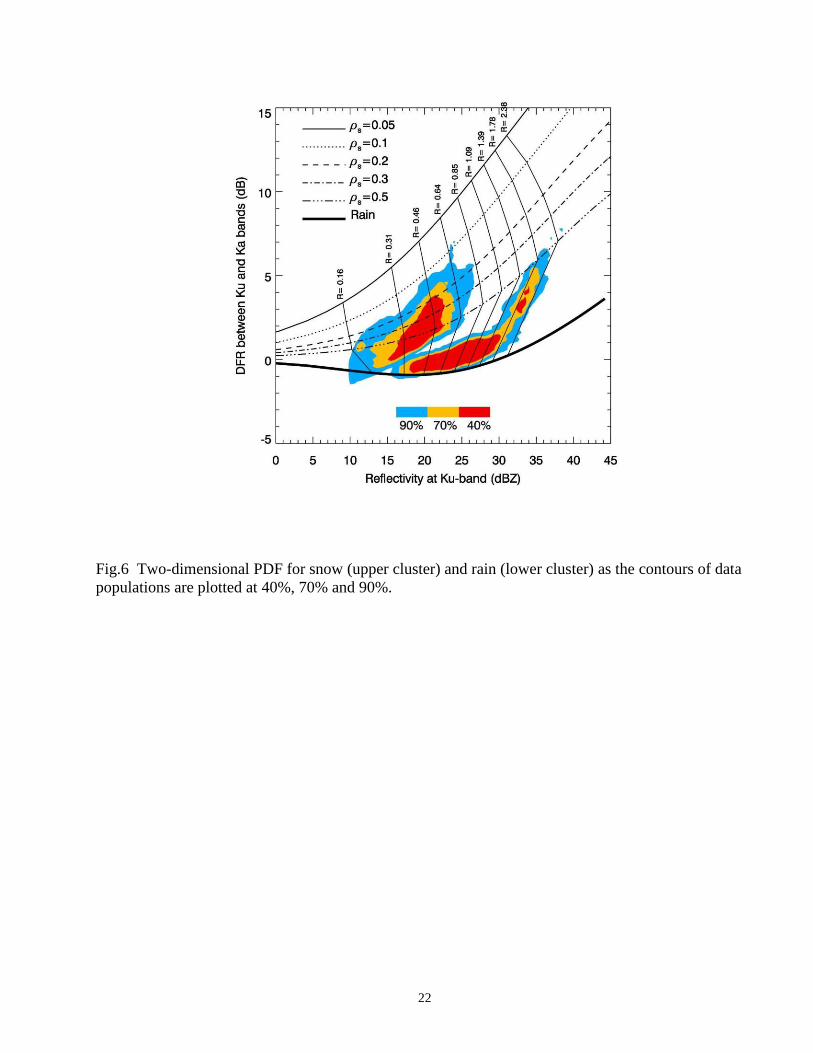
A quantitative analysis of the results can be made by computing two-dimensional probability
density functions (PDF) from the data. Figure 6 exhibits the PDF results in the ZKu-DFR space
for snow (upper cluster) and rain (lower cluster). For the sake of comparison, the contours of the
populations are plotted at levels of 40%, 70% and 90%. As shown in Fig.6, there are at least 70%
cases of these datasets in which the rain and snow are completely separated; for those contours
that contain 90% of the data, the rain and snow regions can be fully distinguished if the Ku-band
reflectivity exceeds 18 dBZ (which is approximately the DPR minimum detectable level at Ku-
band).. Similar comparisons of the PDFs are shown in Fig.7 between the snow and mixed-phase
data. It is not difficult to find that 90% of the data from snow and mixed phase are separable.
This finding, along with those from Fig.6, suggests that the snow returns usually can be
differentiated from rain and mixed phase returns by using measurements of DFR and Ku-band
radar reflectivity. In contrast, however, the returns from rain cannot always be distinguished
from mixed-phase cases when the Ku-band radar reflectivity factors are in the range from 25 to
35 dBZ, as illustrated in Fig.8. This overlap region is associated with the trailing part of the
melting layer in which rain and melting snow returns yield approximately the same magnitudes
of DFR and radar reflectivity factor at Ku-band. For values of ZKu below 25 dB, the returns are
exclusively associated with rain while above 35 dB, the returns are primarily associated with the
mixed phase region. These findings are supported by the similar comparisons (not shown) from
data acquired from other flights on different days. It is worth noting that the comparison of the
radar measurements to the model simulations in snow for the fixed and variable snow densities
11
reveals that the radar simulations are in better agreement if the averaged bulk (or fixed) snow
density is used.
5. Summary
To develop an algorithm for the Ku- and Ka-band dual-wavelength spaceborne radar for the
identification of hydrometeor phase state, such as snow, melting snow (mixed-phase) and water,
we start with model simulations that are focused on snow and rain. As the rain and snow particle
size distributions can be described by an exponential function, i.e. the Marshall-Palmer size
distribution for rain and the Gunn-Marshall size distribution for snow, theoretical computations
of the relations between DFR and radar reflectivity factor at Ku-band are performed using both a
constant snow density (invariant with particle size) and variable snow density (size dependent). It
is shown that snow and rain can usually be clearly distinguished in the ZKu-DFR plane. The data
taken from the NASA JPL APR-2 Ku- and Ka-band airborne radar during Wakasa Bay
experiment are employed to check the model simulations and also to assess the feasibility of the
dual-wavelength radar technique for identification of hydrometeor phase. Having superimposed
the data collected in stratiform rain on January 23, 2003 onto the theoretical curves in the plane
of DFR and radar reflectivity at Ku-band, it is found that the radar measurements are generally
consistent with the model simulations for snow and rain. When compared with measurements,
better agreement is obtained using fixed snow density than variable snow density. Analysis of
the two-dimensional PDF of the data from snow, rain and mixed-phase indicates that snow can
be easily distinguished from rain and mixed-phase hydrometeors if the radar reflectivity factor at
Ku-band is greater than 18 dBZ. Rain, however, is not always separable from mixed-phase data.
In stratiform rain, the region of overlap occurs at ranges near the lower boundary of the melting
layer where the snow melting is nearly complete and where the radar reflectivities and DFR
12
values from the melting snow resemble those from rain. Apart from this overlap region (25 dBZ
< ZKu < 35 dBZ), the separation between the regions of rain and mixed phases appears feasible.
Although the radar technique described in this study presents a promising way to separate the
regions of snow, rain and mixed-phase hydrometeors, attenuation due to rain and mixed-phase
particles may complicate the identification because Ka-band experiences much more attenuation
than the Ku-band in general, resulting in an increase in DFR. Without proper attenuation
correction, it is possible to misclassify the hydrometeors. One way to circumvent this problem is
to use the SRT and dual-wavelength radar retrieval algorithms. The SRT provides an effective
means for attenuation correction at the surface based on the difference of surface returns between
rain and rain-free areas. The dual-wavelength radar backward approach which works on gate-by-
gate basis can be possibly incorporated with the phase identification scheme to identify the phase
states beginning from the surface and moving upward toward the storm top (Liao and
Meneghini 2005; Liao et al. 2008). To develop a fully functional radar algorithm, an
investigation into an optimal selection of the DFR-Z(Ku) relation that effectively separates
different phase regions is needed. To achieve this, a further study will be undertaken, which
includes an analysis of dual-wavelength radar measurements and the model computations linking
DFR to radar reflectivity under various microphysical conditions, and an exploration of
convective storm in which an obvious bright-band is absent. The development of an effective
dual-wavelength method to distinguish the rain, snow and mixed-phase hydrometeors will be an
important step toward an accurate, efficient DPR profiling algorithm.
ACKNOWLEDGEMENTS
13
The authors wish to thank Dr. Eastwood Im and Dr. Simone Tanelli of the NASA Jet Propulsion
Laboratory for providing the APR-2 radar data and the processing software. This work is
supported by Dr. R. Kakar of NASA Headquarters under NASA’s Precipitation Measurement
Mission (PMM) Grant NNH06ZDA001N-PMM.
14
References
Battan, L. J., 1973: Radar Observation of the Atmosphere. University of Chicago, 1973, 324 pp.
Brandes, E., K. Ikeda, G. Zhang, M. Schoenhuber, and R. Rasmussen, 2007: A statistical and
physical description of hydrometeor distributions in Colorado snowstorms using a video
distrometer. J. Appl. Meteor. Climat., 46, 634-650.
Bringi, V., G. Huang, V. Chandrasekar and E. Gorgucci, 2002: A methodology for estimating the
parameters of a Gamma raindrop size distribution model from polarimetric radar data:
Application to a squall-line event from the TRMM/Brazil campaign. J. Oceanic and Atmos.
Tech., 19, 633-645.
Brown, P. R. A., and P. N. Francis, 1995: Improved measurement of the ice water content in
cirrus using a total-water probe. J. Atmos. Oceanic Technol., 21, 1679-1688.
Dolan, B., and S. A. Rutledge, 2009: A theory-based hydrometeor identification algorithm for X-
band polarimetric radars. J. Atmos. Oceanic Technol., 26, 2071-2088.
Gorgucci, E., G. Scarchilli, V. Chandrasekar and V. Bringi, 2000: Measurement of mean
raindrop shape from polarimetric radar observations. J. Atmos. Sci., 57, 3406-3413.
Gorgucci, E., G. Scarchilli, V. Chandrasekar and V. Bringi, 2002: Estimation of raindrop size
distribution parameters from polarimetric radar measurements. J. Atmos. Sci., 59, 2373-2384.
Gunn, K. L. S., and J.S. Marshall, 1958: The distribution with size of aggregate snowflakes. J.
Meteor., 15, 452-461.
Heymsfield, A. J., A. Bansemer, P. R. Field, C. Schmitt, C. Twohy, and M. R. Poellot, 2004:
Effective ice particle densities from aircraft data. J. Atmos. Sci., 61, 982-1003.
Im, E., 2003: APR-2 dual-frequency airborne radar observations, Wakasa Bay, Boulder, CO:
National snow and ice data center. Digital media.
Kozu, T, and Coauthors, 2001: Development of precipitation radar onboard the Tropical Rainfall
Measuring Mission (TRMM) satellite. IEEE Trans. Geosci. Remote Sens., 39, 102-116.
Kummerow, C., and Coauthors, 2000: The status of the Tropical Rainfall Measuring Mission
(TRMM) after two years in orbit. J. Appl. Meteorol., 39, 1965-1982.
Liao, L., and R. Meneghini, 2005: A study of air/space-borne dual-wavelength radar for
estimates of rain profiles. Advances in Atmospheric Sciences, 22, 841-851.
Liao, L. and R. Meneghini, 2005: On modeling air/spaceborne radar returns in the melting layer.
IEEE Trans. Geosci. Remote Sens., 43, 2799-2809.
15
Liao, Li., R. Meneghini, L. Tian, and G. M. Heymsfield, 2008: Retrieval of snow and rain from
combined X- and W-band airborne radar measurements. IEEE Trans. Geosci. Remote Sens.,
1514-1524.
Liao, L., R. Meneghini, L. Tian, and G. M. Heymsfield, 2009: Measurements and simulations of
nadir-viewing radar returns from the melting layer at X- and W-bands. J. Appl. Meteor.
Climat., 2215-2226.
Liu, H., and V. Chandrasekar, 2000: Classification of hydrometeors based on polarimetric radar
measurements: Development of fuzzy logic and neuro-fuzzy systems, and in situ verification.
J. Atmos. Oceanic Technol., 17, 140-164.
Marshall, J. S., and W.M. Palmer, 1948: The distribution of raindrops with size. J. Appl. Meteor.,
5, 165-166.
Meneghini, R., T. Iguchi, T. Kozu, L. Liao, K. Okamoto, J. A. Jones, and J. Kwiatkowski, 2000:
Use of the surface reference technique for path attenuation estimates from TRMM
precipitation radar. J. Appl. Meteor., 39, 2053-2070.
Mitchell, D. L., R. Zhang, and R. L. Pitter, 1990: Mass-dimensional relations for ice particles
and the influence of riming on snowfall rates. J. Appl. Meteor., 29, 153-163.
Ryzhkov, A. V., and D. S. Zrnic, 1998: Discrimination between rain and snow with a
polarimetric radar. J. Appl. Meteor., 37, 1228-1240.
Sadowy, G. A., A. C. Berkun, W. Chun, E. Im, and S. L. Durden, 2003: The Tropical Rainfall
Measuring Mission (TRMM) sensor package. J. Atmos. Oceanic Technol, 15, 84-98.
Simpson, J., C. Kummerow, W.-K. Tao, and R. F. Adler, 1996: On the Tropical Rainfall
Measuring Mission (TRMM). Meteor. Atmos. Phys., 60, 19-36.
Tian, L., G. M. Heymsfield, A. Heymsfield, L. Li, C. H. Twohy, R. C. Srivastava, 2010: A study
of cirrus ice particle distribution using TC4 obsevations. J. Atmos. Sci., 67, 195-216.
Wang, Z., G. M. Heymsfield, L. Li, and A. J. Heymsfield, 2005: Retrieval optically thick ice
cloud microphysical properties by using airborne dual-wavelength radar measurements. J.
Geophy. Res., 110, D19201, doi:10.1029/2005JD005969.
16
Figure Captions:
Fig.1 Theoretical relationships between DFR and radar reflectivity factor at Ku band for snow (red
curves) and rain (blue curves) as computed from assumed particle size distributions for constant snow
density (ρs). The black contour lines correspond to equivalent rain rate (R) in mm/h.
Fig.2 Same as Fig.1 but for snow density that is expressed as a function of particle size. Several
empirical density-size relations are used.
Fig.3 Snow density as a function of particle size as obtained from the empirical relations obtained by
Brown and Francis (1995), Wang et al. (2005), Heymsfield et al. (2004), Brandes et al. (2007) and
Mitchell et al. (1990).
Fig.4 Measurements taken from the APR-2 during the Wakasa Bay AMSR-E field campaign on 23
January 2003. (a): Radar reflectivity factors at Ku- (top) and Ka-band (middle) and LDR (bottom) at
Ku-band. (b): Radar reflectivity factors at Ku-band that are broken down into the regions of snow
(top), mixed phase (middle) and rain (bottom) based on the Ku-band LDR. (c) Radar reflectivity
factors at Ka-band that are broken down into the regions of snow (top), mixed phase (middle) and rain
(bottom) based on the Ku-band LDR.
Fig.5 Scatter plots of the APR-2 data for snow (blue), mixed-phase (green) and rain (red) that are
superimposed on the theoretical curves.
Fig.6 Two-dimensional PDF for snow (upper cluster) and rain (lower cluster) as the contours of data
populations are plotted at 40%, 70% and 90%.
Fig.7 Two-dimensional PDF for snow (left cluster) and mixed-phase (right cluster) as the contours of
data populations are plotted at 40%, 70% and 90%.
Fig.8 Two-dimensional PDF for rain (lower-left cluster) and mixed-phase (upper-right cluster) as the
contours of data populations are plotted at 40%, 70% and 90%.
17
Fig.1 Theoretical relationships between DFR and radar reflectivity factor at Ku band for snow (red
curves) and rain (blue curves) as computed from assumed particle size distributions for constant snow
density (ρs). The black contour lines correspond to equivalent rain rate (R) in mm/h.
18
Fig.2 Same as Fig.1 but for snow density that is expressed as a function of particle size. Several
empirical density-size relations are used.
19
Fig.3 Snow density as a function of particle size as obtained from the empirical relations obtained by
Brown and Francis (1995), Wang et al. (2005), Heymsfield et al. (2004), Brandes et al. (2007) and
Mitchell et al. (1990).
20
(a) (b) (c)
Fig.4 Measurements taken from the APR-2 during the Wakasa Bay AMSR-E field campaign on 23
January 2003. (a): Radar reflectivity factors at Ku- (top) and Ka-band (middle) and LDR (bottom) at
Ku-band. (b): Radar reflectivity factors at Ku-band that are broken down into the regions of snow
(top), mixed phase (middle) and rain (bottom) based on the Ku-band LDR. (c) Radar reflectivity
factors at Ka-band that are broken down into the regions of snow (top), mixed phase (middle) and rain
(bottom) based on the Ku-band LDR.
21
Fig.5 Scatter plots of the APR-2 data for snow (blue), mixed-phase (green) and rain (red) that are
superimposed on the theoretical curves.
.
22
Fig.6 Two-dimensional PDF for snow (upper cluster) and rain (lower cluster) as the contours of data
populations are plotted at 40%, 70% and 90%.
23
Fig.7 Two-dimensional PDF for snow (left cluster) and mixed-phase (right cluster) as the contours of
data populations are plotted at 40%, 70% and 90%.
24
Fig.8 Two-dimensional PDF for rain (lower-left cluster) and mixed-phase (upper-right cluster) as the
contours of data populations are plotted at 40%, 70% and 90%.
A Study on Feasibility of Dual-Wavelength Radar
for Identification of Hydrometeor Phases
Liang Liao
Goddard Earth Sciences & Technology Center/UMBC, Greenbelt, MD 20771
Robert Meneghini
Code 613.1, NASA/GSFC, Greenbelt, MD 20771
SUMMARY
An important objective for the Dual-wavelength Ku-/Ka-band Precipitation Radar (DPR) that
will be on board the Global Precipitation Measuring (GPM) core satellite, is to identify the phase
state of hydrometeors along the range direction. To develop this algorithm, we start with model
simulations that are focused on snow and rain. As the rain and snow particle size distributions
can be described by an exponential function, i.e. the Marshall-Palmer size distribution for rain
and the Gunn-Marshall size distribution for snow, theoretical computations of the relations
between DFR, defined as the difference of radar reflectivity factors between Ku- and Ka-bands,
and radar reflectivity factor at Ku-band (ZKu) are performed using both a constant snow density
(invariant with particle size) and variable snow density (size dependent). It is shown that snow
and rain can usually be clearly distinguished in the ZKu-DFR plane. The data taken from the
NASA JPL APR-2 Ku- and Ka-band airborne radar during Wakasa Bay experiment are
employed to check the model simulations and also to assess the feasibility of the dual-
wavelength radar technique for identification of hydrometeor phase. Having superimposed the
data collected in stratiform rain on January 23, 2003 onto the theoretical curves in the plane of
DFR and radar reflectivity at Ku-band, it is found that the radar measurements are generally
consistent with the model simulations for snow and rain. When compared with measurements,
better agreement is obtained using fixed snow density than variable snow density. Analysis of
the two-dimensional PDF of the data from snow, rain and mixed-phase indicates that snow can
be easily distinguished from rain and mixed-phase hydrometeors if the radar reflectivity factor at
Ku-band is greater than 18 dBZ. Rain, however, is not always separable from mixed-phase data.
In stratiform rain, the region of overlap occurs at ranges near the lower boundary of the melting
layer where the snow melting is nearly complete and where the radar reflectivities and DFR
values from the melting snow resemble those from rain. Apart from this overlap region (25 dBZ
< ZKu < 35 dBZ), the separation between the regions of rain and mixed phases appears feasible.
Although the radar technique described in this study presents a promising way to separate the
regions of snow, rain and mixed-phase hydrometeors, attenuation due to rain and mixed-phase
particles may complicate the identification because Ka-band experiences much more attenuation
than the Ku-band in general, resulting in an increase in DFR. Without proper attenuation
correction, it is possible to misclassify the hydrometeors. One way to circumvent this problem is
to use the SRT and dual-wavelength radar retrieval algorithms. The SRT provides an effective
means for attenuation correction at the surface based on the difference of surface returns between
rain and rain-free areas. The dual-wavelength radar backward approach which works on gate-by-
gate basis can be possibly incorporated with the phase identification scheme to identify the phase
states beginning from the surface and moving upward toward the storm top. To develop a fully
functional radar algorithm, an investigation into an optimal selection of the DFR-ZKu relation
that effectively separates different phase regions is needed. To achieve this, a further study will
be undertaken, which includes an analysis of dual-wavelength radar measurements and the
model computations linking DFR to radar reflectivity under various microphysical conditions,
and an exploration of convective storm in which an obvious bright-band is absent. The
development of an effective dual-wavelength method to distinguish the rain, snow and mixed-
phase hydrometeors will be an important step toward an accurate, efficient DPR profiling
algorithm.


![Radar Observations at 3.5 and 12.6cm Wavelength of Asteroid …goldstein... · 2018-04-03 · ]CARUS 28, 1--15 (1976) Radar Observations at 3.5 and 12.6cm Wavelength of Asteroid 433](https://static.documents.pub/doc/80x56/5e7a64e3fc701777705736bd/radar-observations-at-35-and-126cm-wavelength-of-asteroid-goldstein-2018-04-03.jpg)


