The Summer Internship Project undertaken in Apollo Sindhoori Capital Investments Private Limited, Bhubaneswar.
101
A STUDY ON TECHNICAL ANALYSIS AS AN INDICATOR FOR INVESTMENT DECISION-MAKING SUMMER INTERNSHIP PROJECT REPORT SUBMITTED TO UTKAL UNIVERSITY FOR THE PARTIAL FULFILLMENT OF THE REQUIREMENTS OF MASTER OF FINANCE & CONTROL (MFC) DEGREE Submitted by: SANTOSH KUMAR SAHOO (SESSION 2008-10) Under the guidance of: External Supervisor: Faculty Supervisor: Mr. Sangeet Mishra Mr. Sanjay Kumar Parida Branch Head Faculty, Deptt. Of Finance Apollo Sindhoori Capital Investments Ltd. VISWASS Bhubaneswar Branch 1
Transcript
A STUDY ON TECHNICAL ANALYSIS AS AN INDICATOR FOR INVESTMENT DECISION-MAKING
SUMMER INTERNSHIP PROJECT REPORT SUBMITTED TO UTKAL UNIVERSITY FOR
THE PARTIAL FULFILLMENT OF THE REQUIREMENTS OF MASTER OF FINANCE &
CONTROL (MFC) DEGREE
Submitted by:
SANTOSH KUMAR SAHOO(SESSION 2008-10)
Under the guidance of:
External Supervisor: Faculty Supervisor:
Mr. Sangeet Mishra Mr. Sanjay Kumar Parida Branch Head Faculty, Deptt. Of Finance
Apollo Sindhoori Capital Investments Ltd. VISWASS Bhubaneswar Branch
VIVEKANANDA INSTITUTE OF SOCIAL WORK AND SOCIAL SCIENCES
ROLL NO.: 13759U083017 REGD. NO.: 16419/05
1
DECLARATION
I hereby declare that the project report entitled “A STUDY ON TECHNICAL
ANALYSIS AS AN INDICATOR FOR INVESTMENT DECISION-MAKING” is
submitted by me for partial fulfillment of the requirements of the degree of MASTER OF
FINANCE AND CONTROL, as a course curriculum under UTKAL UNIVERSITY, is an
authentic record of study carried out by me under professional guidance and supervision.
Due acknowledges and references have been made where ever necessary. This project
report is a result of my original work and except some conceptual aspects, technical charts
and some images as prescribed, no portion of the said report has been copied or duplicated
nor has any project report similar to this one ever been submitted to any of the university or
any other organization of this sort.
Date:Place:
(SANTOSH KUMAR SAHOO)
2
ACKNOWLEDGEMENT
I would like to express my gratitude to all those who gave me the possibility to
complete this thesis. I would like to thank my college authorities and my H.O.D. Miss
Kulveen Kaur Anand first for providing me the opportunity to work with one of the most
prestigious organization.
I express my hearty thanks to Mr. Sangeet Mishra, The Branch Head, Apollo
Sindhoori Capital Investments Ltd., Bhubaneswar Branch and Mrs. Samita Mishra, my
company guide who gave and confirmed this permission and encouraged me to go ahead with
my thesis.
I am deeply indebted to my faculty guide Mr. Sanjay Parida, whose help,
stimulating suggestions and encouragements helped me in all the times of research and for
writing the thesis.
I also want to thank Miss Sonali Pattanaik and Mr. Lala Susant Roy who always
stood beside me and encouraged me to complete my project work.
My friends who have supported me in my research work, I want to thank them for all
their help, support, interest and valuable hints.
Especially, I would like to give my hearty thanks to my parents, their love and
blessings enabled me to complete this work.
Date:
Place:(SANTOSH KUMAR SAHOO)
3
PREFACE
The money which is earned is partly spent and the rest saved for meeting future expenses. Instead of keeping the savings idle, people like to use savings in order to get return on it in the future. This is called Investment. One needs to invest to:
earn return on his idle resources generate a specified sum of money for a specific goal in life make a provision for an uncertain future
As per return is concerned Stock Market is treated as the best place to earn higher returns as compared to other means of investment. A huge number of companies are listed there to facilitate effective mobilization and utilization of savings.
In today’s world companies become known or considered big when they are listed on reputed Stock Exchanges namely NSE (NIFTY) & BSE (SENSEX) for India, DOWJONES for USA, HANGSENG for Hong Kong, NIKKEI for Japan, RTS for Russia, etc. Once the company is listed everything a company does / doesn’t is reacted upon by the public and the prices of the share of the respective company fluctuate. Now the company would always want a true picture of the company to be represented by share price, they wouldn’t mind if its overvalued but it hurts when the stocks get undervalued. But this uncertainty of the price gives people a chance to make money both in long term & short term. Long term investment is mainly based upon studying fundamentals of the company and its growth potential. But the real piece of magic lies in making money by trading shares either Intraday or holding for a short term. If one wants to make money in this way, he / she need to know the technical side of the stock i.e. charts, trends etc.
It’s not hard to guess how fascinating it is and so it has been decided to unlock the mystery as far as possible in these two months of time. This field is very difficult to be taught in classroom perhaps beyond scope. One has to see to believe, understand and implement it and that was my main objective after all to find out the answers of following questions:
1. Where will NIFTY go from here?2. Which stock will rise today and which ones will fall?3. Should I hold it or square off my positions?4. Why is hedging required / how is it done?
To find the answer of the above questions and many more it has been chosen to do summer internship in the field of Technical Analysis. Hope the project report will serve the necessity of the needy students, investors and research scholars to find out strategic implications of technical analysis at the time of taking investment decisions and will guide them to unlock the “market-sutra” to sustain in the financial market.
4
“A STUDY ON TECHNICAL ANALYSIS AS AN INDICATOR FOR INVESTMENT DECISION-MAKING”
CONTENTS
CHAPTERS PARTICULARS PAGE NO.
1 INTRODUCTION AND RESEARCH METHODOLOGY 1-4
1.1 Introduction
1.2 Research Methodology
1.2.1 Need for the study
1.2.2 Objectives of the study
1.2.3 Sources of Data
1.2.4 Research Design
1.2.5 Sampling Method
1.2.6 Sampling Size
1.2.7 Limitations of the study
1.1.8 Chapter Plan
2 COMPANY PROFILE 5-7
2.1 About Apollo Sindhoori
2.2 Services provided by the Organization
2.3 Business Network
2.4 Board of Directors
2.5 Company Information
2.6 Conclusion
3 TECHNICAL ANALYSIS 8-45
3.1 Meaning of Technical Analysis
3.2 Assumptions of Technical Analysis
3.3 Technical Analysis and Fundamental Analysis
3.4 The Critics of Technical Analysis
3.5 Co-existence of Technical Analysis and Fundamental Analysis
3.6 Technical Tools
5
3.6.8 Support and Resistance
3.6.9 Volume
3.6.10 Random-Walk Hypothesis
3.6.11 Technical Trends
3.6.12 Trend-Lengths
3.6.13 Trend-Line
3.6.14 Channels
3.6.15 Technical Charts
3.6.15.1 Chart Properties
3.6.15.2 Types of Charts
3.6.15.3 Chart Patterns
3.7 Technical Indicators
3.7.1 Moving Average Convergence Divergence
3.7.2 Relative Strength Index
3.7.3 Stochastic Oscillator
3.7.4 The Dow-Theory
3.7.5 The Short-Interest Ratio
3.7.6 The Confidence Index
3.7.7 Spreads
3.7.8 The Advance-Decline Ratio
3.7.9 The Market Breadth Index
3.7.10 The Odd-lot Ratio
3.7.11 Insider Transactions
3.7.12 Mutual Fund Activity
3.7.13 The Credit-Balance Theory
3.7.14 Performance of Linked Markets
3.8 Summary
4 A SAMPLE SURVEY 46-55
4.7 Objectives of the Survey
4.8 Sample Composition
4.9 Outcomes of the Survey
4.10 Opinion of the Investors
5 FINDINGS AND SUGGESTIONS 56-57
5.1 Findings
5.2 Suggestions
5.3 Conclusion
6
BIBLIOGRAPHY
WEBLIOGRAPHY
APPENDIX
CHAPTER – 1
INTRODUCTION AND RESEARCH METHODOLOGY
1.1 INTRODUCTION
Money is honey for modern man!! In this modern and fast changing world where a
cut-throat competition exits it is treated as the essence of life. It has become the sole purpose
of every human activity. It is the sole target of every start. Starting from the unsunshine lower
levels of deep blue Pacific to the upper layers of Troposphere each and every component is
money oriented now a days. To fulfill such need of money and wealth, modern man uses
investment as a want satisfying and wealth maximizing tool.
Taking investment decisions has become a part of our economic life. Everybody
makes such decisions in different contexts at different times. The appropriateness of such
decisions makes someone Warren Buffet where as some become bankrupts. Therefore, it is
very important to understand and know the right way to take sound investment decisions
which can be made in order to improve the chance of making profits through them.
As investment is concerned, the stock market is treated as the most profitable and
efficient battle field. It gives a scope to earn extra ordinary income by taking high level of
risk where uncertainty exists always. So it is not a game of a child to find the right time and
right choice to invest in. Investment decision-making in such situation can best be viewed as
an integrated process to which security analysis makes its unique contribution. And, in the
process of security analysis, Technical Analysis is treated as the Polestar which shows the
direction to proceed.
Technical Analysis serves the investment decision-maker by pointing the direction
that is most likely to produce the desired results and to meet the expectations of the investors.
7
Whether Technical analysis will ever be classified as a science is doubtful, but research,
training and experience have developed it into a discipline, which means a structured,
consistent and orderly process without rigidity in either concepts or methods.
1.2 RESEARCH METHODOLOGY
1.2.1 NEED FOR THE STUDY
Where the herds of bulls and beers are peeping to the stock market in an expectation
to grab the opportunity to take the advantage of volatility, a study on Technical Analysis is
very much needed to cope with the moment-change market fluctuations in the expected
direction to earn desired profits. This research study fulfills the needs of the speculators,
investors and students to acquire knowledge regarding various technical aspects of investing
the most liquid and hard-earned money not only in profitable stocks, but also at the right time
and at the right price. The thesis describes the various trends and chart patterns which are
very much helpful to find the timing of investment at different market situations.
This study contributes to the knowledge of Stock analysis through integration of the
review of literature and methodology developed for the understanding and resolution of
various related indicators and techniques regarding investment decision-making in stock
market, and empirical work done there on.
The purpose of the summer project report is to allow the study within a coherent,
organized and standardized framework which is necessary to enhance understanding to grasp
knowledge and to clarify the subject matter. It is needed for the direction and procedure of
the study to bring it up to the required scope, coverage, rigor and also to enhance the quality
of research effort.
1.2.2 OBJECTIVES OF THE STUDY
This project was started with an objective to know the basic tools, trends and chart
patterns of Technical Analysis and their implications at the time of investment decision-
making. How investors can gain more out of their investment by using the tools of Technical
Analysis is the central objective of this research study. Collecting information regarding
investors’ response and belief towards Technical Analysis is also an additional objective that
forced to undertake such research study.
1.2.3 SOURCES OF DATA
8
This section of the project emphasizes on the procedure used to accomplish the
project. For this purpose some data have been collected basically from two sources:
Primary Source
Secondary Source
Primary Source
The data collected from primary sources are raw-data. These are the data that are
collected first-hand and have not had any previous meaningful interpretation. The primary
data will be collected through observation, questionnaire and through well-tested personal
interviews with the investors at the door of number of broking houses.
Secondary Source
Any data used that have been collected earlier for some other purposes are known as
Secondary Data. The secondary data has been collected such from various internet portals,
research articles, reference books and various T.V. programmes related to the topic.
1.2.4 RESEARCH DESIGN
The present research study will adopt Descriptive Research Design for properly
designing the research work. Through this, the topic will be studied thoroughly and it will be
presented by giving necessary findings and conclusions.
1.2.5 SAMPLING METHOD
The method adopted is Convenient Sampling method because it was necessary to
cover all types of investors and at different places all over the city, even if by taking the help
of cell phone.
1.2.6 SAMPLE SIZE
The total sample size was 50 and included small investors, speculators, businessmen,
research scholars and finance students. The interview was conducted inside the city of
Bhubaneswar only.
1.2.7 LIMITATIONS OF THE STUDY
Although necessary precautions have taken, still this study suffers from the
following limitations:
The study consists of detailed theoretical explanations.
9
The time period allowed for the study was quite insufficient to cover and analyse all the
technical aspects and to compare it with the behavior of the stock market.
More importance has been given to the subject matter of Technical Analysis only.
The wide range of chart-patterns and trends may create confusion while going through
these.
The study may act as a magic-pedia for a layman having no basic knowledge regarding
securities market.
Confidentiality of information was the biggest limitation that corporate people and
investors were not willing to share.
The primary limitation of the study is that, the survey is limited within the city of
Bhubaneswar only.
1.2.8 CHAPTER PLAN
The study has been divided in to two parts such as the Theoretical aspect and the
Practical aspect. The first part contains a wide explanation of the theories of Technical
analysis where as the second part is enriched with the response of the investors’ and their
beliefs with respect to Technical Analysis. By looking chapter-wise, Chapter-1 opens the
door to enter in to the subject. Chapter-2 gives information about the company under which
the summer internship has been made. Chapter-3 gives a broad idea regarding Technical
Analysis. It narrates about the tools available in Technical Analysis and explains the various
indicators that signals investor-action and guides to expect the future uncertain market
condition. Chapter-4 analyses the data that has been collected from primary sources reflecting
the role of technical charts and trends at the time of investment decision-making. It gives an
idea regarding the applicability and popularity of Technical Analysis in investor-world. It
depicts the response of the investors. And, lastly the study comes to an end with chapter-5
that narrates the findings and suggestions extracted from this study with conclusion.
10
11
FIGURE NO. – 2.1FIGURE TITLE - COMPANYLOGO
CHAPTER – 2
COMPANY PROFILE
2.1 ABOUT APOLLO SINDHOORI
Apollo Sindhoori Capital Investments Limited was a
professionally managed Financial Services organization, belonging to
Apollo Hospitals Group. Being the group’s maiden foray into the
financial services sector, Apollo Sindhoori successfully carried the
strong linage of service, as demonstrated by the flagship company of the group.
Apollo Sindhoori is a leading player in broking space with nearly 14 years of
experience. Incorporated in 1995, the Company became a part of Aditya Birla Group in
March 2009, when the group acquired 76% of the Company through Aditya Birla Nuvo.
The Aditya Birla Group is a household name in India, a US $28 billion conglomerate
that is in the league of the Fortune 500 companies. The Aditya Birla Group has a strong
presence across various financial services verticals as a part of the Aditya Birla Financial
Services Group (ABFSG) that include life insurance, fund management, distribution &
wealth management, security based lending, insurance broking and private equity.
The six companies representing ABFSG are Birla Sun Life Insurance Company, Birla
Sun Life Asset Management Company, Birla Sun Life Distribution Company, Aditya Birla
Capital Advisors, Birla Global Finance Company and Birla Insurance Advisory & Broking
Services. The consolidated revenues from these companies crossed the US $ 1 billion mark,
in 2007-08.
Headquartered in Chennai, ASCIL is listed on National Stock Exchange of India
Limited [NSE] and The Bombay Stock Exchange Limited [BSE]. It is also registered as
Depository Participant with both NSDL and CDSL.
2.2 MANAGEMENT OF THE ORGANISATION
Mr. Pankaj Razdan
Mr. Kanwar Vivek
Mr. Manoj Kedia
Mr. K.R. Sudhakar –Executive Director
Mr. Sudhir Rao
12
Mr. G. Vijayaraghavan
2.3 SERVICES PROVIDED BY THE ORGANISATION
ASCIL offers following services:
Trading facility in Equity segment on and Derivative segment on NSE & BSE
through a single screen.
Trading facility in commodity segment, including bullion, oils, gaur seed etc. through
our subsidiary, Apollo Sindhoori Commodities Trading Limited
Depository Participant [DP] services of NSDL and CDSL at major locations
Online bidding for IPO
Distribution of Mutual Funds
2.4 BUSINESS NETWORK
The Company has a strong distribution network of over 221 own and 687 franchisee
branches, a large customer base in excess of 1,75,000 and a scalable business model based on
a strong technology backbone and a wide product mix. The Company boasts of immense
talent pool and vertical specialists which add to its positioning as a leading player in retail
broking space.
2.5 COMPANY INFORMATION
Company Name: Apollo Sindhoori Capital Investments Limited
Date of Listing (NSE): 07-Feb-2008
Face Value: 1.00
ISIN: INE865C01022
Industry: FINANCE
Issued Cap. : 55400000(shares) as on 14-Aug-2009
Market Cap. : Rs. 190.30(Cr) as on 14-Aug-2009
Impact Cost: 3.38 as on Jul-2009
52 week high/low price: 59.00/9.25
13
2.6 CONCLUSION
As the financial markets are going towards development with the pace of economic
growth, the post-recession market expects a lot from the investors. In this regard it can be
seen that there is a huge scope for the companies providing financial services in coming days.
So, the opportunity to gain more and create a brand equity is there and it is not too hard for a
market player like Apollo Sindhoori to achieve such. A mare sophistication and improvement
in services can pay much.
14
CHAPTER – 3
TECHNICAL ANALYSIS
3.1 MEANING OF TECHNICAL ANALYSIS
Technical analysis is a security analysis technique that claims the ability to forecast
the future direction of prices through the study of past market data, primarily price and
volume. In its purest form, technical analysis considers only the actual price and volume
behavior of the market or instrument. Technical analysts, sometimes called "chartists", may
employ models and trading rules based on price and volume transformations, such as the
relative strength index, moving averages, regressions, inter-market and intra-market price
correlations, cycles or, classically, through recognition of chart patterns.
Technical analysis stands in distinction to fundamental analysis. Technical analysis
"ignores" the actual nature of the company, market, currency or commodity and is based
solely on "the charts," that is to say price and volume information, whereas fundamental
analysis does look at the actual facts of the company, market, currency or commodity. For
example, any large brokerage, trading group, or financial institution will typically have both a
technical analysis and fundamental analysis team.
Just as there are many investment styles on the fundamental side, there are also many
different types of technical traders. Some rely on chart patterns; others use technical
indicators and oscillators, and most use some combination of the two. In any case, technical
analysts' exclusive use of historical price and volume data is what separates them from their
fundamental counterparts. Unlike fundamental analysts, technical analysts don't care whether
a stock is undervalued - the only thing that matters is a security's past trading data and what
information this data can provide about where the security might move in the future.
3.2 ASSUMPTIONS OF TECHNICAL ANALYSIS
Technical Analysis is based on certain assumptions. It does not matter whether the
assumptions are reflected in actual practice or not, investors take those in to consideration
while taking investment decisions and analyzing technical indicators. These basic
assumptions are:
15
1. The Market Discounts Everything
A major criticism of technical analysis is that it only considers price movement,
ignoring the fundamental factors of the company. However, technical analysis assumes that,
at any given time, a stock's price reflects everything that has or could affect the company -
including fundamental factors. Technical analysts believe that the company's fundamentals,
along with broader economic factors and market psychology, are all priced into the stock,
removing the need to actually consider these factors separately. This only leaves the analysis
of price movement, which technical theory views as a product of the supply and demand for a
particular stock in the market.
2. Price Moves in Trends
In technical analysis, price movements are believed to follow trends. This means that
after a trend has been established, the future price movement is more likely to be in the same
direction as the trend than to be against it. Most technical trading strategies are based on this
assumption.
3. History Tends To Repeat Itself
Another important idea in technical analysis is that history tends to repeat itself,
mainly in terms of price movement. The repetitive nature of price movements is attributed to
market psychology; in other words, market participants tend to provide a consistent reaction
to similar market stimuli over time. Technical analysis uses chart patterns to analyze market
movements and understand trends. Although many of these charts have been used for more
than 100 years, they are still believed to be relevant because they illustrate patterns in price
movements that often repeat themselves.
4. Not Just for Stocks
Technical analysis can be used on any security with historical trading data. This
includes stocks, futures and commodities, fixed-income securities, forex, etc. In this report,
we'll usually analyze stocks in our examples, but keep in mind that these concepts can be
applied to any type of security. In fact, technical analysis is more frequently associated with
commodities and forex, where the participants are predominantly traders.
16
3.3 TECHNICAL ANALYSIS & FUNDAMENTAL ANALYSIS
Technical analysis and fundamental analysis are the two main schools of thought in
the financial markets. As we've mentioned, technical analysis looks at the price movement of
a security and uses this data to predict its future price movements. Fundamental analysis, on
the other hand, looks at economic factors, known as fundamentals. Let's get into the details of
how these two approaches differ, the criticisms against technical analysis and how technical
and fundamental analysis can be used together to analyze securities.
The Differences
1. Charts vs. Financial Statements
At the most basic level, a technical analyst approaches a security from the charts,
while a fundamental analyst starts with the financial statements. By looking at the balance
sheet, cash flow statement and income statement, a fundamental analyst tries to determine a
company's value. In financial terms, an analyst attempts to measure a company's intrinsic
value. In this approach, investment decisions are fairly easy to make - if the price of a stock
trades below its intrinsic value, it's a good investment. Although this is an oversimplification
(fundamental analysis goes beyond just the financial statements).
Technical traders, on the other hand, believe there is no reason to analyze a company's
fundamentals because these are all accounted for in the stock's price. Technicians believe that
all the information they need about a stock can be found in its charts.
2. Time Horizon
Fundamental analysis takes a relatively long-term approach to analyzing the market
compared to technical analysis. While technical analysis can be used on a timeframe of
weeks, days or even minutes, fundamental analysis often looks at data over a number of
years.
The different timeframes that these two approaches use is a result of the nature of the
investing style to which they each adhere. It can take a long time for a company's value to be
reflected in the market, so when a fundamental analyst estimates intrinsic value, a gain is not
realized until the stock's market price rises to its "correct" value. This type of investing is
called value investing and assumes that the short-term market is wrong, but that the price of a
17
particular stock will correct itself over the long run. This "long run" can represent a
timeframe of as long as several years, in some cases.
Furthermore, the numbers that a fundamentalist analyzes are only released over long
periods of time. Financial statements are filed quarterly and changes in earnings per share
don't emerge on a daily basis like price and volume information. Also remember that
fundamentals are the actual characteristics of a business. New management can't implement
sweeping changes overnight and it takes time to create new products, marketing campaigns,
supply chains, etc. Part of the reason that fundamental analysts use a long-term timeframe,
therefore, is because the data they use to analyze a stock is generated much more slowly than
the price and volume data used by technical analysts.
3. Trading Versus Investing
Not only is technical analysis more short term in nature that fundamental analysis, but
the goals of a purchase (or sale) of a stock are usually different for each approach. In general,
technical analysis is used for a trade, whereas fundamental analysis is used to make an
investment. Investors buy assets they believe can increase in value, while traders buy assets
they believe they can sell to somebody else at a greater price. The line between a trade and an
investment can be blurry, but it does characterize a difference between the two schools.
3.4 THE CRITICS OF TECHNICAL ANALYSIS
Some critics see technical analysis as a form of black magic. Don't be surprised to see
them question the validity of the discipline to the point where they mock its supporters. In
fact, technical analysis has only recently begun to enjoy some mainstream credibility. While
most analysts on Wall Street focus on the fundamental side, just about any major brokerage
now employs technical analysts as well.
Much of the criticism of technical analysis has its roots in academic theory -
specifically the efficient market hypothesis (EMH). This theory says that the market's price is
always the correct one - any past trading information is already reflected in the price of the
stock and, therefore, any analysis to find undervalued securities is useless.
There are three versions of EMH. In the first, called weak form efficiency, all past
price information is already included in the current price. According to weak form efficiency,
technical analysis can't predict future movements because all past information has already
been accounted for and, therefore, analyzing the stock’s past price movements will provide
no insight into its future movements. In the second, semi-strong form efficiency, fundamental
analysis is also claimed to be of little use in finding investment opportunities. The third is
strong form efficiency, which states that all information in the market is accounted for in a
18
stock's price and neither technical nor fundamental can provide investors with an edge. The
vast majority of academics believe in at least the weak version of EMH, therefore, from their
point of view, if technical analysis works, market efficiency will be called into question.
3.5 CO-EXISTENCE OF TECHNICAL ANALYSIS &FUNDAMENTAL ANALYSIS
Although technical analysis and fundamental analysis are seen by many as polar
opposites - the oil and water of investing - many market participants have experienced great
success by combining the two. For example, some fundamental analysts use technical
analysis techniques to figure out the best time to enter into an undervalued security.
Oftentimes, this situation occurs when the security is severely oversold. By timing entry into
a security, the gains on the investment can be greatly improved.
Alternatively, some technical traders might look at fundamentals to add strength to a
technical signal. For example, if a sell signal is given through technical patterns and
indicators, a technical trader might look to reaffirm his or her decision by looking at some
key fundamental data. Oftentimes, having both the fundamentals and technical’s on your side
can provide the best-case scenario for a trade.
While mixing some of the components of technical and fundamental analysis is not
well received by the most devoted groups in each school, there are certainly benefits to at
least understanding both schools of thought.
3.6 TECHNICAL TOOLS
In Technical Analysis, there are a lot of tools and strategies that enable us to draw
necessary conclusions at the time of taking important decisions. Some of the most applicable
and appreciated tools are discussed below:
3.6.1 SUPPORT AND REGISTANCE
A support level is a price level where the price tends to find support as it is going
down. This means the price is more likely to "bounce" off this level rather than break through
it. However, once the price has passed this level, by an amount exceeding some noise, it is
likely to continue dropping until it finds another support level.
A resistance level is the opposite of a support level. It is where the price tends to find
resistance as it is going up. This means the price is more likely to "bounce" off this level
rather than break through it. However, once the price has passed this level, by an amount
19
exceeding some noise, it is likely that it will continue rising until it finds another resistance
level.
20
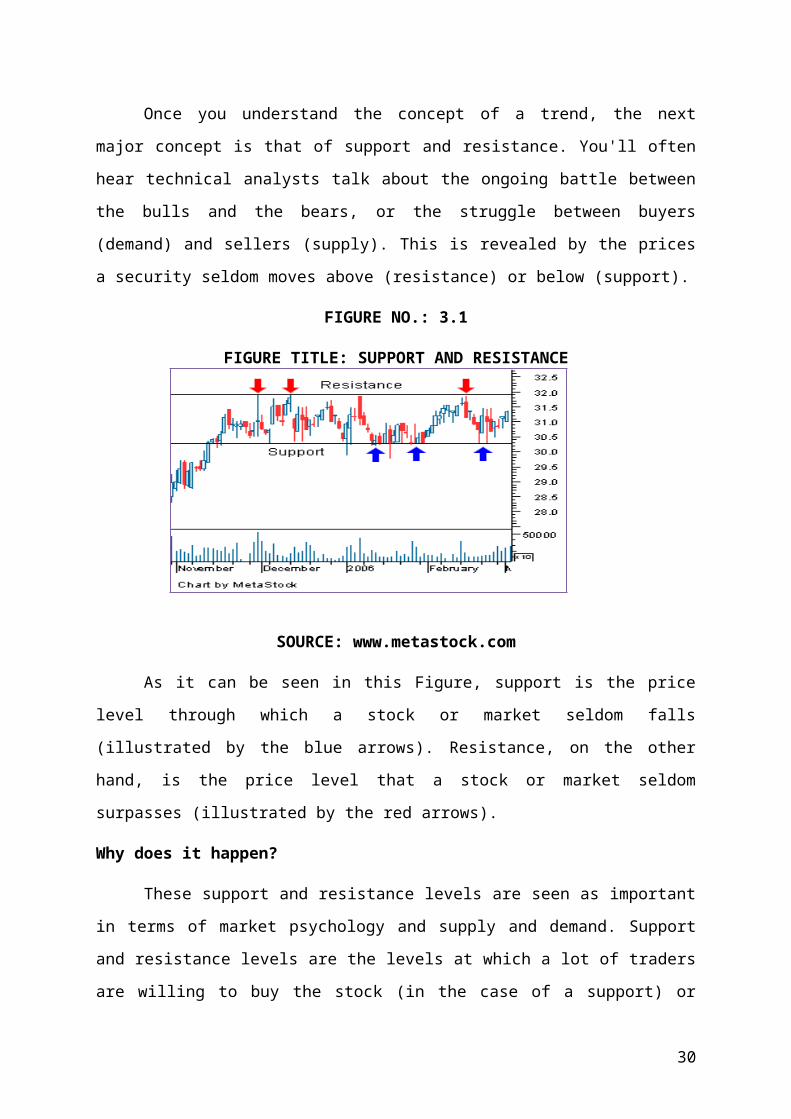
Once you understand the concept of a trend, the next major concept is that of support
and resistance. You'll often hear technical analysts talk about the ongoing battle between the
bulls and the bears, or the struggle between buyers (demand) and sellers (supply). This is
revealed by the prices a security seldom moves above (resistance) or below (support).
FIGURE NO.: 3.1
FIGURE TITLE: SUPPORT AND RESISTANCE
SOURCE: www.metastock.com
As it can be seen in this Figure, support is the price level through which a stock or
market seldom falls (illustrated by the blue arrows). Resistance, on the other hand, is the price
level that a stock or market seldom surpasses (illustrated by the red arrows).
Why does it happen?
These support and resistance levels are seen as important in terms of market
psychology and supply and demand. Support and resistance levels are the levels at which a
lot of traders are willing to buy the stock (in the case of a support) or sell it (in the case of
resistance). When these trend lines are broken, the supply and demand and the psychology
behind the stock's movements is thought to have shifted, in which case new levels of support
and resistance will likely be established.
The Importance of Support and Resistance
Support and resistance analysis is an important part of trends because it can be used to
make trading decisions and identify when a trend is reversing. For example, if a trader
identifies an important level of resistance that has been tested several times but never broken,
he or she may decide to take profits as the security moves toward this point because it is
unlikely that it will move past this level.
21
Support and resistance levels both test and confirm trends and need to be monitored
by anyone who uses technical analysis. As long as the price of the share remains between
these levels of support and resistance, the trend is likely to continue. It is important to note,
however, that a break beyond a level of support or resistance does not always have to be a
reversal. For example, if prices moved above the resistance level of an up trending channel,
the trend have accelerated and not reversed. This means that the price appreciation is
expected to be faster than it was in the channel.
Being aware of these important support and resistance points should affect the way
that you trade a stock. Traders should avoid placing orders at these major points, as the area
around them is usually marked by a lot of volatility. If you feel confident about making a
trade near a support or resistance level, it is important that you follow this simple rule: do not
place orders directly at the support or resistance level. This is because in many cases, the
price never actually reaches the whole number, but flirts with it instead. So if you're bullish
on a stock that is moving toward an important support level, do not place the trade at the
support level. Instead, place it above the support level, but within a few points. On the other
hand, if you are placing stops or short selling, set up your trade price at or below the level of
support.
Round Numbers and Support and Resistance
One type of universal support and resistance that tends to be seen across a large
number of securities is round numbers. Round numbers like 10, 20, 35, 50, 100 and 1,000
tend be important in support and resistance levels because they often represent the major
psychological turning points at which many traders will make buy or sell decisions.
Buyers will often purchase large amounts of stock once the price starts to fall toward
a major round number such as INR 50, which makes it more difficult for shares to fall below
the level. On the other hand, sellers start to sell off a stock as it moves toward a round
number peak, making it difficult to move past this upper level as well. It is the increased
buying and selling pressure at these levels that makes them important points of support and
resistance and, in many cases, major psychological points as well.
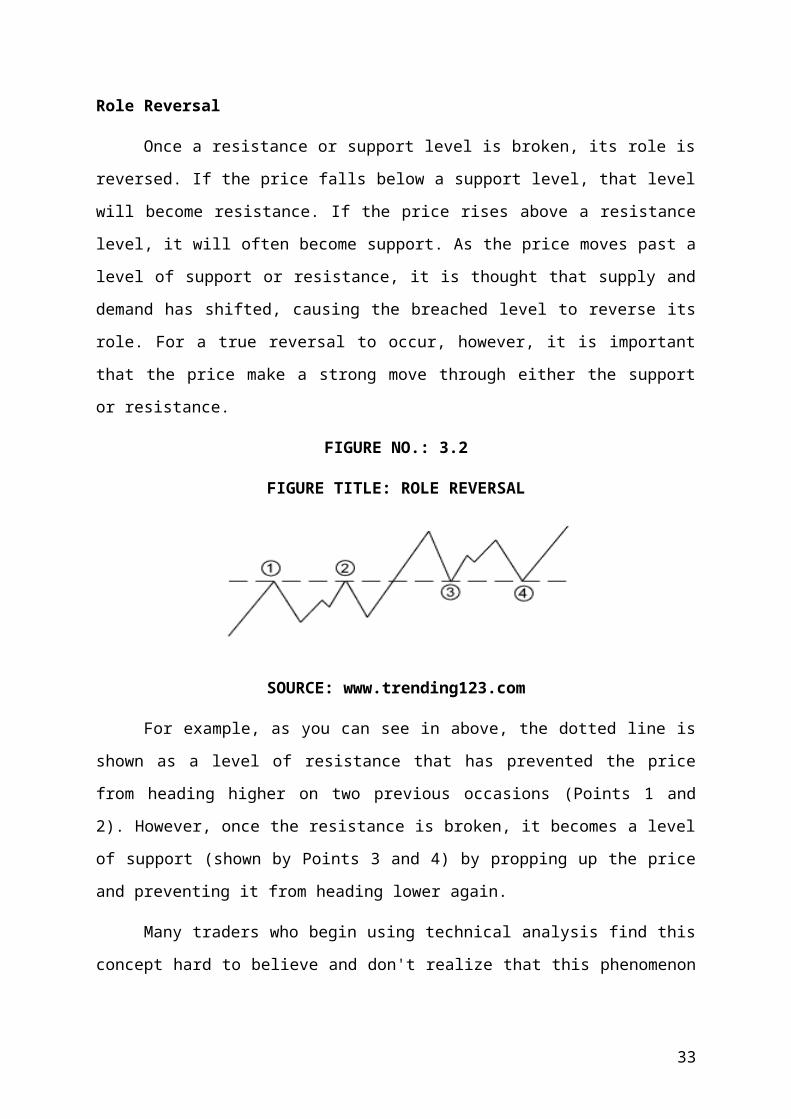
Role Reversal
Once a resistance or support level is broken, its role is reversed. If the price falls
below a support level, that level will become resistance. If the price rises above a resistance
level, it will often become support. As the price moves past a level of support or resistance, it
22
is thought that supply and demand has shifted, causing the breached level to reverse its role.
For a true reversal to occur, however, it is important that the price make a strong move
through either the support or resistance.
FIGURE NO.: 3.2
FIGURE TITLE: ROLE REVERSAL
SOURCE: www.trending123.com
For example, as you can see in above, the dotted line is shown as a level of resistance
that has prevented the price from heading higher on two previous occasions (Points 1 and 2).
However, once the resistance is broken, it becomes a level of support (shown by Points 3 and
4) by propping up the price and preventing it from heading lower again.
Many traders who begin using technical analysis find this concept hard to believe and
don't realize that this phenomenon occurs rather frequently, even with some of the most well-
known companies.
In almost every case, a stock will have both a level of support and a level of resistance
and will trade in this range as it bounces between these levels. This is most often seen when a
stock is trading in a generally sideways manner as the price moves through successive peaks
and troughs, testing resistance and support.
3.6.2 VOLUME
Volume is simply the number of shares or contracts that trade over a given period of
time, usually a day. Higher volume means the security has been more active. To determine
the movement of the volume (up or down), chartists look at the volume bars that can usually
be found at the bottom of any chart. Volume bars illustrate how many shares have traded per
period and show trends in the same way that prices do.
23
FIGURE NO.: 3.3
FIGURE TITLE: VOLUME OF SHARES
SOURCE: www.metastock.com
Why Volume is important?
Volume is an important aspect of technical analysis because it is used to confirm
trends and chart patterns. Any price movement up or down with relatively high volume is
seen as a stronger, more relevant move than a similar move with weak volume. Therefore, if
you are looking at a large price movement, you should also examine the volume to see
whether it tells the same story.
Say, for example, that a stock jumps 5% in one trading day after being in a long
downtrend. Is this a sign of a trend reversal? This is where volume helps traders. If volume is
high during the day relative to the average daily volume, it is a sign that the reversal is
probably for real. On the other hand, if the volume is below average, there may not be enough
conviction to support a true trend reversal.
Volume should move with the trend. If prices are moving in an upward trend, volume
should increase (and vice versa). If the previous relationship between volume and price
movements starts to deteriorate, it is usually a sign of weakness in the trend. For example, if
the stock is in an uptrend but the up trading days are marked with lower volume, it is a sign
that the trend is starting to lose its legs and may soon end.
24
When volume tells a different story, it is a case of divergence, which refers to a
contradiction between two different indicators. The simplest example of divergence is a clear
upward trend on declining volume.
Volume and Chart Patterns
The other use of volume is to confirm chart patterns. Patterns such as head and
shoulders, triangles, flags and other price patterns can be confirmed with volume. In most
chart patterns, there are several pivotal points that are vital to what the chart is able to convey
to chartists. Basically, if the volume is not there to confirm the pivotal moments of a chart
pattern, the quality of the signal formed by the pattern is weakened.
Volume Precedes Price
Another important idea in technical analysis is that price is preceded by volume.
Volume is closely monitored by technicians and chartists to form ideas on upcoming trend
reversals. If volume is starting to decrease in an uptrend, it is usually a sign that the upward
run is about to end.
3.6.3 RANDOM WALK HYPOTHESIS
The random walk hypothesis is a financial theory stating that stock market prices evolve
according to a random walk and thus the prices of the stock market cannot be predicted. It has
been described as 'jibing' with the efficient market hypothesis. Economists have historically
accepted the random walk hypothesis. They have run several tests and continue to believe
that stock prices are completely random because of the efficiency of the market.
3.7.4 TECHNICAL TRENDS
One of the most important concepts in technical analysis is that of trend. The meaning in finance isn't all
that different from the general definition of the term - a trend is really nothing more than the general direction in
which a security or market is headed. It is important to be able to understand and identify trends so
that you can trade with rather than against them. Two important sayings in technical analysis
are "the trend is your friend" and "don't buck the trend," illustrating how important trend
analysis is for technical traders.
There are three types of trends as:
Up-Trend
As the names imply, when each successive peak and trough is higher, it's referred to
as an upward trend.
25
Downtrend
It describes the price movement of a financial asset when the overall direction is
downward. A formal downtrend occurs when each successive peak and trough is lower than
the ones found earlier in the trend.
FIGURE NO.: 3.4
FIGURE TITLE: DOWNTREND OF SHARE PRICE
SOURCE: www.investopedia.com
Downtrend is the opposite of uptrend. Many traders seek to avoid
downtrends because they can drastically affect the value of any investment. A downtrend can
last for minutes, days, weeks, months or even years so identifying a downtrend early is very
important. Once a downtrend has been established (series of lower peaks) a trader should be
very cautious about entering into any new long positions.
Sideways/Horizontal Trends
It describes the horizontal price movement that occurs when the forces of supply and
demand are nearly equal. A sideways trend is often regarded as a period of consolidation
before the price continues in the direction of the previous move.
A sideways price trend is also commonly known as a "horizontal trend". Sideways trend
is generally a result of the price traveling between strong levels of support and resistance. It is
not uncommon to see a horizontal trend dominate the price action of a specific asset for a
prolonged period before starting a move higher or lower. Brief consolidation is often needed
during large price runs, as it is nearly impossible for such large price moves to sustain
themselves over the longer term.
26
3.6.5 TREND LENGTHS
Along with these three trend directions, there are three trend classifications. A trend of
any direction can be classified as a long-term trend, intermediate trend or a short term trend.
In terms of the stock market, a major trend is generally categorized as one lasting longer than
a year. An intermediate trend is considered to last between one and three months and a near-
term trend is anything less than a month. A long-term trend is composed of several
intermediate trends, which often move against the direction of the major trend. If the major
trend is upward and there is a downward correction in price movement followed by a
continuation of the uptrend, the correction is considered to be an intermediate trend. The
short-term trends are components of both major and intermediate trends. Take a look a Figure
4 to get a sense of how these three trend lengths might look.
FIGURE NO.:3.5
FIGURE TITLE: TRENDLENGTHS
SOURCE: www.metastock.com
When analyzing trends, it is important that the chart is constructed to best reflect the type
of trend being analyzed. To help identify long-term trends, weekly charts or daily charts
spanning a five-year period are used by chartists to get a better idea of the long-term trend.
Daily data charts are best used when analyzing both intermediate and short-term trends. It is
also important to remember that the longer the trend, the more important it is; for example, a
one-month trend is not as significant as a five-year trend.
27
3.6.6 TRENDLINE
A trendline is a simple charting technique that adds a line to a chart to represent the trend
in the market or a stock. Drawing a trendline is as simple as drawing a straight line that
follows a general trend. These lines are used to clearly show the trend and are also used in the
identification of trend reversals.
As it can be seen in the figure, an upward trendline is drawn at the lows of an upward
trend. This line represents the support the stock has every time it moves from a high to a low.
Notice how the price is propped up by this support. This type of trendline helps traders to
anticipate the point at which a stock's price will begin moving upwards again. Similarly, a
downward trendline is drawn at the highs of the downward trend. This line represents the
resistance level that a stock faces every time the price moves from a low to a high.
FIGURE NO.: 3.6
FIGURE TITLE: TRENDLINE
SOURCE: www.metastock.com
3.6.7 CHANNELS
A channel, or channel lines, is the addition of two parallel trendlines that act as strong
areas of support and resistance. The upper trendline connects a series of highs, while the
lower trendline connects a series of lows. A channel can slope upward, downward or
sideways but, regardless of the direction, the interpretation remains the same. Traders will
expect a given security to trade between the two levels of support and resistance until it
breaks beyond one of the levels, in which case traders can expect a sharp move in the
direction of the break. Along with clearly displaying the trend, channels are mainly used to
illustrate important areas of support and resistance.
28
FIGURE NO.: 3.7
FIGURE TITLE: CHANNEL
SOURCE: www.metastock.com
Figure illustrates a descending channel on a stock chart; the upper trendline has been
placed on the highs and the lower trendline is on the lows. The price has bounced off of these
lines several times, and has remained range-bound for several months. As long as the price
does not fall below the lower line or move beyond the upper resistance, the range-bound
downtrend is expected to continue.
3.6.8 TECHNICAL CHARTS
In technical analysis, charts are similar to the charts that you see in any business
setting. A chart is simply a graphical representation of a series of prices over a set time frame.
For example, a chart may show a stock's price movement over a one-year period, where each
point on the graph represents the closing price for each day the stock is traded:
FIGURE NO.: 3.8
FIGURE TITLE: A SAMPLE CHART
SOURCE: www.stockcharts.com
29
The above figure provides an example of a basic chart. It is a representation of the
price movements of a stock over a 1.5 year period. The bottom of the graph, running
horizontally (x-axis), is the date or time scale. On the right hand side, running vertically (y-
axis), the price of the security is shown. By looking at the graph we see that in October 2004
(Point 1), the price of this stock was around INR 245, whereas in June 2005 (Point 2), the
stock's price is around INR 265. This tells us that the stock has risen between October 2004
and June 2005.
3.6.8.1 CHART PROPERTIES
There are several things that you should be aware of when looking at a chart, as these
factors can affect the information that is provided. They include the time scale, the price scale
and the price point properties used.
1. The Time Scale
The time scale refers to the range of dates at the bottom of the chart, which can vary
from decades to seconds. The most frequently used time scales are intraday, daily, weekly,
monthly, quarterly and annually. The shorter the time frame, the more detailed the chart.
Each data point can represent the closing price of the period or show the open, the high, the
low and the close depending on the chart used.
Intraday charts plot price movement within the period of one day. This means that the
time scale could be as short as five minutes or could cover the whole trading day from the
opening bell to the closing bell.
Daily charts are comprised of a series of price movements in which each price point
on the chart is a full day’s trading condensed into one point. Again, each point on the graph
can be simply the closing price or can entail the open, high, low and close for the stock over
the day. These data points are spread out over weekly, monthly and even yearly time scales to
monitor both short-term and intermediate trends in price movement.
Weekly, monthly, quarterly and yearly charts are used to analyze longer term trends
in the movement of a stock's price. Each data point in these graphs will be a condensed
version of what happened over the specified period. So for a weekly chart, each data point
will be a representation of the price movement of the week. For example, if you are looking
at a chart of weekly data spread over a five-year period and each data point is the closing
price for the week, the price that is plotted will be the closing price on the last trading day of
the week, which is usually a Friday.
30
2. The Price Scale and Price Point Properties
The price scale is on the right-hand side of the chart. It shows a stock's current price
and compares it to past data points. This may seem like a simple concept in that the price
scale goes from lower prices to higher prices as you move along the scale from the bottom to
the top. The problem, however, is in the structure of the scale itself. A scale can either be
constructed in a linear (arithmetic) or logarithmic way, and both of these options are available
on most charting services.
If a price scale is constructed using a linear scale, the space between each price point
(10, 20, 30, 40) is separated by an equal amount. A price move from 10 to 20 on a linear scale
is the same distance on the chart as a move from 40 to 50. In other words, the price scale
measures moves in absolute terms and does not show the effects of percent change.
FIGURE NO.: 3.9
FIGURE TITLE: PRICE SCALE
SOURCE: www.metastock.com
If a price scale is in logarithmic terms, then the distance between points will be equal
in terms of percent change. A price change from 10 to 20 is a 100% increase in the price
while a move from 40 to 50 is only a 25% change, even though they are represented by the
same distance on a linear scale. On a logarithmic scale, the distance of the 100% price change
from 10 to 20 will not be the same as the 25% change from 40 to 50. In this case, the move
from 10 to 20 is represented by a larger space one the chart, while the move from 40 to 50, is
represented by a smaller space because, percentage-wise, it indicates a smaller move. In
Figure 2, the logarithmic price scale on the right leaves the same amount of space between 10
and 20 as it does between 20 and 40 because these both represent 100% increases.
31
3.6.8.2 TYPES OF CHARTS
There are four main types of charts that are used by investors and traders depending
on the information that they are seeking and their individual skill levels. The chart types are:
the line chart, the bar chart, the candlestick chart and the point and figure chart.
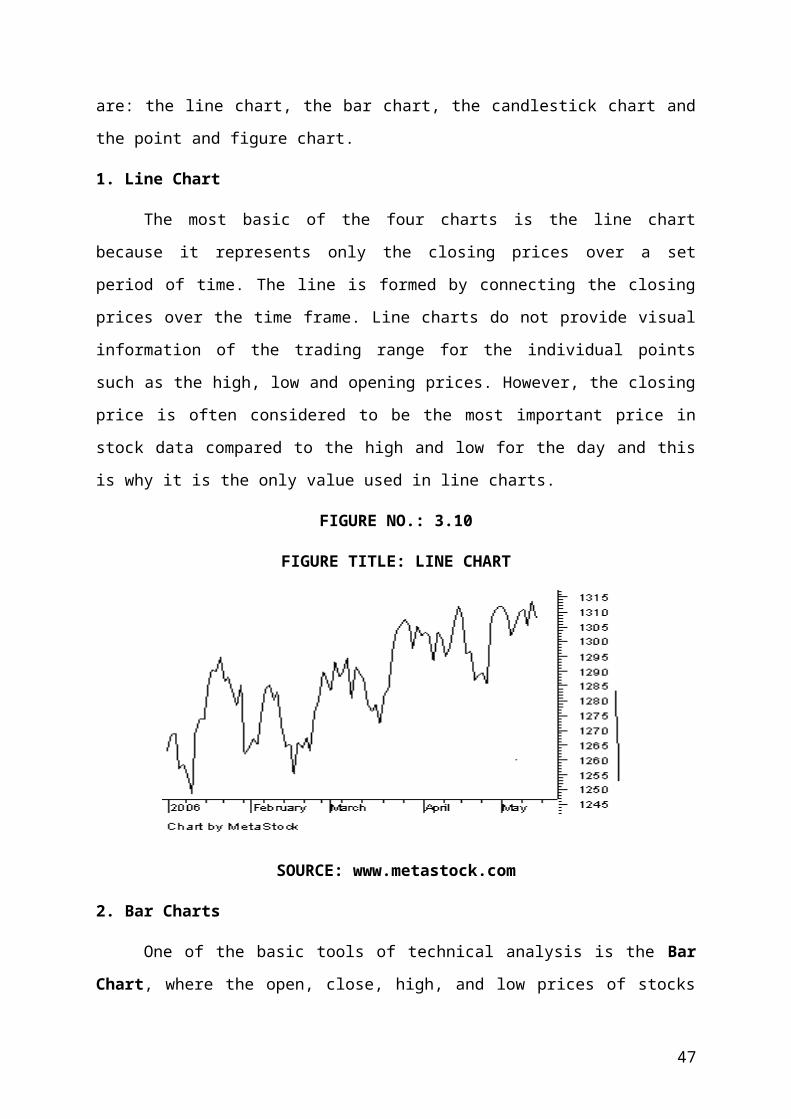
1. Line Chart
The most basic of the four charts is the line chart because it represents only the
closing prices over a set period of time. The line is formed by connecting the closing prices
over the time frame. Line charts do not provide visual information of the trading range for the
individual points such as the high, low and opening prices. However, the closing price is
often considered to be the most important price in stock data compared to the high and low
for the day and this is why it is the only value used in line charts.
FIGURE NO.: 3.10
FIGURE TITLE: LINE CHART
SOURCE: www.metastock.com
2. Bar Charts
One of the basic tools of technical analysis is the Bar Chart, where the open, close,
high, and low prices of stocks or other financial instruments are embedded in bars which are
plotted as a series of prices over a specific time period. Bar charts allow traders to see
patterns more easily. In other words, each bar is actually just a set of 4 prices for a given day,
or some other time period, that is connected by a bar in a specific way—hence, it is often
referred to as a price bar.
32
FIGURE NO.: 3.11
FIGURE TITLE: PRICE BAR
SOURCE: www.thismatter.com
A price bar shows the opening price of the financial instrument, which is the price at
the beginning of the time period, as a left horizontal line, and the closing price, which is the
last price for the period, as a right horizontal line. These horizontal lines are also called tick
marks. The high price is represented by the top of the bar and the low price is depicted by
the bottom of the bar.
The bar chart expands on the line chart by adding several more key pieces of
information to each data point. The chart is made up of a series of vertical lines that represent
each data point. This vertical line represents the high and low for the trading period, along
with the closing price. The close and open are represented on the vertical line by a horizontal
dash. The opening price on a bar chart is illustrated by the dash that is located on the left side
of the vertical bar. Conversely, the close is represented by the dash on the right. Generally, if
the left dash (open) is lower than the right dash (close) then the bar will be shaded black,
representing an up period for the stock, which means it has gained value. A bar that is colored
red signals that the stock has gone down in value over that period. When this is the case, the
dash on the right (close) is lower than the dash on the left (open).
Following is a bar chart that represents the details:
33
FIGURE NO.: 3.12
FIGURE TITLE: BAR CHART
SOURCE: www.metastock.com
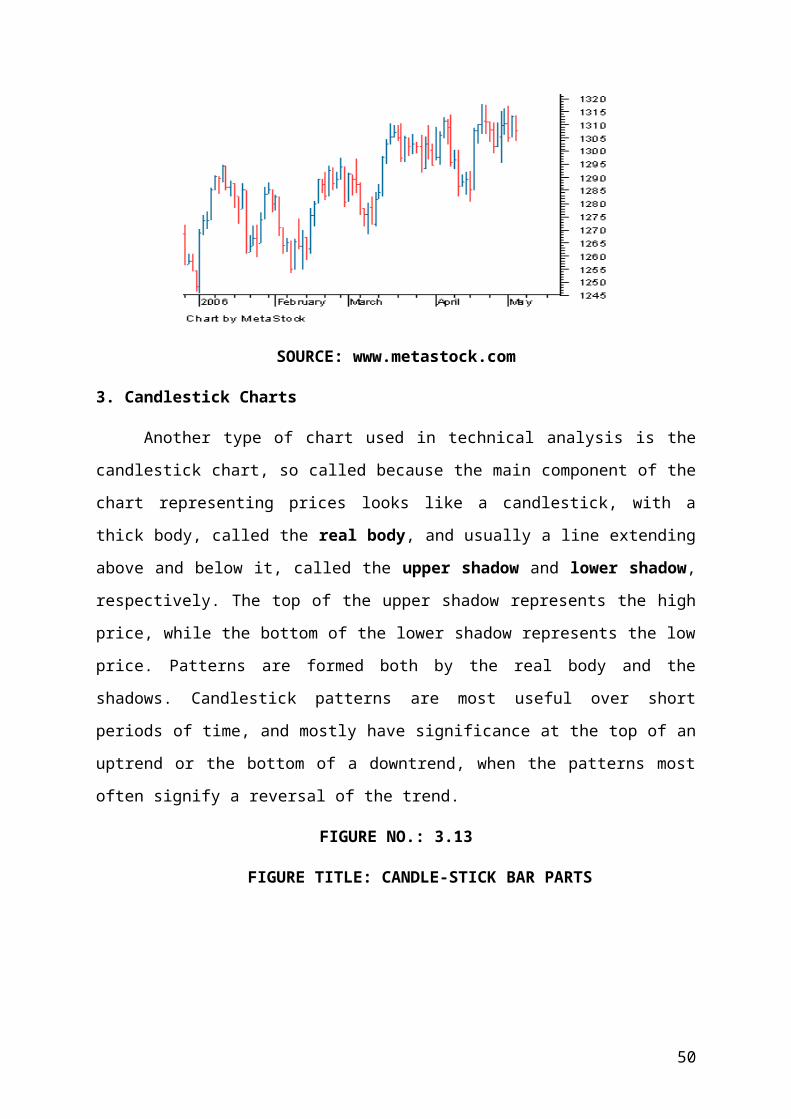
3. Candlestick Charts
Another type of chart used in technical analysis is the candlestick chart, so called
because the main component of the chart representing prices looks like a candlestick, with a
thick body, called the real body, and usually a line extending above and below it, called the
upper shadow and lower shadow, respectively. The top of the upper shadow represents the
high price, while the bottom of the lower shadow represents the low price. Patterns are
formed both by the real body and the shadows. Candlestick patterns are most useful over
short periods of time, and mostly have significance at the top of an uptrend or the bottom of a
downtrend, when the patterns most often signify a reversal of the trend.
FIGURE NO.: 3.13
FIGURE TITLE: CANDLE-STICK BAR PARTS
SOURCE: www.wikipedia.com
34
While the candlestick chart shows basically the same information as the bar chart,
certain patterns are more apparent in the candlestick chart. The candlestick chart emphasizes
opening and closing prices. The top and bottom of the real body represents the opening and
closing prices. Whether the top represents the opening or closing price depends on the color
of the real body—if it is white, then the top represents the close; black, or some other dark
color, indicates that the top was the opening price. The length of the real body shows the
difference between the opening and closing prices. Obviously, white real bodies indicate
bullishness, while black real bodies indicate bearishness, and their pattern is easily observable
in a candlestick chart.
The candlestick chart is similar to a bar chart, but it differs in the way that it is
visually constructed. Similar to the bar chart, the candlestick also has a thin vertical line
showing the period's trading range. The difference comes in the formation of a wide bar on
the vertical line, which illustrates the difference between the open and close. There are two
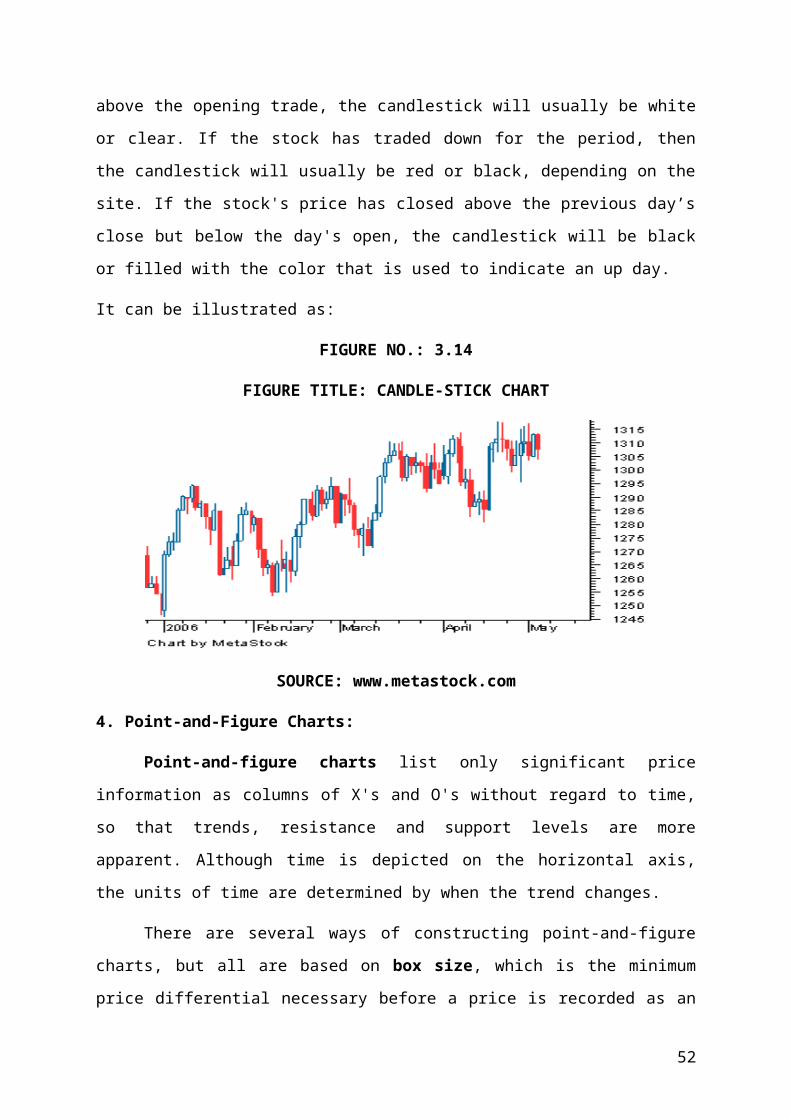
color constructs for days up and one for days that the price falls. When the price of the stock
is up and closes above the opening trade, the candlestick will usually be white or clear. If the
stock has traded down for the period, then the candlestick will usually be red or black,
depending on the site. If the stock's price has closed above the previous day’s close but below
the day's open, the candlestick will be black or filled with the color that is used to indicate an
up day.
It can be illustrated as:
FIGURE NO.: 3.14
FIGURE TITLE: CANDLE-STICK CHART
SOURCE: www.metastock.com
35
4. Point-and-Figure Charts:
Point-and-figure charts list only significant price information as columns of X's and
O's without regard to time, so that trends, resistance and support levels are more apparent.
Although time is depicted on the horizontal axis, the units of time are determined by when
the trend changes.
There are several ways of constructing point-and-figure charts, but all are based on
box size, which is the minimum price differential necessary before a price is recorded as an X
or an O. Columns of X's show an uptrend, and O's show a downtrend. Generally, closing
price differentials are used. There is no high, low, opening, or closing prices recorded, since
only the change in price greater than the box size is recorded as an X if the price differential
is up or as an O if it is down. Each consecutive X is recorded in the same column above the
previous X until the price reverses by more than the box size, then a new column is started by
recording an O in a box below and to the right of the highest X in the previous column. O's
are added downward with each price decrease greater than the box size until the downtrend
reverses to an uptrend, starting a new column where the 1 st X is placed in the box above and
to the right of the last O in the previous column.
The construction of point-and-figure charts simplifies the drawing of trend lines, and
support and resistance levels, which is why point-and-figure charts are ideal for detecting
trends, and determining support and resistance levels.
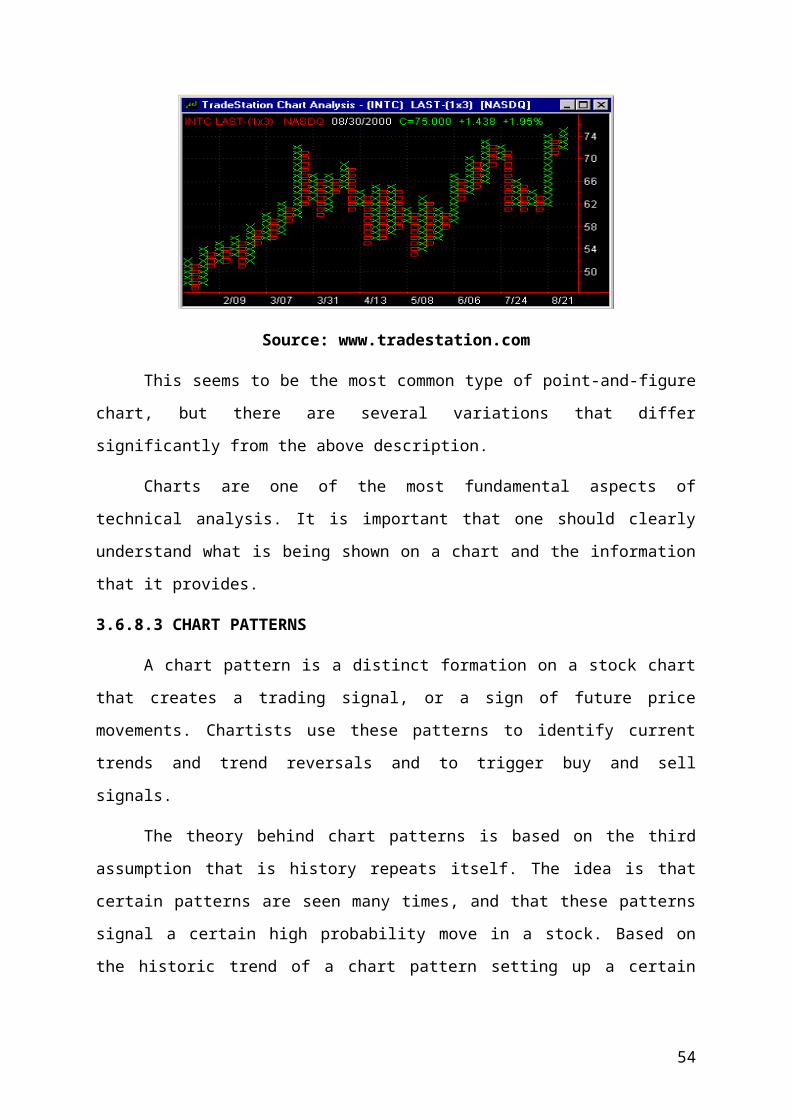
Following is the point-and-figure chart of Intel Corporation. In this chart, the X's are green
and the O's are red, which increases their contrast, making patterns more apparent.
FIGURE NO.: 3.15
FIGURE TITLE: POINT AND FIGURE CHART
Source: www.tradestation.com
36
This seems to be the most common type of point-and-figure chart, but there are
several variations that differ significantly from the above description.
Charts are one of the most fundamental aspects of technical analysis. It is important
that one should clearly understand what is being shown on a chart and the information that it
provides.
3.6.8.3 CHART PATTERNS
A chart pattern is a distinct formation on a stock chart that creates a trading signal, or
a sign of future price movements. Chartists use these patterns to identify current trends and
trend reversals and to trigger buy and sell signals.
The theory behind chart patterns is based on the third assumption that is history
repeats itself. The idea is that certain patterns are seen many times, and that these patterns
signal a certain high probability move in a stock. Based on the historic trend of a chart pattern
setting up a certain price movement, chartists look for these patterns to identify trading
opportunities.
While there are general ideas and components to every chart pattern, there is no chart
pattern that will tell you with 100% certainty where a security is headed. This creates some
leeway and debate as to what a good pattern looks like, and is a major reason why charting is
often seen as more of an art than a science.
There are two types of patterns within this area of technical analysis, reversal and
continuation. A reversal pattern signals that a prior trend will reverse upon completion of the
pattern. A continuation pattern, on the other hand, signals that a trend will continue once the
pattern is complete. These patterns can be found over charts of any timeframe. In this section,
we will review some of the more popular chart patterns.
1. Head and Shoulders
This is one of the most popular and reliable chart patterns in technical analysis. Head
and shoulders is a reversal chart pattern that when formed, signals that the security is likely to
move against the previous trend. As you can see in Figure, there are two versions of the head
and shoulders chart pattern. Head and shoulders top (shown on the left) is a chart pattern that
is formed at the high of an upward movement and signals that the upward trend is about to
end. Head and shoulders bottom, also known as inverse head and shoulders (shown on the
right) is the lesser known of the two, but is used to signal a reversal in a downtrend.
37
FIGURE NO.: 3.16FIGURE TITLE: HEAD AND SHOULDER CHART PATTERN
SOURCE: www.metastock.com
Figure: Head and shoulders top is shown on the left. Head and shoulders bottom, or inverse
head and shoulders, is on the right.
Both of these head and shoulders patterns are similar in that there are four main parts:
two shoulders, a head and a neckline. Also, each individual head and shoulder is comprised
of a high and a low. For example, in the head and shoulders top image shown on the left side
in Figure 1, the left shoulder is made up of a high followed by a low. In this pattern, the
neckline is a level of support or resistance. It can be remember that an upward trend is a
period of successive rising highs and rising lows. The head and shoulders chart pattern,
therefore, illustrates a weakening in a trend by showing the deterioration in the successive
movements of the highs and lows.
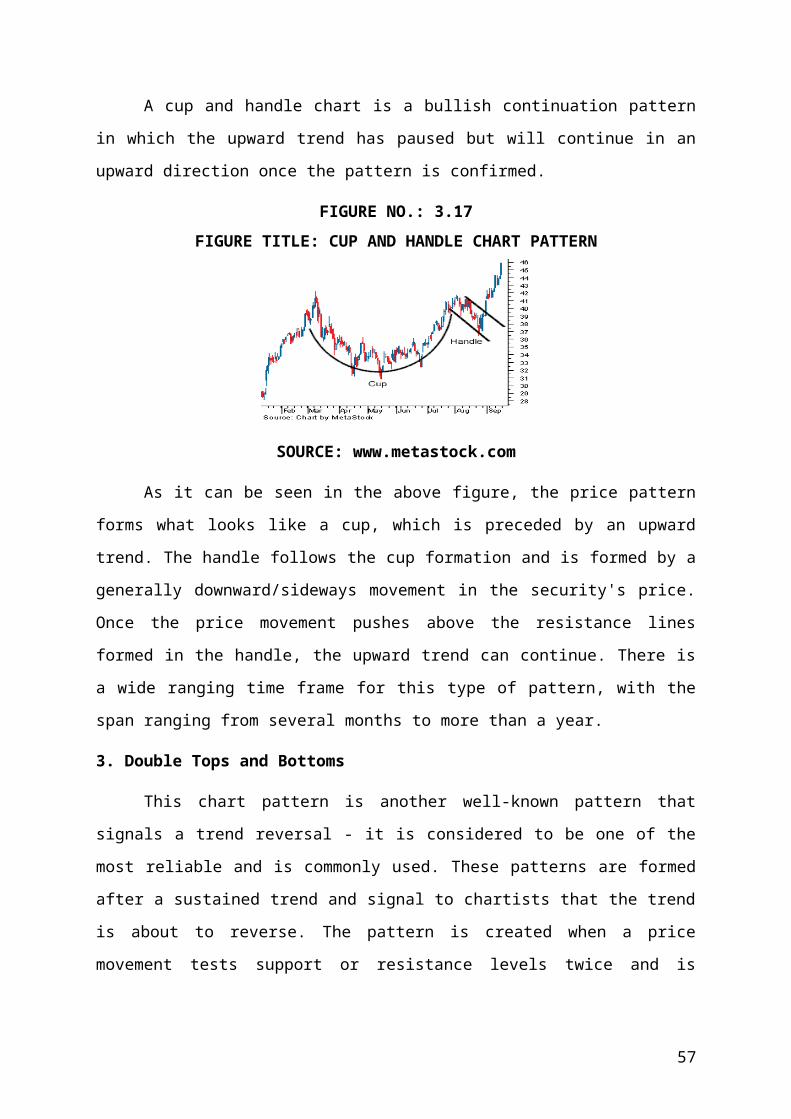
2. Cup and Handle
A cup and handle chart is a bullish continuation pattern in which the upward trend has
paused but will continue in an upward direction once the pattern is confirmed.
FIGURE NO.: 3.17
FIGURE TITLE: CUP AND HANDLE CHART PATTERN
SOURCE: www.metastock.com
38
As it can be seen in the above figure, the price pattern forms what looks like a cup,
which is preceded by an upward trend. The handle follows the cup formation and is formed
by a generally downward/sideways movement in the security's price. Once the price
movement pushes above the resistance lines formed in the handle, the upward trend can
continue. There is a wide ranging time frame for this type of pattern, with the span ranging
from several months to more than a year.
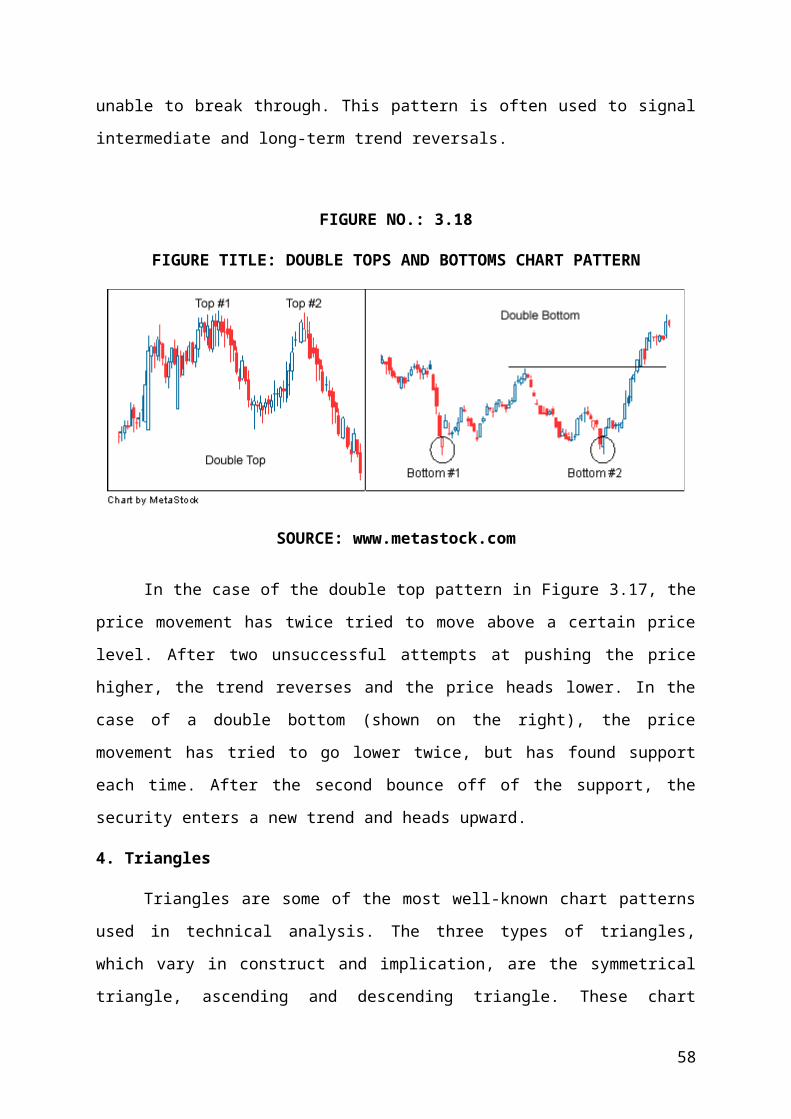
3. Double Tops and Bottoms
This chart pattern is another well-known pattern that signals a trend reversal - it is
considered to be one of the most reliable and is commonly used. These patterns are formed
after a sustained trend and signal to chartists that the trend is about to reverse. The pattern is
created when a price movement tests support or resistance levels twice and is unable to break
through. This pattern is often used to signal intermediate and long-term trend reversals.
FIGURE NO.: 3.18
FIGURE TITLE: DOUBLE TOPS AND BOTTOMS CHART PATTERN
SOURCE: www.metastock.com
In the case of the double top pattern in Figure 3.17, the price movement has twice
tried to move above a certain price level. After two unsuccessful attempts at pushing the price
higher, the trend reverses and the price heads lower. In the case of a double bottom (shown
on the right), the price movement has tried to go lower twice, but has found support each
time. After the second bounce off of the support, the security enters a new trend and heads
upward.
39
4. Triangles
Triangles are some of the most well-known chart patterns used in technical analysis.
The three types of triangles, which vary in construct and implication, are the symmetrical
triangle, ascending and descending triangle. These chart patterns are considered to last
anywhere from a couple of weeks to several months.
FIGURE NO.: 3.19
FIGURE TITLE: TRIANGLES CHART PATTERN
SOURCE: www.metastock.com
The symmetrical triangle in Figure 4 is a pattern in which two trendline converge
toward each other. This pattern is neutral in that a breakout to the upside or downside is a
confirmation of a trend in that direction. In an ascending triangle, the upper trendline is flat,
while the bottom trendline is upward sloping. This is generally thought of as a bullish pattern
in which chartists look for an upside breakout. In a descending triangle, the lower trendline is
flat and the upper trendline is descending. This is generally seen as a bearish pattern where
chartists look for a downside breakout.
40
5. Flag and Pennant
These two short-term chart patterns are continuation patterns that are formed when
there is a sharp movement followed by a generally sideways price movement. This pattern is
then completed upon another sharp price movement in the same direction as the move that
started the trend. The patterns are generally thought to last from one to three weeks.
FIGURE NO.: 3.20
FIGURE TITLE: FLAG AND PENNANT CHART PATTERN
SOURCE: www.metastock.com
As you can see, there is little difference between a pennant and a flag. The main
difference between these price movements can be seen in the middle section of the chart
pattern. In a pennant, the middle section is characterized by converging trendline, much like
what is seen in a symmetrical triangle. The middle section on the flag pattern, on the other
hand, shows a channel pattern, with no convergence between the trendline. In both cases, the
trend is expected to continue when the price moves above the upper trendline.
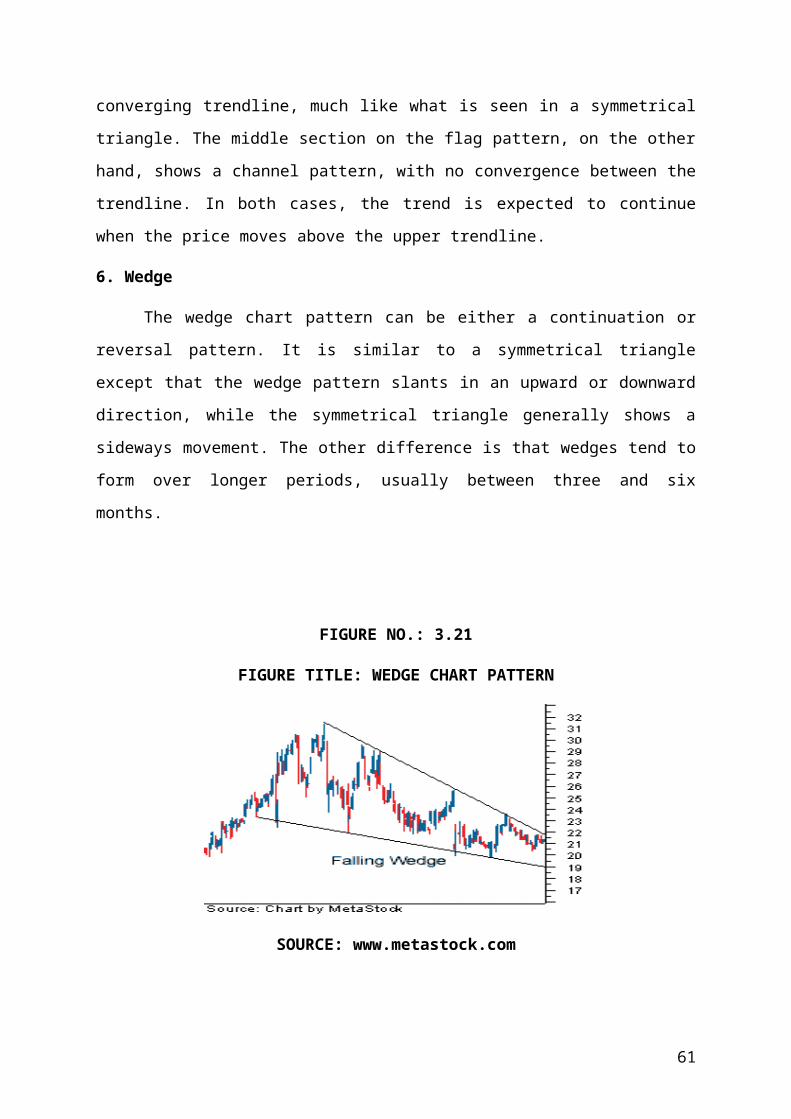
6. Wedge
The wedge chart pattern can be either a continuation or reversal pattern. It is similar to
a symmetrical triangle except that the wedge pattern slants in an upward or downward
direction, while the symmetrical triangle generally shows a sideways movement. The other
difference is that wedges tend to form over longer periods, usually between three and six
months.
41
FIGURE NO.: 3.21
FIGURE TITLE: WEDGE CHART PATTERN
SOURCE: www.metastock.com
The fact that wedges are classified as both continuation and reversal patterns can
make reading signals confusing. However, at the most basic level, a falling wedge is bullish
and a rising wedge is bearish. In the above figure, we have a falling wedge in which two
trend lines are converging in a downward direction. If the price was to rise above the upper
trendline, it would form a continuation pattern, while a move below the lower trendline
would signal a reversal pattern.
7. Gaps
A gap is witnessed very recently when the trade was halted due to upper freeze @
20%. A gap in a chart is an empty space between a trading period and the following trading
period. This occurs when there is a large difference in prices between two sequential trading
periods. For example, if the trading range in one period is between INR 25 and INR 30 and
the next trading period opens at INR 40, there will be a large gap on the chart between these
two periods. Gap price movements can be found on bar charts and candlestick charts but will
not be found on point and figure or basic line charts. Gaps generally show that something of
significance has happened in the security, such as a better-than-expected earnings
announcement.
There are three main types of gaps, breakaway, runaway (measuring) and exhaustion.
A breakaway gap forms at the start of a trend, a runaway gap forms during the middle of a
trend and an exhaustion gap forms near the end of a trend.
42
3.7 TECHNICAL INDICATORS
Indicators are calculations based on the price and the volume of a security that
measure such things as money flow, trends, volatility and momentum. Indicators are used as
a secondary measure to the actual price movements and add additional information to the
analysis of securities. Indicators are used in two main ways: to confirm price movement and
the quality of chart patterns, and to form buy and sell signals.
There are two main types of indicators: leading and lagging. A leading indicator
precedes price movements, giving them a predictive quality, while a lagging indicator is a
confirmation tool because it follows price movement. A leading indicator is thought to be the
strongest during periods of sideways or non-trending trading ranges, while the lagging
indicators are still useful during trending periods.
There are also two types of indicator constructions: those that fall in a bounded range
and those that do not. The ones that are bound within a range are called oscillators - these are
the most common type of indicators. Oscillator indicators have a range, for example between
zero and 100, and signal periods where the security is overbought (near 100) or oversold
(near zero). Non-bounded indicators still form buy and sell signals along with displaying
strength or weakness, but they vary in the way they do this.
The two main ways that indicators are used to form buy and sell signals in technical
analysis is through crossovers and divergence. Crossovers are the most popular and are
reflected when either the price moves through the moving average, or when two different
moving averages cross over each other. The second way indicators are used is through
divergence, which happens when the direction of the price trend and the direction of the
indicator trend are moving in the opposite direction. This signals to indicator users that the
direction of the price trend is weakening.
Indicators that are used in technical analysis provide an extremely useful source of
additional information. These indicators help identify momentum, trends, volatility and
various other aspects in a security to aid in the technical analysis of trends. It is important to
note that while some traders use a single indicator solely for buy and sell signals, they are
best used in conjunction with price movement, chart patterns and other indicators.
43
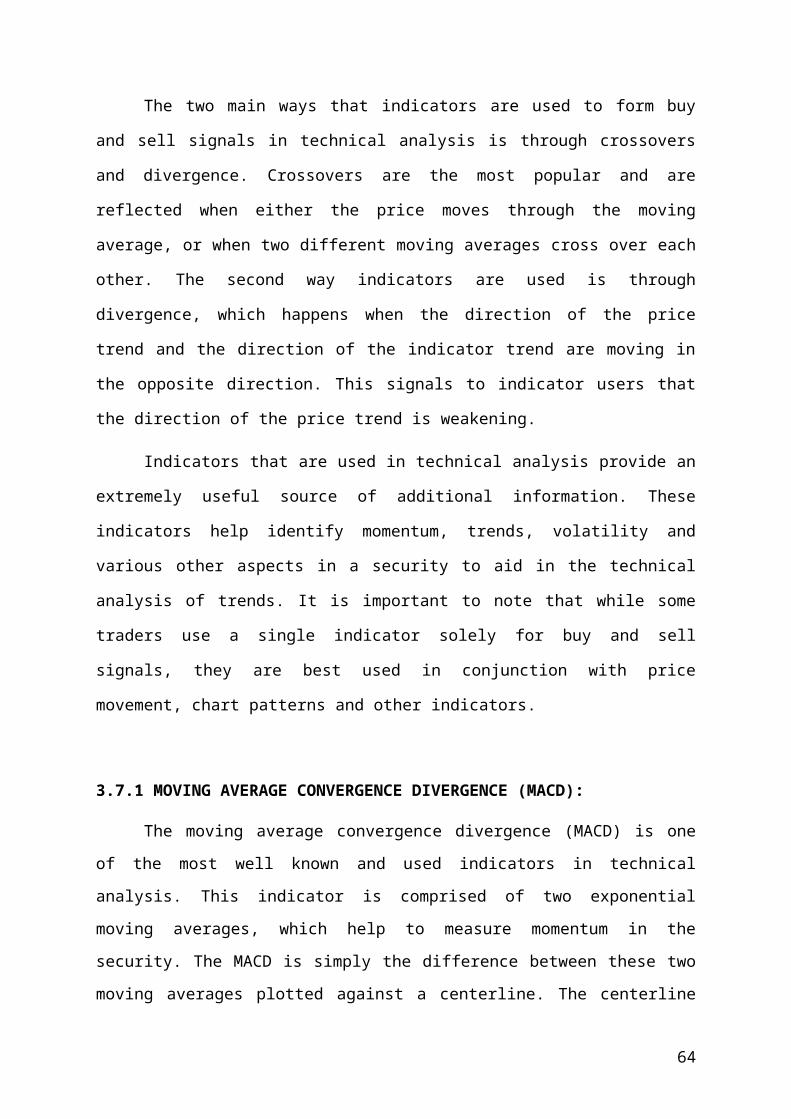
3.7.1 MOVING AVERAGE CONVERGENCE DIVERGENCE (MACD):
The moving average convergence divergence (MACD) is one of the most well known
and used indicators in technical analysis. This indicator is comprised of two exponential
moving averages, which help to measure momentum in the security. The MACD is simply
the difference between these two moving averages plotted against a centerline. The centerline
is the point at which the two moving averages are equal. Along with the MACD and the
centerline, an exponential moving average of the MACD itself is plotted on the chart. The
idea behind this momentum indicator is to measure short-term momentum compared to
longer term momentum to help signal the current direction of momentum.
MACD= shorter term moving average – longer term moving average
When the MACD is positive, it signals that the shorter term moving average is above
the longer term moving average and suggests upward momentum. The opposite holds true
when the MACD is negative - this signals that the shorter term is below the longer and
suggest downward momentum. When the MACD line crosses over the centerline, it signals a
crossing in the moving averages. The most common moving average values used in the
calculation are the 26-day and 12-day exponential moving averages. The signal line is
commonly created by using a nine-day exponential moving average of the MACD values.
These values can be adjusted to meet the needs of the technician and the security. For more
volatile securities, shorter term averages are used while less volatile securities should have
longer averages.
Another aspect to the MACD indicator that is often found on charts is the MACD
histogram. The histogram is plotted on the centerline and represented by bars. Each bar is the
difference between the MACD and the signal line or, in most cases, the nine-day exponential
moving average. The higher the bars are in either direction, the more momentum behind the
direction in which the bars point.
As you can see in below figure, one of the most common buy signals is generated
when the MACD crosses above the signal line (blue dotted line), while sell signals often
occur when the MACD crosses below the signal.
44
FIGURE NO.: 3.22
FIGURE TITLE: MOVING AVERAGE CONVERGENCE DIVERGENCE
SOURCE: www.metastock.com
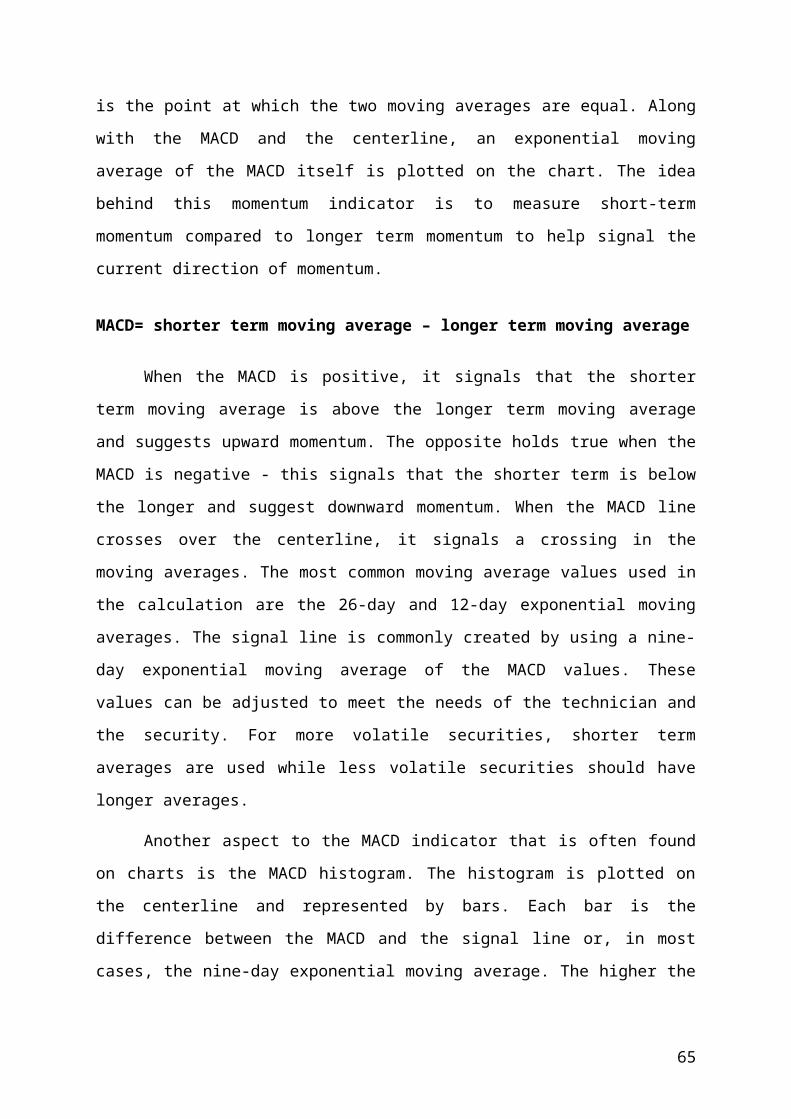
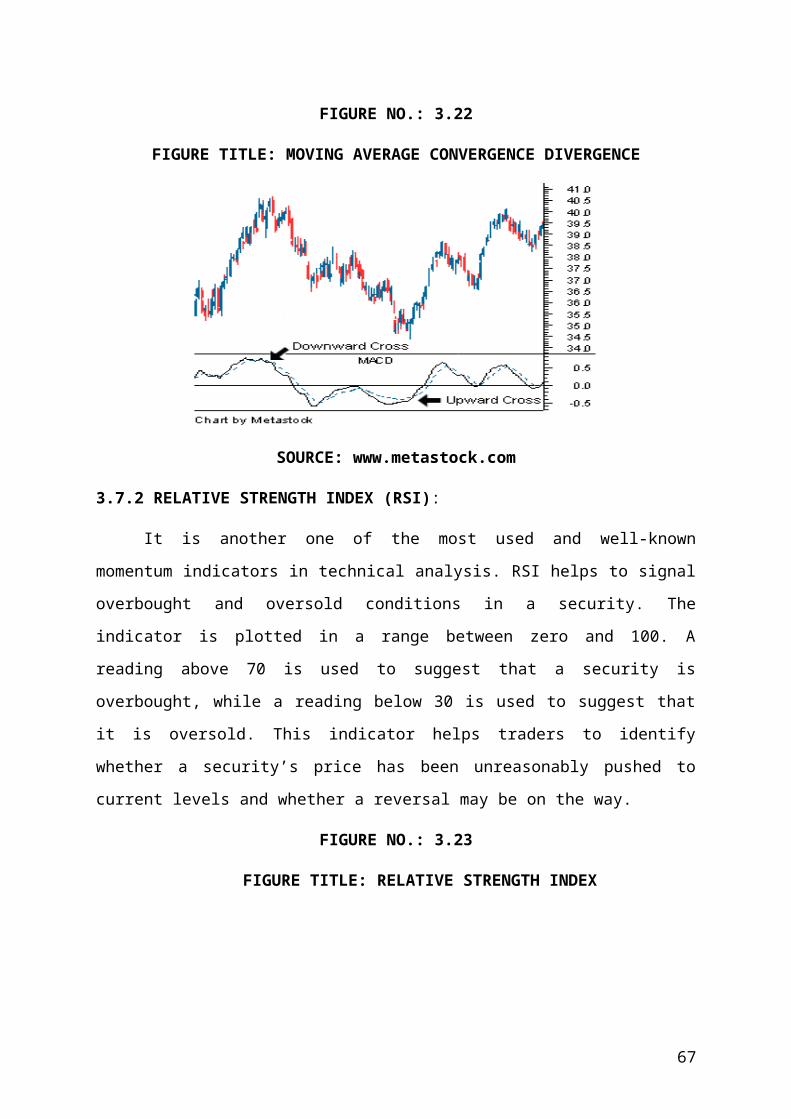
3.7.2 RELATIVE STRENGTH INDEX (RSI):
It is another one of the most used and well-known momentum indicators in technical
analysis. RSI helps to signal overbought and oversold conditions in a security. The indicator
is plotted in a range between zero and 100. A reading above 70 is used to suggest that a
security is overbought, while a reading below 30 is used to suggest that it is oversold. This
indicator helps traders to identify whether a security’s price has been unreasonably pushed to
current levels and whether a reversal may be on the way.
FIGURE NO.: 3.23
FIGURE TITLE: RELATIVE STRENGTH INDEX
SOURCE: www.metastock.com
45
The standard calculation for RSI uses 14 trading days as the basis, which can be
adjusted to meet the needs of the user. If the trading period is adjusted to use fewer days, the
RSI will be more volatile and will be used for shorter term trades.
3.7.3 STOCHASTIC OSCILLATOR
The stochastic oscillator is one of the most recognized momentum indicators used in
technical analysis. The idea behind this indicator is that in an uptrend, the price should be
closing near the highs of the trading range, signaling upward momentum in the security. In
downtrends, the price should be closing near the lows of the trading range, signaling
downward momentum.
The stochastic oscillator is plotted within a range of zero and 100 and signals
overbought conditions above 80 and oversold conditions below 20. The stochastic oscillator
contains two lines. The first line is the %K, which is essentially the raw measure used to
formulate the idea of momentum behind the oscillator. The second line is the %D, which is
simply a moving average of the %K. The %D line is considered to be the more important of
the two lines as it is seen to produce better signals. The stochastic oscillator generally uses
the past 14 trading periods in its calculation but can be adjusted to meet the needs of the user.
FIGURE NO.: 3.24
FIGURE TITLE: STOCHASTIC OSCILLATOR
SOURCE: www.metastock.com
46
3.7.4 THE DOW THEORY
The Dow Theory is a major corner stone of technical analysis. It is one of the oldest
and best known methods used to determine the major trend of stock prices. It tells about the
future prospects regarding a particular stock. It indicates the direction of the price of the share
by looking in to which an investor can think for investment on that particular stock.
Seven Basic Principles of Dow's Theory:
Everything is discounted by the price Averages, specifically, the Dow-Jones Industrial
Average and the Dow-Jones Transportation Average. Since the Averages reflect all
information, experience, knowledge, opinions, and activities of all stock market investors,
everything that could possibly affect the demand for or supply of stocks is discounted by the
Averages.
There are three trends in stock prices. 1) The Primary Tide is the major long-term trend.
But no trend moves in a straight line for long, and 2) Secondary Reactions are the
intermediate-term corrections that interrupt and move in an opposite direction against the
Primary Tide. 3) Ripples are the very minor day-to-day fluctuations that are of concern only
to short-term traders and not at all to Dow Theorists.
3. Primary Tides going up, also known as Bull Markets, typically unfold in three up moves
in stock prices. The first move up is the result of far-sighted investors accumulating stocks at
a time when business is slow but anticipated to improve. The second move up is a result of
investors buying stocks in reaction to improved fundamental business conditions and
increasing corporate earnings. The third and final up move occurs when the general public
finally notices that all the financial news is good. During the final up move, speculation runs
rampant.
4. Primary Tides going down, also known as Bear Markets, typically unfold in three down
moves in stock prices. The first move down occurs when far-sighted investors sell based on
their experienced judgement that high valuations and booming corporate earnings are
unsustainable. The second move down reflects panic as a now fearful public dumps at any
price the same stock they just recently bought at much higher prices. The final move down
results from distress selling and the need to raise cash.
5. The two averages must confirm each other. To signal a Primary Tide Bull Market major
trend, both averages must rise above their respective highs of previous upward Secondary
Reactions. To signal a Primary Tide Bear Market major trend, both the Dow-Jones Industrial
47
Average and the Dow-Jones Transportation Average must drop below their respective lows
of previous Secondary Reactions. A move to a new high or low by just one average alone is
not meaningful. Also, it is not uncommon for one average to signal a change in trend before
the other. The Dow Theory does not stipulate any time limit on trend confirmation by both
averages.
6. Only end-of-day, closing prices on the averages are considered. Price movements during
the day are ignored.
7. The Primary Tide remains in effect until a Dow Theory reversal has been signaled by both
averages.
It can act as an yardstick to choose the growing stocks and investing in those in
anticipation of future profits.
3.7.5 THE SHORT INTEREST RATIO THEORY
The Short Interest Ratio is derived by dividing the reported short interest or the
number of shares sold short, by the average volume foe about 30 days. When short sales
increase relative to total volume, the indicator rises. A ratio above 150% is considered
bullish, and a ratio below 100% is considered bearish.
The logic behind this ratio is that speculators and other investors sell stocks at high
price in anticipation of buying them back at lower prices. Thus, increasing short selling is
viewed as a sign of general market weakness, and short covering (as evidenced by decreasing
short positions) as a sign of strength. An existing large short interest is considered a sign of
strength, since the cover (buying) is yet to come; whereas an established slight short interest
is considered a sign of weakness (more short-sells are to come).
3.7.6 THE CONFIDENCE INDEX
It is the ratio of a group of lower-grade bonds to a group of higher-grade bonds.
According to the theory underlying this index, when the ratio is high, investors’ confidence is
likewise high, as reflected by their purchase of relatively more of the lower-grade securities.
When they buy relatively more of the higher-grade securities, this is taken as an indication
that confidence is low, and is reflected in a low ratio.
3.7.7 SPREADS
Large spread between yields indicate low confidence and are bearish; the market
appears to require a large compensation for business, financial and inflation risks. Small
spreads indicate high confidence and are bullish. In short, the larger the spreads, the lower the
ratio and the less the confidence. The smaller the spreads, the greater the ratio, indicating
greater confidence.
48
3.7.8 THE ADVANCE-DECLINE RATIO
The index-relating advance to decline is called the Advance-Decline Ratio. When
advances persistently out number declines, the ratio increases. A bullish condition is said to
exist, and vice-versa. Thus, an Advance-Decline Ratio tries to capture the market’s
underlying strength by taking in to account the number of advancing and declining issues.
3.7.9 THE MARKET BREADTH INDEX
The Market Breadth Index is a variant of the Advance-Decline Ratio. To compute it,
we take the net difference between the number of stocks rising and the number of stocks
falling, added (or subtracted) to the previous. For example, if in a given week 600 shares
advanced, 200 shares declined, and 200 were unchanged, the breadth would be 2 i.e., (600-
200)/200. The figure of each week is added to previous week’s figure. These data are then
plotted to establish the pattern of movement of advance and decline.
The purpose of the Market Breadth Index is to indicate whether a confirmation of
some index has occurred. If both the stock index and the market breadth index increase, the
market is bullish; when the stock index increase but the breadth index does not, the market is
bearish.
3.7.10 THE ODD-LOT RATIO
Odd-lot transactions are measured by odd-lot changes in index. Odd-lots are stock
transactions of less than, say, 100 shares. The Odd-lot ratio is sometimes referred to as a
yardstick of uniformed sentiment or an index of contrary opinion, because the odd-lot theory
assumes that small buyers or sellers are not very bright especially at tops and bottoms when
they need to be the brightest. The Odd-lot ratio theory assumes that the odd-lot short sellers
are even more likely to be wrong than odd-lotters in general. This indicator relates odd-lot
sales to purchases.
3.7.11 INSIDER TRANSACTIONS
The hypothesis that insider activity may be indicative of future stock prices has
received some support in academic literature. Since insiders have the best picture of how the
firm is faring, some believers of technical analysis feel that these inside transactions offer a
clue, to future earnings, dividend and stock price performance. If the insiders are selling
heavily, it is considered a bearish indicator and vice versa. Stockholders do not like to hear
that the president of a company is selling large blocks of stock of the company. Although the
49
president’s reason for selling the stock may not be related to the future growth of the
company, it is still considered bearish as investors figure the president, as an insider, must
know something bad about the company that they, as outsiders, do not know.
3.7.12 MUTUAL FUND ACTIVITY
Mutual Funds represent one of the most potent institutional forces in the market, and
they are a source of abundant data that are readily available. The cash position of the funds
and their net subscriptions are followed closely by technicians.
Mutual Funds keep cash to take advantage of favourable market opportunities and/or
to provide or redemption of shares by holders. It is convenient to express mutual-fund cash as
a percentage of net assets on a daily, monthly or annual basis. In theory, a low cash ratio
would indicate a reasonably fully invested position, with the implication that not much
reserve buying power remains in the hands of funds as a group. Low ratios (on the order of 5
to 5 and ½ percent) are frequently equated with market heights. At market-buttoms, the cash
ratio would be high to reflect heavy redemptions, among other things. Such a build-up of the
cash ratio at market lows is an indication of potential purchasing power that can be injected in
to the market to propel it upward.
Another Mutual Fund indicator that is quite closely is net subscriptions (subscriptions
to new shares, less redemptions of existing shares). Like the Odd-lot statistics, this indicator
measures public sentiment and the outlook for the stock market. The trend to more or less
buying moves in random with the “odd-lot purchase to sell ratio.” The sells redemption
differential narrows considerably prior to market analysis. In effect market advances are
preceded by a relative shift towards redemption. Shifts towards relative buying (sells of new
shares) tend to precede market declines.
3.7.13 THE CREDIT-BALANCE THEORY
Typically, investors receive credit balances in their accounts at their brokerage houses
when they sell stock. At this point the investor has two choices: he can either have the credit
balance forwarded to him or leave the credit balance in the account. However, these balances
frequently earn no interest. Thus, the only reason for maintaining the credit balance in the
account would be for purposes of reinvestment of these funds in the very near future.
Some feel that a build-up in these cash balances represent large reserve of potential
buying power. In effect, investors are leaving the credit balances in their brokerage firm
accounts because they anticipate a drop in prices, thus a buying opportunity. Conversely, a
50
drop in credit balance suggests that prices will go up. Because, an increase in prices was
expected, investors have already used up their credit balances. However, Technicians feel
that investors in general, as their actions get reflected in credit balances are usually wrong;
that is, the investors are buying stocks when they should be selling them and selling stocks
when they should be buying. As such, the credit balance theory is a contrary opinion theory.
In other words, technicians suggests that wise investor will buy stocks as credit
balances are rising and sell stocks as credit balances are dropping. In short technicians say the
wise investor should do the opposite of what the credit balances are doing.
3.7.14 PERFORMANCE OF LINKED MARKETS
For an investor, the performances of the markets play a vital role to estimate the
future performance of the market in which it trades in. If relative markets show a positive
performance it can be anticipated that the market will go positively. If it shows a downward
trend, it can be anticipated that the market will take a down turn. Generally, for Indian
investors the NASDAQ, DOWZONES and Singapore have a much relation to guard their
decisions to anticipate the future market tendency.
3.8 SUMMARY• Technical analysis is a method of evaluating securities by analyzing the statistics
generated by market activity. It is based on three assumptions: 1) the market discounts
everything, 2) price moves in trends and 3) history tends to repeat itself.
• Technicians believe that all the information they need about a stock can be found in its
charts.
• Technical traders take a short-term approach to analyzing the market.
• Criticism of technical analysis stems from the efficient market hypothesis, which states
that the market price is always the correct one, making any historical analysis useless.
• One of the most important concepts in technical analysis is that of a trend, which the
general direction that a security is headed is. There are three types of trends: Uptrends,
downtrends and sideways/horizontal trends.
• A trendline is a simple charting technique that adds a line to a chart to represent the trend
in the market or a stock.
• A channel, or channel lines, is the addition of two parallel trendlines that act as strong
areas of support and resistance.
• Support is the price level through which a stock or market seldom falls. Resistance is the
price level that a stock or market seldom surpasses.
51
• Volume is the number of shares or contracts that trade over a given period of time,
usually a day. The higher the volume, the more active the security.
• A chart is a graphical representation of a series of prices over a set time frame.
• The time scale refers to the range of dates at the bottom of the chart, which can vary
from decades to seconds. The most frequently used time scales are intraday, daily,
weekly, monthly, quarterly and annually.
• The price scale is on the right-hand side of the chart. It shows a stock's current price and
compares it to past data points. It can be either linear or logarithmic.
• There are four main types of charts used by investors and traders: line charts, bar charts,
candlestick charts and point and figure charts.
• A chart pattern is a distinct formation on a stock chart that creates a trading signal, or a
sign of future price movements. There are two types: reversal and continuation.
• A head and shoulders pattern is reversal pattern that signals a security is likely to move
against its previous trend.
• A cup and handle pattern is a bullish continuation pattern in which the upward trend has
paused but will continue in an upward direction once the pattern is confirmed.
• Double tops and double bottoms are formed after a sustained trend and signal to chartists
that the trend is about to reverse. The pattern is created when a price movement tests
support or resistance levels twice and is unable to break through.
• A triangle is a technical analysis pattern created by drawing trendlines along a price
range that gets narrower over time because of lower tops and higher bottoms. Variations
of a triangle include ascending and descending triangles.
• Flags and pennants are short-term continuation patterns that are formed when there is a
sharp price movement followed by a sideways price movement.
• The wedge chart pattern can be either a continuation or reversal pattern. It is similar to a
symmetrical triangle except that the wedge pattern slants in an upward or downward
direction.
• A gap in a chart is an empty space between a trading period and the following trading
period. This occurs when there is a large difference in prices between two sequential
trading periods.
• A moving average is the average price of a security over a set amount of time. There are
three types: simple, linear and exponential.
• Moving averages help technical traders smooth out some of the noise that is found in
day-to-day price movements, giving traders a clearer view of the price trend.
52
• Indicators are calculations based on the price and the volume of a security that measure
such things as money flow, trends, volatility and momentum. There are two types:
leading and lagging.
• The accumulation/distribution line is a volume indicator that attempts to measure the
ratio of buying to selling of a security.
• The moving average convergence divergence (MACD) is comprised of two exponential
moving averages, which help to measure a security's momentum.
• The relative strength index (RSI) helps to signal overbought and oversold conditions in a
security.
• The stochastic oscillator compares a security's closing price to its price range over a
given time period.
53
CHAPTER-4
A SAMPLE SURVEY
4.1 OBJECTIVES OF THE SURVEY
The survey has been carried out in order to find out:
Whether people invest in stock market?
How much returns one expects by investing in stock market?
Whether investors believe in Technical Analysis and/or Fundamental Analysis?
Do people use Technical Indicators at the time of investment decision-making?
Do Technical Analysis better than Fundamental Analysis as an indicator?
4.2 SAMPLE COMPOSITION
In all 34 persons were interviewed. 4 out of them revealed that they don’t have any
interest in securities market. Therefore, those respondents were not considered for answering
the questionnaire. The remaining 30 thereby formed the sample size of this survey.
1. Age Composition
20-30 30-40 40-60 More than 6016 12 2 0
54
2. Occupation
Self-Employed Salaried Student
Govt. Employee Retired Others
6 15 7 0 1 1
3. Income Level (Per Month)
Less ThanRs. 5,000
Rs. 5,000 toRs. 10,000
Rs. 10,000 toRs. 25,000
Rs. 25,000 toRs. 50,000
Rs.50,000 and Above
8 14 3 4 1
55
4.3 OUTCOMES OF THE SURVEY
Following are the outcomes that have been revealed from the survey:
1. PEOPLE WHO INVEST IN STOCK MARKET
As a part of this study it was found that out of 30 people 22 people invest in stock
market where as the rest 8 has no believe on the stock market.
Invest Do not Invest22 8
2. RETURN EXPECTED PER ANNUM
Out of 22 people that invest in stock market, most of the investors i.e., 9 in number
expect a return of 20-50 percent per annum, where as 8 investor expect a return of more than
50% p.a. 4 investors like 10-20 percent return per annum and there is a single person who is
satisfied with an expected return of less than 10% p.a.
Less Than 10%
10% - 20%
20%-50%
More Than 50%
1 4 9 8
56
3. STOCKS IN WHICH INVESTORS PREFER TO INVEST IN
Out of 22 investors, 14 investors used to invest in midcap stocks, 6 in blue-chips and
not a single investor in penny shares. It indicates that most of the investors have a strong
believe on midcap stocks.
Blue Chip
Mid Cap
Penny Shares All
6 14 0 2
4. INVESTORS TRADING INTRADAY
Out of 22 investors, 13 investors practice intraday where as 9 don’t want to take much
risk by doing intraday trading.
Practice Don't Practice
9 13
57
5. ANALYSIS INVESTORS BELIEVE UPEN
It was revealed that a major portion of the investors believe in both Technical
Analysis as well as in Fundament Analysis as 14 investors believe on both.
Fundamental Analysis
Technical Analysis Both None
4 2 14 2
6. INVESTORS BELIEVE ON DOW-THEORY
An average number of investors believe on the Dow-Theory i.e., 12 where as 10 do
not.
Use Don't Use10 12
58
7. TYPE OF CHART USED BY INVESTORS
The Candle-stick chart is very popular by investors while analyzing the market
condition as 6 out of 22 investors rely on that. The major thing is that 6 investors believe on
all the four types of charts where as 2 investor never use any of the charts to analyze.
Line Chart Bar ChartCandle Stick
ChartPoint & Figure
Chart All Non5 1 6 2 6 2
8. INVESTORS TRADE IN DERIVATIVES
Relatively more than the average investors used to invest in derivative instruments as
14 love to invest in derivatives out of 22.
Trade Don't Trade14 8
59
9. TYPE OF DERIVATIVE INVESTORS INVEST IN
Out of 14 investor those invest in derivatives, most of the investors like to invest in
Index options as compared to other derivative instruments. The statistics shows that, out of 14
investors trading in derivatives, 5 invest in Index Options, 3 in Stock Options, one in Stock
Futures and one in Index Futures. 4 investors invest in all the four types of derivatives.
Index Futures Index Options Stock Futures Stock Options All1 5 1 3 4
10. IS TECHNICAL ANALYSIS AN INDICATOR FOR INVESTMENT
DECISION-MAKING ?
From the study, it was found that out of 30 people 19 treat the Technical Analysis as
an indicator for investment decision making but 9 people did not agree on that. Some 2
people were unable to decide whether Technical Analysis is an indicator or not.
In Favour Against Can't Say19 9 2
60
As most of the people have the opinion that Technical Analysis indicates the market
behavior, it can be accepted that Technical Analysis is an indicator for investment decision
making.
5.4 OPINION OF THE INVESTORS
During the survey, different investors have shared different views regarding
investment. The discussions and question answer sessions with them revealed lots of practical
trading and investing strategies that can help one to take appropriate investment decisions at
the right time and at the right way. Some of the most discussed and suggested tips of
investment and day-trading are as follows:
1. Check buying volumes
Before buying check out the buying and selling quantity (volumes). If buying volume started
increasing then the stock may go up and if selling volumes start increasing the stock price
may come down.
2. Check derivative status
If possible try to check out the derivative of the stock which you want to trade.
If derivative of that particular stock is going up with increasing buying volumes then you can
immediately grab (buy) that share/stock. Most of the time it is seen that, if the derivative
price goes up, then its share price also goes up.
3. Wait for the target price to buy
For example, if buy is given at 150.5 then don’t buy below this price, only buy at 150.5 price
or slightly higher than price. Because the given buy price may be the resistance price, if it
breaks then share price goes up or else may not go up above 50.5. So plan to buy at given
targeted price, don’t buy below target price.
4. Strictly maintain Stop Loss
Strictly maintain the given stop losses. This will help you to minimize your further losses.
Suppose for moment the share you bought falls drastically down, then you may end up with
huge loss. So always maintain given stop loss. “Stop Loss will reduce your loss”.
5. Down wait for huge profit in single share/trade
If you are getting some profit and if you notice that is not further moving up (it’s called
consolidation) then you can sell your share/stock and come out of that trade. In this manner,
61
you can earn small profit instead of loss then you can do another trade and again earn small
profit. Likewise if you keep earning couple of small profits in a single day then all your
small profits will add up to huge profit amount in a single day. “Get satisfied in small profit
and do multiple trades”.
6. Don't Overtrade
First and very important is not to Overtrade - Never put all your money/savings in share
market. Most of the brokers provide margin amount but it is up to you how to make use of
this margin amount. Most of the traders make use of this margin amount for over trading
which is risky.
7. Wait, Watch and Trade
Do not jump in market early. Wait, watch and trade. Confirm the market direction and make
sure and confirm all your strategies like resistance and support levels and then plan to trade.
8. Study tips carefully
Do not react to tips given by anyone - First observe that stock, check the volume, where they
are increasing or decreasing and then decide your trade. Do not buy or sell blindly based on
share tips. Most of the share tips do not work if market direction changes.
9. Always go with Market trend
Don’t short sell, if the market is going up and don’t buy if the market is falling down. Trade
with market direction and don’t go against market direction.
10. Try to minimize your Loss and increase profit
Get ready to accept loss if you do wrong trade - Come out of your trade if you have entered in
wrong time by accepting loss instead of waiting for trade to reverse and finally it is coming
down from top means it is cooling, if you see more buyer than seller then you can hold your
position. You must know which share has what momentum, means if the share price is
Rs.120 then you can expect upside from Rs.1 to 5 and not Rs.50 to 100. If the scrip is going
up, it will go in ladder fashion, it will go up and it will come down bit and it will again
continue its upward journey.
12. Wait for opportunity
If you are not sure about market movement then watch and wait for opportunity don’t trade
forcefully. Some times market move in range bound means market move up-down in very
small range at that time it becomes very difficult to judge the market direction and do
intraday trading. Its always better to wait instead of losing money.
62
13. Don’t expect too much
Don’t expect too much - Be happy in whatever profit you get, don’t try to grab too much
from market. Be realistic, and don’t expect too much. It can be remembered that while doing
day trading, you should square off your positions with appropriate profit instead of waiting
for big profit.
14. Advice for high returns
Lack of Knowledge is very risky and very dangerous, so don’t do trading or investing without
having proper knowledge. Read books, refer websites and get prepared before you plan for
share market trading or investing.
63
CHAPTER-5
FINDINGS AND SUGGESTIONS
5.1 FINDINGS:
From this study one can able to extract out the fundamental aspects of Technical Analysis as well as its applicability. Some of the major findings of the study are mentioned below:
1) Unlike Fundamental Analysis, Technical Analysis is also very much important to play in the stock market.
2) Fundamental Analysis tells about “right choice” where as Technical Analysis tells about the “right time” to enter or exit from the market.
3) Technical Analysis assumes that history tends to repeat itself, but it is not wise to believe that the same trend will occure next.
4) Support and Resistance levels are the levels at which a lot of traders are willing to buy the stock or sell it. So, an investor has to keep its eyes and ears open at this point of time.
5) Among the various types of charts the Candle-Stick Chart is the most effective and acceptable tool to evaluate the performance of a stock and forecast the future.
6) When an investor looks in to the numerous types of chart patterns, it creates a lot of confusion and expectations in the minds of the investors.
7) The Moving Average Convergence Divergence (MACD) is the most well known and used indicator in Technical Analysis as it is based on real facts of past performance.
8) In trading, volumes have equal importance along with price to confirm the formulation of a trend or a technical pattern. With the help of volumes we can easily determine whether the demand side is greater or supply side is greater for stocks at any given point of time.
9) In Bhubaneswar, most of the investors are risk-averse in nature. People hesitate to invest in derivatives by taking much risk.
10) Most of the investors are not aware of the sophisticated and well designed tools of technical analysis. They invest without going through the technical analysis.
11) Though Technical Analysis plays a lion’s role to decide investment pattern as Fundamental Analysis, it cannot be treated as a substitute to Fundamental Analysis.
64
5.2 SUGGESTIONS:
By going through the subject matter, analysis, opinion of the respondents and the findings, the following points can be suggested for the purpose of further reference and implementation:
1) Technical analysis is a game of charts and figures. So, at the time of taking any decision regarding investment, Fundamental Analysis and other factors should also be taken in to consideration along with Technical Analysis.
2) Instead of looking in to all chart patterns, it is good to follow a single chart pattern and to draw timely conclusion by interpreting that.
3) Market never tells anything of its own! It’s the investor who has to look in to the market and catch up the indicator to forecast and expect the market trend.
4) Most of the investors assume that by using charts and patterns, they can earn much by purchasing in low and selling at high prices. But, it is not so easy as they think. So, such believes should be rooted out from mind before looking towards market.
5) As we have a globalised market, along with the domestic market the performance of the overseas markets should also be considered and the help of modern financial instruments should be taken to reduce risk and maximize the probability of gaining more.
6) And, as per Apollo Sindhoori Capital Investments Ltd. Is concerned, there is an ample scope to expand and increase its revenue in this post-recession-recovering market. So, the organisation has to look in to its service-providing-skills and problems to attract more customers in the market. Although it has a good brand name, still it has to go for optimum advertisement and well skilled human resources.
5.3 CONCLUSION:
A large number of new investors think that there is easy and quick money in investing and day trading. They think that they can buy at bottoms and sell at tops very easily. They thing that since they can analyse the chart patterns and use technical analysis very well, they can trade consistently with 90% accuracy. They think that they can invest small amount and trade for large amounts to earn big profits by utilizing multiple exposure on their margin amount and fail to understand the real market behavior. They fail to understand that investing is not like “GO…..STOP” game. Here, only disciplined investors well equipped with sophisticated technical tools having presence of mind can sustain and make the indices favourable for them irrespective of market trends whether bull or bear. The only thing that matters in investment is “Right Time and Right Choice” which can be tamed through proper analysis and understanding of the whole game as the NSE has rightly narrated….
“ SOCHKAR,SAMAJHKAR,INVESTKAR”
65
BIBLIOGRAPHY:
1. Bhat, Sudhindra: Security Analysis And Portfolio Management, Excel Books, First