28
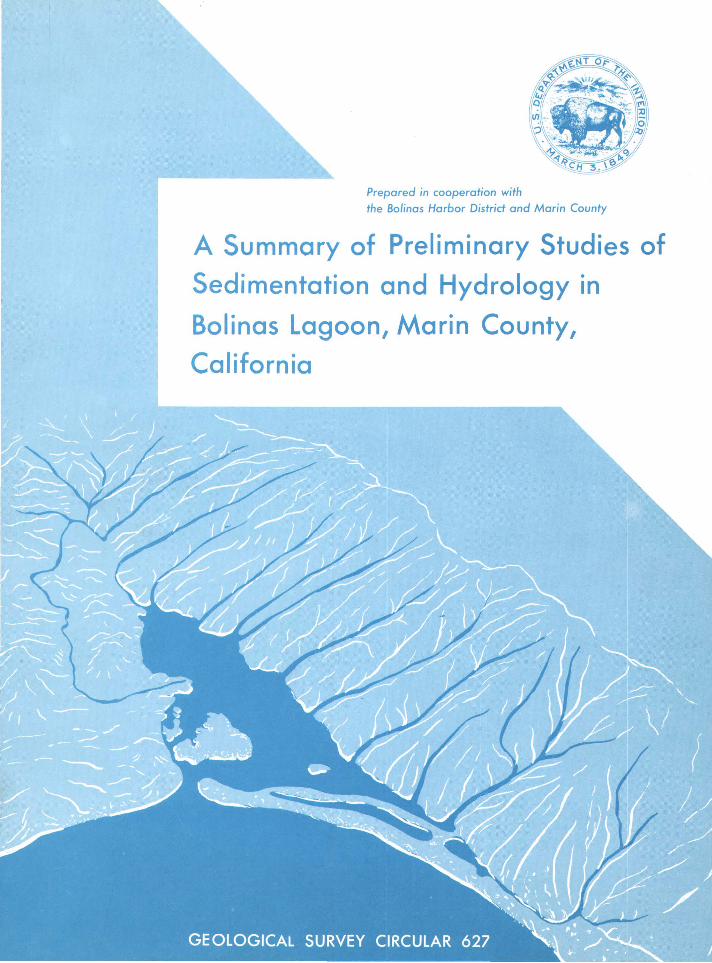
Prepared in cooperation with the Bolinas Harbor District and Marin County A Summary of Preliminary Studies of Sedimentation and Hydrology in Bolinas Lagoon, Marin County, California
| Date post: | 13-Jul-2018 |
| Category: |
Documents |
| Upload: | duongtuyen |
| View: | 223 times |
| Download: | 0 times |
Prepared in cooperation with the Bolinas Harbor District and Marin County
A Summary of Preliminary Studies of
Sedimentation and Hydrology in
Bolinas Lagoon, Marin County,
California

A Summary of Preliminary Studies of
Sedimentation and Hydrology in
Bolinas Lagoon, Marin County, California
By J. R. Ritter
G E 0 l 0 G I C A l S U R V E Y C I R C U l A R 627
Prepared in cooperation with the Bolinas Harbor District and Marin County
Washington 1970
United States Department of the Interior WALTER J. HICKEL, Secretary
Geological Survey William T. Pecora, Diredor
Free on application to the U.S. Geological Survey, Washington, D.C. 20242
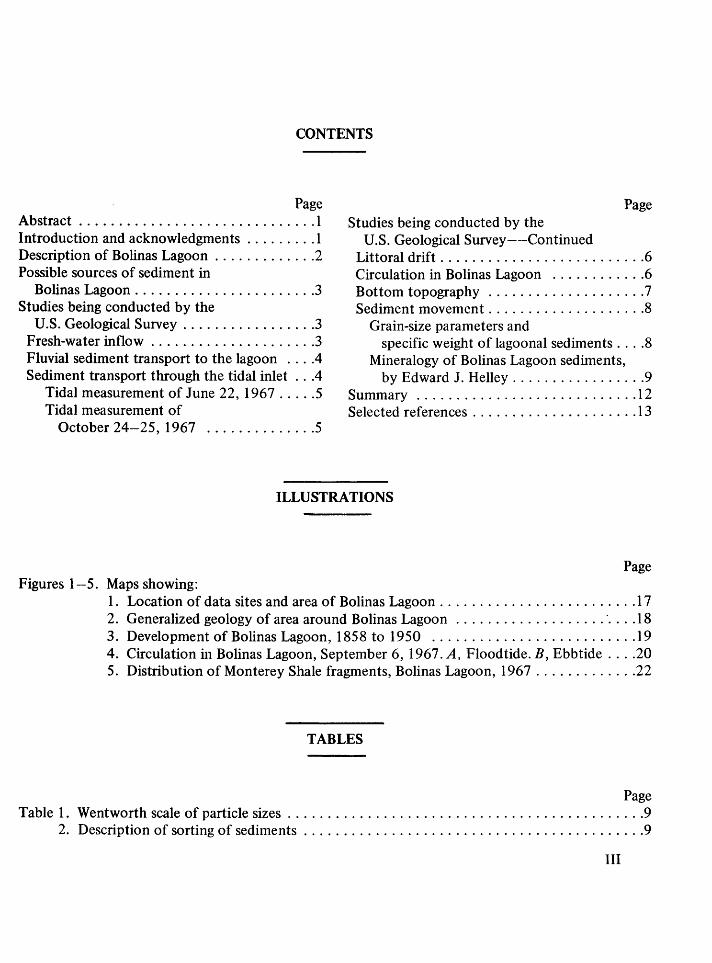
CONTENTS
Page Abstract .............................. 1 Introduction and acknowledgments ......... 1 Description of Bolinas Lagoon ............. 2 Possible sources of sediment in
Bolinas Lagoon ...................... .3 Studies being conducted by the
U.S. Geological Survey ................ .3 Fresh-water inflow .................... .3 Fluvial sediment transport to the lagoon ... .4 Sediment transport through the tidal inlet .. .4
Tidal measurement of June 22, 1967 ..... 5 Tidal measurement of
October 24-25, 1967 .............. 5
Page Studies being conducted by the
U.S. Geological Survey--Continued Littoral drift .......................... 6 Circulation in Bolinas Lagoon ............ 6 Bottom topography .................... 7 Sediment movement .................... 8
Grain-size parameters and specific weight of lagoonal sediments .... 8
Mineralogy of Bolinas Lagoon sediments, by Edward J. Helley ................. 9
Summary ............................ 12 Selected references ..................... 13
ILLUSTRATIONS
Page Figures 1-5. Maps showing:
1. Location of data sites and area of Bolinas Lagoon ......................... 1 7 2. Generalized geology of area around Bolinas Lagoon ................... · .... 18 3. Development of Bolinas Lagoon, 1858 to 1950 ......................... .19 4. Circulation in Bolinas Lagoon, September 6, 1967. A, Floodtide. B, Ebbtide .... 20 5. Distribution of Monterey Shale fragments, Bolinas Lagoon, 1967 ............. 22
TABLES
Page Table 1. Wentworth scale of particle sizes ............................................. 9
2. Description of sorting of sediments ........................................... 9
III

A Summary of Preliminary Studies of
Sedimentation and Hydrology in Bolinas Lagoon, Marin County, California
By J. R. Ritter
ABSTRACT
The U.S. Geological Survey is investigating sedimentary and hydrologic conditions in Bolinas Lagoon, a 1,100-acre lagoon 15 miles northwest of San Fran cisco. The program began in May 196 7 and will continue into 1970. Only the study results analyzed before June 1968 are summarized in the report.
Two series of measurements of suspended-sediment load and water discharge in the lagoon inlet showed that much of the suspended sediment is sand and that the average velocity was as much as 4.7 feet per second. Littoral drift near the inlet was generally toward the inlet, whereas farther from the inlet the pattern is irregular. Circulation velocities in the lagoon decrease rapidly away from the inlet, but probably remain high enough to erode bottom sediment along the channels. In most of the lagoon median size of bottom sediment was fine sand. Sediment was derived chiefly from Monterey Shale.
INTRODUCTION AND ACKNOWLEDGMENTS
In May 1967 the U.S. Geological Survey began an investigation of the hydrology and sedimentation in Bolinas Lagoon in cooperation with the Bolinas Harbor District and Marin County. The lagoon, a potential small craft harbor, seems to be filling with sediment. The intended purposes of the investigation are to determine the rate of sedimentation, to describe the sedimentation processes, and to define the sources and movement of sediment in the lagoon. This report summarizes the results of
1
studies conducted from May 1967 through May 1968 and describes studies now in progress. A more detailed description of the studies may be found in Ritter ( 1969a and 1969b ).
The investigation is divided into seven studies, each of which is related to sedimentation and hydrology. The separate studies are designed to provide information on (1) the fresl'·Water inflow into the lagoon, (2) the quantity of fluvial sediment transported into the lago'1n, (3) the quantity of sediment transported into and out of the lagoon through the tidal inlet, (4) the direction of littoral drift near the inlet, (5) the circulation of water within the lagoon, ( 6) the bottom topography, and (7) the sediment movement within the lagoon. The data and conclusions of each study will be correlatr.d with those of other studies conducted l'Y the Geological Survey and other investigato:t"s. The data also are used, whenever possn~•~, to interpret past and future conditions in the lagoon.
The investigation by the Geological Survey is conducted under the general supervisior of R. Stanley Lord, district chief in charge of water-resources investigations in Califorria, and Loren E. Young, chief of the Menlo Park subdistrict office. The manuscript benefited substantially from the criticism of Jos~ph R. Curray and D.W. Hubbell. The assistance of Winchell Smith and William M. Brown III also is gratefully appreciated. A special acknowledgment
is pJven to Archie A. Goldsberry, who patiently and cheerfully helped with many phases of the investigation.
DESCRIPTION OF BOLINAS LAGOON
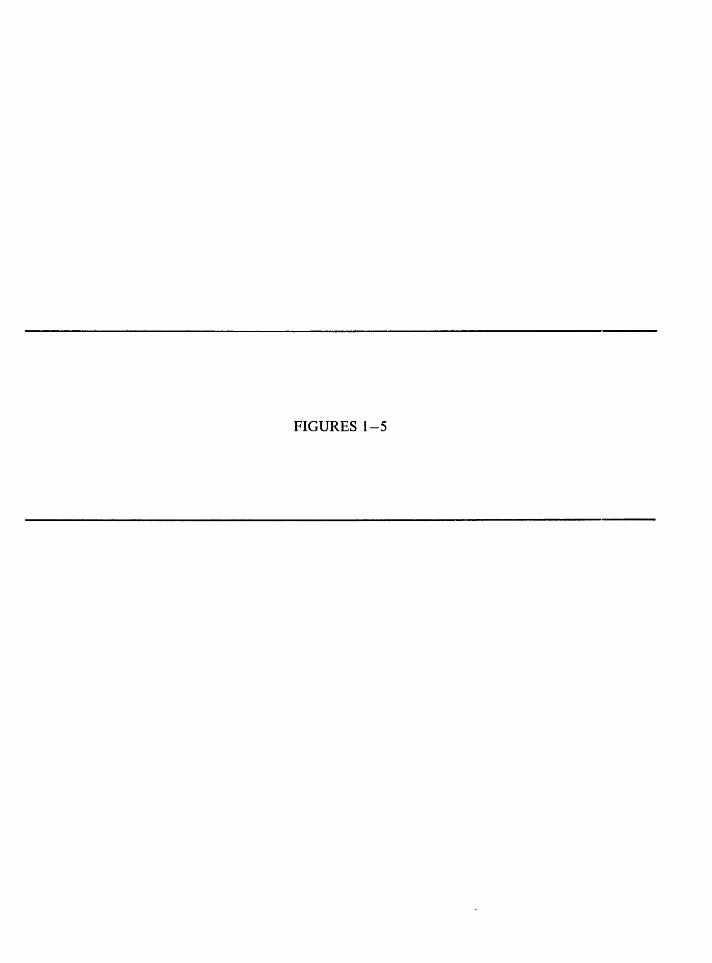
Bolinas Lagoon (fig. 1 ), bordered by the communities of Bolinas and Stinson Beach, is about 15 miles northwest of San Francisco. The lagoon has a triangular shape with maximum dimensions of about 1 by 3 miles. Most of the lagoon is tidal flat. At mean lower low water, about 70 percent of the lagoon area is exposed to the air and at mean higher high water only two islands remain above water. The larger island, Kent Island, covers about 100 acres; the other, near the mouth of McKinnan Gulch, is insignificant in size.
Bolinas Lagoon is protected from the ocean by a long sandy spit now known as Seadrift, the site of several luxurious homes. Despite the recent development of Seadrift for home sites, much of it is topped with sand dunes partly covered by vegetation. Seadrift Lagoon and its northern adjacent neck of land (fig. 1) were created by dredging and fill operations undertaken in the early 1960's and were the only major manmade revisions in the character of Bolinas Lagoon in recent years.
The tidal inlet to the lagoon is between the western extremity of Seadrift and a high cliff, which is part of the town of Bolinas. The inlet is bounded by sandy beaches; however, during winter storms the western beach often is entirely eroded away, leaving bedrock abutting the high cliff. During periods of calm the beach is reestablished. The middle of the inlet usually is lined with cobbles and bedrock. To pictorially record changes in the configuration of the inlet, the Geological Survey has mounted a time-lapse camera on a cliff overlooking the inlet. The camera has taken photographs during daylight at intervals of every hour or half hour since January 1968.
Just outside the inlet is a shallow crescent-shaped sandbar, which constantly
2
changes position. During extreme low water the bar is exposed, creating a navigational hazard.
Except for Seadrift, Bolinas Lagoon is encircled by steep hills that rise to altitudes of more than 1 ,500 feet on the east and about 200 feet on the west. Most of the virgin growth on the hills east of the lagoon was logged during the 1850's
The drainage area tributary to Bolinas Lagoon is 16.7 square miles and has maximum dimensions of about 3 by 9 miler- The largest tributary, Pine Gulch Creek, drains about half the basin and is the only tributary to enter the lagoon from the west. The extent of its delta, at least 1 ,500 feet into the lagoon, indicates that Pine Gulch Creek transports more sediment to the lagoon than any other tributar:.r. The several eastern tributaries are short and steep and have drainage basins of less than 1 square mile. They have small deltas, but possibly their average annual contribution of sediment pr-r square mile of drainage area is high because of their steep gradient and their sparsely vegetated drainage basins.
Bolinas Lagoon straddles the San Andreas fault. During the 1906 earthquakr-, the relative movement along the fault was as rr.~1ch as 1 foot vertically and 13.5 feet horizortally in the Bolinas Lagoon basin (Gilbert, 19('~, p. 67, 70, 72). The displacement must have changed the regimen of at least some of the streams and probably increased erosion because of stream readjustment.
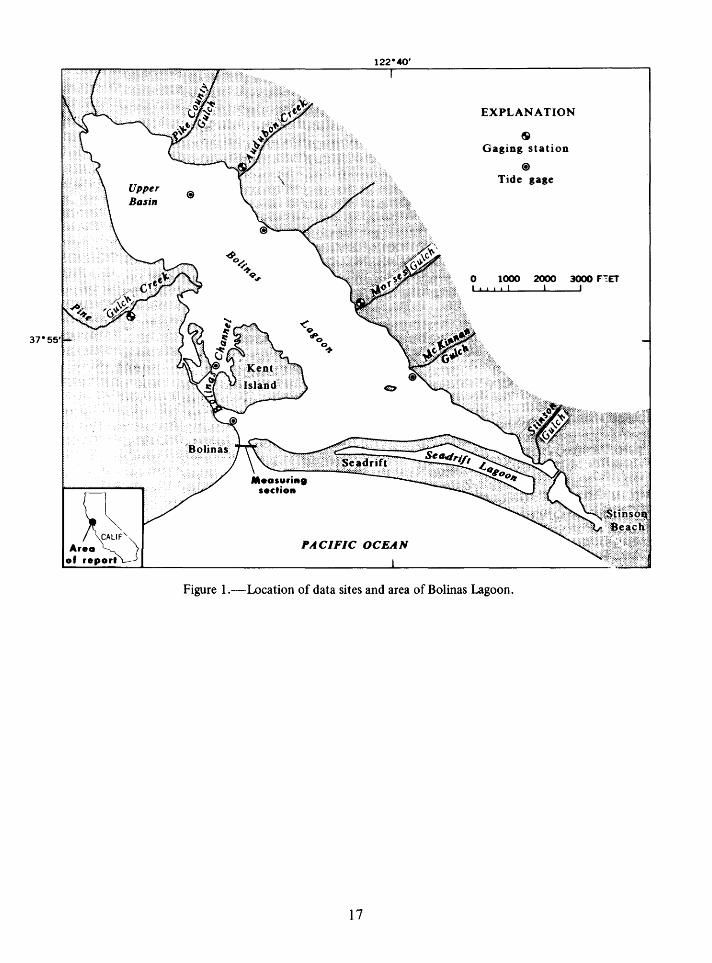
The rock west of the lagoon cc 11sists chiefly of the Monterey Shale of Miocene age and the Merced Formation of Pliocene an1 Pleistocene age; east of the lagoon the rock consists of the Franciscan Formation of Cretaceous and Jurassic age. Sedimentary deposits of Quaternary age occur throughout the drainage area (fig. 2).
Precipitation at Bolinas Lagoon is 30 to 40 inches per year (Rantz, 1968), m'lst of which falls from November through Apr:l. Almost no
rain occurs during the summer months; however, fog is more common during June and July than during other months.
Temperatures range from about 40° F to 90° F, and the climate is generally mild. The prevailing winds are from the northwest, but gales from the southeast have reached velocities greater than 75 miles per hour. An onshore breeze also often occurs.
POSSIBLE SOURCES OF SEDIMENT IN BOLINAS LAGOON
Lagoons are temporary features along a coast. A generalized history of a lagoon may begin with a river mouth drowned by a rising sea level. Littoral drift creates a spit or barrier bar across the mouth so that its access to the ocean is restricted to a narrow inlet. The lagoon begins to fill with sediment and becomes a tidal flat with channels carrying much of the tidal water. The filling continues until the lagoon becomes a salt marsh as vegetation grows on the rising tidal flats. Eventually, the lagoon becomes a flat plain that may be eroded by waves lapping against its seaward edge. The life of a lagoon depends on the rate at which sediment is entrapped in the lagoon.
Bolinas Lagoon, the seaward end of a rift valley created by the San Andreas fault, is now probably in the stage of a tidal flat that is becoming a salt marsh.
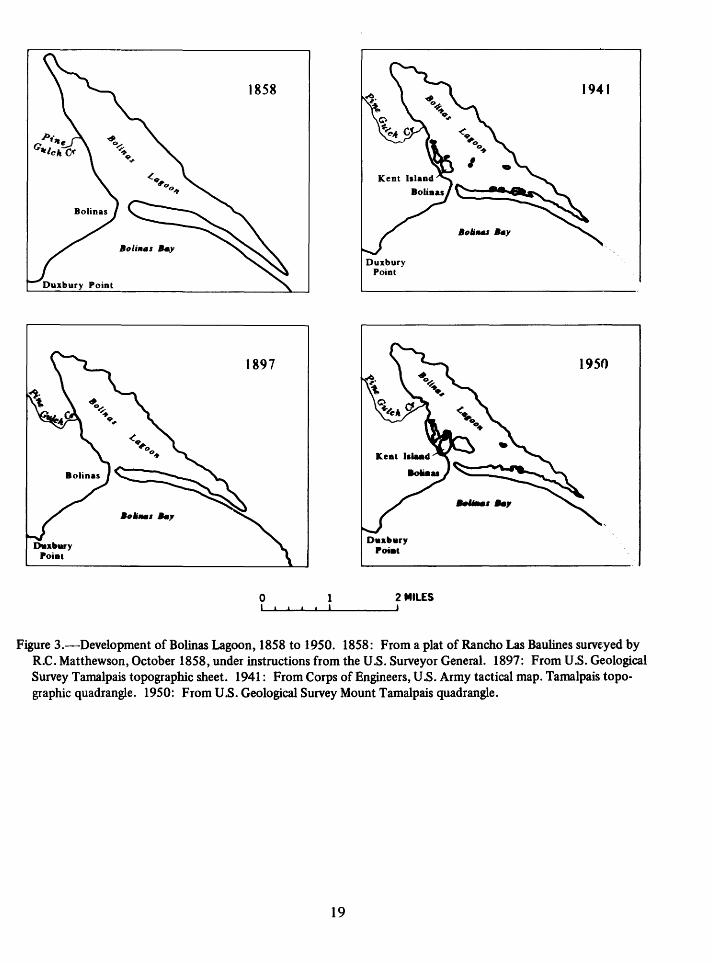
There are many possible sources of sediments being deposited in lagoons. The three major transporters of sediment to a lagoon usually are littoral drift, upland streams, and wind. At Bolinas Lagoon the cliff between the inlet and Duxbury Point (fig. 3) is eroding at the rate of about 2.3 feet per year (A. J. Galloway, oral commun., 1967). The sediment supplied by the erosion of the cliff may be carried as littoral drift to the inlet and into the lagoon. The sand of Seadrift may also be carried to the lagoon as littoral drift.
Streams tributary to Bolinas Lagoon transport sediment to it, especially during storms. The
3
quantity of sediment transported deJ: ends on such things as size of drainage area, erodibility of soils, geology, intensity of rainfall, land use, and vegetation. Although the tributaries to Bolinas Lagoon have small drainage areas, the lagoon itself is not large, so that the sediment contribution by the tributaries may substantially help to fill the lagoon.
Wind transports sediment to Bolinas Lagoon when it blows from the south across the unconsolidated sand deposits of Seadrift. The quantity of sand moved by wind may be considerable.
Comparison of older maps of Bolinaf Lagoon with more recent ones shows that the lagoon has been filling with sediment for at least 100 years. Figure 3 shows maps of Bolinas Lago-:>n from 1858 to 1950. Although the accuracy in mapping has improved, large-scale features would not be omitted from the older maps. In the maps prior to 1900, no delta exists at the mouth of Pine Gulch Creek, and Kent Island is absent. However, early charts show parts of Kent Island as above lower low wrter but probably below mean sea level. Attempts to estimate erosion and deposition will be made in later studies by comparing maps and charts published during the past 100 years.
STUDIES BEING CONDUCTED BY THE U.S. GEOLOGICAL SURVEY
All seven studies being conducted by the U.S. Geological Survey are now in progress, and some of the data have been analyzed. In the following sections the methods used in each study and early results are described.
FRESH-WATER INFLOW
Since May 1967 the flows of three tributaries to Bolinas Lagoon have been recorded. At Pine Gulch Creek and Morses Gulch (fig. 1) gaging stations, equipped with Fisher-Porter digital recorders, were constructed. The water level or stage of the two streams is expressed as a gage height and is punched on a tape every 15 minutes. The tape is read later by a computer
that determines, for each day, the average gage height and other parameters. Discharges of the -streams are measured at least monthly during low water and more frequently during high water to define a stage-discharge relation. From the stage-discharge relation and the continuous records of stage, daily, monthly, and yearly discharges are computed for each stream. As of June 1968 discharge records for these streams had not yet been computed.
At Audubon Creek a crest-stage gage was installed. Only the highest stage of the stream between visits to this gage is recorded. However, the discharge is measured at least monthly.
FLUVIAL SEDIMENT TRANSPORT TO THE LAGOON
The quantity of fluvial sediment being transported to the lagoon by Pine Gulch Creek, Morses Gulch, and Audubon Creek is being calculated. Because the quantity of sediment moved by streams is usually related to the water discharge, the data on water discharge at the three gaging stations are used in conjunction with data from sediment sampling to determine the sediment load.
Samples of suspenqed sediment, that sediment which is carried in suspension in water, are collected by an observer at least daily during high runoff and less frequently during low runoff at Pine Gulch Creek. At Morses Gulch and Audubon Creek samples are collected monthly except during storm periods, when sampling may be more frequent.
The suspended-sediment samples are collected throughout the entire depth by a technique called depth integration. Thus, the sample is representative of an entire column of water. Because the concentration of suspended sediment may vary across a stream, samples are take across a given section of the stream. The samples, mixtures of water and suspended sediment, are sent to a laboratory. First they are weighed. Then the suspended sediment is filtered off, dried, and weighed. The ratio of the weight of the suspended sedhnent to the weight of the sample converted to a volume is an
4
expression of the concentration of suspended sediment in the stream at the time the sample was collected. The average concentration, expressed in milligrams per liter, is multiplied by the water discharge and by a urits conversion constant to obtain the suspended-sediment load, expressed as tons per day. Daily, monthly, and yearly loads are computed.
Sampling of the three streams began in May 1967. However, as of June 1968 suspended-sediment loads had not yet been calculated.
SEDIMENT TRANPORT THROUGH THf. TIDAL INLET
Measurements of the quantity of sediment moving in and out of the inlet to the lagoon during tidal periods were made on June 22, 1967, October 24-25, 1967, and May 16-17, 1968. The results of the first two sets of measurements are described in tJjs report. The results of the third have not yet been analyzed.
A moving-boat technique, in vrhich the boat moved at a rate of about 10 fpm (feet per minute) along a cable stretched across the inlet, was used to measure water flovr at the inlet. Two current meters, which were suspended from the boat and were adjusted for d'ange in depth, measured the velocity of the current continuously at 0.2 and 0.8 of the depth. Direction of flow (sensed by a current-orienting compass), depth of water, ftation, meter revolutions, and time were continuously registered on a panel of counters aboard the boat. The panel was photographed about every 30 seconds by an automatically triggered 35 -mm (millimeters) camera. Tho. difference in the total count of meter revolutions per 30 seconds is used to determine the average velocity for the increment of width traversed. Then by multiplying the average depth of the increment by its width, the area of the increment is obtained. The area multiplied by the velocity corrected for the angle of the current to the measuring section is the flow for the increment. The total flow is the sum of the flows of the increments. The above calculatior~ are made by
computer from data tabulated from the film. Measurements of flow took from 9 to 25 minutes. The measured flow was assumed to equal the flow at midpoint of the time interval of measurement.
While flow was being measured, suspended-sediment samples were being collected on the same boat. Depth-integrated samples were collected at five to seven stations during each measurement. On another boat, also in the inlet, point samples of sediment were collected from various depths, and samples of sediment moving along the bottom of the inlet were collected with an Arnhem sampler so that bedload could be calculated. The temperature of the water in the inlet was also measured.
TIDAL MEASUREMENT OF JUNE 22,1967
On June 22, 1967, the first measurement of the sediment load for a tidal period was made at the inlet. The tide there is a mixed, predominantly semidiurnal type. Water flow was measured during flood tide with a range of stage of about 4 feet and during an ebbtide with a range of only 1 .3 feet. Seventeen flow measurements were made.
The maximum average velocity during floodtide was about 3.5 fps (feet per second), and during ebbtide, about 2.4 fps. The maximum measured flow was 5,810 cfs (cubic feet per second) during floodtide and 3,720 cfs during ebbtide. During the 6-hour period of floodtide, 2,000 acre-feet of water flowed in through the inlet and during the 4 hours of ebbtide, 770 acre-feet flowed out.
The quantity of suspended sediment transported into the lagoon was greater than the quantity that left because ( 1) the duration of the floodtide was longer than that of the ebbtide, (2) the quantity of incoming water was much greater than the outgoing, and (3) the average concentrations of suspended sediment were higher during floodtide. About 152 tons of suspended sediment entered the lagoon and a bout 36 tons left; presumably, 116 tons remained in the lagoon.
5
The average concentration of suspended sediment during flood tide ranged from ? 4 to 98 mg/1 (milligrams per liter) and only frmn 34 to 49 mg/1 during ebbtide. The concentrrtion of suspended sediment finer than sand (<0.0<:2 mm) remained almost constant throughout the cross section of the channel during each measurement. Any significant increase in concentration, especially near the banks, was attributat 1e to an increase in the quantity of sand carried in suspension. Thus, the major immediate sources of most of the transported sediment ~·~re the beaches adjacent to the channel.
TIDAL MEASUREMENT OF OCfOBER 24-25,1967
The second tidal measurement at the inlet was made on October 24-25, 1967, for an entire tidal day of two floodtides and two el:lbtides. The measured average velocity reached maximums of 2.7 and 3.2 fps for the flood tides and of 4.7 and 1.1 fps for the ebbtides. The maximum average velocity during the major ebbtide was thus about 1.5 times that of flood tide.
The maximum measured flow was 5,280 cfs for the ebbtide from higher high water (+2.14 feet) to lower low water ( -2.37 feet). For the minor ebb tide from lower high water ( +0.85 foot) to higher low water (+0.68 foot) the maximum flow was only 1 ,440 cfs. About 2,330 acre-feet of water flowed out of the lagoon during the earlier ebbtide, which lasted 9 hours, and only 180 acre-feet during the later one, which lasted 3 hours.
The maximum measured flows fcT both floodtides were almost equal; 4,180 cfs for a period from higher low water (+0.93 foot) to higher high water (+2.14 feet) and 4, 230 cfs for that from lower low water (-2.37 feet) to lower high water ( +0.85 foot). The volume cf water that flowed into the lagoon dur:ng the flood tides also was almost equal, 1,340 and 1,330 acre-feet, even though the later floodtide lasted an hour longer than the earlier.
The highest suspended-sediment load was transported during the major ebbtide. About
495 tons of suspended sediment was transported then, whereas each floodtide transported about 85 tons and the minor ebbtide transported only 5 tons. Thus, there was a net removal of about 330 tons of sediment from the lagoon during the 25 hours.
The average concentration of suspended sediment ranged from 18 to 572 mg/1 during the major ebbtide and only from 5 to 26 mg/1 during the minor ebbtide. In contrast to the differences in the magnitude of the ranges of average concentration during the ebbtides, the ranges of average concentration of suspended sediment during the floodtides were almost equal. Average concentration ranged from 11 to 112 mg/1 for the earlier floodtide and from 9 to 125 mg/1 for the later floodtide. The major ebbtide thus had a maximum average concentration almost 5 times that of the maximum during a floodtide.
The beach along the western end of the spit was the chief contributor of suspended sediment on October 24-25, 1967. The highest concentrations of supended sediment consistently were near the spit. Concentrations at the middle of the inlet and near the west bank were lower than those near the east bank throughout the sampling period. As on June 22 the concentration of suspended sediment fmer than sand (<0.062 mm) remained nearly uniform across the inlet, but the concentration of sand fluctuated greatly with the highest concentration occurring near the east bank.
LITTORAL DRIFT
Littoral drift is defined as the movement of material in the littoral zone (the zone between high and low tides) under the influence of waves and currents (Beach Erosion Board, 1961, p. Al7). By placing dye and floats in the surf zone, the direction of the longshore current, which is indicative of the direction of littoral drift, can be determined. The direction of the longshore currents near the inlet to Bolinas Lagoon was noted in May, September, and December 1967. Rhodamine B dye and brightly colored rubber balls were used.
6
From the few observations it VJas concluded that the direction of littoral drift, as determined from the direction of the longsho·e currents, is not constant because of the changing directions of the winds and breaking waves. Near the inlet the circulation is generally toward the mouth of the lagoon and is associated with the water entering and leaving the lagoon.
Littoral drift was also studied by tracing the movement of fluorescent san~~ that were deposited on the beaches. The dyP-d grains were spread on the beach near Stinson Beach on July 23 and on the beach near Bolina~ on July 24, 1968. Results of the tracing have not yet been completed.
CIRCULATION IN BOLINAS LAGOON
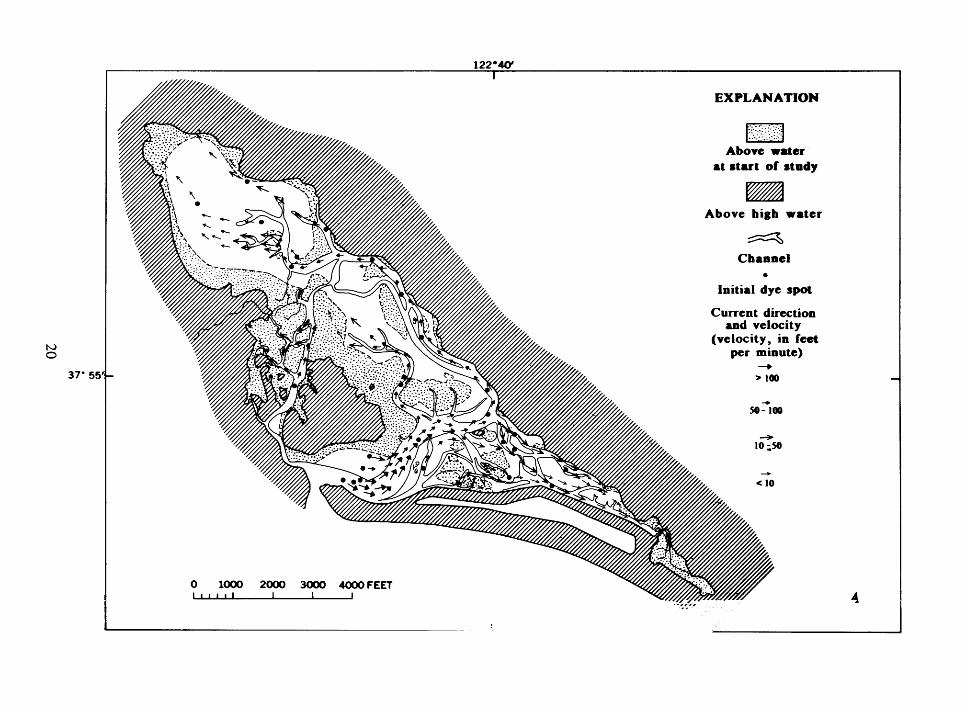
The circulation of water in Bolinas Lagoon also was studied by following the movement of dye. The bright red dye, rhodamine B, was dropped from a helicopter into nany parts of the lagoon on September 6, 1967. The dye was usually dropped so that spots of dye formed a line perpendicular to the channel in the lagoon. Three series of dye drops were made ( 1 0: 15 a.m., 1:05 p.m., and 3:15p.m.) ~nd 17 sets of color aerial photographs were t~ \ren from an airplane at an altitude of 6,0~0 feet. By comparing the location of the center of the spots of dye in each sucressive set of photographs, the movement of the dye was measured.
When the circulation study began, most of the flow was confined to the main channels and remained so until the rising tide covered most of the lagoon. As water entered Bolinas Lagoon, some of it moved into Bolinas Channel. The greater part, however, moved eastward between Kent Island and Seadrift where. the surface velocities were greater than 100 fpm, the highest measured, but by the time the flo'" had reached the vicinity of the eastern shore, it" velocity had decreased substantially (fig. 4.A). Near the eastern shore the water divided; some flowed southeast and some, northwest.
Velocities in the southeastern part of the lagoon were less than 50 fpm, even though rnuch of the water was confined to channels. Before the water had flowed very far into this part, its velocity had been reduced to even less than 10 fpm.
The major flow was northwestward in a channel along the east shore of the lagoon .. The surface velocity there was 50-100 fpm, but when the water reached the upper basin, the flow decelerated rapidly to less than 10 fpm.
Dye dropped in Bolinas Channel did not get into the upper basin, but moved northwtrd into several small channels near the delta of Pine Gulch Creek. Therefore, the water that entered the upper basin must have been mostly from between Kent Island and the east side of Bolinas Lagoon.
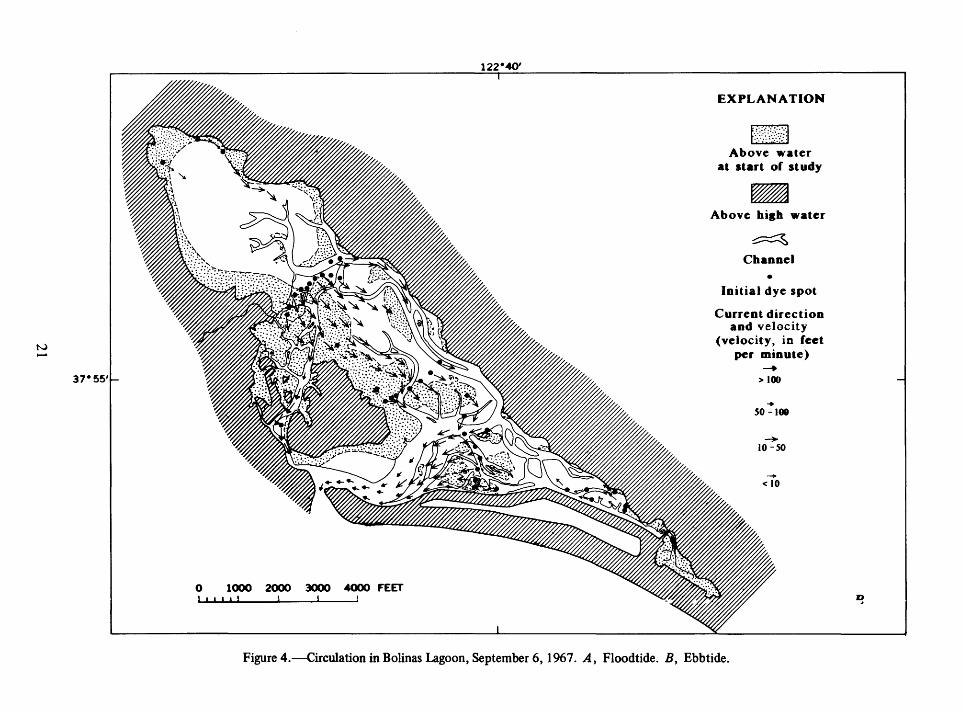
The floodtide-circulation studies lasted from 10: 15 a.m. to about 1 :20 p.m. The circulation reversal was first noted in the upper basin about 30 minutes before it was noted in many other parts of the lagoon. Most of the first observed reversals were in the western part of the lagoon. Evidently, at the time that the first indications of ebbtide were observed, the water was still advaincing along the east side of the lagoon, but already was retreating along the west side: and moving out through Bolinas Channel.
During the ebbtide period of observation, the velocities of the water were less than those during floodtide (fig. 4B) because most of the outward flow was a sheet flow and not the channel flow observed during much of the floodtide. Also, a larger volume of water per unit time moved into the lagoon during flood tide than moved out during ebbtide. The velocities at ebbtide were higher at constrictions such as that near the inlet and at Bolinas Channel. Unfortunately, the period of observation did not include a time when most of the ebbtide flow was confined to channels, a condition which probably occurred later with resultant higher velocities.
7
Perhaps the greatest significance of the circulation study is its applicability to the study of movement of sediment. Acco~ding to Hjulstrom (1935), velocities of 100, SC, and 10 fpm are capable of transporting particles having diameters as large as 7 mm, 3.5 mm, and 0.7 mm, respectively. Although Hjulstrom's relations of velocity to movement of particles of different sizes are oversimplifications of complex phenomena and although other investigators, such as Sundborg ( 1956), have shown different relations, Hjulstrom's relations may be used as a basis for suggesting areas of erosion and deposition in the lagoon.
The average particle size in and around the lagoon is about 0.2 mm. The Hjulstrom relations indicate that sediment of this size can be transported at prevailing velocities almost anywhere in the lagoon except perhaps in the upper basin and in the southeastern part of the lagoon. If the velocities are reduced to r~ro for a short time at slack tide and most of the transported sediment is deposited, then a velocity of about 30 fpm must be reached (Hjulstrom, 1935) to erode a particle of 0.2 mm from the bed of the lagoon. Hjulstrom's relation of velocity to particle size shows that the upper basin and the southeastern part of the lagoon are depositional areas, whereas most of the other areas are erosional during average tides. Another area that must be depositional, althC'llgh dye movement was not measured in its vicinity, is the tidal marsh behind Kent Island; because of its very nature, it would not be conducive to high velocities.
BOTTOM TOPOGRAPHY
A hydrographic survey was made to determine the topography of the bottom of Bolinas Lagoon and to provide a base for comparison with past and future surveys. In August and September 1967, profile; of the bottom were surveyed along 26 ranges to document the location and configuration of channels. Erosion and deposition ,in tl'~ lagoon can be determined by future surveys on these ranges.
The ranges were established in lines as parallel and evenly spaced as possible except where conditions made it necessary to establish additional ranges. Short ranges were established across the inlet, certain channels, and deltas of tributaries to the lagoon. Bench marks and other permanent markers were used to mark range ends wherever possible; elsewhere 6-foot lengths of 3/4-inch steel reinforcing rods were driven into the ground to mark the sites.
Most elevations along the long ranges were established with an instrument that emits a laser beam of low intensity. The emitted laser beam rotates 360° about twice a second in a horizontal plane. A vertical adjustable unit for receiving ~he laser beam is mounted in a Linker-tape rod. An audible signal sounds when the receiver intersects the beam, and the point where the beam is received on the rod is a direct reading of the elevation of the station. The laser emitter in this study was left unmanned after its initial setup except for occasional checking. The instrument was set up on a point near the range and the rodman moved along the range. Readings were taken at breaks in the slope and at channels. Distances were determined by triangulation.
The laser system was used on the long ranges because its accuracy was within ±0.1 foot for distances as far as half a mile. For short ranges and certain parts of long ranges, elevations were determined by leveling and distances by stadia.
The maximum depth measured by the survey was 14.7 feet below mean sea level. Except for the upper basin the channels were well defined in most of the cross sections. The largest channel passed between Kent Island and Seadrift and extended along the eastern shore of the lagoon to the upper basin. Bolinas Channel was the only other large channel in the lagoon.
SEDIMENT MOVEMENT
are (1) grain-size parameters, (2) mineralogy, and (3) fluorescent particles. Each is suited in its own way to various aspects of the study. Grain-size and mineralogical tracin.~ techniques have been applied already; application of the fluorescent-particle techniques has just begun.
GRAIN-SIZE PARAMETERS AND SPECIFIC WEIGHT OF LAGOONAL SEDIMENTS
Samples of bottom sediment were collected with a piston corer to depths of 0.3 and 0.5 foot. Most of the samples were collected in August and September 1967 during the hydrographic survey. The samples were usually split into two parts. Grain-size dist·'ibution was determined by sieving one part, and the other part was u.sed either for determination of mineralogy or specific weight.
Grain-size parameters, such as median grain size and sorting, were calculated as possible statistical measures of depositional environments and source areas. The parameters were calculated graphically by the methcds of Inman ( 1952, p. 130), using phi units, where
D being the particle diameter in millimeters (Krumbein, 1936, p. 37). For some samples the values used for the calculations of sorting had to be estimated, but the consistency c f the results showed that these estimates were probably fairly accurate.
Most of the lagoon bottom consists of fine sand as classified by Wentworth (1922) (table 1). The finest sediment is in the northwest part of the upper basin. Near the mouth of some streams, the sediment was coarser than the average, indicating that the coarse s~diment was carried into the lagoon by streams.
Although the methods of Inmar were used, the terms of Folk (1961) were use~ to describe the sorting of the sediment (table 2). Sediments in the lagoon were generally moderately sorted in the central part and tended to be~-;ome poorly
. sorted·in the upper basin and southeast end. The
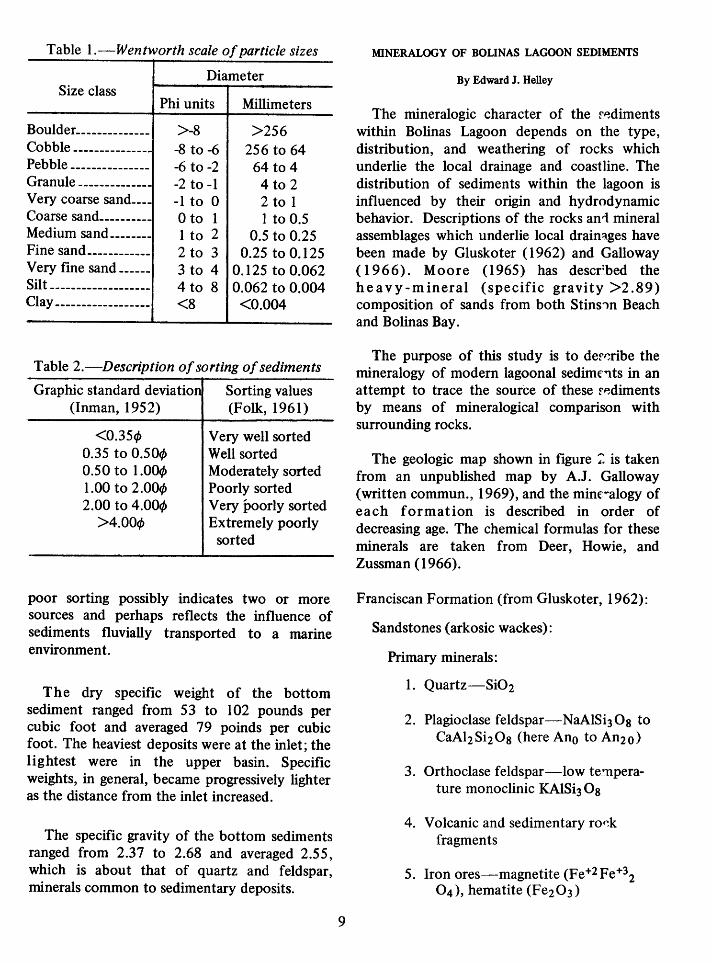
Table I.-Wentworth scale of particle sizes
Diameter Size class
Phi units Millimeters Boulder _____________ _
Cobble--------------Pebble--------------Granule --------------Very coarse sand ___ _ Coarse sand _________ _
Medium sand-------Fine sand-----------Very fme sand------Silt-------------------Clay------------------
>-8 -8 to -6 -6 to -2 -2 to -1 -1 to 0 0 to I I to 2 2 to 3 3 to 4 4 to 8 <8
>256 256 to 64
64 to 4 4 to 2 2 to I I to 0.5
0.5 to 0.25 0.25 to 0.125
0.125 to 0.062 0.062 to 0.004 <0.004
Table 2.-Description of sorting of sediments
Graphic standard deviatio (Inman, 1952)
<0.35~ 0.35 to 0.50~ 0.50 to 1.0~ 1.00 to 2.0~ 2.00 to 4.0~ >4.00~
Sorting values (Folk, 1961)
Very well sorted Well sorted Moderately sorted Poorly sorted Very poorly sorted Extremely poorly
sorted
poor sorting possibly indicates two or more sources and perhaps reflects the influence of sediments fluvially transported to a marine environment.
The dry specific weight of the bottom sediment ranged from 53 to 102 pounds per cubic foot and averaged 79 poinds per cubic foot. The heaviest deposits were at the inlet; the lightest were in the upper basin. Specific weights, in general, became progressively lighter as the distance from the inlet increased.
The specific gravity of the bottom sediments ranged from 2.37 to 2.68 and averaged 2.55, which is about that of quartz and feldspar, minerals common to sedimentary deposits.
9
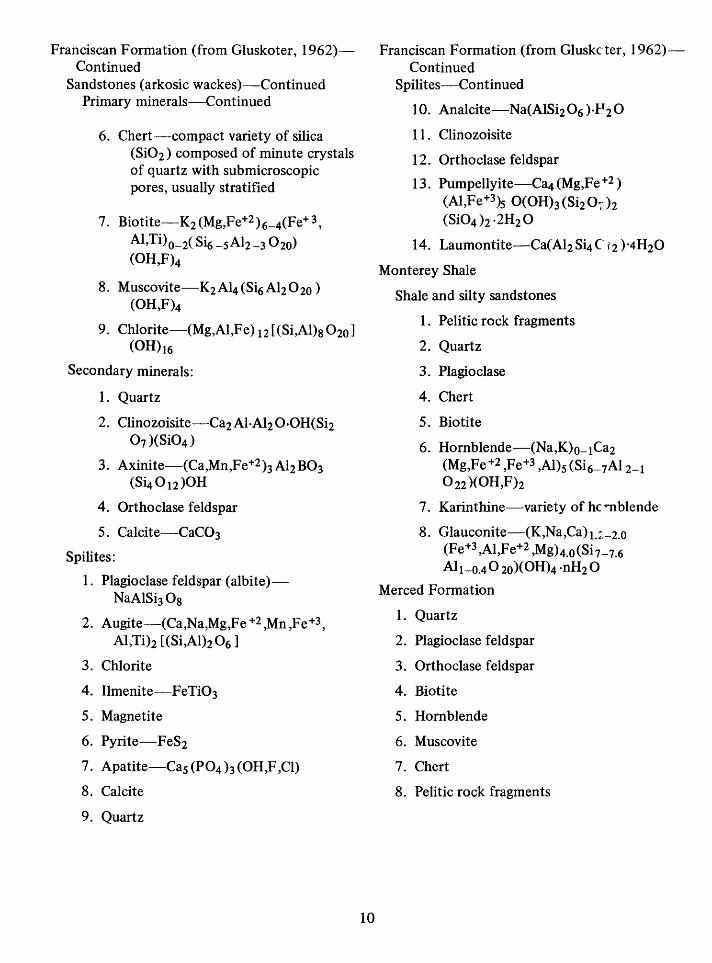
MINERALOGY OF BOUNAS LAGOON SEDIMENTS
By Edward J. Belley
The mineralogic character of the ff!diments within Bolinas Lagoon depends on the type, distribution, and weathering of rocks which underlie the local drainage and coastline. The distribution of sediments within the lagoon is influenced by their origin and hydrodynamic behavior. Descriptions of the rocks an1 mineral assemblages which underlie local drain~ges have been made by Gluskoter ( 1962) and Galloway ( 1966). Moore (1965) has descr~bed the heavy-mineral (specific gravity >2.89) composition of sands from both Stins...,n Beach and Bolinas Bay.
The purpose of this study is to der~ribe the mineralogy of modern lagoonal sedimr'"lts in an attempt to trace the source of these ff!diments by means of mineralogical comparison with surrounding rocks.
The geologic map shown in figure ;. is taken from an unpublished map by A.J. Galloway (written commun., 1969), and the minrralogy of each formation is described in order of decreasing age. The chemical formulas for these minerals are taken from Deer, Howie, and Zussman ( 1966).
Franciscan Formation (from Gluskoter, 1962):
Sandstones (arkosic wackes):
Primary minerals:
1. Quartz-Si02
2. Plagioclase feldspar-NaAISi3 Os to CaAI2Si20s (here Ano to An2o)
3. Orthoclase feldspar-low te:-nperature monoclinic KAISi3 Os
4. Volcanic and sedimentary ro~k fragments
5. Iron ores-magnetite (Fe+2 Fe+32
04 ), hematite (Fe2 03)
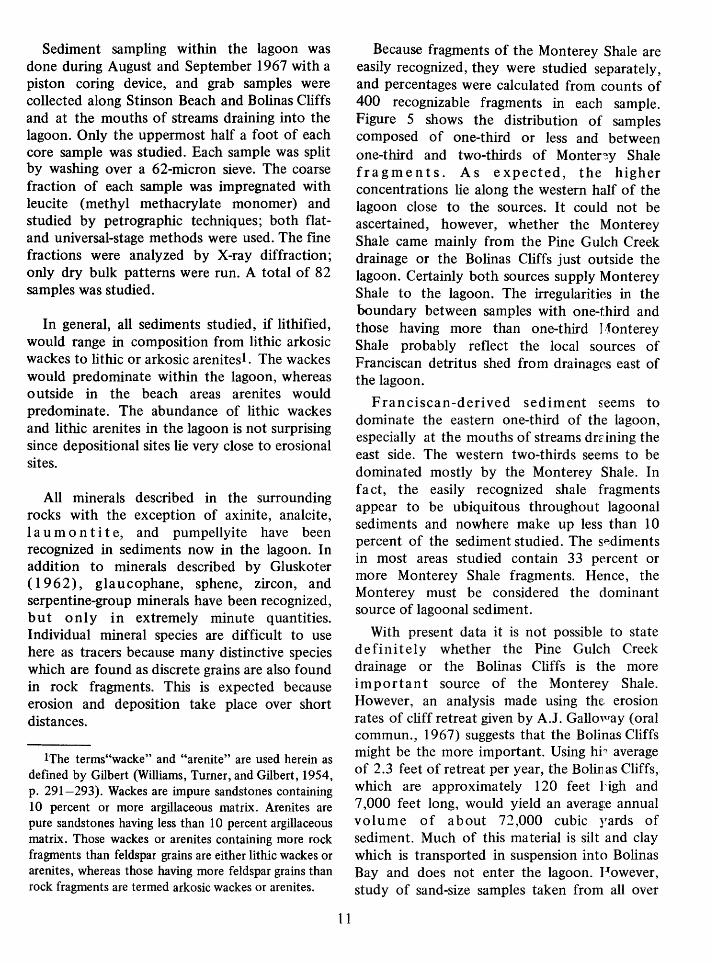
Franciscan Formation (from Gluskoter, 1962)Continued
Sandstones (arkosic wackes)-Continued Primary minerals-Continued
6. Chert-compact variety of silica (Si02) composed of minute crystals of quartz with submicroscopic pores, usually stratified
7. Biotite-K2 (Mg,Fe+2)6_4(Fe+ 3,
Al,Ti)o-2( Si6 -sA12-3 02o) (OH,F)4
8. Muscovite-K2Al4(Si6Al202o) (OH,F)4
9. Chlorite-(Mg,Al,F e) 12 [ (Si,Al)s 02o] (0Hh6
Secondary minerals:
1. Quartz
2. Clinozoisite-Ca2Al·Al2 O·OH(Si2 07 )(Si04)
3. Axinite-(Ca,Mn,Fe+2 h Al2 B03 (S4012)0H
4. Orthoclase feldspar
5. Calcite-CaC03
Spilites:
1. Plagioclase feldspar (albite)NaA1Si30s
2. Augite-(Ca,Na,Mg,Fe +2 ,Mn ,Fe+3, Al,Tih [ (Si,Alh 06 ]
3. Chlorite
4. Ilmenite-FeTi03
5. Magnetite
6. Pyrite-FeS2
7. Apatite-Cas (P04 h (OH,F ,Cl)
8. Calcite
9. Quartz
10
Franciscan Formation (from Gluskcter, 1962)Continued
Spilites-Continued
10. Analcite-Na(AlSi2 06 )·P2 0
11. Clinozoisite
12. Orthoclase feldspar
13. Pumpellyite-Ca4 (Mg,Fe +2) (Al,Fe+3)s O(OHh (Si2 01· h (Si04 h ·2H2 0
14. Laumontite-Ca(Al2Si4C12)·4H20
Monterey Shale
Shale and silty sandstones
1. Pelitic rock fragments
2. Quartz
3. Plagioclase
4. Chert
5. Biotite
6. Hornblende-(Na,K)o-1Ca2 (Mg,Fe+2 ,Fe+3 ,Al)s (Si6-1Al2-1 022)(0H,Fh
7. Karinthine-variety of he mblende
8. Glauconite-(K,Na,Ca) 1.2:-2.0 (Fe+3 ,Al,Fe+2 ,Mg)4.0(Si7_7.6 Al1-o.40 2o)(OH)4 ·nH2 0
Merced Formation
1. Quartz
2. Plagioclase feldspar
3. Orthoclase feldspar
4. Biotite
5. Hornblende
6. Muscovite
7. Chert
8. Pelitic rock fragments
Sediment sampling within the lagoon was done during August and September 1967 with a piston coring device, and grab samples were collected along Stinson Beach and Bolinas Cliffs and at the mouths of streams draining into the lagoon. Only the uppermost half a foot of each core sample was studied. Each sample was split by washing over a 62-micron sieve. The coarse fraction of each sample was impregnated with leucite (methyl methacrylate monomer) and studied by petrographic techniques; both flatand universal-stage methods were used. The fine fractions were analyzed by X-ray diffraction; only dry bulk patterns were run. A total of 82 samples was studied.
In general, all sediments studied, if lithified, would range in composition from lithic arkosic wackes to lithic or arkosic arenites1. The wackes would predominate within the lagoon, whereas outside in the beach areas arenites would predominate. The abundance of lithic wackes and lithic arenites in the lagoon is not surprising since depositional sites lie very close to erosional sites.
All minerals described in the surrounding rocks with the exception of axinite, analcite, 1 au m on tit e, and pumpellyite have been recognized in sediments now in the lagoon. In addition to minerals described by Gluskoter ( 1 9 6 2), glaucophane, sphene, zircon, and serpentine-group minerals have been recognized, but only in extremely minute quantities. Individual mineral species are difficult to use here as tracers because many distinctive species which are found as discrete grains are also found in rock fragments. This is expected because erosion and deposition take place over short distances.
lThe terms"wacke" and "arenite" are used herein as defined by Gilbert (Williams, Turner, and Gilbert, 1954, p. 291-293). Wackes are impure sandstones containing 10 percent or more argillaceous matrix. Arenites are pure sandstones having less than 10 percent argillaceous matrix. Those wackes or arenites containing more rock fragments than feldspar grains are either lithic wackes or arenites, whereas those having more feldspar grains than rock fragments are termed arkosic wackes or arenites.
11
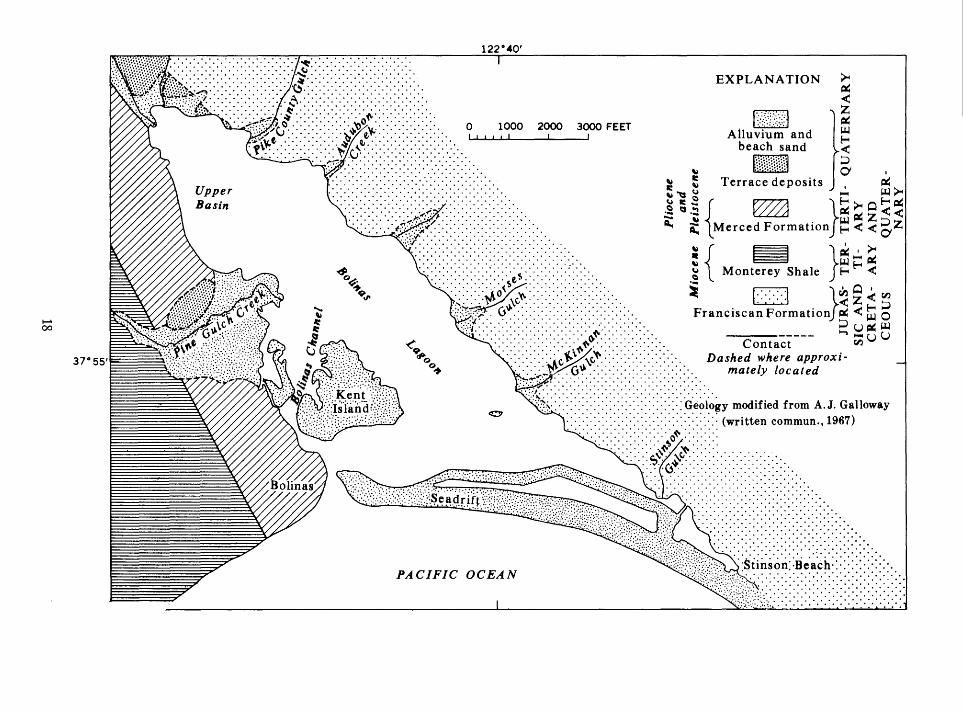
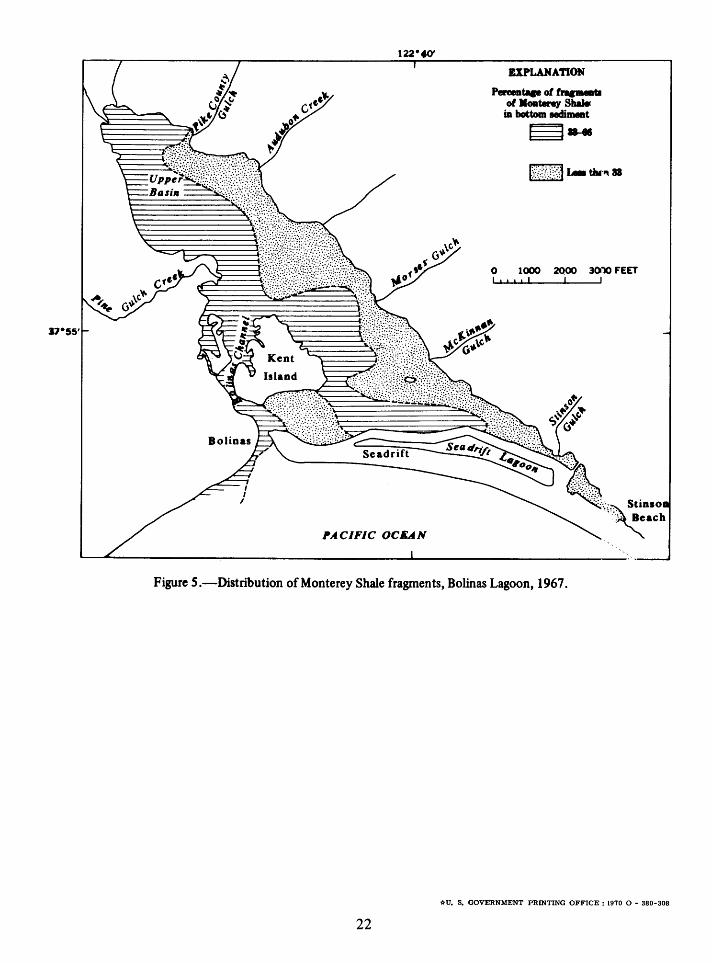
Because fragments of the Monterey Shale are easily recognized, they were studied separately, and percentages were calculated from counts of 400 recognizable fragments in each sample. Figure 5 shows the distribution of samples composed of one-third or less and between one-third and two-thirds of Monter~y Shale fragments. As expected, the higher concentrations lie along the western half of the lagoon close to the sources. It could not be ascertained, however, whether the Monterey Shale came mainly from the Pine Gulch Creek drainage or the Bolinas Cliffs just outside the lagoon. Certainly both sources supply Monterey Shale to the lagoon. The irregularitir,s in the boundary between samples with one-third and those having more than one-third I ·1 onterey Shale probably reflect the local sources of Franciscan detritus shed from drainages east of the lagoon.
Franciscan-derived sediment seems to dominate the eastern one-third of the lagoon, especially at the mouths of streams drrining the east side. The western two-thirds seems to be dominated mostly by the Monterey Shale. In fact, the easily recognized shale fragments appear to be ubiquitous throughout lagoonal sediments and nowhere make up less than 10 percent of the sediment studied. The sediments in most areas studied contain 33 percent or more Monterey Shale fragments. Hence, the Monterey must be considered the dominant source of lagoonal sediment.
With present data it is not possible to state definitely whether the Pine Gulch Creek drainage or the Bolinas Cliffs is the more important source of the Monterey Shale. However, an analysis made using the: erosion rates of cliff retreat given by A.J. Gallo'~'ay (oral commun., 1967) suggests that the Bolinas Cliffs might be the more important. Using hi~ average of 2.3 feet of retreat per year, the Bolinas Cliffs, which are approximately 120 feet l'igh and 7,000 feet long, would yield an average annual volume of about 72,000 cubic yards of sediment. Much of this material is silt and clay which is transported in suspension into Bolinas Bay and does not enter the lagoon. Powever, study of sand-size samples taken from all over
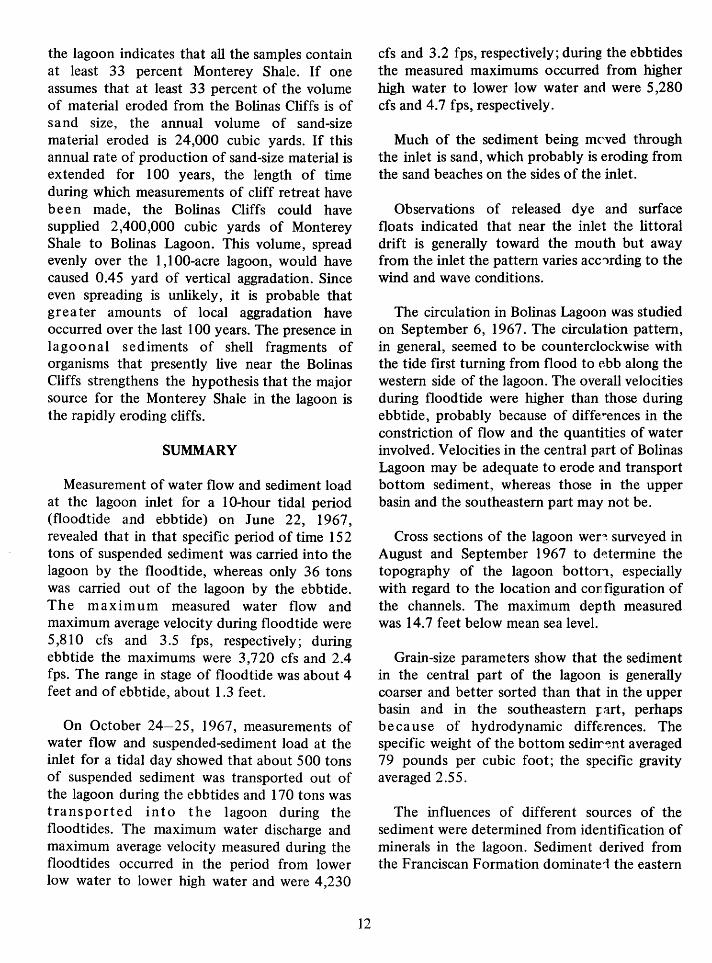
the lagoon indicates that all the samples contain at least 33 percent Monterey Shale. If one assumes that at least 33 percent of the volume of material eroded from the Bolinas Cliffs is of sand size, the annual volume of sand-size material eroded is 24,000 cubic yards. If this annual rate of production of sand-size material is extended for I 00 years, the length of time during which measurements of cliff retreat have been made, the Bolinas Cliffs could have supplied 2,400,000 cubic yards of Monterey Shale to Bolinas Lagoon. This volume, spread evenly over the I , I 00-acre lagoon, would have caused 0.45 yard of vertical aggradation. Since even spreading is unlikely, it is probable that greater amounts of local aggradation have occurred over the last I 00 years. The presence in lagoonal sediments of shell fragments of organisms that presently live near the Bolinas Cliffs strengthens the hypothesis that the major source for the Monterey Shale in the lagoon is the rapidly eroding cliffs.
SUMMARY
Measurement of water flow and sediment load at the lagoon inlet for a I 0-hour tidal period (flood tide and ebbtide) on June 22, 1967, revealed that in that specific period of time 152 tons of suspended sediment was carried into the lagoon by the floodtide, whereas only 36 tons was carried out of the lagoon by the ebbtide. The maximum measured water flow and maximum average velocity during floodtide were 5,810 cfs and 3.5 fps, respectively; during ebbtide the maximums were 3,720 cfs and 2.4 fps. The range in stage of floodtide was about 4 feet and of ebbtide, about 1.3 feet.
On October 24-25, 1967, measurements of water flow and suspended-sediment load at the inlet for a tidal day showed that about 500 tons of suspended sediment was transported out of the lagoon during the ebbtides and 170 tons was transported into the lagoon during the floodtides. The maximum water discharge and maximum average velocity measured during the floodtides occurred in the period from lower low water to lower high water and were 4,230
12
cfs and 3.2 fps, respectively; during the ebb tides the measured maximums occurred from higher high water to lower low water anrl were 5,280 cfs and 4. 7 fps, respectively.
Much of the sediment being mC'ved through the inlet is sand, which probably is eroding from the sand beaches on the sides of the inlet.
Observations of released dye and surface floats indicated that near the inlet the littoral drift is generally toward the mouth but away from the inlet the pattern varies acc')rding to the wind and wave conditions.
The circulation in Bolinas Lagoon was studied on September 6, 1967. The circulation pattern, in general, seemed to be counterclockwise with the tide first turning from flood to ebb along the western side of the lagoon. The overall velocities during floodtide were higher than those during ebbtide, probably because of diffe~ences in the constriction of flow and the quantities of water involved. Velocities in the central part of Bolinas Lagoon may be adequate to erode and transport bottom sediment, whereas those in the upper basin and the southeastern part may not be.
Cross sections of the lagoon wer~ surveyed in August and September 1967 to d~termine the topography of the lagoon botton, especially with regard to the location and configuration of the channels. The maximum depth measured was 14.7 feet below mean sea level.
Grain-size parameters show that the sediment in the central part of the lagoon is generally coarser and better sorted than that in the upper basin and in the southeastern _rart, perhaps because of hydrodynamic diffe.rences. The specific weight of the bottom seditr~nt averaged 79 pounds per cubic foot; the specific gravity averaged 2.55.
The influences of different sources of the sediment were determined from identification of minerals in the lagoon. Sediment derived from the Franciscan Formation dominate1 the eastern
one-third of the lagoon. This sediment was transported to the lagoon by the eastern streams tributary to the lagoon. The sediment in the western two-thirds of Bolinas Lagoon was derived chiefly from the Monterey Shale. This sediment was carried into the lagoon by Pine Gulch Creek and by tidal currents and waves that eroded Bolinas Cliff.
SELECTED REFERENCES
Beach Erosion Board, 19 61 , Shore protection planning and design: Washington, U.S. Govt. Printing Office, Tech. Rept. 4, 242 p.
Deer, W.A., Howie, R.A., and Zussman, Jack, 1966, An introduction to the rock-forming minerals: New York, John Wiley & Sons, Inc., 518 p.
Folk, R.L., 1961. Petrology of sedimentary rocks: Austin, Texas, Hemphill's, 154 p.
Galloway, A.J., 1966, Geology of northern California: California Div. Mines and Mines Bull. 190, p. 429-440.
Gilbert, G.K., 1908. Tomales Bay to Bolinas Lagoon, in Lawson, A.C., chm., and others, The California earthquake of April 18, 1906-Report of the State Earthquake Investigation Commission: Carnegie Inst. Washington Pub. 87, 3 v., 1 atlas.
Gluskoter, H.J., 1962, Geology of a portion of western Marin County, California: Berkeley, California Univ., Ph. D. thesis, 184 p.
Gorai, Masao, 1951, Petrological studies in plagioclase twins: Am. Mineralogist, v. 36, p. 884-901.
Hjulstrom, Filip, 1935, Studies of the morphological activity of rivers as illustrated by the River Fyris: Bull. Geol. lnst. Univ. Upsala, v. 25, p. 221-528.
Inman, D.L., 1952, Measures for describing the size distribution of sediments: Jour. Sed. Petrology, v. 22, no. 3, p. 125-145.
13
Krumbein, W.C., 1936, Application of logarithmic moments to size f .. equency distribution of sediments: Jour. Sed. Petrology, v. 6, p. 35-42.
Moore, D.B., 1965, Recent coastal s~diments Double Point to Point San Pedro, California: Berkeley, California Univ., Hydraulic Engineering Laboratory tech. rept., p. 2-14.
Rantz, S.E., 1968, Average precipitation and runoff in north coastal California: U.S. Geol. Survey Hydrol. Inv. Atlas HA-298.
Ritter, J.R., 1969a, Measurement of water flow and sediment load, Bolinas Lagoon, Bolinas, California: U.S. Geol. Survey Prcf. Paper 650-B, p. B189-Bl93.
--1969b, Preliminary studies of sedimentation and hydrology in Bolinas Lagoon, May 1967 to June 1968: U.S. Geol. Survey open-file rept., 95 p.
Slemmons, D.B., 1962, Determin~tion of volcanic and plutonic plagioclases using a three to four axis universal stage: Geol. Soc. America Spec. Paper 69, p. 34.
Sundborg, Ake, 1956, The river Kalr~a1ven, a study of fluvial processes: Geografiska Annaler, v. 38, p. 127-316.
Turner, F.J., 1951, Observations on twinning of plagioclase in metamorphic roc"s: Am. Mineralogist, v. 36, p. 581-589.
Wentworth, C.K., 1922, A scale of grade and class terms for clastic sediments: Jour. Geology, v. 30, p. 377-392.
Williams, Howell, Turner, F.J., and Gilbert, C.M., 1954, Petrography, an introduction to the study of rocks in thin sections: San Francisco, Calif., W.H. Freeman and Co., 382 p.

FIGURES l-5

PACIFIC OCEAN
EXPLANATION
s Gaging station
® Tide gage
0 1000 I II II I
2000 I
3000 fi~ET I
Figure 1.-Location of data sites and area of Bolinas Lagoon.
17
1--' 00
122°~0'
1000 2000 3000 FEET
PACIFIC OCEAN
EXPLANATION ~
All u ti;~;J and }~ ~ ~ Te:r:~~~~~::its ~ ~ ~~u - ~~ u 1: ~ { ~ }f-. ~ 0 f-. ~ ~~~ ~ ~~z<< i:: i: Merced Formation ~ < < gz
~{ ~ }~~~ ~ Monterey Shale f-. f-. < ~ ~ }.~0· ~ ~ <z<CI.l Francisca~ Formation ~ < ~ g
::>u~~ -------- ...... - u u
Contact ell
Dashed where approximately located
-::::::::::::::::::::::::::::::::::::. 0 & •••• 0 •• 0. 0 ••••••
0 •••••• 0 0. 0 0. 0 ••••
0 0 0. 0 •• 0. 0 •••• 0 ••••
• • 0 ••• 0 •• 0. 0 •••••••
• • • • 0 •••••• 0. 0 ••••• . . . . . . .
·.·.·~·.·.·.·.··:·:·:-:-:·:-:-:-:·: ............
• • 0 •••••••••••••••
• • • 0 ••••
0 I
1
Duxbury Point
2 MILES
1950
..,.,. ... .,
Figure 3.-Development of Bolinas Lagoon, 1858 to 1950. 1858: From a plat of Rancho Las Baulines surve:yed by R.C. Matthewson, October 1858, under instructions from the U.S. Surveyor General. 1897: From U.S. Geological Survey Tamalpais topographic sheet. 1941: From Corps of Engineers, U.S. Army tactical map. Tamalpais topographic quadrangle. 1950: From U.S. Geological Survey Mount Tamalpais quadrangle.
19
N 0
37• 55';
122.40'
0 1000 2000 3000 4000FEET I 11 11 I I I I
EXPLANATION
ITJIJJ Above water
at start of study -Above hi1h water
~ Channel
• Initial dye spot
Current direction and velocity
(velocity, in feet per minute)
--+ > 100
.... S0-100
-+ 10;50
4
N -37.55'
122.40'
0 1000 2000 3000 4000 FEET ! I I I I J ! ' I
EXPLANATION
E2SJ Above water
at start of study -Above high water
~ Channel
• Initial dye spot
Current direction and velocity
(velocity, in feet per minute)
-+ > 100
... so -108
~
10 -so
-< 10
Figure 4.-Circulation in Bolinas Lagoon, September 6, 1967. A, Floodtide. B, Ebbtide.
~
JIIA.CIFIC OCEAN
EXPLANATION
Ptnentap of,....... of •oaterey S..._
ia bottom aectimat
~--·
0 1000 2QOO 3()')() FEET I 11 11 I I
Figure 5 .-Distribution of Monterey Shale fragments, Bolinas Lagoon, 1967.
*U. S. GOVERNMENT PRINTING OFFICE : 1970 0 - 380-308
22


