A SURVEY OF NEARBY MAIN-SEQUENCE STARS FOR SUBMILLIMETER EMISSION E. K. Holmes 1 Jet Propulsion Laboratory, MS 169-506, California Institute of Technology, 4800 Oak Grove Drive, Pasadena, CA 91109; [email protected]H. M. Butner Submillimeter Telescope Observatory, Steward Observatory, University of Arizona, Tucson, AZ 85721; [email protected]and S. B. Fajardo-Acosta and L. M. Rebull SITF Science Center, MS 220-6, California Institute of Technology, 1200 East California Boulevard, Pasadena, CA 91125; [email protected], [email protected]Received 2000 January 30; accepted 2003 March 5 ABSTRACT We searched for submillimeter emission around 10 Vega-type stars and one Herbig Ae star with the four-color bolometer at 1300 lm and the 19 channel bolometer array at 870 lm using the Heinrich Hertz Telescope at the Submillimeter Telescope Observatory. All of our sources were undetected at 870 lm. In the case of HD 131156, we have a 3 ' detection at 1300 lm. We report a flux of 6:25 1:88 mJy for the HD 131156 disk and a corresponding dust mass of 2:4 0:7 lunar masses. However, we did not detect HD 131156 at 870 lm, so we are cautious about the 1300 lm detection. We performed follow-up infrared observations of HD 131156 using MIRLIN at the Palomar 200 inch telescope, which resolved both components of the binary. The data are photospheric, implying that the system does not have a hot, inner dust component. We report submillimeter upper limits on fluxes for the remaining systems. Key words: circumstellar matter — submillimeter radiation — surveys 1. INTRODUCTION The Infrared Astronomical Satellite (IRAS ) detected excess far-infrared emission, at wavelengths of 60 and 100 lm, from more than 15% of all nearby main-sequence A–K stars, indicating the presence of circumstellar material (Backman & Paresce 1993; Elachi et al. 1996). Recent advances in instrumentation have allowed detailed observa- tional maps to be made of a small fraction of these infrared- excess stars revealing disks of circumstellar material, termed planetary debris disks, at both infrared (Koerner et al. 1998; Telesco et al. 2000) and submillimeter (Holland et al. 1998; Greaves et al. 1998) wavelengths. Some of these debris disks show ringlike structures (Eri) or other asymmetries (Pic, Fomalhaut, Vega, and HR 4796). There is a possible connection between the structure in evolved circumstellar disks and the presence of planets (Backman & Paresce 1993; Dermott et al. 1999b), with our own inner planetary debris disk, the zodiacal cloud, being a proven example. Asymmetries in such a disk could be diag- nostic of planets that would otherwise be undetectable. Dynamical models of circumstellar disks have been made for the purpose of linking asymmetric structures that arise in planetary debris disks to the presence of planets in the sys- tems (Liou & Zook 1999; Holmes et al. 1999; Dermott et al. 1999b). The models are based on the numerical integration of asteroidal particles. The dynamical evolution of these particles is followed from source to sink with Poynting- Robertson light drag, solar wind drag, radiation pressure, and the effects of planetary gravitational perturbations included. These unique modeling techniques, originally developed to study the influence of the planets and the Hirayama asteroid families (Dermott et al. 1999a) on the zodiacal cloud, have been extended to produce theoretical exosolar system dust clouds from varying input parameters. It is our ultimate goal to extend these infrared models into the submillimeter regime (300 lmd!d1000 lm). The cool dust (T 50 K) detected in the submillimeter regime lies far (30 AU to hundreds of AU) from the central star. This loca- tion is most analogous to the Kuiper belt in our solar system (Backman & Paresce 1993), which is home to an estimated 10 5 Kuiper belt objects (KBOs) with a diameter 100 km located within 30–50 AU (Jewitt, Luu, & Trujillo 1998). In the asteroid belt, collisions between asteroids supply dust particles to the zodiacal cloud, the Sun’s inner dust disk, which is visible at optical and infrared wavelengths. By com- parison, it has been postulated that collisions between KBOs could initiate a collisional cascade producing a Kuiper dust disk, which would be the second brightest feature of the solar system from an exosolar perspective (Landgraf et al. 2002). From a modeling perspective, far- infrared and submillimeter observations are very interesting because they can be compared with the Kuiper disk. Submillimeter observational maps of planetary debris disks have been limited to a small number of systems: Pic, Vega, Fomalhaut (Holland et al. 1998), and Eri (Greaves et al. 1998). IRAS detected very strong far-infrared excesses from all of these nearby main-sequence stars (Gillett 1986; Backman & Paresce 1993) and also resolved them spatially (Backman & Paresce 1993; Aumann & Good 1990). As a result, these four stars have been studied extensively at a number of different wavelengths. However, from a statisti- cal standpoint, we need more detections—and ultimately maps—to claim a broad knowledge of debris disks as a whole, especially considering that upward of 15% of all main-sequence A–K stars have detectable infrared excesses. 1 National Research Council Resident Research Associate. The Astronomical Journal, 125:3334–3343, 2003 June # 2003. The American Astronomical Society. All rights reserved. Printed in U.S.A. 3334
Transcript
A SURVEY OF NEARBY MAIN-SEQUENCE STARS FOR SUBMILLIMETER EMISSION
E. K. Holmes1
Jet Propulsion Laboratory, MS 169-506, California Institute of Technology, 4800 OakGrove Drive, Pasadena, CA 91109;[email protected]
H.M. Butner
Submillimeter Telescope Observatory, Steward Observatory, University of Arizona, Tucson, AZ 85721;[email protected]
and
S. B. Fajardo-Acosta and L. M. Rebull
SITF Science Center,MS 220-6, California Institute of Technology, 1200 East California Boulevard,Pasadena, CA 91125; [email protected], [email protected]
Received 2000 January 30; accepted 2003March 5
ABSTRACT
We searched for submillimeter emission around 10 Vega-type stars and one Herbig Ae star with thefour-color bolometer at 1300 lm and the 19 channel bolometer array at 870 lm using the Heinrich HertzTelescope at the Submillimeter Telescope Observatory. All of our sources were undetected at 870 lm. In thecase of HD 131156, we have a 3 � detection at 1300 lm. We report a flux of 6:25� 1:88 mJy for the HD131156 disk and a corresponding dust mass of 2:4� 0:7 lunar masses. However, we did not detect HD131156 at 870 lm, so we are cautious about the 1300 lm detection. We performed follow-up infraredobservations of HD 131156 using MIRLIN at the Palomar 200 inch telescope, which resolved bothcomponents of the binary. The data are photospheric, implying that the system does not have a hot, innerdust component.We report submillimeter upper limits on fluxes for the remaining systems.
The Infrared Astronomical Satellite (IRAS) detectedexcess far-infrared emission, at wavelengths of 60 and 100lm, from more than 15% of all nearby main-sequence A–Kstars, indicating the presence of circumstellar material(Backman & Paresce 1993; Elachi et al. 1996). Recentadvances in instrumentation have allowed detailed observa-tional maps to be made of a small fraction of these infrared-excess stars revealing disks of circumstellar material, termedplanetary debris disks, at both infrared (Koerner et al. 1998;Telesco et al. 2000) and submillimeter (Holland et al. 1998;Greaves et al. 1998) wavelengths. Some of these debris disksshow ringlike structures (� Eri) or other asymmetries (� Pic,Fomalhaut, Vega, and HR 4796).
There is a possible connection between the structure inevolved circumstellar disks and the presence of planets(Backman & Paresce 1993; Dermott et al. 1999b), with ourown inner planetary debris disk, the zodiacal cloud, being aproven example. Asymmetries in such a disk could be diag-nostic of planets that would otherwise be undetectable.Dynamical models of circumstellar disks have been made forthe purpose of linking asymmetric structures that arise inplanetary debris disks to the presence of planets in the sys-tems (Liou & Zook 1999; Holmes et al. 1999; Dermott et al.1999b). The models are based on the numerical integrationof asteroidal particles. The dynamical evolution of theseparticles is followed from source to sink with Poynting-Robertson light drag, solar wind drag, radiation pressure,and the effects of planetary gravitational perturbationsincluded. These unique modeling techniques, originallydeveloped to study the influence of the planets and the
Hirayama asteroid families (Dermott et al. 1999a) on thezodiacal cloud, have been extended to produce theoreticalexosolar system dust clouds from varying input parameters.
It is our ultimate goal to extend these infrared models intothe submillimeter regime (300 lmd�d1000 lm). The cooldust (T � 50 K) detected in the submillimeter regime lies far(30 AU to hundreds of AU) from the central star. This loca-tion is most analogous to the Kuiper belt in our solar system(Backman & Paresce 1993), which is home to an estimated�105 Kuiper belt objects (KBOs) with a diameter �100 kmlocated within 30–50 AU (Jewitt, Luu, & Trujillo 1998). Inthe asteroid belt, collisions between asteroids supply dustparticles to the zodiacal cloud, the Sun’s inner dust disk,which is visible at optical and infrared wavelengths. By com-parison, it has been postulated that collisions betweenKBOs could initiate a collisional cascade producing aKuiper dust disk, which would be the second brightestfeature of the solar system from an exosolar perspective(Landgraf et al. 2002). From a modeling perspective, far-infrared and submillimeter observations are very interestingbecause they can be compared with the Kuiper disk.
Submillimeter observational maps of planetary debrisdisks have been limited to a small number of systems: � Pic,Vega, Fomalhaut (Holland et al. 1998), and � Eri (Greaveset al. 1998). IRAS detected very strong far-infrared excessesfrom all of these nearby main-sequence stars (Gillett 1986;Backman & Paresce 1993) and also resolved them spatially(Backman & Paresce 1993; Aumann & Good 1990). As aresult, these four stars have been studied extensively at anumber of different wavelengths. However, from a statisti-cal standpoint, we need more detections—and ultimatelymaps—to claim a broad knowledge of debris disks as awhole, especially considering that upward of 15% of allmain-sequence A–K stars have detectable infrared excesses.1 National Research Council Resident ResearchAssociate.
The Astronomical Journal, 125:3334–3343, 2003 June
# 2003. The American Astronomical Society. All rights reserved. Printed in U.S.A.
3334
We embarked on a submillimeter survey of debris diskcandidates—a small selection of nearby (�50 pc) main-sequence stars, which are shown in Table 1. From our sur-vey, we obtain upper limits on the fluxes and limits on thedust masses for our candidate stars. These limits allow us toconstrain the spectral energy distributions (SEDs) of thestars at 870 and 1300 lm, which will prove useful to upcom-ing missions such as the Space Infrared Telescope Facility(SIRTF). SIRTF will observe in the infrared with unprece-dented sensitivity, but the longest wavelength at which itwill observe is 160 lm. It is therefore important to supple-ment SIRTF observations with ground-based observationsof the same set of candidate stars at wavelengths longer than160 lm.
All of our sources were undetected at 870 lm, and all butone were undetected at 1300 lm. In the case of our one 1300lm detection, HD 131156 (� Boo A or HR 5544), we have a3 � detection and we report a flux of 6:25� 1:88 mJy. Fromthis flux, we derive a dust mass of 2:4� 0:7 lunar masses forthe system. However, since we did not have a correspondingdetection at 870 lm using the 19 channel bolometer, whichis more sensitive than the four-color bolometer with whichthe 1300 lm observations were taken, we are cautious aboutthe 1300 lmdetection.
2. SUBMILLIMETER OBSERVATIONS
We observed a total of 11 stars at the 10 mHeinrich HertzTelescope of the Submillimeter Telescope Observatory(SMTO) located on Mount Graham in Arizona. Wesearched for submillimeter flux around our candidate starswith the four-color bolometer on 1999 March 19–24 and1999 December 9–13 at 1300 lm. We completed our surveyon 2000 December 14–16 using the 19 channel bolometerarray at 870 lm.
In 1999 March 19–24 and December 9–13, we used thefour-color bolometer facility instrument, with central wave-lengths at 1300, 870, 450, and 350 lm and a bandwidth ofapproximately 50 GHz. The half-power beam width at 1300lm is approximately 3500, which is slightly larger than thediffraction limit of 3300. We made approximately 10 pointingobservations per night, to achieve an absolute pointingaccuracy of 200–300. Continuum on/offmeasurements of eachsource were made with a beam throw of �10000 in azimuthduring the March observing run and a beam throw of �6000
in 1999 December. Each continuum scan was composed of10 subscans, having on- and off-source scans of 30 s each.Total on-source integration times are listed in Table 2. Thescans were calibrated using continuum on/off measure-ments on Venus, Mars, Saturn, and Uranus as well asknown secondary submillimeter calibrators: K3-50,W3(OH), NGC 7538 IRS 1, G45.1, and CRL 618 (Sandell1994). Observations of standards during the spring of 1997found the 1300 lm noise-equivalent flux density (NEFD)equal to 0.6–0.8 Jy s�1/2. We observed 10 Vega-type starsand one Herbig Ae star, HD 37357 (see Table 2).
On 2000 December 14–16, we used the newly installed 19channel bolometer array, developed at the Max-Planck-Institut fur Radioastronomie, Bonn, to observe eight Vega-type stars and one Herbig Ae star (see Table 2). The arrayconsists of 19 individual broadband continuum receivers,each with a central wavelength of 0.87 mm (345 GHz).Eighteen of the channels form two concentric hexagonsaround the central channel. The NEFD level for the array isapproximately 0.6 Jy s�1/2. Continuum on/offmeasurementsof each source were made with a beam throw of �5000 in azi-muth. Each continuum scan was composed of 20 subscans,having on- and off-source scans of 10 s each. Total on-sourceintegration times are listed in Table 2. The scans were cali-brated using continuum on/off measurements of Venus,Mars, and Saturn as well as known secondary submillimeter
TABLE 1
Sources Observed at the Submillimeter Telescope Observatory
Star Name
R.A.
(J2000.0)
Decl.
(J2000.0)
Distance
(pc) Spectral Type mV
HD 10700 ................. � Cet 01 44 09.99 �15 56 57.9 3.65 G8 V 3.50
HD 165341................ 18 05 26.36 +02 30 52.9 5.09 K0 V 4.03
HD 185144................ �Dra 19 32 15.59 +69 41 09.6 5.77 K0 V 4.67
HD 4614a .................. �Cas A 00 48 59.07 +57 49 23.7 5.95 G3 V (K7 V) 3.46 (7.51)
HD 131156a .............. � BooA 14 51 22.73 +19 06 08.9 6.70 G8 V (K4 V) 4.53 (6.82)
HD 32923 ................. 05 07 25.07 +18 38 41.1 15.9 G4 V 4.92
HD 192425................ �Aql 20 14 16.34 +15 11 48.2 47.1 A2 V 4.95
HD 82189 ................. 22 UMa 09 34 52.70 +72 12 23.9 49.9 F7 V 5.77
HD 37357a ................ 05 37 46.96 �06 42 30.2 �480 A0 Ve 6.05b
HD 39415 ................. 05 54 41.54 +44 30 08.0 F5 V 8.41
HD 102647................ � Leo 11 49 05.26 14 34 25.16 11.1 A3 V 2.13
Note.—Units of right ascension are hours, minutes, and seconds, and units of declination are degrees, arcminutes,and arcseconds. The sources were selected from the SIRTF Science Requirements Document in Simmons &Werner1997 and from Oudmaijer et al. 1992. The distances in the table were derived from the Hipparcos Catalog of ESA1997 for all sources except for HD 37357.Hipparcos parallaxes have an error of about 0.8 mas for a typical star at 20pc. HD 37357 is a Herbig Ae star in a double or multiple system located in Lynds 1641, the nearest giant molecularcloud at a distance of 480 pc, as in Strom et al. 1989. Spectral types were obtained from SIMBAD except for HD4614 and HD 131156, where they were obtained from Fernandes et al. 1998. The spectral types in parentheses arethose of the companion stars. Visual magnitudes were obtained fromHipparcos for all of the sources for which datawere available. For the five stars (HD 10700, HD 165341, HD 4614 B, HD 37357, and HD 39415) with noHipparcosvisual magnitude,mV was obtained from SIMBAD.
a Binary or multiple.b Corrected for extinction withAV ¼ 2:8; see Strom et al. 1989.
SUBMILLIMETER SURVEY OF NEARBY STARS 3335
calibrators: K3-50, W3(OH), W75N, and G45.1 (Sandell1994). Additional observations of HD 131156 taken atPalomar in the mid-infrared are discussed in x 5.
2.1. Selection Criteria
We selected our stars from two sources: the SIRTF ScienceRequirements Document (SRD) (Simmons & Werner 1997)and a list of Smithsonian Astrophysical Observatory (SAO)stars having infrared excesses in the IRAS Point Source Cata-log compiled by Oudmaijer et al. (1992). Five of our candi-date stars are listed in the SIRTF SRD as candidate stars forpossessing planetary debris disks: HD 10700 (� Cet), HD165341, HD 185144 (� Dra), HD 4614 (� Cas A), and HD131156 (� Boo A) (Simmons & Werner 1997). These are fiveof the closest stars (located within 6.8 pc) with spectral typesbetween G0 V and K0 V and luminosities similar to solar(0:37 L� < L < 1:24 L�). Aumann & Good (1990) foundstatistical evidence that the typical G dwarf in the solar neigh-borhood has a weak 100 lm excess, perhaps from coldcircumstellar dust. Studying nearby stars (d � 10 pc) isadvantageous since it increases the probability of a sub-millimeter detection for systems possessing a small amountof dust. It allows tight limits on dust mass to be placed on anynondetections since the dust mass is proportional to thesquare of the frequently uncertain distance.
The remaining candidate stars, HD 102647 (� Leo), HD192425 (� Aql), HD 82189 (22 UMa), HD 32932, HD37357, and HD 39415, were acquired from a list of SAOstars having infrared excesses in the IRAS Point Source Cat-alog compiled by Oudmaijer et al. (1992). The color criteriaused for determining that a star had an infrared excess were½12� � ½25� > 0:4 or ½25� � ½60� > 0:3. We selected oursources from this list using the additional criteria that thestars were of spectral types A–K and on the main sequence.Out of the 462 stars in the Oudmaijer et al. (1992) list,approximately 12% met our criteria. Out of those stars, weultimately observed only six due to the observability of thesources, the elimination of sources that had already beenstudied extensively in the submillimeter (e.g., Vega andFomalhaut) as well as any sources showing evidence ofemission lines (e.g., Herbig Ae/Be stars), and time
constraints. Although not listed in Oudmaijer et al. (1992)as a Herbig Ae/Be star, HD 37357 has been identified as aHerbig Ae star with spectral type A0 Ve (The, de Winter, &Perez 1994); we have retained it in our source list for com-parison purposes. Additionally, � Leo had been observedpreviously in the submillimeter (Weintraub & Stern 1994) tohave a 3 � upper limit of 21.3 mJy at 1300 lm. We appliedthe Oudmaijer et al. (1992) color-magnitude criterion to ourSIRTF SRD sources and found that HD 10700 alsopossesses an infrared excess.
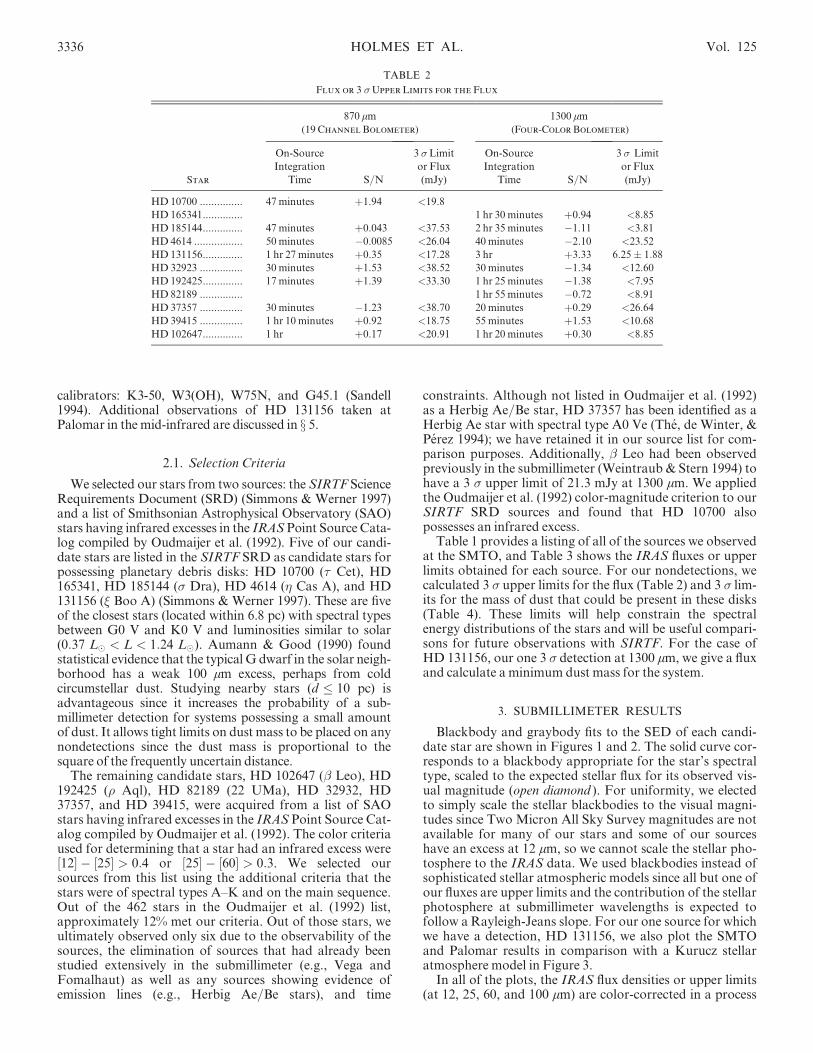
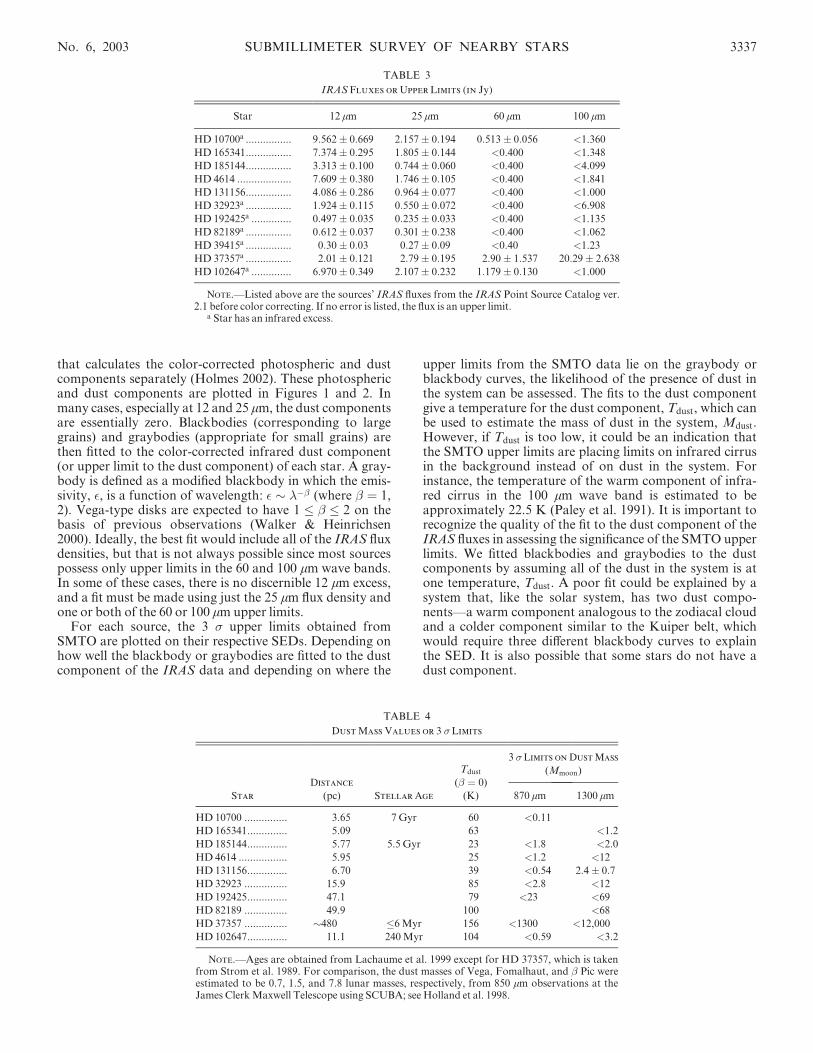
Table 1 provides a listing of all of the sources we observedat the SMTO, and Table 3 shows the IRAS fluxes or upperlimits obtained for each source. For our nondetections, wecalculated 3 � upper limits for the flux (Table 2) and 3 � lim-its for the mass of dust that could be present in these disks(Table 4). These limits will help constrain the spectralenergy distributions of the stars and will be useful compari-sons for future observations with SIRTF. For the case ofHD 131156, our one 3 � detection at 1300 lm, we give a fluxand calculate a minimum dust mass for the system.
3. SUBMILLIMETER RESULTS
Blackbody and graybody fits to the SED of each candi-date star are shown in Figures 1 and 2. The solid curve cor-responds to a blackbody appropriate for the star’s spectraltype, scaled to the expected stellar flux for its observed vis-ual magnitude (open diamond ). For uniformity, we electedto simply scale the stellar blackbodies to the visual magni-tudes since Two Micron All Sky Survey magnitudes are notavailable for many of our stars and some of our sourceshave an excess at 12 lm, so we cannot scale the stellar pho-tosphere to the IRAS data. We used blackbodies instead ofsophisticated stellar atmospheric models since all but one ofour fluxes are upper limits and the contribution of the stellarphotosphere at submillimeter wavelengths is expected tofollow a Rayleigh-Jeans slope. For our one source for whichwe have a detection, HD 131156, we also plot the SMTOand Palomar results in comparison with a Kurucz stellaratmosphere model in Figure 3.
In all of the plots, the IRAS flux densities or upper limits(at 12, 25, 60, and 100 lm) are color-corrected in a process
TABLE 2
Flux or 3 �Upper Limits for the Flux
870 lm
(19 Channel Bolometer)
1300 lm
(Four-Color Bolometer)
Star
On-Source
Integration
Time S/N
3 �Limit
or Flux
(mJy)
On-Source
Integration
Time S/N
3 � Limit
or Flux
(mJy)
HD 10700 ............... 47 minutes +1.94 <19.8
HD 165341.............. 1 hr 30 minutes +0.94 <8.85
that calculates the color-corrected photospheric and dustcomponents separately (Holmes 2002). These photosphericand dust components are plotted in Figures 1 and 2. Inmany cases, especially at 12 and 25 lm, the dust componentsare essentially zero. Blackbodies (corresponding to largegrains) and graybodies (appropriate for small grains) arethen fitted to the color-corrected infrared dust component(or upper limit to the dust component) of each star. A gray-body is defined as a modified blackbody in which the emis-sivity, �, is a function of wavelength: � � ��� (where � ¼ 1,2). Vega-type disks are expected to have 1 � � � 2 on thebasis of previous observations (Walker & Heinrichsen2000). Ideally, the best fit would include all of the IRAS fluxdensities, but that is not always possible since most sourcespossess only upper limits in the 60 and 100 lm wave bands.In some of these cases, there is no discernible 12 lm excess,and a fit must be made using just the 25 lm flux density andone or both of the 60 or 100 lmupper limits.
For each source, the 3 � upper limits obtained fromSMTO are plotted on their respective SEDs. Depending onhow well the blackbody or graybodies are fitted to the dustcomponent of the IRAS data and depending on where the
upper limits from the SMTO data lie on the graybody orblackbody curves, the likelihood of the presence of dust inthe system can be assessed. The fits to the dust componentgive a temperature for the dust component, Tdust, which canbe used to estimate the mass of dust in the system, Mdust.However, if Tdust is too low, it could be an indication thatthe SMTO upper limits are placing limits on infrared cirrusin the background instead of on dust in the system. Forinstance, the temperature of the warm component of infra-red cirrus in the 100 lm wave band is estimated to beapproximately 22.5 K (Paley et al. 1991). It is important torecognize the quality of the fit to the dust component of theIRAS fluxes in assessing the significance of the SMTO upperlimits. We fitted blackbodies and graybodies to the dustcomponents by assuming all of the dust in the system is atone temperature, Tdust. A poor fit could be explained by asystem that, like the solar system, has two dust compo-nents—a warm component analogous to the zodiacal cloudand a colder component similar to the Kuiper belt, whichwould require three different blackbody curves to explainthe SED. It is also possible that some stars do not have adust component.
TABLE 4
Dust Mass Values or 3 � Limits
3 � Limits on DustMass
(Mmoon)
Star
Distance
(pc) Stellar Age
Tdust
(� ¼ 0)
(K) 870 lm 1300 lm
HD 10700 ............... 3.65 7 Gyr 60 <0.11
HD 165341.............. 5.09 63 <1.2
HD 185144.............. 5.77 5.5 Gyr 23 <1.8 <2.0
HD 4614 ................. 5.95 25 <1.2 <12
HD 131156.............. 6.70 39 <0.54 2:4� 0:7
HD 32923 ............... 15.9 85 <2.8 <12
HD 192425.............. 47.1 79 <23 <69
HD 82189 ............... 49.9 100 <68
HD 37357 ............... �480 �6Myr 156 <1300 <12,000
HD 102647.............. 11.1 240Myr 104 <0.59 <3.2
Note.—Ages are obtained from Lachaume et al. 1999 except for HD 37357, which is takenfrom Strom et al. 1989. For comparison, the dust masses of Vega, Fomalhaut, and � Pic wereestimated to be 0.7, 1.5, and 7.8 lunar masses, respectively, from 850 lm observations at theJames ClerkMaxwell Telescope using SCUBA; see Holland et al. 1998.
TABLE 3
IRAS Fluxes or Upper Limits (in Jy)
Star 12 lm 25 lm 60 lm 100 lm
HD 10700a ................ 9:562� 0:669 2:157� 0:194 0:513� 0:056 <1.360
HD 165341................ 7:374� 0:295 1:805� 0:144 <0.400 <1.348
HD 185144................ 3:313� 0:100 0:744� 0:060 <0.400 <4.099
HD 4614 ................... 7:609� 0:380 1:746� 0:105 <0.400 <1.841
HD 131156................ 4:086� 0:286 0:964� 0:077 <0.400 <1.000
HD 32923a ................ 1:924� 0:115 0:550� 0:072 <0.400 <6.908
HD 192425a .............. 0:497� 0:035 0:235� 0:033 <0.400 <1.135
HD 82189a ................ 0:612� 0:037 0:301� 0:238 <0.400 <1.062
HD 39415a ................ 0:30� 0:03 0:27� 0:09 <0.40 <1.23
HD 102647a .............. 6:970� 0:349 2:107� 0:232 1:179� 0:130 <1.000
Note.—Listed above are the sources’ IRAS fluxes from the IRAS Point Source Catalog ver.2.1 before color correcting. If no error is listed, the flux is an upper limit.
a Star has an infrared excess.
No. 6, 2003 SUBMILLIMETER SURVEY OF NEARBY STARS 3337
Fig. 1a Fig. 1b
Fig. 1c Fig. 1d
Fig. 1e Fig. 1f
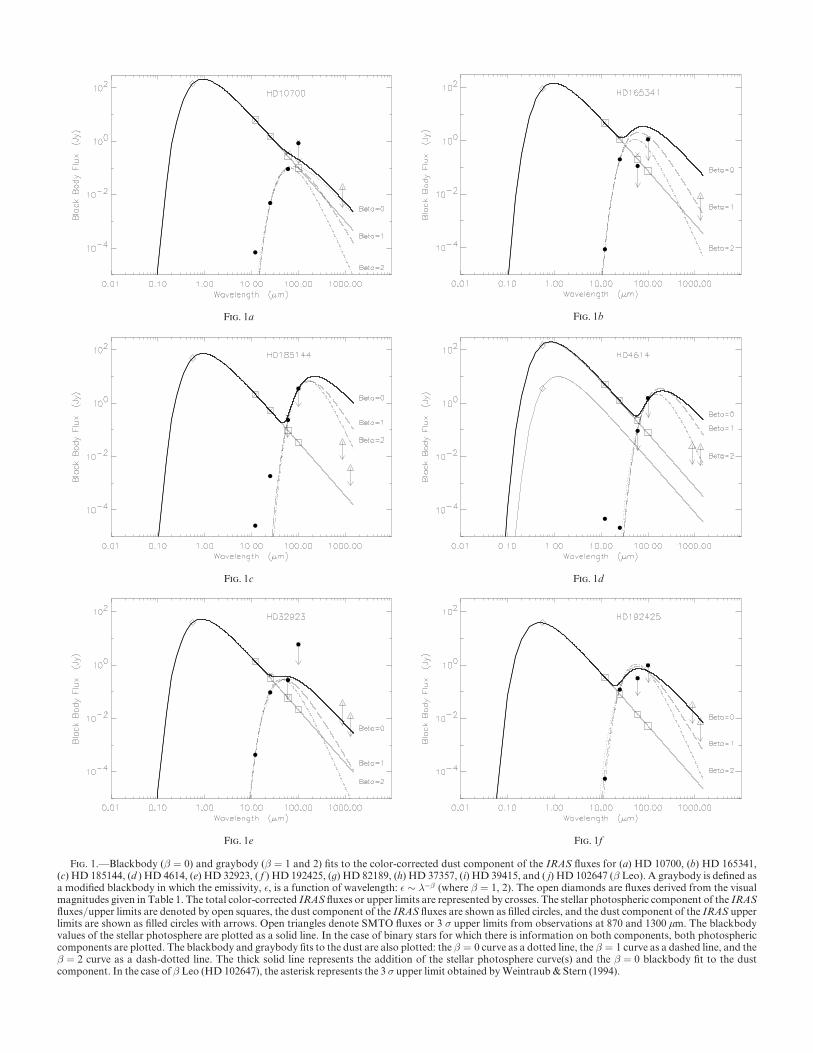
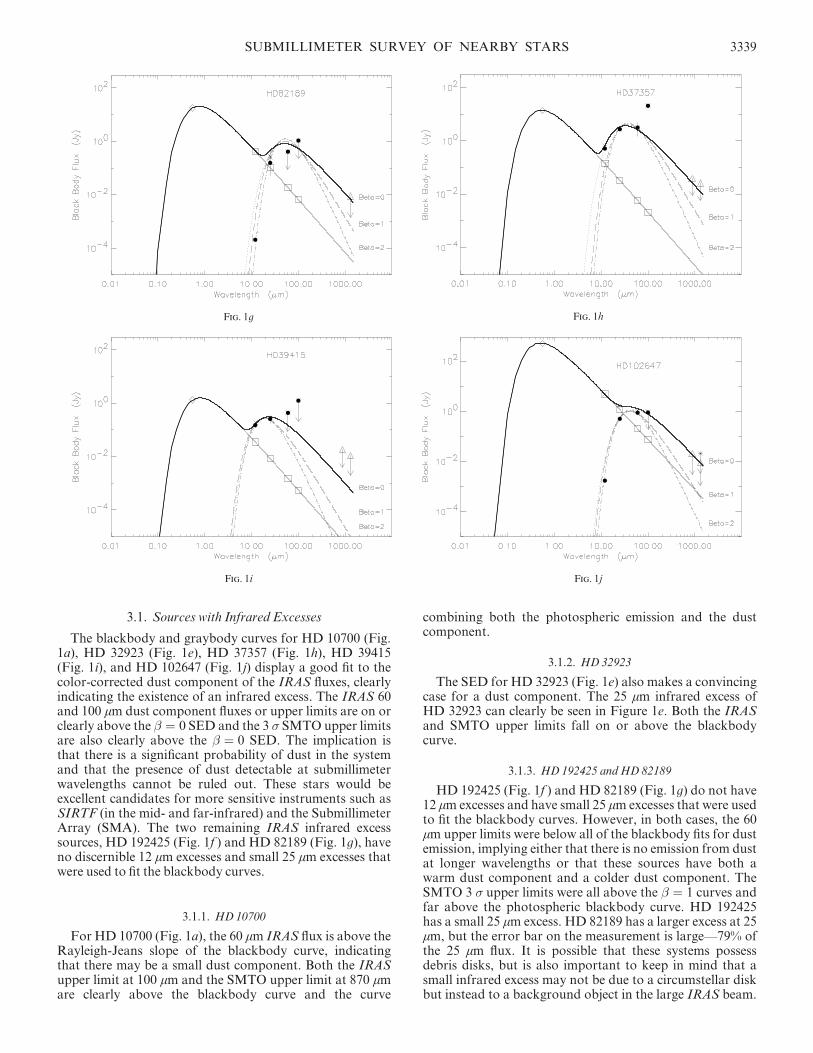
Fig. 1.—Blackbody (� ¼ 0) and graybody (� ¼ 1 and 2) fits to the color-corrected dust component of the IRAS fluxes for (a) HD 10700, (b) HD 165341,(c) HD 185144, (d ) HD 4614, (e) HD 32923, ( f ) HD 192425, (g) HD 82189, (h) HD 37357, (i) HD 39415, and ( j) HD 102647 (� Leo). A graybody is defined asa modified blackbody in which the emissivity, �, is a function of wavelength: � � ��� (where � ¼ 1, 2). The open diamonds are fluxes derived from the visualmagnitudes given in Table 1. The total color-corrected IRAS fluxes or upper limits are represented by crosses. The stellar photospheric component of the IRASfluxes/upper limits are denoted by open squares, the dust component of the IRAS fluxes are shown as filled circles, and the dust component of the IRAS upperlimits are shown as filled circles with arrows. Open triangles denote SMTO fluxes or 3 � upper limits from observations at 870 and 1300 lm. The blackbodyvalues of the stellar photosphere are plotted as a solid line. In the case of binary stars for which there is information on both components, both photosphericcomponents are plotted. The blackbody and graybody fits to the dust are also plotted: the � ¼ 0 curve as a dotted line, the � ¼ 1 curve as a dashed line, and the� ¼ 2 curve as a dash-dotted line. The thick solid line represents the addition of the stellar photosphere curve(s) and the � ¼ 0 blackbody fit to the dustcomponent. In the case of � Leo (HD 102647), the asterisk represents the 3 � upper limit obtained byWeintraub & Stern (1994).
3.1. Sources with Infrared Excesses
The blackbody and graybody curves for HD 10700 (Fig.1a), HD 32923 (Fig. 1e), HD 37357 (Fig. 1h), HD 39415(Fig. 1i), and HD 102647 (Fig. 1j) display a good fit to thecolor-corrected dust component of the IRAS fluxes, clearlyindicating the existence of an infrared excess. The IRAS 60and 100 lm dust component fluxes or upper limits are on orclearly above the � ¼ 0 SED and the 3 � SMTO upper limitsare also clearly above the � ¼ 0 SED. The implication isthat there is a significant probability of dust in the systemand that the presence of dust detectable at submillimeterwavelengths cannot be ruled out. These stars would beexcellent candidates for more sensitive instruments such asSIRTF (in the mid- and far-infrared) and the SubmillimeterArray (SMA). The two remaining IRAS infrared excesssources, HD 192425 (Fig. 1f ) and HD 82189 (Fig. 1g), haveno discernible 12 lm excesses and small 25 lm excesses thatwere used to fit the blackbody curves.
3.1.1. HD 10700
For HD 10700 (Fig. 1a), the 60 lm IRAS flux is above theRayleigh-Jeans slope of the blackbody curve, indicatingthat there may be a small dust component. Both the IRASupper limit at 100 lm and the SMTO upper limit at 870 lmare clearly above the blackbody curve and the curve
combining both the photospheric emission and the dustcomponent.
3.1.2. HD 32923
The SED for HD 32923 (Fig. 1e) also makes a convincingcase for a dust component. The 25 lm infrared excess ofHD 32923 can clearly be seen in Figure 1e. Both the IRASand SMTO upper limits fall on or above the blackbodycurve.
3.1.3. HD 192425 and HD 82189
HD 192425 (Fig. 1f ) and HD 82189 (Fig. 1g) do not have12 lm excesses and have small 25 lm excesses that were usedto fit the blackbody curves. However, in both cases, the 60lm upper limits were below all of the blackbody fits for dustemission, implying either that there is no emission from dustat longer wavelengths or that these sources have both awarm dust component and a colder dust component. TheSMTO 3 � upper limits were all above the � ¼ 1 curves andfar above the photospheric blackbody curve. HD 192425has a small 25 lm excess. HD 82189 has a larger excess at 25lm, but the error bar on the measurement is large—79% ofthe 25 lm flux. It is possible that these systems possessdebris disks, but is also important to keep in mind that asmall infrared excess may not be due to a circumstellar diskbut instead to a background object in the large IRAS beam.
Fig. 1g Fig. 1h
Fig. 1i Fig. 1j
SUBMILLIMETER SURVEY OF NEARBY STARS 3339
Overall, we consider the blackbody and graybody curves tobe a fair fit to the IRAS data.
3.1.4. HD 37357
HD 37357 (Fig. 1h) is different from the other main-sequence stars on our list because it has been identified as aHerbig Ae star with spectral type A0 Ve (The et al. 1994).Strom et al. (1989) classified HD 37357 as a class II source,meaning the slope of the SED is intermediate between ablackbody and a flat spectrum. The star is associated withthe Lynds 1641 dark cloud, which is the nearest giant molec-ular cloud at a distance of 480 pc. TheAV for HD 37357 wasfound to be 2.8 (Strom et al. 1989), yielding a visual magni-tude corrected for extinction, mV , of 6.05. HD 37357 wasdetected at all four IRAS wave bands, and the detectionsindicate that the star possesses a large circumstellar dustdisk. The IRAS flux qualities for the 12 and 25 lm fluxeswere 3, or ‘‘ good,’’ and the 60 and 100 lm flux qualitieswere 2, or ‘‘moderate.’’ In general, we tried to fit to the long-er wavelengths preferentially, but since Strom et al. (1989)noted that the 100 lm flux was hard to measure, we decidedto exclude the 100 lm flux from our fit to the HD 37357data. The SMTO 3 � upper limits fall on the blackbodycurve.
3.1.5. HD 39415
HD 39415 (Fig. 1i) clearly has an infrared excess at both12 and 25 lm, and the upper limits for both IRAS andSMTO are above the blackbody curve. The on-source inte-gration time for both SMTO wave bands was approxi-mately an hour, but we were still unable to either detect anysubmillimeter emission or get an upper limit down to thestellar photosphere. With SIRTF’s anticipated sensitivity,this star would make an excellent candidate for MIPSobservations at 70 and 160 lm.
3.1.6. HD 102647 (� Leo)
� Leo (Fig. 1j) has an infrared excess at 25 and 60 lm,and the 100 lm IRAS upper limit and the SMTO upper
limits all lie on the � ¼ 0 curve. We compare our 3 � upperlimit at 1300 lm for � Leo with the 3 � upper limit obtainedbyWeintraub & Stern (1994), which is represented in Figure1j as an asterisk. We find that our upper limit is more than afactor of 2 lower than that obtained by Weintraub & Stern(1994).
3.2. Other Sources
The remaining four sources (HD 165341, HD 185144,HD 4614, and HD 131156) are not listed in Oudmaijer et al.(1992) as IRAS excess sources, although from our color-correcting process, it is possible that HD 165341 may have amarginal 25 lm excess.
3.2.1. HD 131156
The SED of HD 131156 (Fig. 2) is the most interestingbecause of our 3 � detection at 1300 lm. This binary systemis composed of stars with spectral types of G8 V and K4 V(Fernandes et al. 1998) and masses of 0.85 and 0.72 M�.They are separated by approximately 700 and have a periodof 151 yr (Gray et al. 1996 and references therein). Theirsmall angular separation is much less than the SMTO beamsize for both wavelengths. The 60 lm IRAS upper limit,although above the stellar photospheres, falls slightly belowthe � ¼ 0 blackbody curve. However, this could simplymean that the dust component is best fitted not with a singletemperature but with a warm inner disk and a cold outerdisk, or with only a cold outer disk. Both the 3 � upper limitat 870 lm and the 3 � detection at 1300 lm lie above the� ¼ 1 blackbody curve and well above the stellar photo-sphere. Infrared observations of this source taken atPalomar withMIRLIN are discussed in x 5.
3.2.2. HD 165341
Overall, the fit to the IRAS data and upper limits for HD165341 (Fig. 1b) is poor, but the fact that our color-correction process has yielded a small 25 lm excess supportsthe existence of a dust component. However, the total IRAS60 lm upper limit is only marginally above the blackbodycurve for the stellar photosphere, which may mean thatthere is no cold dust component or the amount of cold dustis very small. The SMTO 3 � upper limit for HD 165341 islow, above the � ¼ 1 curve, but not much greater than thestellar photosphere curve, making this source a poorcandidate for possessing a large cold dust component.
3.2.3. HD 185144
The fits to the dust component of the IRAS 60 and 100lmupper limits for HD 185144 (Fig. 1c) is reasonably good,although it could merely be due to a spuriously high 100 lmupper limit since there is no excess emission at 12 or 25 lm.However, the 3 � SMTO upper limits are both below the� ¼ 2 curve, which makes a cold dust component veryunlikely if it has the same temperature as dust at 60 and100 lm. We also note that Tdust is 23 K, which is lower thanone would expect for a typical dust component.
3.2.4. HD 4614
In the case of the spectroscopic binary HD 4614 (Fig. 1d),there is no 12 or 25 lm excess, and the total IRAS 60 lmupper limit is only marginally above the blackbody curvefor the stellar photosphere. The 12 and 25 lm fluxes, as wellas the 60 lm upper limit, are nearly coincident with the
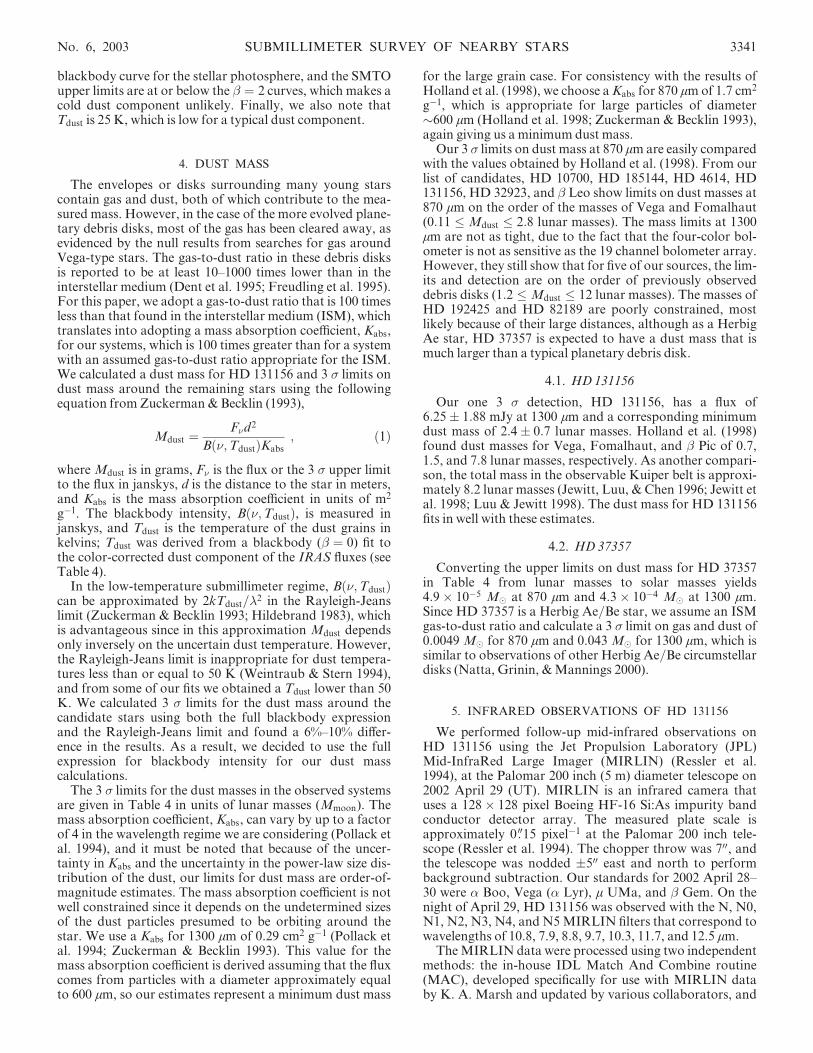
Fig. 2.—Blackbody (� ¼ 0) and graybody (� ¼ 1 and 2) fits to the dustcomponent of the color-corrected IRAS fluxes and upper limits for HD131156. The symbols are the same as in Fig. 1. Our one 3 � detection(S=N ¼ 3:33), HD 131156, has a mean flux of 6:25� 1:88 mJy and a corre-sponding dust mass of 2:4� 0:7 lunar masses. For comparison, the totalmass in the observableKuiper belt is of order 0.1 Earthmasses, correspond-ing to approximately 8.2 lunar masses (Jewitt, Luu, & Chen 1996; Jewittet al. 1998; Luu & Jewitt 1998).
3340 HOLMES ET AL. Vol. 125
blackbody curve for the stellar photosphere, and the SMTOupper limits are at or below the � ¼ 2 curves, which makes acold dust component unlikely. Finally, we also note thatTdust is 25 K, which is low for a typical dust component.
4. DUST MASS
The envelopes or disks surrounding many young starscontain gas and dust, both of which contribute to the mea-sured mass. However, in the case of the more evolved plane-tary debris disks, most of the gas has been cleared away, asevidenced by the null results from searches for gas aroundVega-type stars. The gas-to-dust ratio in these debris disksis reported to be at least 10–1000 times lower than in theinterstellar medium (Dent et al. 1995; Freudling et al. 1995).For this paper, we adopt a gas-to-dust ratio that is 100 timesless than that found in the interstellar medium (ISM), whichtranslates into adopting a mass absorption coefficient, Kabs,for our systems, which is 100 times greater than for a systemwith an assumed gas-to-dust ratio appropriate for the ISM.We calculated a dust mass for HD 131156 and 3 � limits ondust mass around the remaining stars using the followingequation from Zuckerman & Becklin (1993),
Mdust ¼Fd2
Bð;TdustÞKabs; ð1Þ
where Mdust is in grams, F is the flux or the 3 � upper limitto the flux in janskys, d is the distance to the star in meters,and Kabs is the mass absorption coefficient in units of m2
g�1. The blackbody intensity, B ;Tdustð Þ, is measured injanskys, and Tdust is the temperature of the dust grains inkelvins; Tdust was derived from a blackbody (� ¼ 0) fit tothe color-corrected dust component of the IRAS fluxes (seeTable 4).
In the low-temperature submillimeter regime, Bð;TdustÞcan be approximated by 2kTdust=�2 in the Rayleigh-Jeanslimit (Zuckerman & Becklin 1993; Hildebrand 1983), whichis advantageous since in this approximation Mdust dependsonly inversely on the uncertain dust temperature. However,the Rayleigh-Jeans limit is inappropriate for dust tempera-tures less than or equal to 50 K (Weintraub & Stern 1994),and from some of our fits we obtained a Tdust lower than 50K. We calculated 3 � limits for the dust mass around thecandidate stars using both the full blackbody expressionand the Rayleigh-Jeans limit and found a 6%–10% differ-ence in the results. As a result, we decided to use the fullexpression for blackbody intensity for our dust masscalculations.
The 3 � limits for the dust masses in the observed systemsare given in Table 4 in units of lunar masses (Mmoon). Themass absorption coefficient, Kabs, can vary by up to a factorof 4 in the wavelength regime we are considering (Pollack etal. 1994), and it must be noted that because of the uncer-tainty in Kabs and the uncertainty in the power-law size dis-tribution of the dust, our limits for dust mass are order-of-magnitude estimates. The mass absorption coefficient is notwell constrained since it depends on the undetermined sizesof the dust particles presumed to be orbiting around thestar. We use a Kabs for 1300 lm of 0.29 cm2 g�1 (Pollack etal. 1994; Zuckerman & Becklin 1993). This value for themass absorption coefficient is derived assuming that the fluxcomes from particles with a diameter approximately equalto 600 lm, so our estimates represent a minimum dust mass
for the large grain case. For consistency with the results ofHolland et al. (1998), we choose aKabs for 870 lmof 1.7 cm2
g�1, which is appropriate for large particles of diameter�600 lm (Holland et al. 1998; Zuckerman & Becklin 1993),again giving us a minimum dust mass.
Our 3 � limits on dust mass at 870 lm are easily comparedwith the values obtained by Holland et al. (1998). From ourlist of candidates, HD 10700, HD 185144, HD 4614, HD131156, HD 32923, and � Leo show limits on dust masses at870 lm on the order of the masses of Vega and Fomalhaut(0:11 � Mdust � 2:8 lunar masses). The mass limits at 1300lm are not as tight, due to the fact that the four-color bol-ometer is not as sensitive as the 19 channel bolometer array.However, they still show that for five of our sources, the lim-its and detection are on the order of previously observeddebris disks (1:2 � Mdust � 12 lunar masses). The masses ofHD 192425 and HD 82189 are poorly constrained, mostlikely because of their large distances, although as a HerbigAe star, HD 37357 is expected to have a dust mass that ismuch larger than a typical planetary debris disk.
4.1. HD 131156
Our one 3 � detection, HD 131156, has a flux of6:25� 1:88 mJy at 1300 lm and a corresponding minimumdust mass of 2:4� 0:7 lunar masses. Holland et al. (1998)found dust masses for Vega, Fomalhaut, and � Pic of 0.7,1.5, and 7.8 lunar masses, respectively. As another compari-son, the total mass in the observable Kuiper belt is approxi-mately 8.2 lunar masses (Jewitt, Luu, & Chen 1996; Jewitt etal. 1998; Luu & Jewitt 1998). The dust mass for HD 131156fits in well with these estimates.
4.2. HD 37357
Converting the upper limits on dust mass for HD 37357in Table 4 from lunar masses to solar masses yields4:9� 10�5 M� at 870 lm and 4:3� 10�4 M� at 1300 lm.Since HD 37357 is a Herbig Ae/Be star, we assume an ISMgas-to-dust ratio and calculate a 3 � limit on gas and dust of0.0049 M� for 870 lm and 0.043 M� for 1300 lm, which issimilar to observations of other Herbig Ae/Be circumstellardisks (Natta, Grinin, &Mannings 2000).
5. INFRARED OBSERVATIONS OF HD 131156
We performed follow-up mid-infrared observations onHD 131156 using the Jet Propulsion Laboratory (JPL)Mid-InfraRed Large Imager (MIRLIN) (Ressler et al.1994), at the Palomar 200 inch (5 m) diameter telescope on2002 April 29 (UT). MIRLIN is an infrared camera thatuses a 128� 128 pixel Boeing HF-16 Si:As impurity bandconductor detector array. The measured plate scale isapproximately 0>15 pixel�1 at the Palomar 200 inch tele-scope (Ressler et al. 1994). The chopper throw was 700, andthe telescope was nodded �500 east and north to performbackground subtraction. Our standards for 2002 April 28–30 were Boo, Vega ( Lyr), l UMa, and � Gem. On thenight of April 29, HD 131156 was observed with the N, N0,N1, N2, N3, N4, and N5MIRLIN filters that correspond towavelengths of 10.8, 7.9, 8.8, 9.7, 10.3, 11.7, and 12.5 lm.
TheMIRLIN data were processed using two independentmethods: the in-house IDL Match And Combine routine(MAC), developed specifically for use with MIRLIN databy K. A. Marsh and updated by various collaborators, and
No. 6, 2003 SUBMILLIMETER SURVEY OF NEARBY STARS 3341
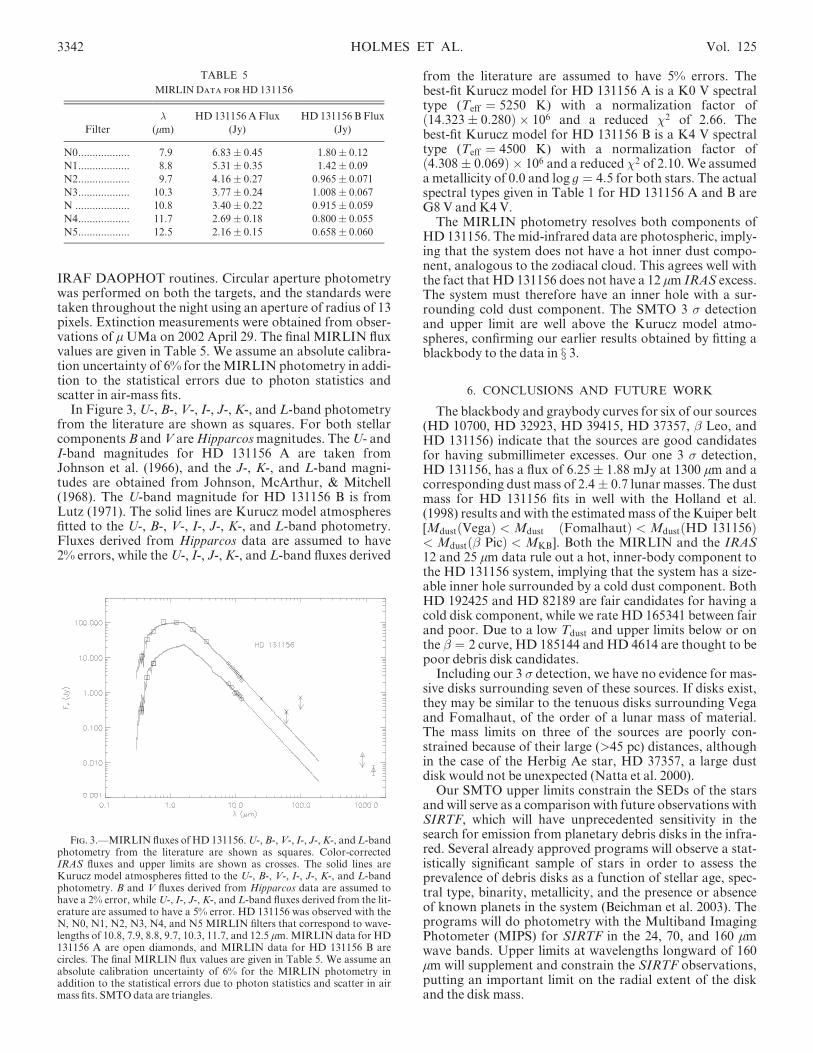
IRAF DAOPHOT routines. Circular aperture photometrywas performed on both the targets, and the standards weretaken throughout the night using an aperture of radius of 13pixels. Extinction measurements were obtained from obser-vations of lUMa on 2002 April 29. The final MIRLIN fluxvalues are given in Table 5. We assume an absolute calibra-tion uncertainty of 6% for theMIRLIN photometry in addi-tion to the statistical errors due to photon statistics andscatter in air-mass fits.
In Figure 3,U-, B-, V-, I-, J-, K-, and L-band photometryfrom the literature are shown as squares. For both stellarcomponents B andV areHipparcosmagnitudes. TheU- andI-band magnitudes for HD 131156 A are taken fromJohnson et al. (1966), and the J-, K-, and L-band magni-tudes are obtained from Johnson, McArthur, & Mitchell(1968). The U-band magnitude for HD 131156 B is fromLutz (1971). The solid lines are Kurucz model atmospheresfitted to the U-, B-, V-, I-, J-, K-, and L-band photometry.Fluxes derived from Hipparcos data are assumed to have2% errors, while theU-, I-, J-, K-, and L-band fluxes derived
from the literature are assumed to have 5% errors. Thebest-fit Kurucz model for HD 131156 A is a K0 V spectraltype (Teff ¼ 5250 K) with a normalization factor ofð14:323� 0:280Þ � 106 and a reduced �2 of 2.66. Thebest-fit Kurucz model for HD 131156 B is a K4 V spectraltype (Teff ¼ 4500 K) with a normalization factor ofð4:308� 0:069Þ � 106 and a reduced �2 of 2.10.We assumeda metallicity of 0.0 and log g ¼ 4:5 for both stars. The actualspectral types given in Table 1 for HD 131156 A and B areG8 V andK4 V.
The MIRLIN photometry resolves both components ofHD 131156. The mid-infrared data are photospheric, imply-ing that the system does not have a hot inner dust compo-nent, analogous to the zodiacal cloud. This agrees well withthe fact that HD 131156 does not have a 12 lm IRAS excess.The system must therefore have an inner hole with a sur-rounding cold dust component. The SMTO 3 � detectionand upper limit are well above the Kurucz model atmo-spheres, confirming our earlier results obtained by fitting ablackbody to the data in x 3.
6. CONCLUSIONS AND FUTURE WORK
The blackbody and graybody curves for six of our sources(HD 10700, HD 32923, HD 39415, HD 37357, � Leo, andHD 131156) indicate that the sources are good candidatesfor having submillimeter excesses. Our one 3 � detection,HD 131156, has a flux of 6:25� 1:88 mJy at 1300 lm and acorresponding dust mass of 2:4� 0:7 lunar masses. The dustmass for HD 131156 fits in well with the Holland et al.(1998) results and with the estimatedmass of the Kuiper belt[MdustðVegaÞ < Mdust ðFomalhautÞ < MdustðHD 131156Þ< Mdustð� PicÞ < MKB]. Both the MIRLIN and the IRAS12 and 25 lm data rule out a hot, inner-body component tothe HD 131156 system, implying that the system has a size-able inner hole surrounded by a cold dust component. BothHD 192425 and HD 82189 are fair candidates for having acold disk component, while we rate HD 165341 between fairand poor. Due to a low Tdust and upper limits below or onthe � ¼ 2 curve, HD 185144 and HD 4614 are thought to bepoor debris disk candidates.
Including our 3 � detection, we have no evidence for mas-sive disks surrounding seven of these sources. If disks exist,they may be similar to the tenuous disks surrounding Vegaand Fomalhaut, of the order of a lunar mass of material.The mass limits on three of the sources are poorly con-strained because of their large (>45 pc) distances, althoughin the case of the Herbig Ae star, HD 37357, a large dustdisk would not be unexpected (Natta et al. 2000).
Our SMTO upper limits constrain the SEDs of the starsand will serve as a comparison with future observations withSIRTF, which will have unprecedented sensitivity in thesearch for emission from planetary debris disks in the infra-red. Several already approved programs will observe a stat-istically significant sample of stars in order to assess theprevalence of debris disks as a function of stellar age, spec-tral type, binarity, metallicity, and the presence or absenceof known planets in the system (Beichman et al. 2003). Theprograms will do photometry with the Multiband ImagingPhotometer (MIPS) for SIRTF in the 24, 70, and 160 lmwave bands. Upper limits at wavelengths longward of 160lm will supplement and constrain the SIRTF observations,putting an important limit on the radial extent of the diskand the disk mass.
TABLE 5
MIRLIN Data for HD 131156
Filter
�
(lm)
HD 131156 A Flux
(Jy)
HD 131156 B Flux
(Jy)
N0.................. 7.9 6:83� 0:45 1:80� 0:12
N1.................. 8.8 5:31� 0:35 1:42� 0:09
N2.................. 9.7 4:16� 0:27 0:965� 0:071
N3.................. 10.3 3:77� 0:24 1:008� 0:067
N ................... 10.8 3:40� 0:22 0:915� 0:059
N4.................. 11.7 2:69� 0:18 0:800� 0:055
N5.................. 12.5 2:16� 0:15 0:658� 0:060
Fig. 3.—MIRLIN fluxes of HD 131156.U-,B-,V-, I-, J-,K-, andL-bandphotometry from the literature are shown as squares. Color-correctedIRAS fluxes and upper limits are shown as crosses. The solid lines areKurucz model atmospheres fitted to the U-, B-, V-, I-, J-, K-, and L-bandphotometry. B and V fluxes derived from Hipparcos data are assumed tohave a 2% error, whileU-, I-, J-, K-, and L-band fluxes derived from the lit-erature are assumed to have a 5% error. HD 131156 was observed with theN, N0, N1, N2, N3, N4, and N5 MIRLIN filters that correspond to wave-lengths of 10.8, 7.9, 8.8, 9.7, 10.3, 11.7, and 12.5 lm.MIRLIN data for HD131156 A are open diamonds, and MIRLIN data for HD 131156 B arecircles. The final MIRLIN flux values are given in Table 5. We assume anabsolute calibration uncertainty of 6% for the MIRLIN photometry inaddition to the statistical errors due to photon statistics and scatter in airmass fits. SMTO data are triangles.
3342 HOLMES ET AL. Vol. 125
This work is based, in part, on measurements made withthe Heinrich Hertz Telescope, which is operated by theArizona Radio Observatory on behalf of Steward Observa-tory, and the Max-Planck-Institut fur Radioastronomie.Observations at the Palomar Observatory were made aspart of a continuing collaborative agreement betweenPalomar Observatory and the Jet Propulsion Laboratory.We are grateful to Dana Backman, David Ciardi, ElishaPolomski, Robert Pina, August Muench-Nasrallah, KarlHaisch, and Christine Chen for their helpful comments andto Michael Meyer for his assistance in data taking during
the 1999 December observing run at the Submillimeter Tele-scope Observatory. This research has made use of dataproducts from IRAS and the Hipparcos Catalog, as well asthe SIMBAD database, operated at the Centre de DonneesAstronomiques de Strasbourg, France. This research wasfunded in part by a NASA Graduate Student ResearchersProgram fellowship. Part of the research described in thispublication was carried out at the Jet Propulsion Labora-tory, California Institute of Technology, under a contractwith the National Aeronautics and Space Administration.
REFERENCES
Aumann, H., &Good, J. 1990, ApJ, 350, 408Backman, D. E., & Paresce, F. 1993, in Protostars and Planets III, ed. E. H.Levy & J. I. Lunine (Tucson: Univ. Arizona Press), 1253
Beichman, C., Gautier, T. N., Holmes, E. K., Rieke, G., Stansberry, J.,Stapelfeldt, K., &Werner, M. 2003, in ASP Conf. Ser., Debris Disks andthe Formation of Planets: A Symposium in Memory of Fred Gillet, ed.L. Caroff&D. Backman (San Francisco: ASP), in press
Dent, W. R. F., Greaves, J. S., Mannings, V., Coulson, I. M., & Walther,D.M. 1995,MNRAS, 277, L25
Dermott, S. F., Grogan, K., Holmes, E., & Kortenkamp, S. 1999a, inFormulation and Evolution of Solids in Space, ed. J. M. Greenberg &A. Li (Dordrecht: Kluwer), 565
Dermott, S. F., Grogan, K., Holmes, E. K., &Wyatt, M. C. 1999b, in Proc.Int. Conf. Honouring Heinrich Eichhorn: Modern Astrometry andAstrodynamics, ed. R. Dvorak, H. F. Haupt, & K. Wodnar (Vienna:Austrian Acad. Sci.), 189
Elachi, C., et al. 1996, in A Road Map for the Exploration of NeighboringPlanetary Systems (ExNPS), ed. C. Beichman (Tech. Rep.; Pasadena:JPL)
European Space Agency (ESA). 1997, The Hipparcos and TychoCatalogues (ESA SP-1200)
Fernandes, J., Lebreton, Y., Baglin, A., &Morel, P. 1998, A&A, 338, 455Freudling, W., Lagrange, A. M., Vidal-Madjar, A., Ferlet, R., & Forbeille,F. 1995, A&A, 301, 231
Gillett, F. 1986, in Light on Dark Matter, ed. F. P. Israel (Dordrecht:Reidel), 61
Gray, D. F., Baliunas, S. L., Lockwood, G. W., & Skiff, B. A. 1996, ApJ,465, 945
Greaves, J. S., et al. 1998, ApJ, 506, L133Hildebrand, R. H. 1983, QJRAS, 24, 267Holland,W. S., et al. 1998, Nature, 392, 788Holmes, E. K. 2002, Ph.D. thesis, Univ. FloridaHolmes, E. K., Dermott, S. F., Grogan, K., & Wyatt, M. C. 1999, in ASPConf. Ser. 177, Astrophysics with Infrared Surveys: A Prelude to SIRTF,ed. M. D. Bicay, C. A. Beichman, R. M. Cutri, & B. F. Madore (SanFrancisco: ASP), 381
Jewitt, D., Luu, J., & Chen, J. 1996, AJ, 112, 1225Jewitt, D., Luu, J., & Trujillo, C. 1998, AJ, 115, 2125Johnson, H. L., Iriarte, B., Mitchell, R. I., & Wisniewski, W. Z. 1966,Comm. Lunar Planet. Lab., 4, 99
Johnson, H. L., McArthur, J.W., &Mitchell, R. I. 1968, ApJ, 152, 465Koerner, D. W., Ressler, M. E., Werner, M. W., & Backman, D. E. 1998,ApJ, 503, L83
Lachaume, R., Dominik, C., Lanz, T., & Habing, H. J. 1999, A&A, 348,897
Landgraf, M., Liou, J.-C., Zook, H. A., &Grun, E. 2002, AJ, 123, 2857Liou, J.-C., & Zook, H. 1999, AJ, 118, 580Lutz, T. E. 1971, PASP, 83, 488Luu, J. X., & Jewitt, D. C. 1998, ApJ, 502, L91Natta, A., Grinin, V. P., & Mannings, V. 2000, in Protostars and PlanetsIV, ed. V. Mannings, A. P. Boss, & S. S. Russell (Tuscon: Univ. ArizonaPress), 559
Oudmaijer, R. D., van der Veen, W. E. C. J., Waters, L. B. F. M., Trams,N. R.,Waelkens, C., & Engelsman, E. 1992, A&AS, 96, 625
Paley, E. S., Low, F. J., McGraw, J. T., Cutri, R. M., & Rix, H. 1991, ApJ,376, 335
Pollack, J. B., Holenbach, D., Beckwith, S., Simonelli, D. P., Roush, T., &Fong,W. 1994, ApJ, 421, 615
Ressler, M. E., Werner, M. W., Van Cleve, J., & Chou, H. A. 1994, Exp.Astron., 3, 277
Sandell, G. 1994,MNRAS, 271, 75Simmons, L., & Werner, M. 1997, The Space Infrared Telescope FacilityScience Requirements Document 674-SN-100, Ver. 1.0 (Pasadena:NASA/JPL)
Strom, K. M., Newton, G., Strom, S. E., & Seaman, R. L. 1989, ApJS, 71,183
Telesco, C.M., et al. 2000, ApJ, 530, 329The, P. S., deWinter, D., & Perez,M. R. 1994, A&AS, 104, 315Walker, H. J., &Heinrichsen, I. 2000, Icarus, 143, 147Weintraub, D. A., & Stern, S. A. 1994, AJ, 108, 701Zuckerman, B., & Becklin, E. E. 1993, ApJ, 414, 793
No. 6, 2003 SUBMILLIMETER SURVEY OF NEARBY STARS 3343