+ All Categories
Home > Documents > A Systems Perspective for Assessing Carbon Dioxide Capture...

A Systems Perspective for Assessing Carbon Dioxide Capture...

Date post: 27-Mar-2020
Category:
Upload: others
View: 6 times
Download: 0 times
Share this document with a friend
89
A Systems Perspective for Assessing Carbon Dioxide Capture and Storage Opportunities by Nisheeth Singh BE, Mining Engineering, National Institute of Technology, Rourkela, INDIA MS, Mining Engineering, Southern Illinois University, Carbondale, IL, USA SUBMITTED TO THE SYSTEM DESIGN AND MANAGEMENT PROGRAM IN PARTIAL FULFILLMENT OF THE REQUIREMENTS FOR THE DEGREE OF MASTER OF SCIENCE IN ENGINEERING AND MANAGEMENT AT THE MASSACHUSETTS INSTITUTE OF TECHNOLOGY May 2004 © 2004 Massachusetts Institute of Technology All rights reserved The author hereby grants to MIT permission to reproduce and to distribute publicly paper and electronic copies of this thesis document in whole or in part. Signature of Author___________________________________________________________ Nisheeth Singh System Design and Management Program May 2004 Certified by _________________________________________________________________ Howard Herzog Principal Research Engineer, Lab for Energy & Environment, MIT Thesis Supervisor Accepted by ________________________________________________________________ Tomas J. Allen Co-Director, LFM/SDM Howard W. Johnson Professor of Management Accepted by ________________________________________________________________ David Simchi-Levi Co-Director, LFM/SDM Professor of Engineering Systems
Transcript

A Systems Perspective for Assessing Carbon Dioxide Capture and Storage Opportunities

by

Nisheeth Singh BE, Mining Engineering, National Institute of Technology, Rourkela, INDIA MS, Mining Engineering, Southern Illinois University, Carbondale, IL, USA

SUBMITTED TO THE SYSTEM DESIGN AND MANAGEMENT PROGRAM IN PARTIAL FULFILLMENT OF THE REQUIREMENTS FOR THE DEGREE OF

MASTER OF SCIENCE IN ENGINEERING AND MANAGEMENT

AT THE MASSACHUSETTS INSTITUTE OF TECHNOLOGY

May 2004

© 2004 Massachusetts Institute of Technology

All rights reserved

The author hereby grants to MIT permission to reproduce and to distribute publicly paper and electronic copies of this thesis document in whole or in part.

Signature of Author___________________________________________________________

Nisheeth Singh System Design and Management Program

May 2004

Certified by _________________________________________________________________ Howard Herzog

Principal Research Engineer, Lab for Energy & Environment, MIT Thesis Supervisor

Accepted by ________________________________________________________________ Tomas J. Allen

Co-Director, LFM/SDM Howard W. Johnson Professor of Management

Accepted by ________________________________________________________________ David Simchi-Levi

Co-Director, LFM/SDM Professor of Engineering Systems

AACCKKNNOOWWLLEEDDGGEEMMEENNTT

I would like to sincerely thank Howard Herzog without whom this work would not

have been possible. I appreciate the financial support of the U.S. Department of Energy's

National Energy Technology Laboratory. This work was funded under the aegis of their

contract DE-FC26-02NT41622. I would also like to thank my colleague and good friend

Hongliang ‘Henry’ Zhang who stayed up many a night to create the GIS model which

formed the backbone of this investigation.

I would like to recognize the following friends – Bill, Manoj, Ron, Shivashis and

Sinu for their crucial support without which I would not have been able to complete the

program. My friend Smitha deserves special mention as the individual who provided the

needed distraction to help me balance work and play. Anustup, a very special friend, filled

me with enough drive and ambition to reach this point and keep me going for the next several

decades. I would also like to thank all my other friends and well-wishers, too numerous to

mention here, who have been instrumental in providing me with guidance, courage and

support

Finally, I would like to recognize my family whose everlasting support and

encouragement provided this opportunity for me and to whom I shall be eternally grateful.

3

TTAABBLLEE OOFF CCOONNTTEENNTTSS

ACKNOWLEDGEMENT...................................................................................................... 3

TABLE OF CONTENTS........................................................................................................ 5

LIST OF FIGURES ................................................................................................................ 7

LIST OF TABLES................................................................................................................... 8

LIST OF ABBREVIATIONS ................................................................................................. 9

ABSTRACT............................................................................................................................11

1: INTRODUCTION ............................................................................................................ 13 1.1: What is the Greenhouse Effect? ............................................................................. 13 1.2: Efforts to Mitigate the Greenhouse Effect ............................................................. 14 1.3: What is Carbon Sequestration? .............................................................................. 15 1.4: A Systems Perspective............................................................................................ 16 1.5: A Brief Outline of the Thesis.................................................................................. 17

2: HISTORY AND BACKGROUND .................................................................................. 19 2.1: History.................................................................................................................... 19 2.2: Storage in Oil and Gas Reservoirs ......................................................................... 20

2.2.1: Enhanced Oil Recovery (EOR) ................................................................. 21 2.2.2: Weyburn CO2 EOR Project ....................................................................... 21 2.2.3: Rangely CO2 EOR Project......................................................................... 22

2.3: Sequestration in Deep, Unmineable Coal Seams................................................... 23 2.4: Sequestration in Deep Saline Formations .............................................................. 24

2.4.1: Saline Aquifer CO2 Storage (SACS) ......................................................... 24 2.4.2: Frio Brine Pilot Project.............................................................................. 26

2.5: Acid Gas Injection.................................................................................................. 27 2.6: Efforts at Systems Analysis.................................................................................... 27

2.6.1: APCRC GEODISC Program..................................................................... 28 2.6.2: GESTCO Project ....................................................................................... 29 2.6.3: Batelle’s CO2-GIS ..................................................................................... 30 2.6.4: Play Analysis ............................................................................................. 31

2.7: GIS and MIT .......................................................................................................... 32

3: CARBON DIOXIDE SOURCE CAPTURE ASPECTS ............................................... 34 3.1: Why Capture Carbon Dioxide? .............................................................................. 34 3.2: Capture Parameters and Issues............................................................................... 35

3.2.1: Quantity ..................................................................................................... 35 3.2.2: Quality ....................................................................................................... 35 3.2.3: Pressure...................................................................................................... 36 3.2.4: Retrofit Parameters .................................................................................... 36

3.3: Methodologies for CO2 Capture............................................................................. 38 3.3.1: Post-Combustion Capture.......................................................................... 38 3.3.2: Pre-Combustion Capture ........................................................................... 38 3.3.3: OxyFuel Conversion.................................................................................. 39

3.4: Types of Sources .................................................................................................... 41

5

3.4.1: Power Plants Burning Fossil Fuels............................................................ 41 3.4.2: Industrial Sources ...................................................................................... 43

3.5: Carbon Dioxide Capture Costs............................................................................... 44 3.6: Sources and the GIS ............................................................................................... 45 3.7: Summary ................................................................................................................ 47

4: CARBON DIOXIDE TRANSPORTATION .................................................................. 49 4.1: Pipeline Transportation .......................................................................................... 49

4.1.1: Technical Parameters and Issues ............................................................... 50 4.1.2: Costs .......................................................................................................... 52

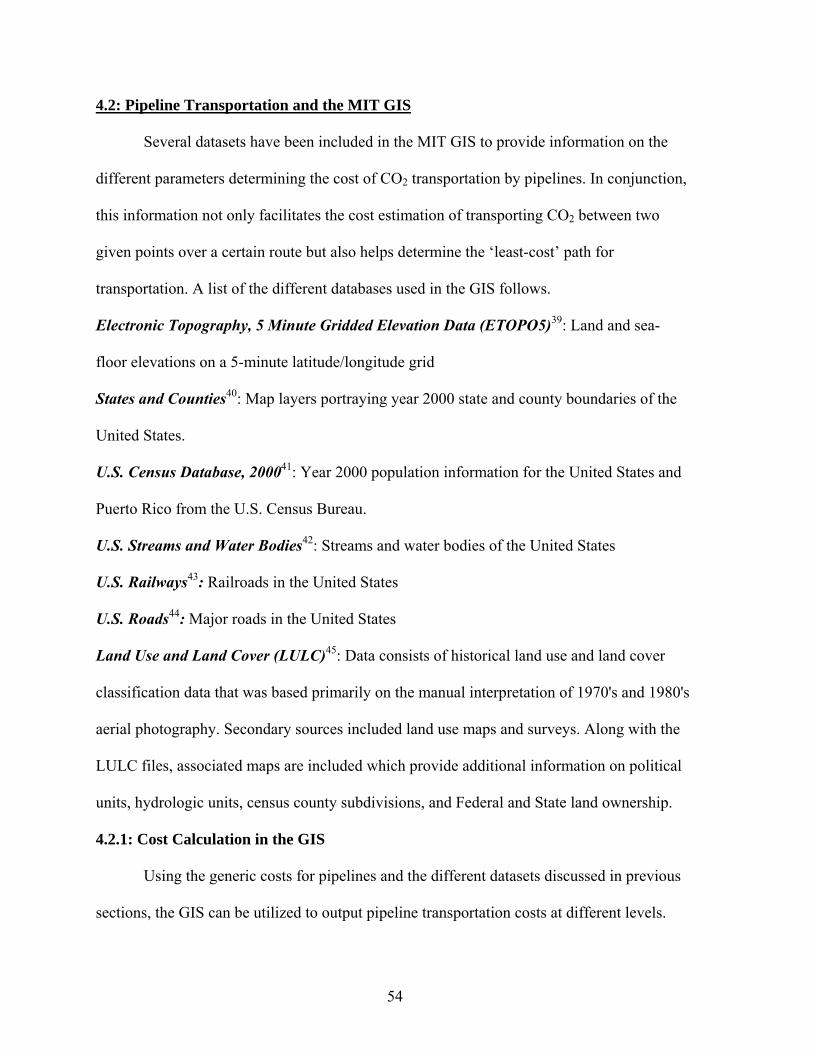
4.2: Pipeline Transportation and the MIT GIS .............................................................. 54 4.2.1: Cost Calculation in the GIS ....................................................................... 54

4.3: Summary ................................................................................................................ 56

5: CARBON DIOXIDE STORAGE RESERVOIRS ......................................................... 58 5.1: Reservoir Parameters ............................................................................................. 59

5.1.1: Depth ......................................................................................................... 60 5.1.2: Capacity ..................................................................................................... 60 5.1.3: Injectivity................................................................................................... 61 5.1.4: Reservoir Containment/Integrity ............................................................... 63

5.2: Types of Reservoirs ................................................................................................ 63 5.2.1: Oil and Gas Reservoirs .............................................................................. 63 5.2.2: Unmineable Coal Seams............................................................................ 64 5.2.3: Saline Formations ...................................................................................... 65

5.3: Costs ....................................................................................................................... 66 5.4: Reservoirs and the GIS........................................................................................... 67

5.4.1: Brine Formation Database ......................................................................... 68 5.4.2: Gas Information System ............................................................................ 69 5.4.3: Coal Fields of the United States ................................................................ 70

5.5: Summary ................................................................................................................ 71

6: SYSTEM EVOLUTION AND SAMPLE CASE STUDY ............................................. 72 6.1: OPCAT ................................................................................................................... 72 6.2: Decision Support System Model............................................................................ 73

6.2.1: Inputs ......................................................................................................... 73 6.2.2: Constraints ................................................................................................. 75 6.2.3: Internal Calculations.................................................................................. 76 6.2.4: Outputs....................................................................................................... 76 6.2.5: Model Overview........................................................................................ 77

6.3: Case Study.............................................................................................................. 78 6.3.1: Case Description and Methodology .......................................................... 79 6.3.2: Results ....................................................................................................... 81

6.4: Conclusion.............................................................................................................. 83

7: CONCLUSIONS AND RECOMMENDATIONS.......................................................... 85 7.1: Conclusions ............................................................................................................ 85 7.2: Recommendations for Future Work ....................................................................... 85

REFERENCES...................................................................................................................... 86

6

LLIISSTT OOFF FFIIGGUURREESS

Figure 1: Schematic of CO2 EOR (Courtesy NETL Program Fact Sheet on EOR) ............... 20

Figure 2: Schematic of the SACS project (Courtesy IEA SACS Project Website)................ 25

Figure 3: Distribution of the ESSCI chance in Australia (Courtesy APPEA Journal) ........... 28

Figure 4: The five essential components of a GIS.................................................................. 32

Figure 5: Different methodologies of CO2 capture (courtesy BP America). .......................... 37

Figure 6: Distributions of different CO2 emission sources by industry sector ....................... 40

Figure 7: eGRID power plant locations scaled by quantity of CO2 emitted in 1998.............. 46

Figure 8: Diameter as a function of the CO2 mass flow rate .................................................. 50

Figure 9: Pipeline transport cost model overview diagram .................................................... 52

Figure 10: Cost of CO2 transport as a function of the CO2 mass flow rate ............................ 53

Figure 11: Minimized cost region for different reservoirs...................................................... 55

Figure 12: Geologic storage cost model overview diagram ................................................... 66

Figure 13: Costs ranges for CO2 storage options on a GHG-avoided basis. .......................... 66

Figure 14: UT BEG’s brine formations with depth and thickness data.................................. 68

Figure 15: Onshore areas with reservoir data in GASIS......................................................... 69

Figure 16: Coal fields of the United States............................................................................. 70

Figure 17: Model overview of the DSS .................................................................................. 77

Figure 18: Natural language description of Figure 17 ............................................................ 78

Figure 19: Region selected for case study. ............................................................................. 79

Figure 20: Level 0 analysis based on transportation cost alone on a one-to-one basis .......... 81

Figure 21: Level 1 analysis based on pipeline sharing and a transportation network ............ 82

Figure 22: Level 2 analysis optimizing both transportation and storage cost......................... 83

7

LLIISSTT OOFF TTAABBLLEESS

Table 1: Summary of capture cost ranges estimated for certain power plants and

industrial processes ................................................................................................. 45

Table 2: Summary of key points of CO2 capture.................................................................... 48

Table 3: Summary of key points of CO2 transportation ......................................................... 57

Table 4: Global capacity of potential geologic storage reservoirs.......................................... 59

Table 5: Summary of key points of CO2 storage .................................................................... 71

Table 6: Case study data on sources, reservoirs and other parameters................................... 80

8

LLIISSTT OOFF AABBBBRREEVVIIAATTIIOONNSS

Abbreviation Meaning

CCS Carbon capture and storage

CO2 Carbon dioxide

DOE United States Department of Energy

DSS Decision Support System

eGRID Emissions and Generation Resource Integrated Database

EOR Enhanced oil recovery

EPA Environmental Protection Agency (US)

EU European Union

GESTCO European Potential for Geological Storage of Carbon Dioxide from

Fossil Fuel Combustion

GHG Greenhouse gas

GIS Geographical information system

IEA International Energy Agency

IPCC Intergovernmental Panel on Climate Change

LFEE Laboratory for Energy and the Environment (at MIT)

MIT Massachusetts Institute of Technology

NETL National Energy Technology Laboratory (US DOE)

NOX Collective term for different oxides of Nitrogen

SERCSP South East Regional Carbon Sequestration Partnership

SO2 Sulfur dioxide

UN United Nations

UNEP United Nations Environmental Program

UNFCCC United Nations Framework Convention on Climate Change

US United States of America

WCRCSP West Coast Regional Carbon Sequestration Partnership

WMO World Meteorological Organization

9

AABBSSTTRRAACCTT

Even as the acceptance of the fossil fuel greenhouse effect theory continues to grow

amongst academics, statesmen and plebeians alike, the early adopters have already engaged

in pre-emptive research activities aimed at mitigating the effects of such greenhouse gases.

The focus of one such effort is on the capture and storage of CO2 (carbon dioxide) from

anthropogenic fixed source emissions. This effort can be broken down into a few broad

categories such as terrestrial, ocean and geologic sequestration. Geologic sequestration refers

to all activities geared towards the capture and storage of CO2 under the surface of the earth

in diverse ‘reservoirs’ such as deep saline formations, depleted oil and gas wells and

unmineable coal seams to name a few. This investigation develops a systems perspective for

assessing carbon dioxide capture and storage (CCS) opportunities within the realm of

geologic sequestration.

While multiple concurrent research activities continue to explore CCS opportunities

from various perspectives, efforts at a systems analysis of the overall picture are just

beginning. A systems view describing methodologies to integrate a variety of CCS data to

assess potential sequestration opportunities is at the heart of this study. It is based on research

being conducted at the Massachusetts Institute of Technology (MIT) under sponsorship of

the United States Department of Energy (DOE). Using a Geographic Information System

(GIS) and publicly available data, a detailed characterization of CO2 sources and reservoirs

are being developed. A source-reservoir matching process will be implemented which begins

with quantifying the ‘capturability’ of a CO2 source, a function of the purity, volume and

several site specific considerations. Next, the potential proximate reservoirs are identified

and then ranked based on transport options, type, capacity, cost, regulatory considerations

11

and political sensitivity. All the above criteria will be spatially represented in the GIS and can

be overlaid to produce a composite picture identifying the potential areas which would

represent the maximum probability of success in sequestration efforts. A rigorous systems

engineering approach will be adopted throughout the investigation. Novel tools such as the

Object-Process CASE (OPCAT) tool will be used to model the complex and interdisciplinary

system. A comprehensive systems modeling and engineering tool, it allows the

representation of function, structure and behavior in a single model.

Ultimately, the methodologies developed will be integrated and utilized in a case

study to illustrate the methodology of evaluating CCS options for a given set of sources. A

region in Mississippi has been identified for this model case-study. The methodology will be

applied at a later time to evaluate CCS potential in the South East Regional Carbon

Sequestration Partnership (SERCSP) and the West Coast Regional Carbon Sequestration

Partnership (WCRCSP).

12

11:: IINNTTRROODDUUCCTTIIOONN

1.1: What is the Greenhouse Effect?

News headline on The Environmental News Network1: “Thursday, March 15, 2001 –

Observations from satellites support a new theory that carbon dioxide and other emissions

are to blame for global warming, confirming what some climate models have been implying,

that Earth's ‘greenhouse’ effect increased between 1970 and 1997.” So what is actually the

greenhouse effect? While the world’s climate has always varied naturally, the vast majority

of scientists now believe that rising concentrations of “greenhouse gases” in the earth’s

atmosphere, resulting from economic and demographic growth over the last two centuries

since the industrial revolution, are overriding this natural variability and leading to

potentially irreversible climate change. The importance of energy as a tool for meeting the

needs for economic and demographic growth has been acknowledged at every major United

Nations conference in the 1990s, starting with the Rio Earth Summit (UN Conference on

Environment and Development) in 19922. Greenhouse gases – especially carbon dioxide

(CO2), the most abundant from human sources – act like a blanket over the Earth’s surface,

keeping it warmer than it would otherwise be. The Third Assessment Report of the

Intergovernmental Panel on Climate Change (IPCC), released in 2001, confirms that “an

increasing body of observations gives a collective picture of a warming world” with “new

and stronger evidence that most of the warming observed over the last 50 years is attributable

to human activities”3.

While this issue of the greenhouse effect has been the subject of discussion amongst

academics for well over a decade, it has achieved global significance amongst academics,

statesmen and plebeians alike over the last decade. This steep acceleration in the discussion

13

and research of the greenhouse effect was probably precipitated by the formation of the

FCCC in 1992. The FCCC was established in response to the reports from the IPCC and

adopted by over 150 countries as a blueprint for precautionary action. The main objective of

the FCCC (Article 2) was to achieve a stabilization of greenhouse gas concentrations in the

atmosphere at a level that would prevent dangerous anthropogenic interference with the

climate system4. In order to achieve this, the party nations were committed to drawing up

national programs to return emissions of greenhouse gases to 1990 levels by the year 2000.

1.2: Efforts to Mitigate the Greenhouse Effect

Though there still exists a small minority of skeptics questioning the existence of the

greenhouse effect, research activities aimed at mitigating the greenhouse effect have taken

off at varying paces primarily funded by governments and private research interests. For the

fiscal year 2004, the proposed budget of United States calls for a 15 percent increase in

funding for climate change-related programs bringing total U.S. spending on climate change

to $4.3 billion and to its highest level ever to date5. To tackle the issue of climate change, a

portfolio of measures are being researched and adopted globally. CO2 accounts for the

majority of greenhouse gases released and is currently responsible for 60% of the greenhouse

effect6. Thus, the issue of tackling anthropogenic fixed source emissions of CO2 assumes

primary importance. Such emissions of CO2 are primarily created by the burning of fossil

fuels such as coal, oil and gas for the production of energy. Efforts at mitigating the effects of

CO2 include developing alternatives to fossil fuels such as renewables and nuclear energy,

better technology for more efficient power production & energy use and carbon dioxide

capture and storage (CCS).

14

1.3: What is Carbon Sequestration?

Herzog and Golomb define carbon sequestration “as the capture and secure storage of

carbon that would otherwise be emitted to, or remain, in the atmosphere”7. CCS refers to

technologies which involve the capture of carbon dioxide from large stationary sources and

artificial injection of the CO2 into target reservoirs with the express purpose of storing the

CO2 in those reservoirs. The two distinct areas this can be studied under include

• Capture: This refers to technologies enabling the capture of CO2 from sources

such as power plants, gas processing plants, industrial plants etc.

• Storage: Once captured, the CO2 is directed towards storage in different kinds of

reservoirs.

Geologic sequestration refers to the capture of CO2 and its long-term

storage in geologic formations such as oil and gas reservoirs, unmineable

coal seams, and deep saline formations

Ocean sequestration refers to the capture of CO2 and its subsequent

storage in ocean water. CO2 is soluble in ocean water and can serve as a

reservoir for long-term storage

Biological sequestration refers to increasing CO2 fixation through

photosynthesis, slowing down or reducing decomposition of organic

matter, and changing land use practices can enhance carbon uptake in

natural CO2 reservoirs such as soils and vegetation

As described, geologic sequestration refers to all activities geared towards the capture

and storage of CO2 under the surface of the earth in diverse ‘reservoirs’ such as deep saline

formations, depleted oil and gas wells and unmineable coal seams to name a few. This

15

investigation considers and concerns CCS opportunities within the realm of geologic

sequestration only.

1.4: A Systems Perspective

While multiple concurrent research activities continue to explore CCS opportunities

from various perspectives, efforts at a systems analysis of the overall picture are just

beginning. A systems perspective becomes necessary due to the following reasons:

• Multiple research efforts

• Research thrusts in different directions

• Few attempts at integrating all the efforts

A systems perspective will:

• Identify interacting effects

• Recognize barriers and enablers

• Identify research areas needing extra attention

• Enable a meaningful comprehensive evaluation of CCS options

A systems view describing methodologies to integrate a variety of CCS data to assess

potential sequestration opportunities is at the heart of this study. It is based on research being

conducted at the Massachusetts Institute of Technology (MIT) under sponsorship of the

United States Department of Energy (DOE). This research at MIT is focused around

developing a Geographic Information System (GIS).

A GIS organizes and stores information as a collection of thematic layers that can be

linked by geography. Each layer contains features having similar attributes, like power plants

or industrial facilities. Furthermore, complex custom queries can be created and embedded in

the GIS to display layers with attributes that are the result of data transformation from

16

underlying layers. This flexibility allows the GIS to spatially represent any set of regions

with practically any possible combination of select parameters as long as sufficient

underlying data is available.

1.5: A Brief Outline of the Thesis

The development of this philosophy follows a logical approach with several distinct

steps that take on the form of separate chapters and which are summarized below.

Introduction: This chapter lays the foundation for the thesis by providing a primer on

climate change and the greenhouse effect and a brief discussion on the efforts to mitigate

them.

History and Background: An in-depth and comprehensive literature survey covering

different research activities to date and original work related to the thesis. Begins with the

bigger picture but quickly zooms into the research on geologic sequestration.

Carbon Dioxide Source Capture Aspects: Next, the different sources of CO2 are

characterized with special attention to the ‘capturability’ of a given source, a function of the

purity, volume and other site specific considerations.

Carbon Dioxide Storage Reservoirs: Next, the potential reservoirs are identified and then

ranked based on transport options, type, capacity, cost, regulatory considerations and

political sensitivity.

Carbon Dioxide Transportation: This chapter discusses the major mode of CO2

transportation today – pipeline transportation. A model for the cost of building pipelines and

the parameters determining this cost are presented. Major parameters include throughput,

quality of CO2, length, topography, pressure, right-of-way issues amongst others.

17

System Evolution and Sample Problem: The actual evolution of the systems methodology is

presented in this chapter. A visual model is developed for the entire system using the Object-

Process CASE (OPCAT) tool to model the complex and interdisciplinary system. This

chapter then integrates all the major steps outlined in the previous chapters in a sample

problem. This is to illustrate the methodology of evaluating CCS options for a given set of

sources. A region located mostly in the state of Mississippi and covering parts of Alabama

and Louisiana in the US was identified for this model case study. The methodology will be

applied at a later time to evaluate CCS potential in the South East Regional Carbon

Sequestration Partnership (SERCSP) and the West Coast Regional Carbon Sequestration

Partnership (WCRCSP).

Conclusion and Recommendations: The vision for the final version of the system is

summarized here. Due to data limitations, recommendations would include future work

needed to conduct a more complete systems analysis.

18

22:: HHIISSTTOORRYY AANNDD BBAACCKKGGRROOUUNNDD

This chapter details the background and history of CCS. Since the science of CCS is

relatively very recent compared to traditional sciences, little has been established and

accepted amongst the scientific community as the holy grail of CCS and it continues to be a

particularly dynamic and evolving field of study as research in this field progresses and new

ground is broken. Rather than try to reconcile and integrate different schools of thought in

CCS technologies and present a unified and sometimes conflicting generic almanac, some

typical research projects are presented here to provide a more hands-on feeling for where the

research stands today.

As mentioned in the previous chapter, the GIS being developed at MIT provides the

framework to develop a systems analysis of CCS options. Thus, a brief description of a

general GIS is in order and will be presented along with a more detailed discussion of the

GIS being developed at MIT.

2.1: History

The practice of pumping CO2 into geological formations has been around for three

decades now, mostly in oil and gas reservoirs, albeit not with the primary goal of storing CO2

but rather using it as an injectant to pump oil and gas out of reservoirs. This process is known

as Enhanced Oil Recovery (EOR). To this end, the focus of research was on the technical

aspects of injecting CO2 and recovering the resource rather than on the capturability of the

CO2 source and the effect it would have in reducing GHG emissions. Moreover, the stability

of the injected CO2 was not at stake once the resource had been extracted and hence

monitoring was not a primary concern. However, these activities established a starting point

for geologic sequestration activities, especially in oil and gas reservoirs.

19

Similar to the history of sequestering carbon dioxide in oil and gas wells, in the past,

CO2 and other gases such as Nitrogen (N2) or even a mixture of gases have been used to

recover methane from unmineable coal seams in a process known as Enhanced Coalbed

Methane Recovery or ECBMR in short. Once again, though these efforts were primarily

motivated by the prospect of recovering methane and very limited in nature, they lay the

foundation for CCS activities in deep unmineable coal seams. Efforts at sequestering CO2 in

deep saline formations are much more recent and consequently fewer in number.

Descriptions of a few selected projects in the three broad categories of geologic sequestration

follow to provide a quick overview of past and current research activities in the area.

2.2: Storage in Oil and Gas Reservoirs

Figure 1: Schematic of CO2 EOR (Courtesy NETL Program Fact Sheet on EOR8)

20

2.2.1: Enhanced Oil Recovery (EOR)8

As mentioned earlier, EOR refers to techniques that allow increased recovery of oil in

depleted or high viscosity oil fields. This has the potential to not only increase the yield of

depleted or high viscosity fields, but also to sequester CO2 that would normally be released to

the atmosphere. In general terms, carbon dioxide is flooded into an oilfield through a number

of injection wells drilled amidst producing wells in different complex patterns. Injected at a

pressure equal to or above the minimum miscibility pressure (MMP), the CO2 and oil mix

and form a liquid that easily flows to the production well. Pumping can also be enhanced by

flooding CO2 at a pressure below the MMP, swelling the oil and reducing its viscosity. This

process is illustrated in Figure 1

In 2000, EOR projects produced a total of 780,000 barrels of oil per day, almost 12

percent of the total U.S. production. Although CO2 EOR comprises only a small portion of

all EOR being performed in the U.S., maturing oil fields and narrow profit margins make this

method of resource recovery increasingly attractive to industry. The U.S. has been a leader in

developing and using technologies for CO2 EOR; currently about 96% of EOR with CO2 is

preformed in the U.S.

2.2.2: Weyburn CO2 EOR Project

In October 2000, EnCana began injecting CO2 into a Williston Basin oilfield

(Weyburn) in order to boost oil production. The Weyburn oilfield covers over 70 square

miles in southeastern Saskatchewan and is one of the largest medium-sour crude oil

reservoirs in Canada, containing approximately 1.4 billion barrels of original oil in place8.

Overall, it is anticipated that some 20 Mt of CO2 will be permanently sequestered over the

lifespan of the project and contribute to the production of at least 122 million barrels of

21

incremental oil from a field that has already produced 335 million barrels since its discovery

in 1955. The gas is being supplied via a 205 mile pipeline stretching from the lignite-fueled

Dakota Gasification Company Great Plains Synfuels plant site in North Dakota. At the plant,

CO2 is produced from a Rectisol unit in the gas cleanup train of the coal-fired plant. Sales of

the CO2 add about $30 million of gross revenue to the gasification plant’s cash flow each

year. Researchers collected background information prior to the flooding of the field with

CO2 allowing for comparison of field characteristics before and after CO2 injection and

enhancing understanding of interactions and relationships between oil recovery and CO2

storage. The IEA Weyburn CO2 Monitoring and Storage Project is coordinated by 20

research organizations in the U.S., UK, France, Italy and Denmark, including the U.S.

DOE/NETL Carbon Sequestration Program, and co-administered by the Petroleum

Technology Research Centre, Natural Resources Canada, Saskatchewan Industry and

Resources, the Saskatchewan Research Council, the University of Regina and IEA GHG

R&D Programme.

2.2.3: Rangely CO2 EOR Project

Chevron’s Rangely Weber field in Colorado is one of the largest EOR projects using

anthropogenic CO2. Carbon dioxide for this flood is purchased from the ExxonMobil

LaBarge natural gas processing facility in Wyoming and then transported via pipeline to the

field. The Rangely CO2 flood is comprised of an array of 341 production wells and 209

injection wells and extends over an area of 61 km2. CO2 injection began at Rangely in 1986

and leakage of CO2 via wellbores or through the reservoir cap is considered to be negligible.

Foams, gels and other strategies are used to improve conformance and reduce premature CO2

breakthrough. Monitoring wells are used to track movement of injectant within the reservoir,

22

and reservoir simulations estimate ultimate CO2 sequestration at the Rangely field. By the

time the project is completed, an estimated total of 25 Mt (472 Bcf) of CO2 will have been

injected.

2.3: Sequestration in Deep, Unmineable Coal Seams9

One approach to sequestering carbon dioxide (CO2) is to inject it into deep, unmineable coal

seams. A particular advantage of coal seam sequestration is that coal seams can store several

times more CO2 than the equivalent volume of a conventional gas reservoir because coal has

a large surface area. Advanced Resources International10, a leading technology development

and oil and gas consulting firm and their partners are using the only long-term, multi-well

ECBMR projects that exist in the world today to evaluate the viability of storing CO2 in

deep, unmineable coal seams. The two existing ECBMR pilots are located in the San Juan

Basin in northwest New Mexico and southwestern Colorado. The knowledge gained from

studying these projects is being used to verify and validate gas storage mechanisms in coal

reservoirs, and to develop a screening model to assess CO2 sequestration potential in other

promising coal basins of the U.S.

The two field pilots, the Allison Unit (operated by Burlington Resources) and the

Tiffany Unit (operated by BP America) are demonstrating CO2 and nitrogen (N2) ECBMR

recovery technology respectively. The interest in understanding how N2 affects the process

has important implications for power plant flue gas injection, since N2 is the primary

constituent of flue gas. Currently, the cost of separating CO2 from flue gas is very high. This

project is evaluating an alternative to separation by sequestering the entire flue gas stream.

Another reason for considering CO2/N2 is that N2 is also an effective methane displacer,

improving methane recoveries and further decreasing the net cost of CO2 sequestration. The

23

Allison Unit pilot area, which has been in operation since 1995, includes 16 producer wells

and 4 injector wells. The Tiffany Unit pilot area which has been in operation since 1998 is

made up of 34 producer wells and 12 injector wells. This demonstration project is providing

valuable new information to improve the understanding of formation behavior with CO2

injection, the ability to predict results and optimize the process through reservoir modeling.

2.4: Sequestration in Deep Saline Formations

Deep saline formations which represent a significant portion by volume of

sedimentary basins have the potential to store CO2 by three main mechanisms:

• hydrodynamic trapping of a CO2 plume (primary mechanism)

• solubility trapping through dissolution in the formation water

• mineral trapping through geochemical reactions with the formation fluids and

rocks

In addition, a CO2 plume may be trapped in structural and/or stratigraphic traps along

the flow pathway, other than and including associated oil and gas reservoirs.

Several large saline formations underlie the United States, but there is no injection of

CO2 into them yet. In Europe though, one million tons CO2 per year are being injected in the

saline formation at the Sleipner natural gas production field in the North Sea. A significant

body of data on domestic brine formations has been compiled by NETL, the University of

Texas at Austin, and others.

2.4.1: Saline Aquifer CO2 Storage (SACS)11,12

The Sleipner project is the world’s first commercial-scale storage of CO2 in a saline

formation for mitigation of climate change. The CO2 in this case is an unwanted by-product

of natural gas production from Sleipner West gas field in the North Sea. The CO2 is injected

24

into a large, deep saline reservoir, the Utsira formation 800 m below the bed of the North

Sea. Statoil operates the Sleipner field on behalf of a group of partners. Injection of CO2

started in October 1996 and a special project, the SACS project, was established separately in

1999 to monitor and research the storage of CO2 in this unique facility. A schematic of the

SACS project is illustrated in Figure 2.

Figure 2: Schematic of the SACS project (Courtesy IEA SACS Project Website)

To date, nearly 5 million tonnes of CO2 have been injected without any significant

operational problems observed in the capture plant or in the injection well. Since monitoring

is a high priority for this project, the project has had significant success with the

demonstration that conventional time lapse seismic data can be a successful monitoring tool

for CO2 injected into a saline formation. A reservoir simulation model that was specifically

developed for this project was validated against this seismic data with good correlation. This

25

model indicates that most of the CO2 accumulates in one bubble under the cap seal of the

formation a few years after the injection is turned off. The CO2 bubble spreads laterally on

top of the brine column and the migration is controlled by the topography of the cap seal

only. The model indicates that diffusion of CO2 from the gas cap into the underlying brine

column will have a pronounced effect. The brine on top of the column, which becomes

enriched in CO2, is denser then the brine below which sets up convection currents

maintaining a large concentration gradient near the CO2-brine interface, enhancing the

dissolution of CO2. The initial simulations indicate that bubble will reach a maximum size in

probably less than 300 years. After this time, dissolution is the dominating effect on bubble

extension and the bubble will gradually shrink and finally disappear around 4000 years.

2.4.2: Frio Brine Pilot Project13,14

As mentioned earlier, even though there have been no studies conducted on injecting

and storing CO2 in saline formations in the US on a commercial scale, a few pilot scale

projects have been commissioned and underway at the time of writing. One such project is

the Frio brine pilot project, a field experiment to pioneer CO2 injection for sequestration in a

brine formation in the Texas Gulf Coast, USA.

This project will be the first US demonstration of CO2 injection specifically for

greenhouse gas reduction. Non-hydrocarbon-bearing high-permeability sandstones were

identified as optimal targets for full-scale geologic sequestration because their large volumes

and widespread distribution permit the large-volume disposal that is needed to impact CO2

release volumes. This experiment in a brine/rock/CO2 system was selected as the optimal site

for CO2 flow-simulation code validation and development of monitoring strategies. This

setting is simpler than the typical CO2 injection commercially conducted for EOR which

26

contains one or more hydrocarbon phases that react strongly with the CO2 and have been

highly perturbed by past oil production practices.

2.5: Acid Gas Injection

Another technology that warrants mention in this chapter is acid gas injection. While

primarily motivated by stricter hydrogen sulfide (H2S) emission regulations, the technology

developed provides an analog for CCS in different kinds of geological formations.

Particularly common in Western Canada with a few projects in the US and the Middle East,

acid gas injection basically refers to operations that capture CO2 and H2S from oil or gas

streams produced from geological formations, compress and transport these gases to an

injection well where they are injected into a different geological formation for disposal

purposes. Thus, acid gas injection provides technology analogs in the three distinct areas of

CO2 sequestration: capture, transport and storage. The importance of these analogs is

elevated by the fact that in many acid gas injection projects, CO2 represents the largest

component of the acid gas stream and in some cases over 90% of the total volume of the gas

injected for storage15. So, in essence, a lot of acid gas injection projects fall directly under the

category of CCS projects. Furthermore, the geological formations that are used for storage in

acid gas injection projects are primarily depleted oil & gas reservoirs and deep saline

formations – two of the most popular choices for storage within the realm of geologic carbon

sequestration today.

2.6: Efforts at Systems Analysis

Since this investigation involves a systems analysis approach bringing together the

different areas of CCS research, a section on the background and history of CCS activities

would not be complete without a mention of the past and current efforts around the globe at

27

conducting a systems analysis. While they have been few in number, valuable knowledge

and guidelines can be drawn from these efforts. Moreover, a study of these efforts prevents

redundancy and allow for alternate approaches and optimization of existing efforts.

2.6.1: APCRC GEODISC Program16

Figure 3: Distribution of the ESSCI chance in Australia (Courtesy APPEA Journal)

In Australia, geological sequestration encompassing all its different aspects has been

the subject of research within the Australian Petroleum Cooperative Research Center’s

GEODISC program17. Under this program, a regional analysis examining the potential of

28

geologic sequestration of CO2 in all the sedimentary basins of Australia was undertaken and

a portfolio of sequestration options across the country was created. The highlight of the

project included the screening of 300 known sedimentary basins for storage and selecting 48

based on their geological characteristics including thickness, depth, stratigraphy& lithology

and structural complexity. These storage sites were then relatively ranked based on five risk

factors (assuming there was adequate data on each): storage capacity, injectivity potential,

site details, containment and existing natural resources. The product of all these risk factors

results in the Environmentally Sustainable Site for CO2 Injection (ESSCI) index. A map

illustrating the distribution of ESSCI chance in Australia is shown in Figure 3. Sources of

CO2 were regionalized into eight different ‘emission nodes’ by estimating the CO2 emissions

for the next two decades based on current emission trends. The estimates of CO2 supply from

these emission nodes and ESSCI indices for different sites facilitate the matching between

sources and storage sites. Each storage site also underwent a preliminary economic

assessment to estimate the costs of compression, pipeline transport, drilling injection wells

and installing platforms. The integrated analysis identified where the most cost-effective

storage sites occurred and where the greatest impact on reducing Australia’s CO2 emissions

could be made.

2.6.2: GESTCO Project18

A Decision Support System (DSS) has been developed as part of part of an EU

project, “European Potential for Geological Storage of Carbon Dioxide from Fossil Fuel

Combustion” (GESTCO) to evaluate the technical and economical feasibility of CO2 storage

in the subsurface. With this system, CO2 sequestration systems can be defined, consisting of

a selection of CO2 sources and reservoirs and a pipeline route. The DSS retrieves all relevant

29

data needed to evaluate the whole chain from separation, transportation to storage from a

database. This data is obtained by an extensive inventory including large industrial point

sources and power plants, and, as possible geological storage sites, formations and

abandoned gas and oil reservoirs.

The DSS is coupled to a database in which the data is stored obtained by the

inventory. The interface of the DSS is based on a GIS that enables the user to define a CO2

sequestration system by selecting CO2 sources, capture technologies and reservoirs. An

economical optimal transportation route is then established connecting the sources with the

reservoirs. The DSS determines first if the storage potential of the selected sequestration is

sufficient and if that is the case the costs of each link in the chain is calculated and added to

arrive at total sequestration cost.

2.6.3: Batelle’s CO2-GIS19,20

In response to the need for a better understanding of carbon management options,

Battelle developed a state-of-the-art Geographic Information System (GIS) focused on CCS

opportunities in the United States. Known as the CO2-GIS, it is an archive of information

from various sources and includes information on fossil-fired power plants, EOR projects

(both current and planned), ECBMR projects and coal basins with potential for coalbed

methane production. In addition, natural geologic domes containing high purity CO2,

anthropogenic sources of CO2 used for EOR and major CO2 distribution pipelines are also

included. Further, base map layers consisting of such items as state and county boundaries,

major cities, highways, and water bodies are also included to provide spatial reference.

The CO2-GIS provides an easy-to-use decision screening mechanism for CCS. The

database contains a wealth of data critical to the analysis of such opportunities. Not only does

30

it allow the storage of key data, but enables visual and interactive display and retrieval of the

data as well as a wide array of analysis capability. Users are able to screen and query any

combination of available parameters and view the spatial relationships of the results.

A unique feature about this project is that it has been funded from private sources as

opposed to most other projects that stem from governmental initiatives. This renders the

findings proprietary in nature and hence not generally accessible by the general public.

2.6.4: Play Analysis21

Although this study does not investigate the entire value chain of sequestration

activities, there are important lessons to be learned about reservoir characterization from a

systems analysis viewpoint.

Play analysis is used to classify conceptual models for petroleum reservoirs so that

comparative studies can be undertaken. A play is defined as a conceptual geologic unit

having one or more reservoirs that can be genetically related on the basis of depositional

origin of the reservoir, structural or trap style, source rocks and hydrocarbon generation,

migration mechanism, seals for entrapment, and type of hydrocarbon produced. Plays

represent a geologically relatively homogeneous subdivision within the universe of

petroleum reservoirs within a basin. Individual plays have unique geological features that can

be viewed in terms of a conceptual model of geologic processes and depositional

environments to explain and predict the distribution and characteristics of petroleum

reservoirs. When grouped by plays, reservoirs show great similarity in terms of geological,

engineering, and production characteristics.

The play concept has been used for organizing a vast amount of data available from

Texas oil and gas reservoirs. Similar type of reservoir attributes are compiled for major oil

31

and gas plays in the Gulf Coast region of Louisiana and Mississippi. Play average values are

calculated from the available dataset. These play average attributes are used to characterize

reservoir rock and fluid properties and evaluated to identify possible candidates for geologic

sequestration and CO2 EOR opportunities. Additional major geologic features such as faults

along with cultural information are also provided.

2.7: GIS and MIT

Figure 4: The five essential components of a GIS.

A GIS is a tool that can graphically represent information in a spatial context. It

organizes and stores information as a collection of thematic layers that can be linked by

geography. Each layer contains features having similar attributes, like power plants or

industrial facilities that are located within the same geographic extent. Furthermore, complex

custom queries can be created and embedded in the GIS to display layers with attributes that

are the result of data transformation from underlying layers. This flexibility allows the GIS to

spatially represent any set of regions with practically any possible combination of select

32

parameters as long as sufficient underlying data is available. At the heart of every GIS are

five essential components as shown in Figure 4.

As more information becomes available on the many varied components of a carbon

management system and more and more people become interested in the potential of carbon

capture and storage (CCS) technologies, the need has arisen for a systems analysis tool that

can capture, integrate, manipulate and interpret this data. In response, the Laboratory for

Energy and Environment (LFEE) at the Massachusetts Institute of Technology (MIT) is

developing a Geographic Information System (GIS) for carbon management under the

sponsorship of the US DOE as mentioned earlier. This GIS will store, integrate, and

manipulate information relating to the components of carbon management systems.

Additionally, the GIS can be used to interpret and analyze the effect of developing these

systems.

33

33:: CCAARRBBOONN DDIIOOXXIIDDEE SSOOUURRCCEE CCAAPPTTUURREE AASSPPEECCTTSS

As mentioned in the previous chapter, the first step in the carbon sequestration

process is the capture of the CO2 from a source. Estimates of costs for capture tend to vary in

wide ranges depending upon the kinds of assumptions made for the values of the different

parameters determining the cost of CO2 capture. Broadly speaking, the determining

parameters are based on the kind of source, the operating and local conditions of the plant

etc. Notwithstanding the wide ranges of cost estimates, it is still widely accepted that over

75% of the costs of geologic sequestration are associated with capture, separation and

compression rather than the transportation and storage operations themselves. Nevertheless,

there are opportunities to lower the net cost of sequestration by taking advantage of

opportunities that require CO2 while producing a commercial product that offsets the cost of

sequestration with value-added benefits such as enhanced oil recovery (EOR) and enhanced

coalbed methane recovery (ECBMR).

3.1: Why Capture Carbon Dioxide?

Before discussing the intricacies of CO2 capture, an introduction to the motivation

behind it is in order. The purpose of CO2 capture is to produce a concentrated stream of CO2

which can be transported and stored. Capture of CO2 is best carried out at large point sources

of emissions, such as power plants which currently account for over a third of global CO2

emissions. Other large point sources include oil refineries, petrochemical, fertilizer and gas

processing plants, steel works, cement plants, other chemical plants and pulp and paper mills.

In the broader context of reducing the greenhouse gas effect by reducing the

concentration of CO2 in the atmosphere, the relative cost and feasibility of capturing CO2

from the sources mentioned must be evaluated. In theory, the entire gas stream from

34

combustion processes could be stored, avoiding the need for CO2 capture. However, for air-

blown combustion, the amount of energy required to compress the flue gas to enable it to be

transported and stored would make the process highly inefficient and consequently very

expensive. Also, the percentage of CO2 in flue gas is fairly low (4-15%) leading to very low

effective storage capacities for CO2 reservoirs. Since power plants using fossil fuels are the

largest producers of CO2, the majority of research has focused around the capture of CO2

from those sources. Also, industrial plants in general produce a much purer stream of CO2 at

much lower volumes which does not pose as big an engineering challenge to capture the

CO2. Where CO2 is a contaminant in a commercial product stream such as natural gas or

hydrogen, CO2 capture becomes a necessity with the cost of capture being borne by the

process.

3.2: Capture Parameters and Issues

A number of factors influence the choice of technology and the cost of capturing CO2

and these vary depending upon the type of plant and the fuel used.

3.2.1: Quantity

Quantity refers to the actual mass or volume of pure CO2 emitted to the atmosphere

from the different kinds of sources mentioned earlier. This parameter has a special

implication since the largest emitter (power plants burning fossil fuels) is not the easiest to

capture due to the low concentration of CO2 in the flue gas. However, economies of scale

render this a viable option.

3.2.2: Quality

Quality is another important parameter to be considered while evaluating a source.

Quality refers to the percentage of CO2 in the flue gas and the overall composition of the flue

35

gas itself. The quality of CO2 emitted affects the capture costs in terms of technology used.

For example, ammonia production is an industrial process that produces a nearly pure stream

of CO2 thereby eliminating most of the capture cost. Another major consideration within the

quality parameter is the impurities present in the flue gas such as SO2 and moisture which

may have impacts on capture technologies employed.

3.2.3: Pressure

Generally speaking, the higher the pressure at which the flue gas is emitted, the lower

are the capture costs. A higher pressure implies a lower volume and hence more options in

terms of technology for capture. Also, since pipelines are the current most feasible option for

large volume transportation of CO2 and since pipeline transport requires compression of the

CO2 to above its critical pressure of 7.38 MPa – if the flue gas is emitted at pressures equal to

or greater than this, no extra energy is expended in compressing the gas. This is very

important since a significant portion of the total energy spent for separation and capture of

CO2 from a source is used for compression of the gas.

3.2.4: Retrofit Parameters

Given that power plants burning fossil fuels emit the majority of CO2 into the

atmosphere as compared to industrial sources, the main issue at the heart of technologies for

the capture of CO2 is the prospect of retrofitting existing plants with capture mechanisms

versus building new plants specifically designed for CO2 capture. This issue is especially

significant given the fact that the average life expectancy of power plants burning fossil fuels

is at least fifty years with a majority of the power plants in the US having more than half

their expected lives remaining. Some of the major issues that arise while retrofitting existing

plants as compared to new plants built with CO2 capture as one of the process goals:

36

• Range of capture technology choices due to specific limitations of existing plants

• Age, smaller sizes, and lower efficiencies typical of existing plants

• Higher energy penalty (plant derating) for CO2 capture due to less efficient heat

integration for sorbent regeneration

• Existing plants not equipped with a flue gas desulfurization system for SO2

control must be first retrofitted for high-efficiency sulfur capture to minimize

contamination of the capture solvent by impurities in the flue gas such as SO2

• Site-specific difficulties such as land availability, access to plant areas and need

for special ductwork

A possible advantage for retrofits over new plants in the incremental cost for CO2

capture is that in cases where the capital costs of the existing plant have been fully or

partially amortized, the total COE of the plant with capture (including all new capital

requirements) can be comparable to or lower than that of a new plant.

Figure 5: Different methodologies of CO2 capture (courtesy BP America).

37

3.3: Methodologies for CO2 Capture

Technology for separating CO2 from gas streams was developed 60 years ago for use

in gas processing. This has been adapted for use in power plants to separate CO2 from flue

gases – this configuration is known as post-combustion removal. Other configurations have

also been identified as potentially attractive – pre-combustion removal and oxyfuel

conversion. The different methodologies of CO2 capture are presented in Figure 5 and

discussed briefly below.

3.3.1: Post-Combustion Capture

Most of the world’s electricity is currently generated from the combustion of fossil

fuels, especially coal and (to an increasing extent) natural gas. Hence, the ability to capture

and sequester the CO2 emitted by such plants has been a major focus of CCS research.

Capture of CO2 from flue gases produced by combustion of fossil fuels and biomass is

referred to as post-combustion capture. This is a downstream process, in which the CO2 in

flue gas at near atmospheric pressure is removed typically by a chemical absorption process.

Because of the relatively low CO2 concentration in power plant flue gases, chemical

absorption systems have been the dominant technology of interest for post-combustion

capture. For the most part, this study focuses primarily on post-combustion capture with all

the sources mentioned in the following section falling under the purview of post-combustion

capture.

3.3.2: Pre-Combustion Capture

The low concentration of CO2 in post-combustion capture means that a large volume

of gas has to be handled which results in large equipment sizes and high capital costs. A

further disadvantage of the low CO2 concentration is that powerful solvents have to be used

38

to capture CO2; also regeneration of the solvents, to release the CO2, requires a large amount

of energy. If the CO2 concentration and pressure could be increased, the CO2 capture

equipment would be much smaller and different solvents could be used with lower energy

penalties for regeneration. This can be achieved by pre-combustion capture. The fuel is

reacted with oxygen or air and, in some cases, steam, to give mainly carbon monoxide and

hydrogen and is commonly known as ‘syngas’. The carbon monoxide is reacted with steam

in a catalytic reactor, called a shift converter, to give CO2 and more hydrogen. The CO2 is

separated and the hydrogen is used as fuel in a gas turbine combined cycle plant. The

process, in principle, is the same for coal, oil or natural gas but, when coal or oil are used,

there are more stages of gas purification, to remove particles of ash, sulfur compounds and

other minor impurities. The CO2 emitted is at a high pressure and suitable for capture by

physical solvents at low volumes and hence lower costs. Percentages of CO2 captured are

generally high.

3.3.3: OxyFuel Conversion22

The major component of any flue gas is nitrogen from the air feed. If there were no

nitrogen, CO2 capture from flue gas would be greatly simplified. In the oxyfuel approach, the

power plant is fed oxygen produced by an air separation plant instead of air. The

concentration of CO2 in flue gas can be increased greatly by using concentrated oxygen

instead of air for combustion, either in a boiler or gas turbine. The oxygen could be produced

by, for example, cryogenic air separation which is already used on a large scale in the steel

industry. If fuel is burnt in pure oxygen, the flame temperature is excessively high and so

some CO2-rich flue gas would have to be recycled to the combustor to make the flame

temperature similar to that in a normal air-blown combustor. The advantage of oxygen-blown

39

combustion is that once the moisture is removed, the flue gas has a CO2 concentration of

typically >90%, compared to 4-14% for air blown combustion, so only simple CO2

purification is required. The disadvantage is that production of oxygen is expensive, both in

terms of capital cost and energy consumption. Advances in oxygen production processes

such as new and improved membranes that can operate at high temperatures could improve

overall plant efficiency and economics. Oxyfuel combustion for power generation has so far

only been demonstrated in small scale test rigs. Oxyfuel combustion may be an attractive

option for retrofit of existing steam cycle power stations since the modifications that would

need to be made at the power station would be relatively minor. Oxyfuel combustion could

also be applied to gas turbines. However, gas turbines that use CO2 as the working fluid

would be substantially different to conventional gas turbines and a simple retrofit would not

be feasible.

Ammonia - 3%

Cement - 15%

Ethylene (Oxide) - 3%

Gas Processing - 12%

Hydrogen - 2%Iron & Steel - 6%

Power Plants - 54%

Oil & Gas Refineries - 5%

Figure 6: Distributions of different CO2 emission sources by industry sector23

40

3.4: Types of Sources

This section describes the different sources of CO2 that are mostly applicable to the

post-combustion CO2 capture methodology described in the previous section. As stated, the

sources of CO2 within this category can be classified into two broad classes of power plants

burning fossil fuels and industrial sources. The relative distribution of CO2 emissions by

power plants (all types grouped together) and the major industrial sources is illustrated in

Figure 623.

3.4.1: Power Plants Burning Fossil Fuels24

Pulverized Coal Plants (PC): These plants have been in use for upwards of 60 years and

dominate the global market in terms of overall numbers and generating capacity. In

operation, coal is burned in a boiler that raises high-pressure steam. This is then passed

through a steam turbine and used to generate electricity. Over the years, many advances have

been made with PC technology including environmentally focused measures to minimize

emissions of SO2, NOX and particulates, as well as application of advanced steam cycles that

allow for greater plant efficiency. Typical CO2 content in the flue gas of PC plants is around

14%.

Integrated Gasification Combined Cycle (IGCC) Plants: In this type of plant, coal is reacted

with steam and oxygen (or air) in a gasifier generating syngas. This gas is cleaned using

different techniques and burned in a gas turbine. Since the CO2 is captured prior to

combustion, IGCC plants fall under the pre-combustion category described in the previous

section. The concentration of CO2 in the input to the cleaning stage can be in the range 15-

60% (dry basis) and the total pressure is typically 30-60 atm. This means that a compact and

low energy-intensive high pressure process such as physical absorption can be used for

41

separation of CO2. The exhaust heat is used to drive a steam cycle, producing additional

electricity. Apart from coals, feedstocks such as oil refinery wastes are also used in these

plants to generate electricity in an environmentally sound manner.

Natural Gas Combined Cycle (NGCC) Plants: Here, natural gas is combusted in a gas

turbine to generate electricity. But the hot exhaust gases from the turbine are recovered and

used to produce steam, which is used to drive a steam turbine, thus generating additional

electricity. In this way, two cycles are combined, resulting in enhanced overall efficiency.

With deregulation of the market for natural gas applications for power generation purposes,

the number of NGCC plants has increased at a spectacular pace over the past 10 to 15 years.

Capital costs for such plant are lower than those for coal-fired plants of equivalent generating

capacity. Globally, NGCC technology now accounts for more than 50% of the market for

new power generating capacity. Typical CO2 content in the flue gas of NGCC plants is

around 4%.

Oil-Fired Power Plants: Several main variants are used in the case of oil-fired power plants.

Oil may be simply sprayed into a boiler furnace as a cloud of fine droplets, along with a

supply of air, and burned. Steam is raised in a conventional steam cycle and used to power a

steam turbine. Depending on the type of oil used and the plant configuration, overall thermal

efficiency comes within the range of 23%-40%. Alternatively, as with gas-firing, oil can be

used to fire a stand-alone combustion turbine, with no waste heat recovery. Again, as with

gas, if waste heat is recovered, it can be used to raise steam to drive a steam turbine, thus

forming a combined cycle and generating additional electricity. With the popularity of oil in

the power sector consistently declining over the last decade, these kinds of power plants have

42

been losing market share. Typical CO2 content in the flue gas of oil-fired power plants is

around 12%.

3.4.2: Industrial Sources

Natural Gas Processing Plants: In natural gas operations, CO2 is generated as a by-product.

Some natural gas reservoirs such as the one in Natuna gas field in the South China Sea

contain over 70% CO2 by volume25. In general, gas fields contain up to 20% by volume CO2,

most of which must be removed to produce pipeline quality gas at < 2.5% CO2.26 The first

example of applying CO2 capture technology to industrial processes such as natural gas

processing is the Sleipner project in Norway.

Oil Refining and Petrochemical Plants: Gas-fired process heaters and steam boilers are

responsible for the bulk of the CO2 emitted from typical oil refineries and petrochemical

plants. Although refineries and petrochemical plants emit large quantities of CO2, they

include multiple emission sources often dispersed over a large area. High purity CO2 is

currently vented to the atmosphere by some gas processing and petrochemical plants.

Steel Production26: The iron and steel industry is the largest energy consuming

manufacturing sector in the world, accounting for 10-15% of total industrial energy

consumption. Integrated steel mills are some of the world’s largest emitters of CO2. The CO2

concentration in the flue gas of a steel plant is around 27%. Associated CO2 emissions from

the iron and steel industry in 1995 were estimated at 1,442 million tonnes.

Cement Production26: Emissions of CO2 from the cement industry account for 15% of the

total emissions of CO2 from stationary sources. Cement production requires large quantities

of fuel to drive the very high temperature and energy intensive reactions associated with the

43

calcinations of the limestone and the clinker formation. CO2 concentration in flue gases

varies between 14-33% by volume.

Ammonia Production: Carbon dioxide is an inevitable by product of ammonia (NH3)

production. The amount of CO2 produced during ammonia manufacturing in modern plants

from natural gas is ≈1.26 tonne/tonne of ammonia. World ammonia production is more than

100 million tonnes/year indicating a capture potential of ≈ 126 million tonnes/year of CO2.

Since the CO2 emitted is nearly pure, this presents a very low-cost opportunity to capture

CO2 from an industrial process. In fact, CO2 produced by this process is widely used to

supply the commercial market for CO2.

3.5: Carbon Dioxide Capture Costs

This section presents a short summary of the possible ranges of costs for CO2 capture

from power plants and industrial processes. Since this investigation is more focused on

integrating different areas of research together rather than developing fundamental research,

the costs for CO2 capture presented here draws heavily upon previous published research27, ,

, ,

28

29 30 31. Because of the diversity of assumptions employed, a systematic comparison of cost

results from different studies of CO2 capture is not straightforward (or even possible in many

cases). Nor are all studies equally credible, considering their vintage, data sources, level of

detail, and extent of peer review. Thus, the approach adopted here is to rely as heavily as

possible on recent peer-reviewed literature together with major publicly-available studies by

governmental and private organizations involved in the CO2 capture area.

Table 1 summarizes the range of current CO2 capture costs for some of the major

electric power and fuel systems mentioned in this chapter. These cost ranges reflect

differences in the technical, economic and financial assumptions employed in different

44

studies. Depending on the process or system in question, CO2 capture (including CO2

compression) adds anywhere from 20-85% to the production costs of a similar system

without CO2 capture. For power plants, the incremental costs are generally lowest for IGCC

systems and highest for current coal combustion plants. In terms of total cost, combined

cycle power plants fueled by natural gas typically produce the lowest-cost electricity, with or

without CO2 capture according to recent studies due to the lower carbon intensity of gas as

compared to coal. These results, however, are especially sensitive to assumptions about gas

prices and plant utilization factors.

Table 1: Summary of capture cost ranges estimated for certain power plants and

industrial processes

COST OF CO2 AVOIDED (US$/t CO2) Type of Source Low High Old PC Plant 45 73 New PC Plant 42 55 New NGCC Plant 35 74 New IGCC Plant 13 37 New Hydrogen Plant 4 24 Iron and steel production 35 Oil refining petrochemical 74 116 High purity industrial CO2 sources 10

3.6: Sources and the GIS

Point sources including power plants and industrial sources offer the most viable

option for carbon capture because of the cost benefits from large scale capture as discussed

earlier. Power plants generate large volumes of CO2 while many industrial facilities generate

high purity streams of CO2. As a first step, there are certain essential characteristics of a

source that need to have information available upon them. These include:

• Location

45

• Emissions by quantity

• Emissions by quality/proportion

• Pressure at which gases are emitted

• Plant type

• Fuel used

• Some index of ‘retrofitability’ for existing plants indicating the ease with which

capture and separation equipment can be installed

There exist several databases for the United States with varying degrees of data

populated with respect to the characteristics mentioned earlier. A couple of the major data

sources that have been used to create the MIT GIS are described below.

Figure 7: eGRID power plant locations scaled by quantity of CO2 emitted in 1998

46

Emissions and Generation Resource Integrated Database (eGRID)32: The Environmental

Protection Agency (EPA) initially released eGRID in 2000 and recently updated the database

in 2002. eGRID integrates 24 data sources from the EPA, Energy Information Administration

(EIA), and Federal Energy Regulatory Commission (FERC), some of which were

confidential previous to the creation of eGRID. The database includes data on emissions

(NOx, SO2, CO2), generation (capacity, resource mix), ownership, and location for over 4,500

power plants in the US. This is the most comprehensive dataset on power plants in the US. A

sample screenshot of the eGRID dataset is presented in Figure 7.

IEA PH4/9 Sources of CO233

: 2

2

2

2

2

Ecofys prepared a report on worldwide CO sources for the

International Energy Agency Greenhouse Gas R&D Program (IEA GHG). Ecofys provided

MIT with an electronic version of the report entitled “PH4/9 Building cost curve for CO

Storage: Sources of CO ” and the source data supporting the PH4/9 report (PH4/9). This

study focuses “on the location and size of large anthropogenic CO sources.” The dataset

characterizes facilities with 46 parameters for identification, location, CO emissions,

production, and fuels used.

As mentioned in the first chapter, a systems analysis is being conducted using the GIS

to spatially representing different layers. The first of these layers would be the sources

indicating the geographical location of each and accompanied by information on the different

characteristics mentioned earlier in this section. As will be described in forthcoming

chapters, layers representing reservoirs and transport options will be overlaid to produce a

composite cost and options estimate of sequestration possibilities for any given source.

3.7: Summary

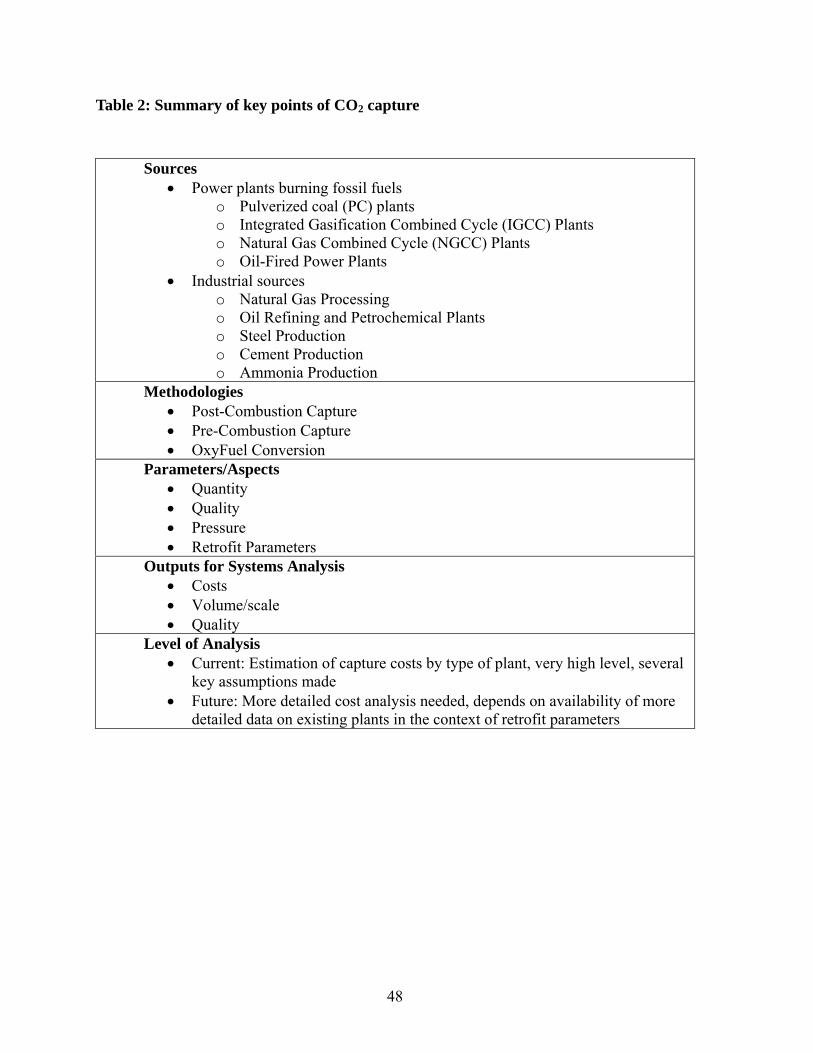
A summary of the key points described in this chapter is presented below in Table 2.

47

Table 2: Summary of key points of CO2 capture

Sources • Power plants burning fossil fuels

o Pulverized coal (PC) plants o Integrated Gasification Combined Cycle (IGCC) Plants o Natural Gas Combined Cycle (NGCC) Plants o Oil-Fired Power Plants

• Industrial sources o Natural Gas Processing o Oil Refining and Petrochemical Plants o Steel Production o Cement Production o Ammonia Production

Methodologies • Post-Combustion Capture • Pre-Combustion Capture • OxyFuel Conversion

Parameters/Aspects • Quantity • Quality • Pressure • Retrofit Parameters

Outputs for Systems Analysis • Costs • Volume/scale • Quality

Level of Analysis • Current: Estimation of capture costs by type of plant, very high level, several

key assumptions made • Future: More detailed cost analysis needed, depends on availability of more

detailed data on existing plants in the context of retrofit parameters

48

44:: CCAARRBBOONN DDIIOOXXIIDDEE TTRRAANNSSPPOORRTTAATTIIOONN

The next stage in the sequestration process after the capture of CO2 is its transport to

an identified reservoir. Of the three stages of carbon sequestration of capture/compression,

transportation and storage, the area of transportation is the most developed. There is ample

experience to draw upon from technological analogs in the form of natural gas and other gas

pipelines that have been around for several decades. In addition, CO2 itself has been

transported in high pressure pipelines – there are about 3000 km of CO2 pipelines in the

world, mainly in North America, which have been transporting CO2 since the early 1980s34.

Another option for transportation of CO2 over very long distances is tankers. Again, mature

technological analogs exist in the form of tankers that have been used to transport LPG

(liquefied petroleum gas) over very long distances.

From a systems analysis point of view, adding the cost of transportation to the cost of

capture adds another layer in the GIS. The details of the manner in which the GIS calculates

the cost of transportation will be discussed in greater depth in the chapter on matching of

sources and reservoirs. However, at a higher level, an analysis on transportation uses a

number of inputs to produce an output primarily in terms of cost of transport of CO2 per unit

mass.

4.1: Pipeline Transportation

This section draws heavily from a paper produced by the LFEE at MIT35. Over 110

million standard cubic meters (scm) per day of CO2 are transported by pipeline in the United

States, frequently for distances greater than 100 km. Transported CO2 is most commonly

used for EOR operations. The use of CO2 for EOR is a proven technology with 72 CO2

49

floods in the United States estimated in 200036. This implies a fairly mature and stable

technology for transportation of CO2.

0

10

20

30

40

0 10 20 30 40 50 6Mass flow rate (Mt CO2/yr)

Pipe

dia

met

er (i

n)

0

Figure 8: Diameter as a function of the CO2 mass flow rate

4.1.1: Technical Parameters and Issues

Some of the factors that are considered in estimating the cost of pipeline transport are

presented below. Sub-bullets indicate lower level parameters that are themselves functions of

higher level parameters.

• Throughput

Pipe diameter

• Length

Number of booster compressors

Booster compressor inlet and outlet pressures

50

Whether an inlet compressor is required

• Onshore or offshore

• Type of terrain

• Country/region and the regulations applying

• Pipeline inlet pressure

• Quality of CO2

Moisture

Impurities

As indicated, the pipe diameter is an important parameter and is actually a function of

the throughput. The relationship between the required pipe diameter and the throughput is

illustrated in Figure 8. This has some important implications in the fact that a pipe designed

for a certain throughput may not be suitable for other levels of throughput and assumes

importance when considering a network of pipelines from a localized region of sources to

one reservoir.

Another important technical consideration in the design of pipelines for transport of

supercritical CO2 is that it should remain above its critical pressure of 7.38 MPa. This can be

achieved by recompressing the CO2 at certain points along the length of the pipeline.

Recompression is often needed for pipelines over 150 km (90 miles) in length. It is important

to note, however, that recompression may not be needed if a sufficient pipe diameter is used.

For example, the Weyburn CO2 pipeline runs for 330 km (205 miles) from North Dakota to

Saskatchewan, Canada, without recompression37.

An important factor affecting the cost of pipeline transportation is right-of-way

(ROW) issues and existing ROW. A pipeline right-of-way is a strip of land over and around

51

pipelines where some of the property owner's legal rights have been granted to a pipeline

company. Right-of-way costs include obtaining the right-of-way and allowing for damages

and this can significantly increase the capital expenditure for installing a pipeline.

Conversely, existing ROW may prove certain pipeline paths more economical from a total

cost viewpoint even though topographical considerations may not necessarily indicate that to

be the cheapest option.

A survey of North American pipeline project costs yields several pertinent

observations. First, for a given pipeline diameter, the per unit distance cost of construction is

generally lower the longer the pipeline. Second, pipelines built nearer populated areas tend to

be more expensive. Finally, road, highway, river, or channel crossings and marshy or rocky

terrain also greatly increase the cost38.

Inputs: CO2 mass flow rate Pipeline length CO2 inlet pressure CO2 outlet pressure Capital charge rate

Outputs: Total capital cost Total O&M cost Total annual cost Total cost per tonne CO2

TRANSPORT MODEL Internal Calcs: CO2 density CO2 viscosity Pressure drop per unit length Pipe diameter

Figure 9: Pipeline transport cost model overview diagram

As mentioned earlier, from a systems analysis viewpoint, there are certain key inputs

that go into the analysis to produce the outputs. This inputs, outputs and internal calculations

are illustrated graphically in Figure 9.

4.1.2: Costs

The amount of cost data on CO2 pipelines in the open literature is very limited, but

there is an abundance of cost data for natural gas pipelines. For this reason, land construction

52

cost data for natural gas pipelines were used to estimate construction costs for CO2 pipelines.

This is adequate given that there is little difference between land construction costs for these

two types of pipeline.

$0.00

$1.00

$2.00

$3.00

$4.00

0 10 20 30 40 50Mass flow rate (Mt CO2/yr)

Cos

t ($/

t CO

2/100

km

)

60

Figure 10: Cost of CO2 transport as a function of the CO2 mass flow rate

A regression analysis between the average cost ($/mile) and the pipeline diameter

(inches) for natural gas pipelines yields total pipeline construction costs at $20,989/in/km.

Applying an O&M (operation and maintenance) cost factor of $3,100/km gives the

corresponding total O&M costs. Finally, the total annual cost per tonne of CO2 is found by

annualizing the construction cost using a capital charge rate of 15 percent per year and

adding this to the annual O&M cost. Figure 10 shows the cost of CO2 transport as a function

of CO2 mass flow rate. Significant economies of scale in the unit cost of transport are

observed as the mass flow initially increases but the cost starts to level out beyond 20

Mt/year of CO2 transported.

53

4.2: Pipeline Transportation and the MIT GIS

Several datasets have been included in the MIT GIS to provide information on the

different parameters determining the cost of CO2 transportation by pipelines. In conjunction,

this information not only facilitates the cost estimation of transporting CO2 between two

given points over a certain route but also helps determine the ‘least-cost’ path for

transportation. A list of the different databases used in the GIS follows.

Electronic Topography, 5 Minute Gridded Elevation Data (ETOPO5)39: Land and sea-

floor elevations on a 5-minute latitude/longitude grid

States and Counties40: Map layers portraying year 2000 state and county boundaries of the

United States.

U.S. Census Database, 200041: Year 2000 population information for the United States and

Puerto Rico from the U.S. Census Bureau.

U.S. Streams and Water Bodies42: Streams and water bodies of the United States

U.S. Railways43: Railroads in the United States

U.S. Roads44: Major roads in the United States

Land Use and Land Cover (LULC)45: Data consists of historical land use and land cover

classification data that was based primarily on the manual interpretation of 1970's and 1980's

aerial photography. Secondary sources included land use maps and surveys. Along with the

LULC files, associated maps are included which provide additional information on political

units, hydrologic units, census county subdivisions, and Federal and State land ownership.

4.2.1: Cost Calculation in the GIS

Using the generic costs for pipelines and the different datasets discussed in previous

sections, the GIS can be utilized to output pipeline transportation costs at different levels.

54

The GIS works on the concept of ‘cells’. Any geographical area can be considered as a grid

of perpendicular intersecting lines forming squares and the smallest unit on a grid is called a

cell. The dimension of a cell is dependent on user input and was 30 m for this investigation.

Figure 11: Minimized cost region for different reservoirs

The first level of analysis is based on a shortest-path algorithm that basically yields a

straight line path between a CO2 source and a matching reservoir. The output purely based on

the straight line distance between the source and the reservoir without taking into account

any other factors such as topography, water bodies, protected areas, urban areas etc.

The next level of analysis is based on a least-cost-path algorithm rather than on the

shortest distance as illustrated in Figure 11. This means that in addition to distance, the

55

resulting path of a pipeline between a CO2 source and a reservoir is based on factors such as

topography, water bodies, protected areas, urban areas etc. The alphabets represent reservoirs

and numbers represent different sources in the figure. A careful observation of the illustration

reveals the existing topographical details of the region such as rivers/streams, wetlands,

urban areas amongst others. The GIS considers all these details and calculates for every

given reservoir an area of minimum transportation cost around it such that for every CO2

source within this area, the cost of pipeline transportation of the CO2 is the least for that

given reservoir. It is interesting to note that the boundaries of any given region largely

coincide with natural boundaries such as wetlands. This is because the calculated cost in the

GIS for crossing a wetland is extremely high. The illustration presents this with the different

colored regions representing the minimum cost regions for the reservoirs contained within

them.

The next level of analysis would take into account the ROW and existing ROW

considerations in addition to all the other factors mentioned above. This is part of the future

work planned to be done in the MIT GIS.

4.3: Summary

To summarize the key points presented in this chapter, of the three stages of carbon

sequestration as defined by the IEA as capture, transportation and storage, the area of

transportation is the most developed and mature. Hence, a very in-depth analysis of

transportation costs and issues can be conducted to contribute to the overall goal of systems

analysis. A summary table is presented in Table 3.

56

Table 3: Summary of key points of CO2 transportation

Modes • Pipeline transport Parameters/Aspects • Throughput

Pipe diameter • Length

Number of booster compressors Booster compressor inlet and outlet pressures Whether an inlet compressor is required

• Onshore or offshore • Type of terrain • Country/region and the regulations applying • Pipeline inlet pressure • Quality of CO2

Moisture Impurities

Outputs for Systems Analysis • Costs • Capacities Level of Analysis • Current

Straight line path Least cost path not including ROW

• Future: Least cost path incorporating ROW factors

57

55:: CCAARRBBOONN DDIIOOXXIIDDEE SSTTOORRAAGGEE RREESSEERRVVOOIIRRSS

As mentioned in the second chapter, the third stage in the sequestration process

involves the injection of the CO2 into identified reservoirs based on a set of considerations.

Once again, this investigation considers geological formations only to serve as CO2

reservoirs.

There are certain key considerations that influence the choice of storage:

• The potential storage period for the chosen reservoir should extend from hundreds

to thousands of years

• The capacity of the reservoir should be adequate to handle the CO2 emitted from

identified sources

• The storage site should be selected such that the injectivity cost of CO2 is

minimized

• The environmental impact should be within statutory regulations and in general as

low as possible

Geologic formations that are currently considered to hold potential for CO2 storage

include:

• Saline formations

• Oil and gas wells

Depleted oil and gas wells

Non-depleted oil and gas reservoirs for Enhanced Oil Recovery (EOR)

• Coal seams

Unmineable coal seams

Coal seams amenable to Enhanced Coalbed Methane Recovery (ECBMR)

58

Each of these reservoirs will be discussed in greater detail in following sections but a

quick summary of the estimated potential storage capacity of each of the different categories

of reservoirs is presented Table 4. The worldwide production of CO2 and current utilization

of all possible storage reservoirs are also presented for reference.

Table 4: Global capacity of potential geologic storage reservoirs22

Sequestration option Worldwide capacity (Gt C)

Deep saline formations 100–10,000 Depleted oil and gas reservoirs 100–1000 Coal seams 10–1000

Worldwide production of CO2 ≈ 20 Gt C/yr Utilization: Currently < 0.1 Gt C/yr

From a systems analysis point of view, the inputs for evaluating a given reservoir

would be values for the different important parameters defined in the next section. The

outputs from the analysis would be the costs for storage with associated capacity, risk and

containment potential from a high level perspective.

5.1: Reservoir Parameters46

Various CO2 physical properties and other criteria play a role in the selection of the

appropriate means and sites for CO2 storage in geological media. At normal atmospheric

conditions, CO2 is a thermodynamically very stable gas heavier than air. For temperatures

greater than 31°C and pressures greater than the critical point of 7.38 MPa (74 bar), CO2 is in

a supercritical state. At these pressure and temperature conditions, CO2 behaves still like a

gas by filling all the available volume, but has a ‘liquid’ density that increases, depending on

pressure and temperature, from 200 to 900 kg/m3, thus approaching water density47,48. CO2 is

soluble in water; its solubility increases with pressure and decreases with temperature and

water salinity. CO2 in a supercritical state is immiscible in water. At low temperatures and

59

elevated pressures, CO2 forms a solid hydrate heavier than water. Another important property

of CO2 is its affinity to coal over methane – coal selectively releases methane (if present) and

adsorbs CO2. All these properties of CO2 and various other criteria play a role in the selection

of appropriate methods and sites for CO2 disposal and sequestration in geological media.

Depending on reservoir temperature and original pressure, CO2 can be stored either as a

compressed gas, liquid or in the supercritical phase. Based on these factors, the critical

parameters influencing the choice of a storage reservoir can be summarized as:

5.1.1: Depth

Previous studies have assumed implicitly that the pressure distribution in a

sedimentary basin is hydrostatic increasing linearly with depth at a rate of 1 MPa per 100 m.

With this assumption and for average geothermal gradients of 25°C /km, it has been

determined that the conditions for a CO2 supercritical state would be roughly met for depths

greater than 800 m. Since then, this depth of 800 m has been generally accepted as the base

case threshold for CO2 injection in a supercritical state for a first attempt at systems analysis.

5.1.2: Capacity

The capacity of a potential CO2 reservoir is one of the most important factors

governing the choice of any reservoir. Given the large capital cost of installing CO2 storage

equipment and more importantly, transportation pipelines from sources to assigned

reservoirs, a reservoir proves economical only if it has the capacity to store the CO2 from

those sources for a significantly long period of time of the order of several decades if not

more. Also, the possibility of future addition of sources to a reservoir already being used for

CO2 storage would make larger demands on capacity and underlines the need for selecting a

60

reservoir with a high storage capacity. The two major factors that affect the capacity of a

reservoir are listed below.

• Porosity: Porosity evaluation is needed to estimate the potential volume or

capacity available for CO2 sequestration in a reservoir. Available volumes for

CO2 sequestration can then be converted into tonnes of sequestered CO2 based on

the relation between in-situ temperature and pressure and CO2 density as

mentioned earlier.

• Reservoir Contact Efficiency: Besides porosity, there is another factor called the

‘reservoir contact efficiency’ that determines the storage capacity of a reservoir.

This refers to the effective percentage of available pore space that the CO2

ultimately ends up occupying and typically ranges between 20% and 40% with

average values around 33%49. This occurs due to the processes of gravity

segregation and viscous fingering arising from the low density and viscosity of

CO2 relative to the surrounding media. The lower density coupled with the low

viscosity makes the CO2 buoyant and tends to channel towards the top of the

reservoir thereby not occupying all the available pore space. This phenomenon is

generally observed in sequestration in saline formations and EOR operations.

5.1.3: Injectivity50

An important step in the analysis of the potential of a geologic reservoir for CO2

sequestration is identification of permeable zones for CO2 injection. This involves the

estimation of the injectivity of the reservoir. It is important since the injectivity of a reservoir

determines the number of injection wells required which directly affects the cost of CO2

61

storage in the reservoir. A relationship, derived by Law and Bachu is used to determine CO2

injectivity from CO2 mobility. The equation for CO2 injectivity is

CO2 injectivity = 0.0208 x CO2 mobility

where CO2 injectivity is equal to the mass flow rate of CO2 that can be injected per

unit of reservoir thickness and per unit of downhole pressure difference, and CO2 mobility

equals the CO2 absolute permeability divided by CO2 viscosity.

Major parameters affecting injectivity of a reservoir are described briefly below.

• Permeability: Rock permeability is a critical factor in establishing CO2 injection

rate and ultimate volume. Injection in highly permeable zones is preferred

because the pressure buildup will be accordingly low, avoiding the risk of

fracturing which could open conduits for upward CO2 migration and possible

escape. Identification of permeable zones is necessary for CO2 injection and

storage in coal beds and in deep saline formations. Oil and gas reservoirs, unless

in tight rocks, have already enough permeability that allows hydrocarbon

production and therefore CO2 injection.

• Pressure: In order to achieve large storage capacities underground, CO2 should be

stored above supercritical pressure (supercritical point at 31°C, 7.38 MPa/74 bar)

and deeper than 800 meters below the surface. The higher the pressure in the

reservoir, the denser is the CO2 stored in it occupying a lower volume. However,

higher reservoir pressures affect injectivity adversely and therefore increase

storage costs.

• Thickness: The thickness is a parameter in the calculation of the injectivity of the

reservoir. In general, a thicker reservoir has better injectivity than a thinner one.

62

5.1.4: Reservoir Containment/Integrity

This is one the most important factors to consider while selecting a storage option. It

is also an area where little or no information is readily available. Estimation of containment

potential is important as it is the basic premise on which CCS efforts have developed. Lack

of proper containment of stored CO2 and its subsequent release back to the atmosphere would

defeat the basic goal of sequestration. Even if the sequestered CO2 is not released into the

atmosphere, lack of adequate containment could witness the release of the CO2 into adjacent

resources such as fresh groundwater creating new environmental challenges. Some of the

factors to be considered while choosing a geologic storage site include basin hydrodynamics,

flow driving mechanisms, natural geologic barriers, cap rock, tectonic settings, seismic

activity potential amongst others.

5.2: Types of Reservoirs

5.2.1: Oil and Gas Reservoirs

Though a relatively new idea in the context of climate change mitigation, injecting

CO2 into depleted oil and gas fields has been practiced for many years. It has been or is being

currently used worldwide in more than 70 tertiary enhanced oil recovery (EOR) operations to

increase oil mobility and to displace up to 40% of the residual oil left in an active reservoir

after primary production and water flooding.

Depleted oil and gas reservoirs display particular promise in this regard. These

reservoirs in structural and stratigraphic traps have demonstrated good storage and sealing

characteristics over geological time and they can thus be used for CO2 sequestration once a

reservoir is no longer exploited (depleted). The term ‘depleted’ is an economic term and

relative for oil reservoirs as there is always residual oil in place that may be recovered in the

63

future depending on technological advances and economic conditions. For gas reservoirs, this

problem does not exist, so they are better candidates for CO2 sequestration. The trapping

mechanism (structural, stratigraphic or lithologic) that retained hydrocarbons in the first

place will ensure that CO2 does not reach the surface. The proven trap, known reservoir

properties and existing infrastructure make storage of CO2 in depleted hydrocarbon

reservoirs a simpler and cheaper option than other forms of CO2 sequestration. Closed

depleted gas reservoirs represent the most straightforward case, as primary recovery usually

removes as much as 95% of the original gas in place, and CO2 can be used to re-pressurize

the reservoir to its original pressure. Most oil and gas reservoirs are not located near primary

sources of CO2 production, so new pipelines will be needed to connect the CO2 sources with

suitable sequestration sites.

5.2.2: Unmineable Coal Seams

An important property of CO2 is its affinity to coal over methane – coal selectively

releases methane (if present) and adsorbs CO2. Injecting CO2 into coal beds that are too deep

or uneconomic for coal mining presents a twofold advantage. First, CO2 is sequestered by

adsorption on the coal matrix. Second, methane may be produced as a byproduct which

although itself a greenhouse gas, can be used instead of coal as a much cleaner fuel implicitly

reducing CO2 emissions. Carbon dioxide injection into coal beds is already used in the San

Juan basin to enhance methane recovery (ECBMR: enhanced coalbed methane recovery) by

increasing the pressure drive and decreasing the amount of produced water that has to be

disposed of by injection back into deep formation. The bulk of coalbed methane resources

occur in China, Russia, India, central and Eastern Europe, Australia, USA and Canada, all

countries basically with large coal deposits. However, most coal seams have unfavorably low

64

permeability because of their complex geological setting, such as in Western Europe and in

China. Thus, depending on geological conditions, CO2 sequestration in coal beds has

potential for the mid to long term storage.

5.2.3: Saline Formations

The pore and fracture space in the Earth's crust is filled with water. Deep formations

contain highly saline water that is not fit for industrial and agricultural use or for human

consumption. Such formations are already used for injection of hazardous and non-hazardous

liquid waste. The high pressures encountered in deep formations indicate that they can

withstand CO2 injection. Some of the injected CO2 (up to 29%) will dissolve in the water and

the rest will form a plume that will ride at the top of the formation. While the dissolved CO2

will travel with the velocity of the formation waters (of the order of cm/year), the CO2 plume

will be driven both by the natural hydrodynamic flow and by its buoyancy with respect to

water. CO2 can be hydrodynamically sequestered in deep formations for long periods of time.

This is because of the slow spreading from the injection well and hydrodynamic dispersion in

the formation once outside the well radius of influence and of extremely long residence time

due to the very low velocity of formation waters (less than 0.1 m/year). Also, similar to

utilization in EOR operations and sequestration in depleted hydrocarbon reservoirs, the

technology is already developed and easy and economic to apply. Thus, deep saline

formations have, by far, the largest potential for CO2 sequestration in geological media in

terms of volume, duration, economics and minimum environmental impact. A commercial

scheme for CO2 sequestration in an offshore North Sea formation is already in place in

Norway where 106 tonnes of CO2 are extracted annually from the Sleipner field and injected

into the 250 m thick Utsira formation at a depth of 800 m below the sea bed.

65

5.3: Costs

INJECTIVITY MODEL Internal Calcs: Reservoir temperature CO2 viscosity CO2 mobility CO2 injectivity Injection rate per well

Number of wells required

COST MODEL Internal Calcs: Capital costs: Site screening & evaluation, injection equipment, injection wells O&M costs: Normal daily expenses, consumables, surface maintenance, subsurface maintenance

Inputs: Reservoir depth Capital charge rate

Outputs: Total capital cost Total O&M cost Total annual cost Total cost per tonne CO2

Inputs: CO2 mass flow rate CO2 surface injection pressure Reservoir pressure Reservoir thickness Reservoir depth Reservoir permeability

PRESSURE CHANGE CALCULATION Internal Calcs: Well diameter Gravity head Friction loss Pressure change

CO2 downhole injection pressure

Figure 12: Geologic storage cost model overview diagram35

-12.21-5.59

4.87 3.82 2.93

(100)

(80)

(60)

(40)

(20)

0

20

40

60

80

100

EOR ECBMR Depleted Gas Depleted Oil Sal. Formns.

$/t C

O2

Figure 13: Costs ranges for CO2 storage options on a GHG-avoided basis.

66

The cost model for the geologic CO2 storage options can be broken down into a

number of components. First, there is a relationship for calculating the number of wells

required for a given CO2 flow rate, CO2 downhole injection pressure, and set of reservoir

parameters. Second, an iterative procedure is used to take into account the interdependent

relationship between CO2 downhole injection pressure and the number of wells. Third, a set

of capital and O&M cost factors are used to determine cost based on the number of wells

required. Each of these components is illustrated in the overview diagram in Figure 12.

The storage costs for different kinds of reservoirs are drawn from a paper published

by the LFEE at MIT35. Figure 13 summarizes the costs of the various carbon storage

technologies on a greenhouse gas-avoided basis. The points on the graphs are for a typical

base case, and the bars represent the range between representative high- and low-cost cases.

The ranges reflect the range of conditions found in the various reservoirs (depth,

permeability, etc.), the distance between source and reservoir (a range of 0–300 km here),

and the by-product prices (i.e., oil and gas).

5.4: Reservoirs and the GIS

As was mentioned earlier in this chapter, three broad categories of reservoirs were

identified and have been incorporated into the GIS include deep saline formations, oil and

gas wells and coal seams. Since technology in this arena is still developing, different data

chroniclers included information about parameters they thought were important to the

science of CCS. Also, databases identified for this study were not necessarily initially

developed for CCS studies and so were developed with a different set of characteristics

deemed important for the purpose they were being developed. A description of some of the

major databases follows.

67

5.4.1: Brine Formation Database51

Figure 14: UT BEG’s brine formations with depth and thickness data

The Bureau of Economic Geology at the University of Texas at Austin (UT-BEG)

developed the Brine-Formation Database under a grant from the Department of Energy

National Energy Technology Laboratory (DOE-NETL) in 200051. UT-BEG designed the

database to be GIS compatible and included power plant locations to match CO2 emitters

with brine formations. Figure 14 presents a GIS screen shot of the different brine formations

in this database. UT-BEG selected 21 brine formations based on specific parameters that

limited the scope of their exploration. The parameters, as listed in the documentation, were:

• Geographic distribution of CO2 sources;

• Appropriate depth, injectivity, and seal;

68

• Adequate information to characterize the target; and

• Diverse geologic properties of the pool of selected formations.

5.4.2: Gas Information System

Energy and Environmental Analysis, Inc (EEA) developed the Gas Information

System (GASIS) under contract with NETL between 1993 and 2000. The GASIS project was

intended to provide a national database of gas reservoir properties and recovery data to aid

natural gas producers in field development and exploration. EEA merged data from the

Department of Energy and Gas Research Institute’s Gas Atlas data sets, Dwight’s databases,

and other public data sources. Figure 15 shows the onshore coverage of the GASIS data.

Figure 15: Onshore areas with reservoir data in GASIS

69

5.4.3: Coal Fields of the United States

The primary dataset used in MIT’s GIS for coal reservoirs is the “Coal Fields of the

United States” published by the United States Geological Survey (USGS). This dataset is the

most complete and useful for analyzing potential reservoirs for CO2 storage in coal fields in

the United States. It is a polygon coverage representing all coal fields in the US as shown in

Figure 16. Most of the material for the conterminous United States was collected from James

Trumbull's "Coal Fields of the United States, Conterminous United States" map (sheet 1,

1960). The Gulf Coast region was updated using generalized, coal-bearing geology obtained

from State geologic maps52.

LegendCoal Fields of the US

Figure 16: Coal fields of the United States

While this dataset provides useful information for a broad overview of US CO2

storage options, it does not contain enough information for evaluating and selecting

individual project sites. The data resolution is not high enough (resolution is 1:5,000,000),

70

nor is there enough data on requisite parameters such as porosity, permeability, and other

information needed to make confident planning decisions.

5.5: Summary

A summary of the key points described in this chapter is presented below in Table 5.

Table 5: Summary of key points of CO2 storage

Reservoirs • Saline formations • Oil and gas wells

o Depleted o Non-depleted for Enhanced Oil Recovery (EOR)

• Coal seams o Unmineable coal seams o Other coal seams amenable to Enhanced Coalbed Methane Recovery

(ECBMR) Parameters/Aspects

• Depth • Capacity

o Porosity o Reservoir contact efficiency

• Injectivity o Permeability o Pressure o Thickness

• Containment o Basin hydrodynamics o Flow driving mechanisms o Natural geologic barriers o Cap rock o Tectonic settings o Seismic activity potential

Outputs for Systems Analysis • Costs • Capacities • Reservoir Containment/Integrity

Level of Analysis • Desired – calculations based on actual data • Alternate 1 – Extrapolate “play” data • Alternate 2 – Use estimated or default data

71

66:: SSYYSSTTEEMM EEVVOOLLUUTTIIOONN AANNDD SSAAMMPPLLEE CCAASSEE SSTTUUDDYY

The actual evolution of the systems methodology for evaluating sequestration options

is presented in this chapter. A Decision Support System (DSS) is developed using the Object-

Process CASE (OPCAT) tool to model the complex and interdisciplinary system. This

chapter integrates all the major steps outlined in the previous chapters in a sample problem.

This is to illustrate the methodology of evaluating CCS options for a given set of sources. A

region located mostly in the state of Mississippi and covering parts of Alabama and

Louisiana in the US was identified for this model case study. The methodology will be

applied at a later time to evaluate CCS potential in the South East Regional Carbon

Sequestration Partnership (SERCSP) and the West Coast Regional Carbon Sequestration

Partnership (WCRCSP).

6.1: OPCAT

Before describing the DSS, a short overview of OPCAT is helpful in understanding

the tool itself and the kinds of flexibility it allows in building a DSS. OPCAT is a tool for

implementing Object Process Methodology or OPM, a modeling process developed by Dov

Dori, a joint professor at the Technion, Israel and MIT53. Simply described, OPM develops

models that are a combination of structural models and information flow models such as

flowcharts. The specific nuances of OPM include:

• A comprehensive systems modeling, engineering, and lifecycle support paradigm

• Two major features:

Unification of function, structure and behavior in a single model

Bi-modal expression of the model via intuitive yet formal graphics and

equivalent natural language

72

The motivation behind the development of OPM can be summarized as:

• Need for modeling complex and interdisciplinary systems

• Need for a universal modeling, engineering, and lifecycle support approach

• Need for a simple, formal, generic paradigm for systems development.

The OPM ontology consists of two basic building blocks – entities and links. These

can be further sub-divided as:

• Entity types:

Object: A thing that exists for some time

State: A situation at which an object can be

Process: A thing that transforms an object

• Link types:

Structural link: A link denoting a persistent relation between objects

Procedural link: A link between a process and the object it transforms or

a state of that object

All the features described above have been utilized in building the DSS.

6.2: Decision Support System Model

The DSS has a required number of inputs or equivalent assumptions that are fed into

the model. There are also certain conditions or constraints that are imposed on the model so

that the outputs are within defined limits. Given the inputs and the constraints, the model

performs internal calculations on the information to produce certain outputs. The sequence of

steps from inputs to outputs is outlined below.

6.2.1: Inputs

The different inputs that go into the DSS include:

73

Location: This input defines the general area of interest for selected sources of CO2. it can

range from a simple longitude-latitude coordinate reference for a single point source to a

number of sources within a defined geographical location known as a ‘polygon’ in GIS

terminology and referred to henceforth as such. While not necessary, it is helpful to also

define a polygonal location for the different reservoirs to be considered for storage. It is not

necessary because the DSS by default looks for the cheapest reservoir in the immediate

vicinity. However, specifying a region for reservoirs frees up computational power and time

in actual practice by optimizing for reservoirs within the given region only.

Source Characteristics: This input for sources within the location specified above is itself a

function of all the parameters identified for CO2 sources in the third chapter. Recalling that

they include volume, quality, pressure, type of plant, retrofit parameters amongst others, the

output for source characteristics includes:

• Cost of capture on a per unit weight/volume of CO2 basis

• Volume/scale of CO2 emitted from the source

• Quality of CO2 emitted

Reservoir Characteristics: Similar to the sources, reservoir characteristics within the

specified location form an input to the DSS and are a function of the parameters identified for

reservoirs in the fourth chapter. These parameters include depth, thickness, capacity,

injectivity, pressure and containment parameters. All these parameters combine to generate

outputs that form the input to the DSS and are:

• Cost of storage on a per unit weight/volume of CO2 basis

• Capacity of reservoir to store CO2

• Containment aspects

74

Transportation Inputs: Within the specified location, pipeline transportation of CO2 depends

on the different parameters identified in the fifth chapter and includes throughput, length,

quality, terrain, pressure, political and regulatory consideration amongst others. These

parameters combine to produce outputs which form the inputs to the DSS and are:

• Costs of pipeline transportation of CO2 between any two ‘cells’ within the

specified location

• Capacity of a pipeline with a specified cost

• The route that the pipeline takes

6.2.2: Constraints

Constraints imposed on a model are necessary for two reasons:

• To avoid abnormal behavior of the model

• To define the level of analysis (this is described in section 6.2.4: on outputs)

To obtain a meaningful output from the DSS evaluating sequestration options, the

four major constraints that need to be imposed on the model include:

• Minimize cost of sequestration within the defined system boundaries – this is

extremely important since the system boundaries define the level of analysis and

output. For example, if transportation is considered alone, the output may be very

different for a single source-reservoir matching than if the entire lifecycle cost is

considered

• Capacity of reservoirs should match or exceed the volume of CO2 emitted from a

source over a given period of time

• Permitting and regulatory issues – these constraints will be imposed on both

reservoir siting and pipeline routing

75

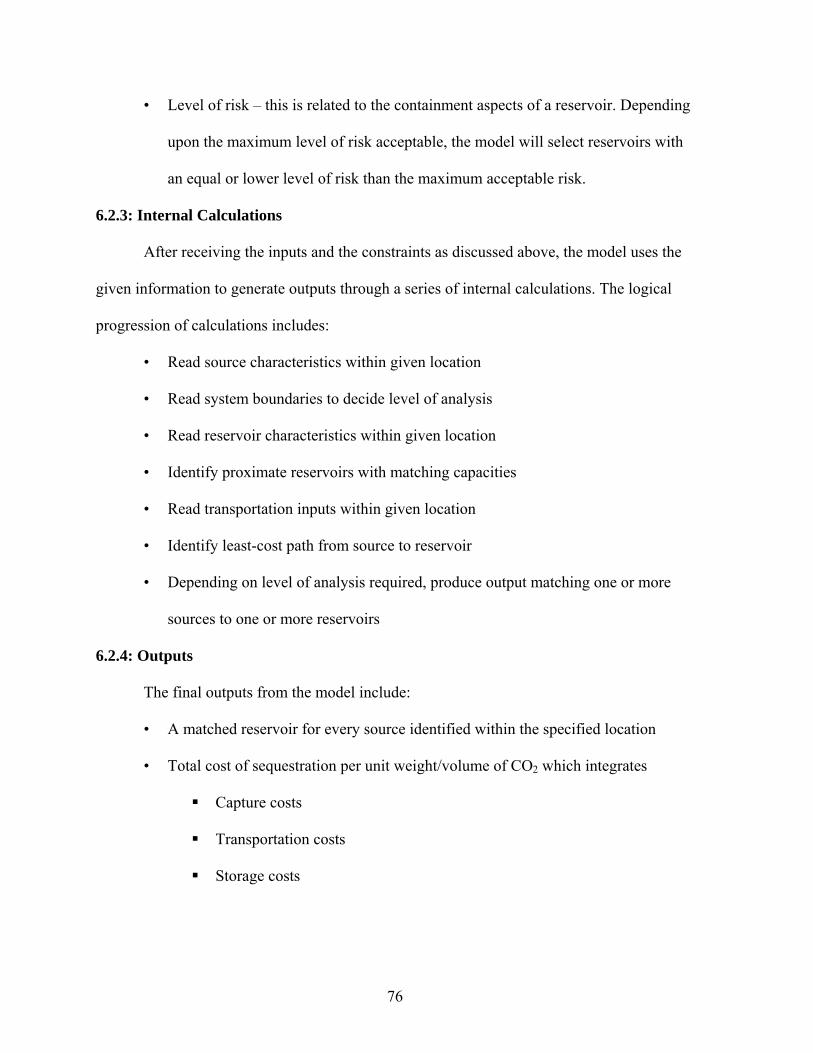
• Level of risk – this is related to the containment aspects of a reservoir. Depending

upon the maximum level of risk acceptable, the model will select reservoirs with

an equal or lower level of risk than the maximum acceptable risk.

6.2.3: Internal Calculations

After receiving the inputs and the constraints as discussed above, the model uses the

given information to generate outputs through a series of internal calculations. The logical

progression of calculations includes:

• Read source characteristics within given location

• Read system boundaries to decide level of analysis

• Read reservoir characteristics within given location

• Identify proximate reservoirs with matching capacities

• Read transportation inputs within given location

• Identify least-cost path from source to reservoir

• Depending on level of analysis required, produce output matching one or more

sources to one or more reservoirs

6.2.4: Outputs

The final outputs from the model include:

• A matched reservoir for every source identified within the specified location

• Total cost of sequestration per unit weight/volume of CO2 which integrates

Capture costs

Transportation costs

Storage costs

76

Based on the level of analysis specified, there are three different kinds of outputs that

are generated from the model:

Level 0: This is basically a one-to-one matching process where a source is

individually matched to a cheapest reservoir minimizing only the cost of transportation for

that source without any consideration for possible synergies to be gained from multiple

sources feeding to a common reservoir.

Level 1: This is the next level of many-to-one matching where several sources are

matched to one large reservoir. This has the potential of reducing the cost of transportation

by benefiting from common pipelines in an optimized network situation.

Level 2: This is the true overall system optimization where transportation, storage

costs and capacities are all considered for multiple sources and reservoirs within the specified

location producing the lowest total cost of sequestration.

6.2.5: Model Overview

Figure 17: Model overview of the DSS

77

An overview of the model built using OPCAT is presented in Figure 17. One of the

unique features of OPM is the formal graphical representation of the model and an equivalent

natural language description that is generated automatically when creating the graphical

model.

Matching consumes Source and Sink .Matching yields Matched Pair and No Matching Possible.Matching zooms into Source Viability Checking and Sink Viability Checking, as well as Sink Viable? and Source 'capturable'?.

Sink Viable? can be Yes or No .Source 'capturable'? can be Yes or No .Source Viability Checking requires Source.Source Viability Checking yields Source 'capturable'?.Sink Viability Checking requires Sink and Yes Source 'capturable'?.Sink Viability Checking yields Sink Viable?.

Figure 18: Natural language description of Figure 17

The natural language description of the DSS Figure 17 is illustrated in Figure 18.

6.3: Case Study

As has been discussed throughout this thesis, pockets of information exist about the

different aspects of geologic sequestration. As such, identifying any one location with

complete information on all sources and possible reservoirs within the region and

accompanying information on transportation parameters was not possible. Hence, a location

was chosen as a possible ‘best alternative’ given available information on all the different

aspects of sequestration and assumptions were made as required to fill in the voids. It is

worthwhile to stress that this investigation is but a first effort at integrating various research

efforts in the field of geologic carbon sequestration and as such an included case study is

mostly illustrative of the capabilities of the DSS given adequate information.

78

Figure 19: Region selected for case study.

6.3.1: Case Description and Methodology

As mentioned above, a region located mostly in the state of Mississippi and covering

parts of Alabama and Louisiana in the US was chosen as a ‘best alternative’ with reasonable

information on sources, reservoirs and transportation parameters to conduct a meaningful

analysis. An illustration of the region is shown in Figure 19 with the selected counties shaded

in yellow. Sources included both power plants and industrial processes. Two types of

reservoirs were considered: depleted gas reservoirs and a deep saline formation. There was

sufficient diversity in the topography to create different scenarios for transportation given

79

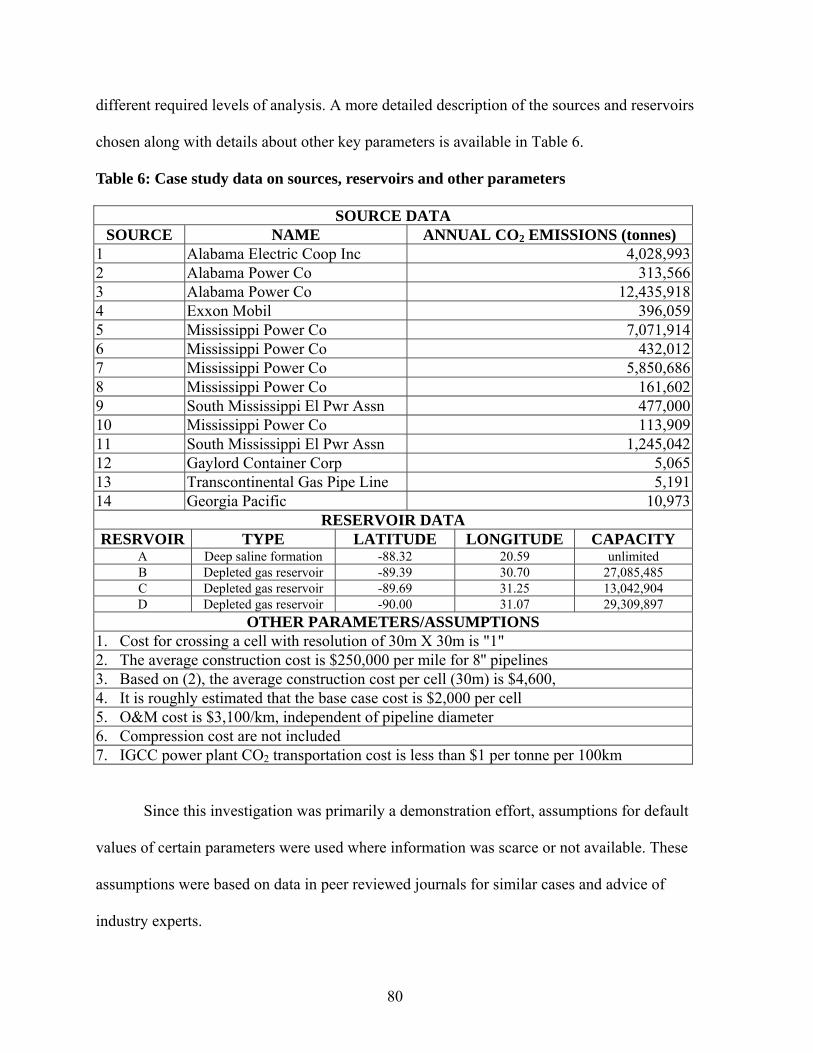
different required levels of analysis. A more detailed description of the sources and reservoirs

chosen along with details about other key parameters is available in Table 6.

Table 6: Case study data on sources, reservoirs and other parameters

SOURCE DATA SOURCE NAME ANNUAL CO2 EMISSIONS (tonnes)

1 Alabama Electric Coop Inc 4,028,9932 Alabama Power Co 313,5663 Alabama Power Co 12,435,9184 Exxon Mobil 396,0595 Mississippi Power Co 7,071,9146 Mississippi Power Co 432,0127 Mississippi Power Co 5,850,6868 Mississippi Power Co 161,6029 South Mississippi El Pwr Assn 477,00010 Mississippi Power Co 113,90911 South Mississippi El Pwr Assn 1,245,04212 Gaylord Container Corp 5,06513 Transcontinental Gas Pipe Line 5,19114 Georgia Pacific 10,973

RESERVOIR DATA RESRVOIR TYPE LATITUDE LONGITUDE CAPACITY

A Deep saline formation -88.32 20.59 unlimited B Depleted gas reservoir -89.39 30.70 27,085,485 C Depleted gas reservoir -89.69 31.25 13,042,904 D Depleted gas reservoir -90.00 31.07 29,309,897

OTHER PARAMETERS/ASSUMPTIONS 1. Cost for crossing a cell with resolution of 30m X 30m is "1" 2. The average construction cost is $250,000 per mile for 8'' pipelines 3. Based on (2), the average construction cost per cell (30m) is $4,600, 4. It is roughly estimated that the base case cost is $2,000 per cell 5. O&M cost is $3,100/km, independent of pipeline diameter 6. Compression cost are not included 7. IGCC power plant CO2 transportation cost is less than $1 per tonne per 100km

Since this investigation was primarily a demonstration effort, assumptions for default

values of certain parameters were used where information was scarce or not available. These

assumptions were based on data in peer reviewed journals for similar cases and advice of

industry experts.

80

Some of the factors that were not considered for the model included:

• Regulatory, social and political factors – these factors are difficult to quantify and

represent in a spatial format

• ROW issues - while these were not considered for this study, they have been

targeted for inclusion in future work on the GIS at MIT.

6.3.2: Results

Figure 20: Level 0 analysis based on transportation cost alone on a one-to-one basis

As discussed earlier, there are different levels of analysis that can be conducted using

the DSS. Figure 20 illustrates a Level 0 analysis where a source-reservoir matching is

conducted on a one-to-one basis minimizing the transportation cost alone. The reservoirs are

81

represented by alphabets and sources are represented by numbers. As can be seen in the

figure, within each colored zone, there is only one reservoir and any source within the zone

incurs the minimum transportation cost if matched with the reservoir within the zone. The

boundaries of any given region largely coincide with natural boundaries such as wetlands. A

detailed explanation of the costing methodology within the GIS is described in Section 4.2.1:

of the chapter on CO2 transportation.

Tran

spor

tatio

n C

ost $

0.86

/t C

O2

Tran

spor

tatio

n C

ost $

63/t

CO

2

Tran

spor

tatio

n C

ost $

0.86

/t C

O2

Tran

spor

tatio

n C

ost $

63/t

CO

2

Figure 21: Level 1 analysis based on pipeline sharing and a transportation network

A Level 1 analysis is illustrated in Figure 21 where the cost of transportation is driven

down from $ 0.86/t of CO2 to $ 0.63/t of CO2 transported. This is achieved by using a main

transportation pipeline trunk from source 1 to reservoir A and having all the other sources

within the region feeding into the main trunk pipeline. The optimization is done based on

82

transportation cost alone by minimizing the total length of pipelines in the system without

considering the capacities of the main trunk pipeline and the reservoirs.

Figure 22: Level 2 analysis optimizing both transportation and storage cost

Figure 22 illustrates a very simple Level 2 optimization where both the transportation

and storage costs are taken into account. Considering transportation cost alone, sources 10

and 11 find reservoir C as the cheapest option but if the cost of storage is included in the

calculation, reservoir B emerges as the new least total system cost option.

6.4: Conclusion

As a first effort, the results of the systems analysis were promising and laid the

framework for future efforts. As mentioned earlier, any parameter that was not considered in

83

this round of analysis but which could be deemed in the future to influence the cost of

sequestration can be added as a cost layer to the analysis. This renders the architecture of the

system modular and flexible. As with parameters, the framework for constraints is also

modular in nature and allows for the inclusion of further constraints as and when deemed

necessary. Thus, as has been discussed in the system evolution section and subsequently

illustrated in the case study, different levels of analysis with meaningful outputs can be

conducted given adequate information. This system-level analysis also identifies deficiencies

in current data hindering conducting such an analysis. Thus, as a first effort, the DSS has

illustrated that the GIS is a very promising tool to conduct systems analyses for carbon

capture and storage opportunities. Nevertheless, there exists significant opportunity to

develop on this with more complete information.

Currently, given all the factors that are considered for the analysis, the system can

calculate CO2 transportation and storage costs with high reliability. Estimates of costs for

capture are less precise and depend upon the assumptions made for the values of the different

parameters determining the cost of CO2 capture. The DSS can thus calculate the individual

costs of CO2 capture, transportation and storage and the system cost of sequestration. As the

efforts at information collection progress and are incorporated into the GIS, the outputs of the

system will become more reliable. These efforts at data collection and cataloging are being

spearheaded by federally and state funded entities such as the MIDCARB which has since

segued into NATCARB to signify its change in focus from the mid-continental US to a more

nationally oriented one. Regional partnerships such as the SERCSP and the WCRCSP have

also been contributing to these efforts.

84

77:: CCOONNCCLLUUSSIIOONNSS AANNDD RREECCOOMMMMEENNDDAATTIIOONNSS

7.1: Conclusions

As a first effort at systems analysis to obtain a view of the bigger picture, the results

look promising. The accomplishments of this investigation can be listed as:

1. Developed a systems framework for analyzing carbon sequestration options. This

helps in evaluating different options with one common indicator of lifecycle cost.

2. Implemented tools in the GIS to conduct the analysis.

3. Identified important interactions between different stages of the sequestration

process such as the matching of sources and reservoirs based on both

transportation and storage costs.

4. The systems analysis also identifies areas that warrant further research such as

storage in unmineable coal seams due to the niche opportunities that they offer.

The wide ranges in cost estimates for capture indicate the lack of data to calculate

accurately the possible cost of sequestration. The biggest advantage of a systems analysis is

the lifecycle cost of sequestration as an output. This enables the comparison of different

sequestration options on a common scale. Finally, the GIS is a promising tool for analyzing

CCS opportunities but is only as good as the underlying data driving the analysis.

7.2: Recommendations for Future Work

Recommendations at the end of this investigation include:

• More aggressive efforts at data collection and chronicling need to be undertaken

• Detailed algorithms for evaluation & optimization need to be developed

• Incorporate non-technical factors such as political sensitivity, social acceptability

into the analysis

85

RREEFFEERREENNCCEESS

Note: Dates in parenthesis immediately following internet address references indicate date the website was last accessed.

1 Environmental News Network Inc., March 15, 2001, “Satellite pictures show greenhouse effect”, http://www.enn.com/news/wire-stories/2001/03/03152001/upi_greenhouse_42528.asp (February 1, 2004)

2 UNDP, 2000, “World Energy Assessment: Energy and the Challenge of Sustainability”

3 UNFCC, Climate Change Secretariat, Bonn, 2002 “A Guide To The Climate Change Convention And Its Kyoto Protocol”

4 UNEP/WMO, 1992, “Framework Convention on Climate Change”, United Nations, Geneva

5 U.S. Department of State, Bureau of International Information, “Fact Sheet: U.S. Climate Change Policy”, http://usinfo.state.gov/gi/Archive/2003/Nov/21-668584.html (February 3, 2004)

6 Houghton, J., 1997, “Global Warming: The Complete Briefing”, Cambridge University Press

7 Herzog, Howard and Golomb, Dan, 2004, “Carbon Capture and Storage from Fossil Fuel Use” Encyclopedia of Energy, Volume 1

8 NETL Program Fact Sheets, August 2003, “Carbon Sequestration Through Enhanced Oil Recovery”

9 NETL Program Fact Sheets, March 2003, “Geologic Sequestration of CO2 in Deep, Unmineable Coalbeds: An Integrated Research and Commercial-Scale Field Demonstration Project”

10 Advanced Resources International Inc., http://www.adv-res.com/ (March 15, 2004)

11 Saline Aquifer CO2 Storage (SACS), http://www.ieagreen.org.uk/sacshome.htm (March 15, 2004)

12 Torp, Tore A. and Gale, John, 2002, “Demonstrating Storage Of Co2 In Geological Reservoirs: The Sleipner And Sacs Projects”, Proceedings, GHGT 6, pp: 311-316

13 Hovorka, Susan D. and Knox, Paul R., October 2002, “Frio Brine Sequestration Pilot in the Texas Gulf Coast”, Sixth International Conference on Greenhouse Gas Control Technologies, Kyoto, Japan

86

14 University of Texas at Austin, Gulf Coast Carbon Center, Bureau of Economic Geology, November 2003, “Field Experiment for CO2 Sequestration”, http://www.beg.utexas.edu/environqlty/co2seq/fieldexperiment.htm (March 29, 2004)

15 Heinrich, J.J., H. J. Herzog, and D.M. Reiner, December 2003, "Environmental Assessment of Geologic Storage of CO2, MIT LFEE 2003-002 RP

16 A Research Program on the Geological Disposal of Carbon Dioxide, http://www.apcrc.com.au/GreenhouseFrameset.htm (January 29, 2004)

17 Bradshaw, J., Bradshaw, B. E., Allinson, G., Rigg A. J., Nguyen, V. and Spencer, L., 2003, “The Potential for Geologic Sequestration of CO2 in Australia: Primary Findings and Implications for New Gas Field Development”, APPEA Journal

18 Egberts, P.J.P., Keppel, J.F., Wildenborg, A.F.B, Peersmann, M.R.H.E., Hendriks, C.A., van der Waart, A.S. and Byrman, C., 2002, “A DECISION SUPPORT SYSTEM FOR UNDERGROUND CO2 SEQUESTRATION”, Proceedings, GHGT 6, pp: 651-655

19 Dahowski, R., Dooley, J., Brown, D., Mizoguchi, A. and Shiozaki, M., 2003, “Understanding Carbon Sequestration Options in the United States: Capabilities of a Carbon Management Geographic Information System”, Proceedings, Second Annual Conference on Carbon Sequestration

20 Dahowski, R., Dooley, J., Brown, D. and Stephan, A., 2001, “Economic Screening of Geologic Sequestration Options in the United States with a Carbon Management Geographic Information System”, Proceedings of the Eighteenth Annual International Pittsburgh Coal Conference, Newcastle, NSW, Australia,

21 University of Texas, Bureau of Economic Geology, “Texas Geologic Sink Characterization Efforts for Carbon Sequestration Utilizing Play Analysis”

22 Herzog, Howard, 2004, “Carbon Capture and Storage from Fossil Fuel Use”, Environmental Science & Technology, Volume 35 , Issue 7, pp. 148 A – 153 A

23 Gale, John, 2002, “Overview of CO2 emission sources, potential, transport and geographical distribution of storage possibilities”, Proceedings, IPCC Workshop on Carbon Dioxide Capture and Storage, pp 16-29

24 OECD/IEA, 2003, “CO2 Capture At Power Stations and Other Major Point Sources”

25 Herzog, Howard, Drake, Elisabeth and Eric Adams, 1997, “CO2 Capture, Reuse, and Storage Technologies for Mitigating Global Climate Change”, Final Report, DOE Order No. DE-AF22-96PC01257

26 Thambimuthu, Kelly, Davison, John and Gupta, Murlidhar, 2002, “CO2 Capture and Reuse”, Proceedings, IPCC Workshop on Carbon Dioxide Capture and Storage, pp 32-52

87

27 IEA Greenhouse Gas R&D Program, 2003, “Potential for Improvements in Gasification Combined Cycle Power Generation with CO2 Capture”, report PH4/19

28 Gray, D. and G. Tomlinson, 2003, “Hydrogen from Coal”, Mitretek Technical Paper MTR-2003-13, prepared for U.S.DOE/NETL

29 NETL, 2002: Advanced fossil power systems comparison study, Final report prepared for NETL by E.L. Parsons (NETL, Morgantown, WV), W.W. Shelton and J.L. Lyons (EG&G Technical Services, Inc., Morgantown, WV), December.

30 Parsons Infrastructure & Technology Group, Inc., 2002b, “Updated cost and performance estimates for fossil fuel power plants with CO2 removal”, Report under Contract No. DE-AM26-99FT40465 to U.S.DOE/NETL

31 Rao, A. B., E. S. Rubin and M. Morgan, 2003, “Evaluation of potential cost reductions from improved CO2 capture systems”, Presented at the 2nd Annual Conference on Carbon Sequestration, Alexandria, VA, USA, 5-8 May.

32 EPA/eGRID http://www.epa.gov/cleanenergy/egrid.htm (April 23, 2004)

33 Hendriks, Chris, March 2002, “Building the Cost Curve for CO2 Storage: Sources of CO2” Ecofys.

34 Freund, Paul and Davison, John, 2002, “General overview of costs”, Proceedings, IPCC Workshop on Carbon Dioxide Capture and Storage, pp 79-94

35 Heddle, Gemma, Herzog, Howard and Klett, Michael, 2003, “THE ECONOMICS OF CO2 STORAGE”, MIT LFEE 2003-003 RP

36 Oil & Gas Journal, March 20, 2000, “OGJ Special – Worldwide EOR Survey 2000,” pp: 44-61

37 Hattenbach, R.P., Wilson, M. and K. Brown, “Capture of carbon dioxide from coal combustion and its utilization for enhanced oil recovery,” Greenhouse Gas Control Technologies, Elsevier Science, New York, 1999, pp: 217-221

38 True, W.R., Aug. 31, 1998, “Weather, construction inflation could squeeze North American pipelines”, Oil & Gas Journal

39 NOAA, National Geophysical Data Center (NGDC/NOAA), http://www.ngdc.noaa.gov/mgg/global/etopo5.HTML (April 29, 2004)

40 US Geological Survey (USGS) http://nationalatlas.gov/statesm.html, http://nationalatlas.gov/county00m.html (April 29, 2004)

41 U.S. Census Bureau http://nationalatlas.gov/census2000m.html (April 1, 2004)

88

42 US Geological Survey (USGS) http://nationalatlas.gov/hydrom.html (April 1, 2004)

43 US Geological Survey (USGS) http://nationalatlas.gov/railroadsm.html (April 1, 2004)

44 US Geological Survey (USGS) http://nationalatlas.gov/roadsm.html (April 1, 2004)

45 US Geological Survey (USGS), EROS Data Center http://edc.usgs.gov/products/landcover/lulc.html (April 1, 2004)

46 Bachu S., 2000, “Sequestration of CO2 in geological media: criteria and approach for site selection in response to climate change”, Energy Conversion and Management, v. 41, pp 953-970.

47 Holloway, S. and Savage, D., 1993, “The potential for aquifer disposal of carbon dioxide in the UK”, Energy Conversion and Management, v. 34, pp 925-932

48 Hendriks, C. A. and Blok, K., 1993, “Underground Storage of Carbon Dioxide”, Energy Conversion and Management, v. 34, pp: 949-57

49 Kuuskraa, Vello A., 2004, “Estimating CO2 Storage Capacity in Saline Aquifers”, Proceedings, Third Annual Conference on Carbon Sequestration

50 Law, D. and Bachu, S., 1996, “Hydrogeological and numerical analysis of CO2 disposal in deep aquifers in the Alberta sedimentary basin”, Energy Conversion and Management, v. 37, pp: 1167-74.

51 Hovorka, Susan S. D., Martha M. L. Romero, Andrew A. G. Warne, William W. A. Ambrose, Thomas T. A. Tremblay, Ramon R. H. Treviño, and Douglas Sasson, 2000, “Sequestration of Greenhouse Gases in Brine Formations”, http://www.beg.utexas.edu/environqlty/co2seq/dispslsaln.htm (March 15, 2004)

52 US Geological Survey (USGS) http://nationalatlas.gov/coalfdm.html (April 1, 2004)

53 Dov Dori, Faculty of Industrial Engineering and Management, Technion, Israel Institute of Technology, Haifa, Israel, and research affiliate at MIT Cambridge, MA.

89


Recommended