30
•

Loughborough UniversityInstitutional Repository
A test method anddeterioration model for
joints and cracks in concreteslabs
This item was submitted to Loughborough University's Institutional Repositoryby the/an author.
Citation: ARNOLD, S.J. ... et al, 2005. A test method and deteriorationmodel for joints and cracks in concrete slabs. Cement and Concrete Research,35 (12), pp. 2371-2383 [doi:10.1016/j.cemconres.2005.08.002]
Additional Information:
• This article was published in the journal, Cement and ConcreteResearch [ c© Elsevier] and the definitive version is available at:http://www.sciencedirect.com/science/journal/00088846
Metadata Record: https://dspace.lboro.ac.uk/2134/3901
Publisher: c© Elsevier
Please cite the published version.
This item was submitted to Loughborough’s Institutional Repository (https://dspace.lboro.ac.uk/) by the author and is made available under the
following Creative Commons Licence conditions.
For the full text of this licence, please go to: http://creativecommons.org/licenses/by-nc-nd/2.5/

1
A Test Method and Deterioration Model for Joints and Cracks in Concrete Slabs
Stuart Arnolda, Paul Flemingb, Simon Austinb, Peter Robinsb
a) Scott Wilson Pavement Engineering Ltd, 9/10 Faraday Building, Nottingham Science and Technology Park,
University Boulevard, Nottingham, NG7 2QP
b) Department of Civil and Building Engineering, Loughborough University, Loughborough, Leicestershire, LE11 3TU
Keywords: (C) Cycles, (C) Degradation, (C) Durability, (C) Fatigue, (E) Concrete
Abstract
This paper reports on the development of a laboratory test method to assess the deterioration of
concrete cracks and joints under low intensity, high cycle loading, typical of that found in industrial
flooring, external hardstandings and rigid pavements. The half-scale prism specimen enables the
impact of crack geometry, reinforcement and load magnitude to be assessed in relation to load transfer
deterioration, without the need for full scale testing. Each element of the testing procedure has been
developed to represent site conditions in respect to crack development, loading and support. A
selection of the test results are presented which indicate that joint/crack deterioration consists of four
distinct phases, each controlled by a different mechanism of material degradation. This information can
be used to enhance understanding of joint/crack behaviour and their failure mechanisms, hence
improving design and maintenance procedures.
1. Introduction
The load transfer mechanisms across any crack or joint in an internal or external hardstanding is
essential to the structural capacity of the slab. If this deteriorates for any reason then there is a much
greater risk of failure or serviceability problems, such as faulting (change in level across the crack),
excessive deformation or further cracking. The behaviour assessment and correct simulation of each
joint type with respect to load magnitude, crack orientation and long-term fatigue is therefore essential
to enable designers to accurately predict slab response.
Many of the previous test methods examining small-scale monotonic or cyclic joint/crack load transfer
have employed a singularly cracked specimen. Valle and Buyukozturk [1], Millard and Johnson [2] and

2
others, have used a rectangular section with a shear plane induced through the centre. This arrangement
is only of use for single or low numbers of repetition of load due to the method of horizontal restraint.
Measurements taken during this testing showed signs of crack widening caused by stress development
as aggregate particles were forced over each other. This method of normal restraint also creates rotation
due to the eccentric loading, a difficult phenomenon to prevent in a singularly cracked specimen.
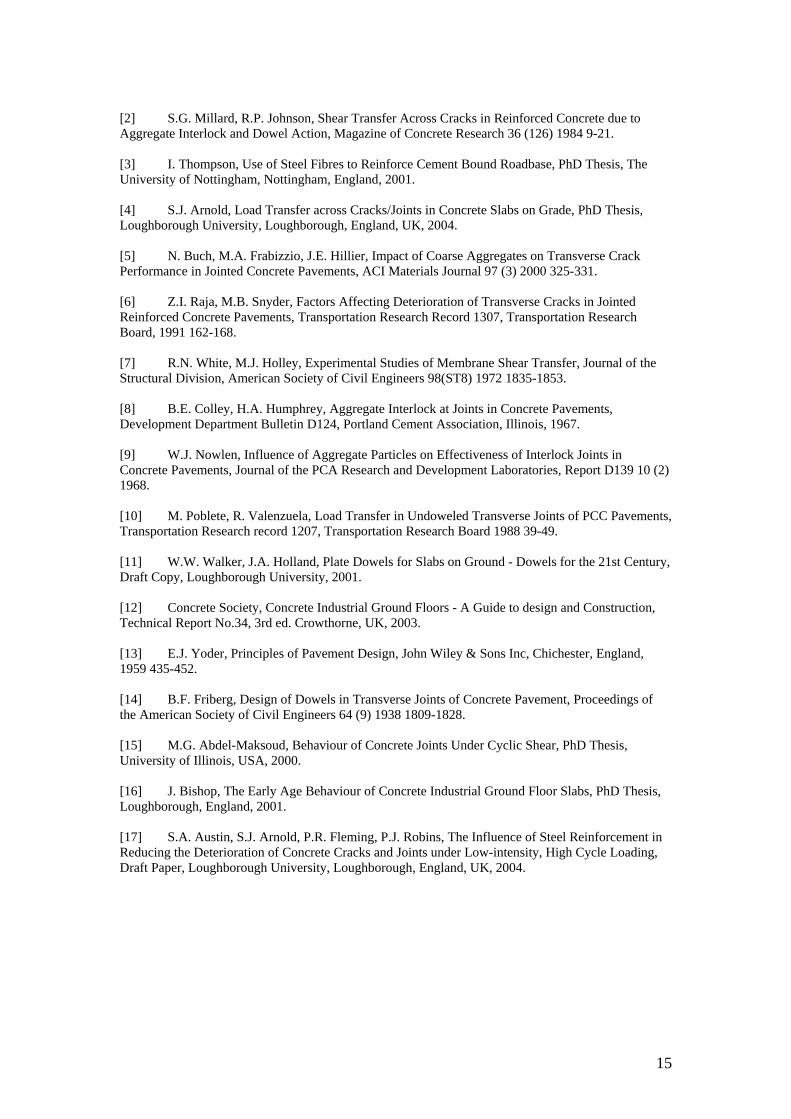
Similar to the work of Thompson [3], this testing utilised a double cracked shear specimen (Figure 1).
The method requires a controlled crack to be induced either side of the load application position. The
central section is then fixed to a loading ram with the end segments rigidly clamped against a stable
surface. This caused a load differential between each side of the crack creating a double shear stress,
and a reduced risk of rotation.
The research presented here describes the development of a laboratory testing facility used to examine
the degradation of aggregate interlock load transfer caused by repeated load. It describes the test
method in detail and indicates how each of the test parameters was altered to provide a simulation of
the actions and deterioration models typical of a concrete joint or crack in a hardstanding. It also shows
a typical output for a four phase failed specimen, along with a comparison of reinforcement types and
quantities.
2. Rig Development
2.1 Laboratory Testing
As stated in Section 1, the laboratory testing undertaken in this research utilised a double cracked shear
specimen. Although this type of crack spacing is not typical of that found within a concrete slab
configuration, symmetrical degradation across both cracks produces an equivalent behaviour to a
singularly cracked specimen.
To ensure representative crack behaviour was produced, it was important that the symmetrical
deterioration behaviour of the two cracks was confirmed. LVDT’s were placed across both crack faces
with any variation in differential displacement indicating uneven crack performance. In all cases
3
specimens exhibiting differentials across the crack greater than 0.2mm where eliminated from any
further analysis, preventing dominant crack behaviour affecting the results.
Loading of the specimen was provided by a (Dartec) cyclic loading test machine, which could apply
the required load magnitude and cycle rate. A depth of 100mm was used for the prism, as this was a
lower bound for a 150mm slab with 1/3 saw cut. The width had to represent a typical section of the slab
incorporating a sufficient blend of concrete constituent materials (most importantly coarse aggregate
and steel fibre). As the aggregate used was below 20mm, with a maximum fibre length of 60mm, a
value of 100mm was chosen as being fully representative and having limited scale effects. A 400mm
prism length enabled the central 100mm section to be fixed to the load applicator, whilst providing
sufficient end strapping to the reaction frame.
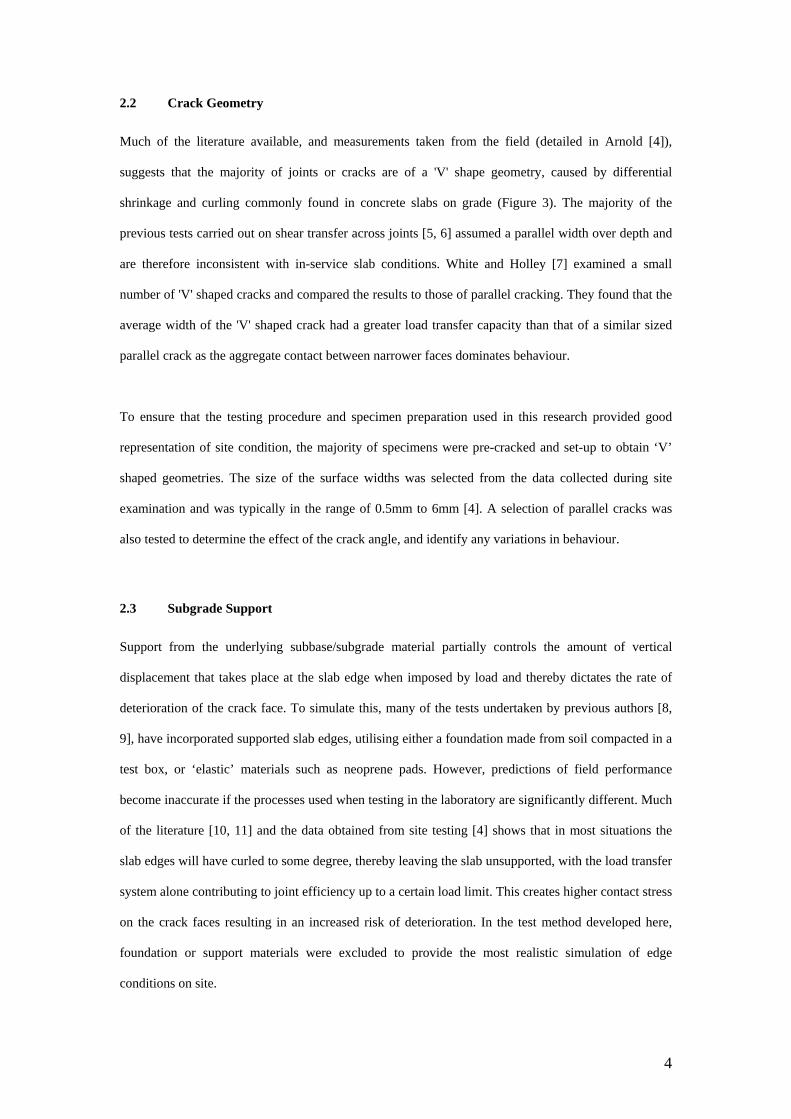
To simulate the type of loading found, and the degradation mechanisms within, a crack or joint in a
concrete slab on grade, load was applied in both a positive (downward) and negative (upward)
direction. Figure 2 demonstrates how each laboratory simulation position related to that occurring
within a typical site. Position 1 is an unloaded case whereby there is no movement. When the central
block is moved in a positive direction (position 2), the left hand side of the specimen represents a slab
load on the leave side, whereas the specimen right hand side represents a slab load on the approach
side. As the central load moves in a negative direction (position 3) the left hand side of the specimen
represents a load on the approach side, with the right hand side representing a load on the leave side.
This approach ensured that both the left and right hand sides of the specimen simulated a wheel load
crossing the joint in either direction, and was therefore fully characteristic of the contact stresses acting
across a typical in-service joint.
Within an in-service situation, loading at the end of a slab will cause bending, resulting in a gradual
decrease in crack width as load is applied. Crack width is a significant factor in the degree of load
transfer and differential displacement occurring within the crack; however, the point of rotation will be
sufficiently far back from the crack edge (in excess of 1m) so that any horizontal movement caused by
slab bending will be insignificant in comparison to the original crack width set. The aforementioned
method of slab loading was therefore acceptable for simulating in-situ crack behaviour.
4
2.2 Crack Geometry
Much of the literature available, and measurements taken from the field (detailed in Arnold [4]),
suggests that the majority of joints or cracks are of a 'V' shape geometry, caused by differential
shrinkage and curling commonly found in concrete slabs on grade (Figure 3). The majority of the
previous tests carried out on shear transfer across joints [5, 6] assumed a parallel width over depth and
are therefore inconsistent with in-service slab conditions. White and Holley [7] examined a small
number of 'V' shaped cracks and compared the results to those of parallel cracking. They found that the
average width of the 'V' shaped crack had a greater load transfer capacity than that of a similar sized
parallel crack as the aggregate contact between narrower faces dominates behaviour.
To ensure that the testing procedure and specimen preparation used in this research provided good
representation of site condition, the majority of specimens were pre-cracked and set-up to obtain ‘V’
shaped geometries. The size of the surface widths was selected from the data collected during site
examination and was typically in the range of 0.5mm to 6mm [4]. A selection of parallel cracks was
also tested to determine the effect of the crack angle, and identify any variations in behaviour.
2.3 Subgrade Support
Support from the underlying subbase/subgrade material partially controls the amount of vertical
displacement that takes place at the slab edge when imposed by load and thereby dictates the rate of
deterioration of the crack face. To simulate this, many of the tests undertaken by previous authors [8,
9], have incorporated supported slab edges, utilising either a foundation made from soil compacted in a
test box, or ‘elastic’ materials such as neoprene pads. However, predictions of field performance
become inaccurate if the processes used when testing in the laboratory are significantly different. Much
of the literature [10, 11] and the data obtained from site testing [4] shows that in most situations the
slab edges will have curled to some degree, thereby leaving the slab unsupported, with the load transfer
system alone contributing to joint efficiency up to a certain load limit. This creates higher contact stress
on the crack faces resulting in an increased risk of deterioration. In the test method developed here,
foundation or support materials were excluded to provide the most realistic simulation of edge
conditions on site.
5
2.4 Load Magnitude
The magnitude of loading has been shown to have a major influence on the rate of concrete crack
degradation [8]. A suitable value was therefore essential to represent that occurring within the field.
The majority of previous tests on full-scale slabs have used a 40 to 50kN load over a cross sectional
area of around 0.2m2, generating a contact stress in the region of 200 to 250kPa [8]. The loading found
on internal floor slabs varies greatly, but example values given in the literature vary between 42 and
60kN [12]. On external slabs this can regularly exceed 100kN depending on the type of vehicle used,
with road pavements designed for an 80kN standard axle (40kN per wheel), although the actual loads
can often be much higher. A reasonable value for a normalised wheel load is therefore 50kN, with
25kN and 75kN representing low and high conditions.
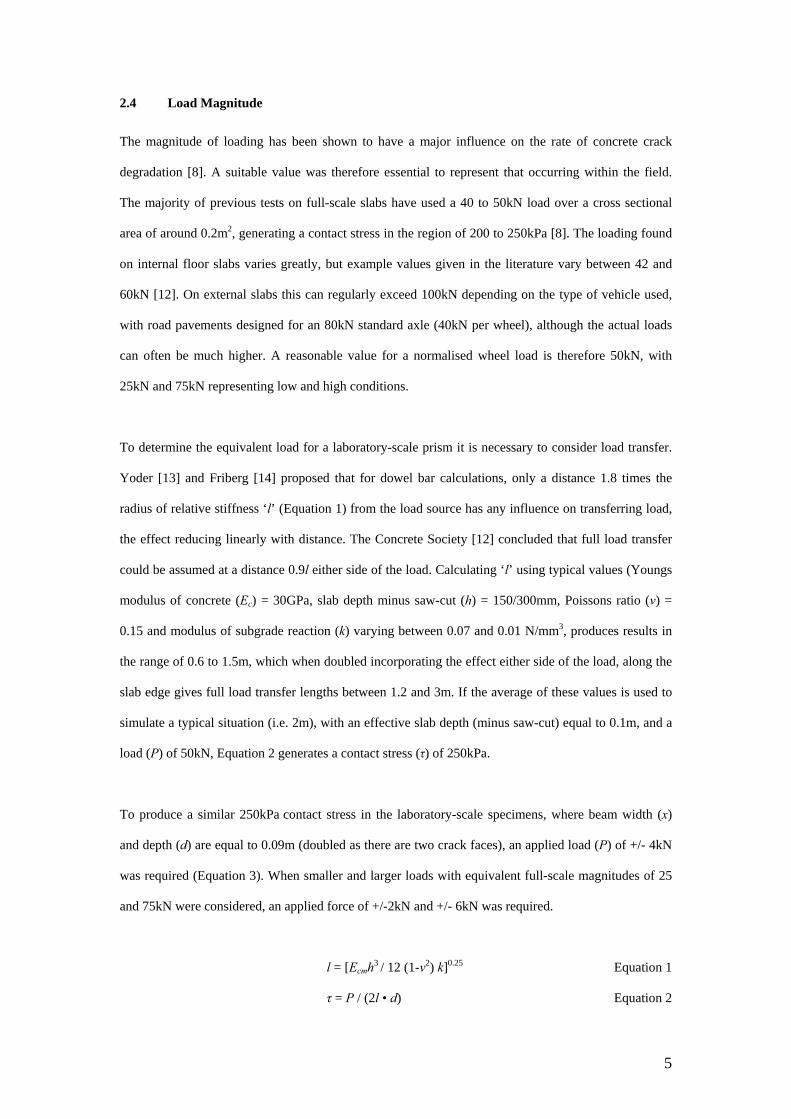
To determine the equivalent load for a laboratory-scale prism it is necessary to consider load transfer.
Yoder [13] and Friberg [14] proposed that for dowel bar calculations, only a distance 1.8 times the
radius of relative stiffness ‘l’ (Equation 1) from the load source has any influence on transferring load,
the effect reducing linearly with distance. The Concrete Society [12] concluded that full load transfer
could be assumed at a distance 0.9l either side of the load. Calculating ‘l’ using typical values (Youngs
modulus of concrete (Ec) = 30GPa, slab depth minus saw-cut (h) = 150/300mm, Poissons ratio (v) =
0.15 and modulus of subgrade reaction (k) varying between 0.07 and 0.01 N/mm3, produces results in
the range of 0.6 to 1.5m, which when doubled incorporating the effect either side of the load, along the
slab edge gives full load transfer lengths between 1.2 and 3m. If the average of these values is used to
simulate a typical situation (i.e. 2m), with an effective slab depth (minus saw-cut) equal to 0.1m, and a
load (P) of 50kN, Equation 2 generates a contact stress (τ) of 250kPa.
To produce a similar 250kPa contact stress in the laboratory-scale specimens, where beam width (x)
and depth (d) are equal to 0.09m (doubled as there are two crack faces), an applied load (P) of +/- 4kN
was required (Equation 3). When smaller and larger loads with equivalent full-scale magnitudes of 25
and 75kN were considered, an applied force of +/-2kN and +/- 6kN was required.
l = [Ecmh3 / 12 (1-v2) k]0.25 Equation 1
τ = P / (2l • d) Equation 2
6
P = 2τ (x • d) Equation 3
2.5 Loading repetition
The crack or joint of a slab may be subjected to hundreds of load repetitions every day, resulting in
many millions of cycles throughout its expected lifespan. Given the research period and typical time-
spans available for testing, it was impractical for loading to continue for a full life cycle and therefore a
representative value had to be adopted. Colley and Humphrey [8] tested large-scale slabs for up to one
million cycles and concluded that 90% of the degradation will have occurred within the first 500,000
cycles. Abdel-Maksoud [15] conducted similar tests on smaller samples at cycle numbers up to
300,000 cycles, at which point the increase in degradation appeared to have ceased. Thompson [3]
examined cement bound materials and stopped testing after 10,000 cycles as the gradient of shear slip
displacement had reduced dramatically.
Due to the range of load cycles used in the tests reviewed, 15 trial tests were conducted with the
proposed test method to ascertain the most appropriate number for this research. A minimum of
250,000 cycles was chosen initially, with a further 250,000 applied on 5 specimens to examine longer-
term deterioration. At least 75% of the 500,000 cycles differential displacement occurred within the
first 250,000 cycles, with 8 specimens failing completely. This level of repetition was therefore
selected as an appropriate representation of final degradation.
In the majority of experiments the displacement/cycle gradient was found to reduce to negligible values
towards the end of the test. However, in a few samples appreciable levels of deterioration were still
visible as indicated by the steady increase in gradient. In these circumstances the test was continued
until a horizontal gradient was found (normally shortly after), although the 250,000 cycle data was still
used for comparison during analysis.
2.6 Load rate
Colley and Humphrey [8] measured the loading pattern of a joint as a vehicle travels over at
approximately 50kph. This required the approach slab to be loaded from zero to maximum in 0.25
seconds, and then instantaneously removed. On completion the leave slab was immediately loaded and
7
gradually reduced to zero in 0.25 seconds, resulting in a total cycle length of 0.5 seconds. Due to the
nature of the small-scale tests, and the limitations of the Dartec testing machine, it was not possible to
fully replicate the approach used by Colley and Humphrey [8]; however, a sinusoidal curve that
completes a full cycle in 0.5 seconds was employed (Figure 4). Abdel-Maksoud [15] concluded from
his work on cyclic loading that the load rate has very little impact on degradation results unless weak
aggregate is used, and therefore this approach to loading was considered to be acceptable.
3. Test Specimen Preparation
3.1 Specimen Production
The specimens were constructed using the concrete mix specified in Table 1. This was similar to that
identified in several steel fibre reinforced internal floor slabs constructed within the past 5 years. Three
hook end steel fibre types with aspect ratios of 48, 67 and 80, and a tensile strength of 1000N/mm2,
were incorporated into the mix where required, with a single bar of A142 steel fabric or 7mm
reinforcement bar also used for the relevant tests. Each specimen was stripped after 24 hours and water
cured at 20oC for a minimum of 28 days. The specimens were then tested as soon as possible after this
28 day curing period, with a maximum limit until the first test of 42 days. Specimens within the same
batch were tested consecutively, limiting the variation in age to 12 days.
3.2 Crack Timing
The test prisms needed to be pre-cracked prior to testing in the cyclic loading rig. Work carried out by
Abdel-Maksoud [15] concluded that the formation of a crack is highly dependent upon the time at
which it is instigated. When formed early in the life of the concrete i.e. within 48 hours, it is the bond
between aggregate and cement paste which breaks down. After this period the bond has had time to
strengthen and an increased percentage of cracking will occur through the aggregate. This change in
crack type causes large variation in the roughness of the face and therefore affects aggregate interlock
[15]. The Concrete Society [12] has determined that cracking in concrete floor joints generally occurs
in the first 24 to 48 hours of slab life when the concrete has limited strength but is subjected to tensile
stress. This leads to matrix cracking producing the more roughened surface described above. The test
prisms were therefore also pre-cracked at this early time period. As the crack width required for each
8
test would not be known at such an early stage, each beam was initially cracked to the smallest 0.7mm
surface width and then enlarged once the required test width required was known. This enabled the
final measurement to be determined later on in the testing schedule, but ensured the profile would
reflect that of an early-age crack.
3.3 Crack Technique
The method of crack formation has been found to influence the roughness of the crack face [15].
Abdel-Maksoud [15] criticised the techniques used by other researchers for not providing suitable
simulation to that found on in-service slabs. He suggested that a three point bending technique would
produce a much smoother face compared to a true tensile crack, caused by crack formation through the
aggregate rather than around it and resulting in a decrease in shear transfer available through interlock.
The assumption is that crack development in slabs on grade is instigated from a true tensile stress
caused by shrinkage. Walker and Holland [11] have stated that cracking is often created by curling of
the concrete slab rather than direct shrinkage, resulting in a mixture of both tension and flexural forces.
From the monitoring of cracks in-situ by Arnold [4] and the literature reviewed [10, 16], it has been
shown that the geometry of a crack or joint in concrete slabs is generally 'V' shaped due to differential
shrinkage. A method was therefore required to enable this crack geometry to be re-produced in small-
scale prisms. Thompson [3] developed a simple three-point bending crack induction method proven to
produce a vertical crack continuous across the specimen. This involved incremental loading at the
crack location until the equipment control software detected a load reduction, at which point loading
ceased and a crack was assumed. The beam was then rotated 180 degrees and reloaded enabling a
parallel crack to develop. Examination of different methods of crack induction resulted in the method
suggested by Thompson [3] being used as it could easily be adapted to produce a 'V' shaped crack
through loading of one side only.
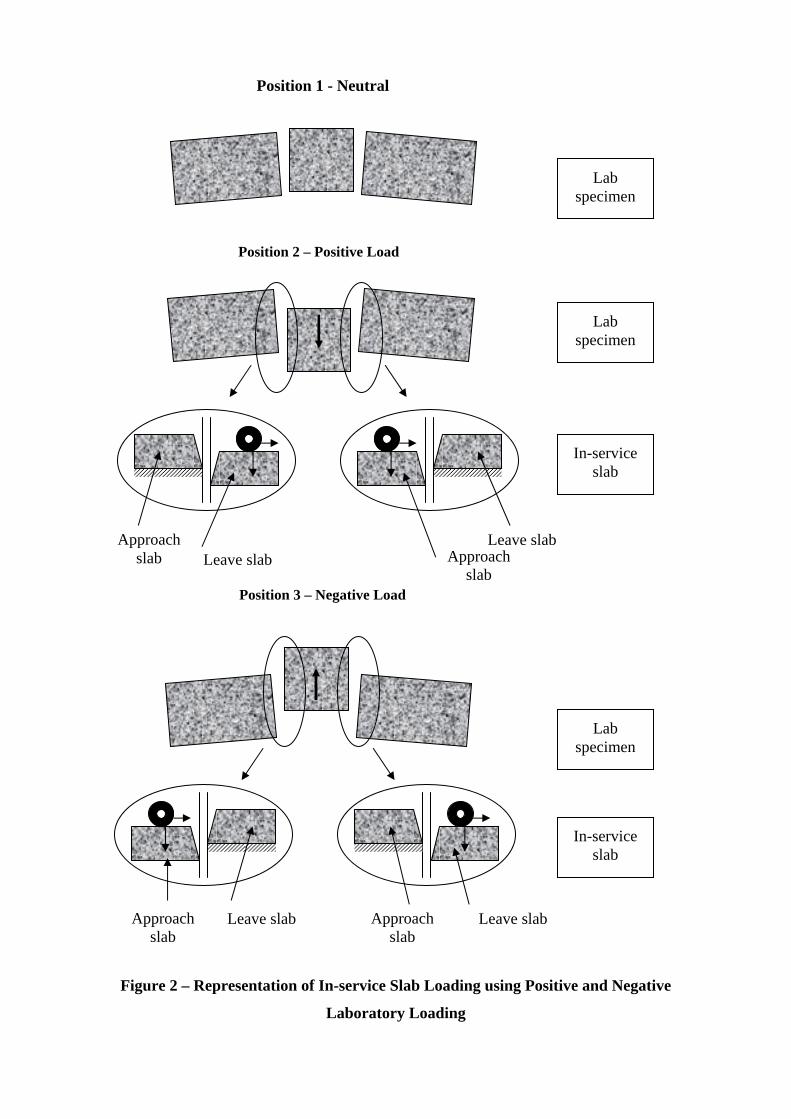
The modified technique involved sawing to a depth of approximately 5mm around the circumference
of the beam to enable the crack positions to be set. The beam was then placed on steel blocks and shims
set 90mm either side of the saw cut. A similar sized block, but with no shim, was placed directly
underneath the saw cut and a round steel bar placed on top. Load was then applied at a controlled rate

9
creating a flexural crack increasing in size until it hit the block underneath, at which point all load was
removed. For the second saw cut position the beam was repositioned and cracked in a similar manner.
The method is shown diagrammatically in Figure 5.
3.4 Crack Width Control
A series of trial tests was undertaken to examine the applicability and accuracy of the cracking
technique. A predicted opening was calculated for several shim sizes using standard geometrical rules.
Demec pips were then placed across each of the notches (10mm from the top and bottom of the
specimen) and measurements taken before and after crack formation. Extrapolation of these
measurements enabled top and bottom openings to be calculated (equivalent to the surface and base of
a slab).
The results demonstrated that the cracking method produced consistent and reproducible results, but
with smaller surface crack widths than predicted (Figure 6). The experimental results indicate that the
crack width obtained is 1.73 times larger than the shim used (with a correlation coefficient of 0.92).
This is significantly lower than the predicted value of 2.22 times the shim size. On inspection the crack
was found to close slightly once loading ceased due to the resistance of the reinforcement. To avoid
this affecting the results during the cyclic load testing, the pre-cracking width was set 1 shim (0.66mm
surface crack width) smaller than required. This allowed the final crack size to be formed when
clamping the beam in the cyclic load test rig, ensuring that closure and slack within the fibres or
reinforcement did not influence the results.
Testing was also undertaken to confirm that the cracks created in the rig were linear (i.e. did not open
up proportionally more in the top section of the prism compared to the bottom). Demec pips were
placed at 10mm intervals across both sides of the two cracks and measurements taken before and after
loading. An almost perfectly linear relationship was found with an r2 value of 0.92.

10
4. Test procedure
The test rig consisted of two steel side blocks on which the relevant shim combinations were placed,
with the test prism positioned on top. All were rigidly clamped to the test frame, forcing the beam into
an angled position and opening the cracks to the required size and geometry. The central section was
strapped to the crosshead via a 50kN load cell, which was linked directly back into the Dartec test
machine allowing load magnitude to be monitored and adjusted as required (Figure 7). Two linear
variable differential transducers (LVDT’s) were mounted vertically on the front face of the concrete
specimen with one vertical and one horizontal mounted on the rear (Figure 8). This enabled vertical
and horizontal displacement and rotation to be monitored throughout the test.
Data from the cyclic loading tests was recorded with a Campbell Scientific CR10X data logger and the
PC208 computer software. At each 5 minute (600 cycle) interval, data was collected for 0.5 seconds,
enabling one complete 2Hz load cycle to be recorded. During this period fifty LVDT and load readings
were taken.
The maximum and minimum displacements were then determined from each cycle, and plotted against
cycle number to show the effect of crack degradation (Figure 9). The difference between each
maximum and minimum value for an individual cycle was calculated and plotted against cycle number
to monitor the vertical crack movement and deterioration. Plots of individual cycles were also
examined where required to determine the source of the joints load resistance.
Visual examinations were made of the specimens periodically throughout each test. This involved
assessing the amount, size and type of any ejected material caused by deterioration of the crack face. In
fibre-reinforced specimens the behaviour and failure mode of the fibre could also be identified by
examining those close to the prism surface. Once the test was complete the specimen was broken open
across the crack face (if reinforcement was still holding it together) and the visual condition identified.
This could include excessive face cracking, aggregate looseness or loss of reinforcement bond.

11
5. Joint Behaviour
5.1 Specimens Tested
In total, 82 specimens were tested over the course of the research period. Table 2a provides the
composition of each specimen mix, with Table 2b indicating the crack widths at which each specimen
type was tested.
5.2 Joint Failure
Two key types of evidence were examined to build a picture of joint behaviour within a slab resisting
cyclic loading: the magnitude of, and change in, the vertical movement (i.e. the maximum differential
displacement of each face of the joint during a cycle), and the shape of the time/displacement plot
(which is indicative of how load is being transferred between the two crack faces). Observing these
parameters over time enabled identification of transition points between phases of behaviour and hence
development of a simple model of joint deterioration.
As stated earlier, each prism was tested up to 250,000 cycles, with some specimens continued for up to
500,000 cycles to examine longer-term deterioration patterns. Sixteen specimens failed within the
planned cycle limit with load transfer becoming negligible and displacements very large, limited only
by the restraints of the loading apparatus. The differential displacement at which the specimens began
to degrade rapidly varied from 0.6 to 1.14mm, with a mean of 0.85mm and standard deviation of 0.28.
A lower bound of 1.6mm was identified as the boundary for load transfer failure. In these situations the
number of cycles to failure provided some indication of the strength and durability of the joints load
transfer system.
5.3 Phases of Deterioration
The sixteen specimens that failed completely helped identify four distinct phases of deterioration, with
the displacement differential versus cycle plots producing similar patterns of behaviour (Figure 10).
During phase I, rapid deterioration occurred resulting in a steep gradient. After approximately 10,000
cycles the joint stabilised and moved into phase II where a much lower and approximately linear
12
degradation was observed. These two phases were seen in all 82 specimens tested regardless of the
reinforcement type and quantity used. In the tests causing specimen failure, phase III was identifiable,
whereby the differential displacement increases until reaching a magnitude of approximately 1.2mm.
At this point the specimen enters phase IV where the displacements increase rapidly and failure is
likely to occur within the next 10,000 cycles.
This four phase behaviour was similar regardless of the crack width used, fibre reinforcement quantity
and load magnitude. The main difference between the specimens was the rate at which the specimens
reached the different phases, with those containing reinforcement at the highest quantity, the lowest
loading magnitude and smallest crack width, withstanding greater load cycles before moving into the
proceeding phase. However, the magnitude of differential displacement at which the deterioration
phases change varies only slightly between each phase.
5.4 Mechanism of Load Transfer
The shape of the differential displacement versus cycle number plot is influenced by the reinforcement
type/quantity and changing aggregate interlock mechanisms as the system degrades. From this, and
observations of the joints, it is possible to summarise joint and crack behaviour.
During phase I the mortar deteriorates quickly, it being a relatively weak material. Once this has
transpired the increase in deflection slows due to the greater strength and bonding of the larger
aggregate particles (phase II). As failure commences in phase III the aggregate begins to debond from
the surrounding mortar, cracks in the matrix are initialised and the concrete face begins to degenerate.
This increases the stresses on the remaining particles creating further cracking until such a point that
phase IV is entered, whereby negligible load transfer is available through the aggregate interlock
mechanism.
The influence of reinforcement such as steel fibres or fabric delays the onset of the proceeding phase.
The mortar deterioration still occurs as shown by the steep gradient in phase I; however, the
reinforcement transfers some of the load and lowers the contact stress in the crack face. This reduces
the rate of deterioration and delays the onset of phase III.

13
In specimens where the differential displacement was low, very little material spalled from the crack;
however, on completion of the test a small layer of dust could be seen. On those where movement was
higher (0.2mm or above) the amount of dust generated was much greater, but all of the larger 10-20mm
aggregate appeared to be intact. In specimens that were close to failure, sections of concrete up to
20mm in size spalled from the base of the prism on either side of the crack, along with large amounts
of cement dust. Loose large aggregate particles of 10-20mm diameter, which had become detached
from the surrounding matrix, could also be seen on the sides and top of the prism, and were only
prevented from ejection by the support of the surrounding material. Upon failure the entire surface of
the crack began to break away, resulting in a large amounts of spalled material.
5.5 Influence of Specimen Parameters
The full suite of experimental results are too comprehensive to be included here; however, Figure 12
provides an overview of the results obtained from the testing and presents a summary of material
behaviour and resistance to deterioration.
The incorporation of steel fibre reinforcement increased the number of cycles that could be withstood
before phase III crack deterioration began to take place. Increasing the quantity of steel fibres from 20
to 40kg/m3 also reduced the rate of deterioration and lowered the magnitude of differential
displacement taking place. The introduction of steel fabric or traditional reinforcement reduced the
differential displacement still further and ensured failure did not occur in those specimens tested.
As expected, surface crack width was a key factor in the controlling joint deterioration, with the
smaller widths (typically 0.9mm) showing significantly better resistance to degradation than surface
cracks of 4.2mm or larger.
Full information on the results for each of the material parameters can be found in Arnold [4] and
Austin et al [17].

14
6. Conclusions
A small-scale laboratory test rig has been developed to investigate the cyclic load transfer of sawn
joints and cracks in concrete ground-bearing slabs. It avoids expensive and time consuming large-scale
testing, and facilitates the examination of failure modes and the controlled variation of key joint and
reinforcement parameters in a relatively straightforward manner. Unlike most other tests it can simulate
crack geometries, support and loading typical of real joints and cracks in ground-bearing slabs, with
cracks formed in a ‘V’ formation as in a curled area (hence little ground support) with wheel loading
that reverses the shear action during each cycle.
The results obtained from the test procedure provide a valuable insight into joint and crack degradation.
A simple model of joint behaviour under cyclic loading is proposed, comprising four main phases. An
increase in differential displacement over 250,000 loading cycles was obtained for a variety of concrete
and reinforcement specifications. A rapid increase in displacement over the first few thousand cycles of
around 0.3mm was found, caused by degradation of the fine aggregate. After this there was a period of
slow change whereby larger aggregate particles began to bear upon one another. In those specimens
where failure transpired a third section of rapidly increasing differential displacement occurred. Here,
the aggregate cracked and debonded from the remainder of the concrete, creating higher stresses across
the crack face and therefore quicker degradation. A differential of around 1.6mm was found to coincide
with rapid deterioration to failure with no significant load transfer.
Information obtained from the testing will inform clients, operators and designers of the deterioration
process of cracks and joints in concrete slabs on grade. Their long-term serviceability can be assessed
and the worst-case scenarios designed for, to help ensure that deflections under load do not become
excessive, thereby damaging materials handling equipment and slowing down operational procedures.
The intervention of remedial works can be reduced and also, where necessary, lower the time and cost
impacts on the business operations.
7. References [1] M. Valle, O. Buyukozturk, Behaviour of Fiber Reinforced High Strength Concrete under Direct Shear, ACI Materials Journal, 90 (2) 1993 122-133.
15
[2] S.G. Millard, R.P. Johnson, Shear Transfer Across Cracks in Reinforced Concrete due to Aggregate Interlock and Dowel Action, Magazine of Concrete Research 36 (126) 1984 9-21. [3] I. Thompson, Use of Steel Fibres to Reinforce Cement Bound Roadbase, PhD Thesis, The University of Nottingham, Nottingham, England, 2001. [4] S.J. Arnold, Load Transfer across Cracks/Joints in Concrete Slabs on Grade, PhD Thesis, Loughborough University, Loughborough, England, UK, 2004. [5] N. Buch, M.A. Frabizzio, J.E. Hillier, Impact of Coarse Aggregates on Transverse Crack Performance in Jointed Concrete Pavements, ACI Materials Journal 97 (3) 2000 325-331. [6] Z.I. Raja, M.B. Snyder, Factors Affecting Deterioration of Transverse Cracks in Jointed Reinforced Concrete Pavements, Transportation Research Record 1307, Transportation Research Board, 1991 162-168. [7] R.N. White, M.J. Holley, Experimental Studies of Membrane Shear Transfer, Journal of the Structural Division, American Society of Civil Engineers 98(ST8) 1972 1835-1853. [8] B.E. Colley, H.A. Humphrey, Aggregate Interlock at Joints in Concrete Pavements, Development Department Bulletin D124, Portland Cement Association, Illinois, 1967. [9] W.J. Nowlen, Influence of Aggregate Particles on Effectiveness of Interlock Joints in Concrete Pavements, Journal of the PCA Research and Development Laboratories, Report D139 10 (2) 1968. [10] M. Poblete, R. Valenzuela, Load Transfer in Undoweled Transverse Joints of PCC Pavements, Transportation Research record 1207, Transportation Research Board 1988 39-49. [11] W.W. Walker, J.A. Holland, Plate Dowels for Slabs on Ground - Dowels for the 21st Century, Draft Copy, Loughborough University, 2001. [12] Concrete Society, Concrete Industrial Ground Floors - A Guide to design and Construction, Technical Report No.34, 3rd ed. Crowthorne, UK, 2003. [13] E.J. Yoder, Principles of Pavement Design, John Wiley & Sons Inc, Chichester, England, 1959 435-452. [14] B.F. Friberg, Design of Dowels in Transverse Joints of Concrete Pavement, Proceedings of the American Society of Civil Engineers 64 (9) 1938 1809-1828. [15] M.G. Abdel-Maksoud, Behaviour of Concrete Joints Under Cyclic Shear, PhD Thesis, University of Illinois, USA, 2000. [16] J. Bishop, The Early Age Behaviour of Concrete Industrial Ground Floor Slabs, PhD Thesis, Loughborough, England, 2001. [17] S.A. Austin, S.J. Arnold, P.R. Fleming, P.J. Robins, The Influence of Steel Reinforcement in Reducing the Deterioration of Concrete Cracks and Joints under Low-intensity, High Cycle Loading, Draft Paper, Loughborough University, Loughborough, England, UK, 2004.

Table 1 – Specimen Concrete Mix
Material Quantity
Cement 370 kg/m3
Coarse Aggregate (5-10mm) 355 kg/m3
Coarse Aggregate (10-20mm) 711 kg/m3
Fine Aggregate 783 kg/m3
Free water 185 kg/m3
Table 2a –Specimen Composition
Notes:- Standard concrete mix details are as detailed in Table 1. Fibre Types are differentiated using aspect ratio. Table 2b – Specimens Tested
Surface Crack Width Specimen Code 0.7mm 2.0mm 3.3mm 4.6mm Other
A 2 2 - - - B 2 - - - - C 2 2 2 2 1 x 4.0mm D - 2 3 2 2 x 5.9mm E - 2 2 2 2 x 5.9mm F - 2 2 3 - G - 2 3 3 - H - 2 1 2 - I - 2 2 2 - J - 2 2 3 - K 2 3 - - - L 2 2 - - - M 2 2 - - - N 2 2 - - -
Specimen Code
Concrete Mix
Reinforcement Type
Reinforcement Quantity
Applied Load
Crack Geometry
A Standard None - 4kN ‘V’ B Mortar Fibre (67) 30kg/m3 4kN ‘V’ C Standard Fibre (67) 20kg/m3 4kN ‘V’ D Standard Fibre (67) 30kg/m3 4kN ‘V’ E Standard Fibre (67) 40kg/m3 4kN ‘V’ F Standard Fibre (80) 30kg/m3 4kN ‘V’ G Standard Fibre (48) 30kg/m3 4kN ‘V’ H Standard Reinforcing Bar 1 x 7mm φ Bar 4kN ‘V’ I Standard Steel Fabric 1 x 6mm φ Bar 4kN ‘V’ J Standard Fibre (67) 30kg/m3 2kN ‘V’ K Standard Fibre (67) 30kg/m3 6kN ‘V’ L Standard Fibre (67) 20kg/m3 4kN Parallel M Standard Fibre (67) 30kg/m3 4kN Parallel N Standard Fibre (67) 40kg/m3 4kN Parallel
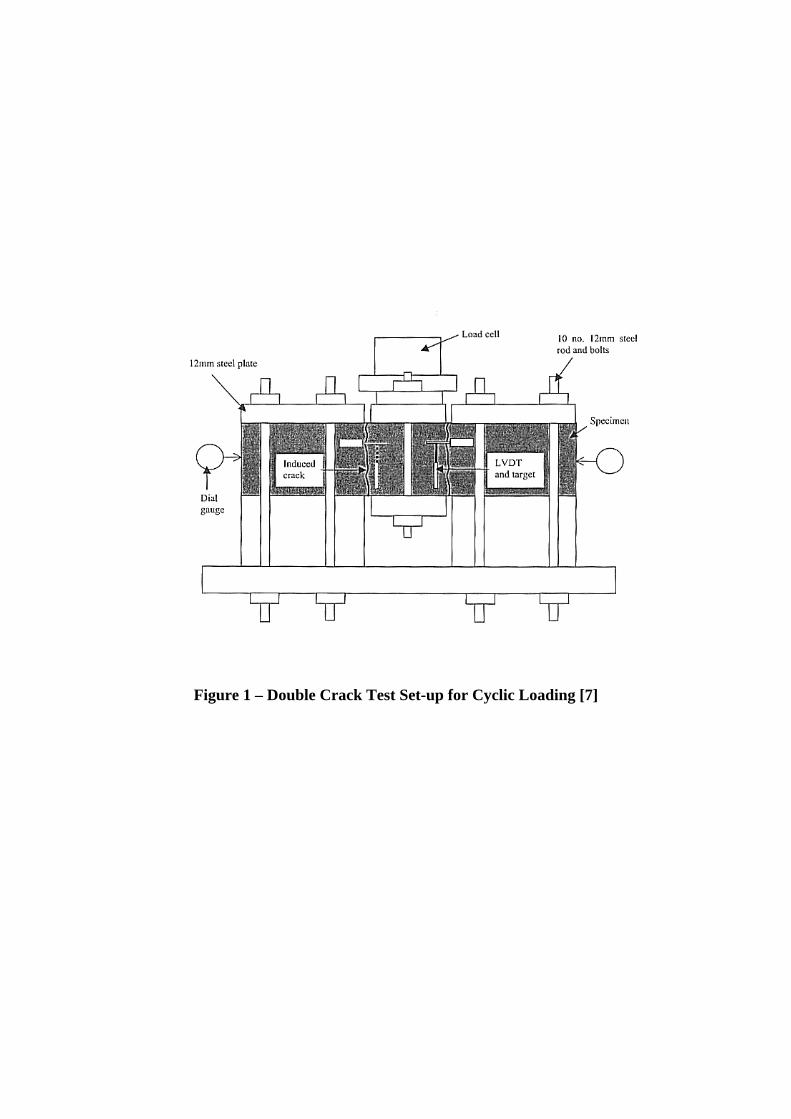
Figure 1 – Double Crack Test Set-up for Cyclic Loading [7]
Position 1 - Neutral
Position 2 – Positive Load
Position 3 – Negative Load
Lab specimen
Lab specimen
Lab specimen
In-service slab
In-service slab
Approach slab Leave slab Approach
slab
Leave slab
Approach slab
Leave slab Approach slab
Leave slab
Figure 2 – Representation of In-service Slab Loading using Positive and Negative
Laboratory Loading

Figure 3 – Geometry of In-service Slab Joints
-0.25
0
0.25
0.5
0.75
1
1.25
1.5
0 50 100 150 200 250
Distance from Slab Surface (mm)
Cra
ck W
idth
(mm
)

Figure 4(a) –Colley and Humphrey Measured Deflection Cycle [11]
Figure 4(b) –Laboratory Testing Deflection Cycle [4]
-5
-4
-3
-2
-1
0
1
2
3
4
5
0 0.05 0.1 0.15 0.2 0.25 0.3 0.35 0.4 0.45 0.5
Time (Seconds)
App
lied
Load
(kN
)
Figure 5 – Laboratory Specimen Crack Development Methodology

Figure 6 – Comparison of Predicted and Actual Surface Crack Measurements
y = 1.7313xR2 = 0.9185
y = 2.2209x
0
1
2
3
4
5
6
0 0.5 1 1.5 2 2.5
Shim Size (mm)
Cra
ck W
idth
(mm
)
Laboratory Testing
Predicted Results
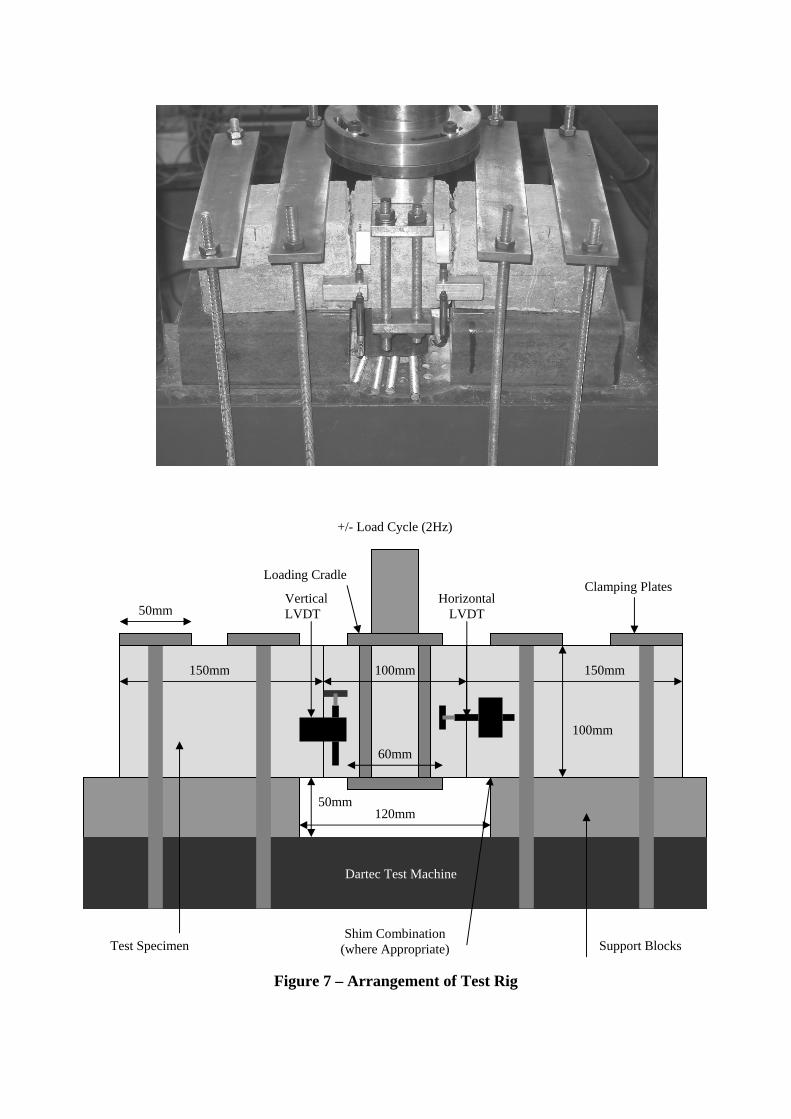
Figure 7 – Arrangement of Test Rig
+/- Load Cycle (2Hz)
Horizontal LVDT
Vertical LVDT
Clamping Plates Loading Cradle
Test Specimen Shim Combination
(where Appropriate) Support Blocks
Dartec Test Machine
150mm 150mm
120mm
100mm
100mm
60mm
50mm
50mm

Figure 8 – LVDT Positioning
Bracket
LVDT
Target
Front View
Rear View
Plan View
Vertical LVDT (Fr) Vertical LVDT (Fl)
Horizontal LVDT (Rr) Vertical LVDT (Rl)
Vertical LVDT Vertical LVDT
Vertical LVDT Horizontal LVDT
Front Face
Rear Face

Figure 9 – Typical Time/Displacement Plot for an Individual Load Cycle
-0.15
-0.1
-0.05
0
0.05
0.1
0.15
0 0.1 0.2 0.3 0.4 0.5
Time (Seconds)
Diff
eren
tial D
ispl
acem
ent (
mm
)
Maximum Displacement
Minimum Displacement
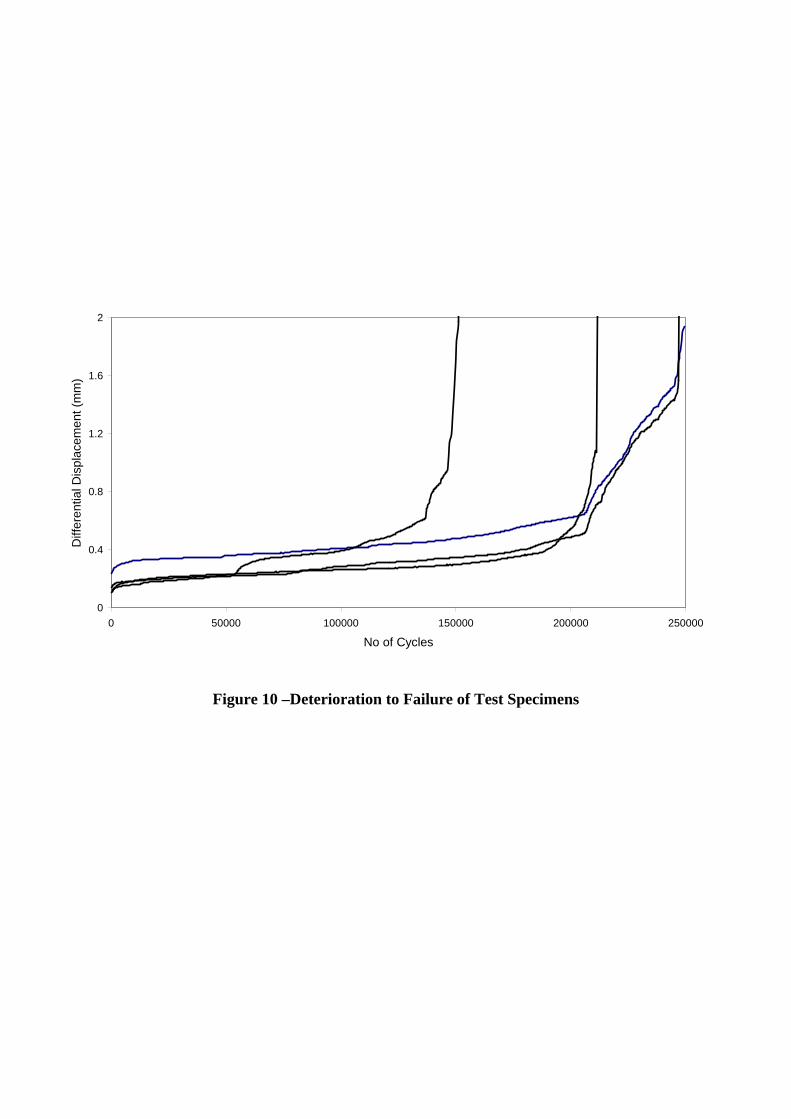
Figure 10 –Deterioration to Failure of Test Specimens
0
0.4
0.8
1.2
1.6
2
0 50000 100000 150000 200000 250000
No of Cycles
Diff
eren
tial D
ispl
acem
ent (
mm
)

Figure 11 – Deterioration Phases of a Concrete Crack
0
0.4
0.8
1.2
1.6
2
0 50000 100000 150000 200000 250000
No of Cycles
Diff
eren
tial D
ispl
acem
ent (
mm
)
Phase I
Phase II
Phase IV
Phase III
Simplified Model

Figure 12 – Effect of Reinforcement Type and Quantity on Differential
Displacement
0
0.2
0.4
0.6
0.8
1
1.2
1.4
1.6
1.8
2
0 1 2 3 4 5 6 7Initial Surface Crack Width (mm)
Peak
Diff
eren
tial D
ispl
acm
ent (
mm
)
30kg/m3 Fibre 20kg/m3 Fibre
40kg/m3 Fibre 7mm Reinforcing Bar
A142 Steel Mesh
Non Reinforced Concrete
Failure Line


