22
A Wavelet-based Anomaly Detector for Disease Outbreaks Thomas Lotze Galit Shmueli University of Maryland College Park Sean Murphy Howard Burkom Johns Hopkins University Applied Physics Lab
| Date post: | 29-Dec-2015 |
| Category: |
Documents |
| Upload: | patricia-parks |
| View: | 214 times |
| Download: | 0 times |

A Wavelet-based Anomaly Detector for Disease Outbreaks
Thomas LotzeGalit Shmueli
University of Maryland College Park
Sean MurphyHoward Burkom
Johns Hopkins University Applied Physics Lab

Outline
● Motivation● Wavelet method● Difficulties● Preconditioning● Results

Related Work
● Bakshi Wavelets in
Chemical SPC● Zhang
Baseline wavelets Normalize syndromic
baseline● Goldenberg, et. al.
Wavelets in syndromic surveillance

Motivation● Detecting disease
outbreaks Bioterrorist attacks Virulent diseases Early detection
saves lives!● Syndromic Data will
show outbreaks● Anomaly detection
to find outbreaks faster
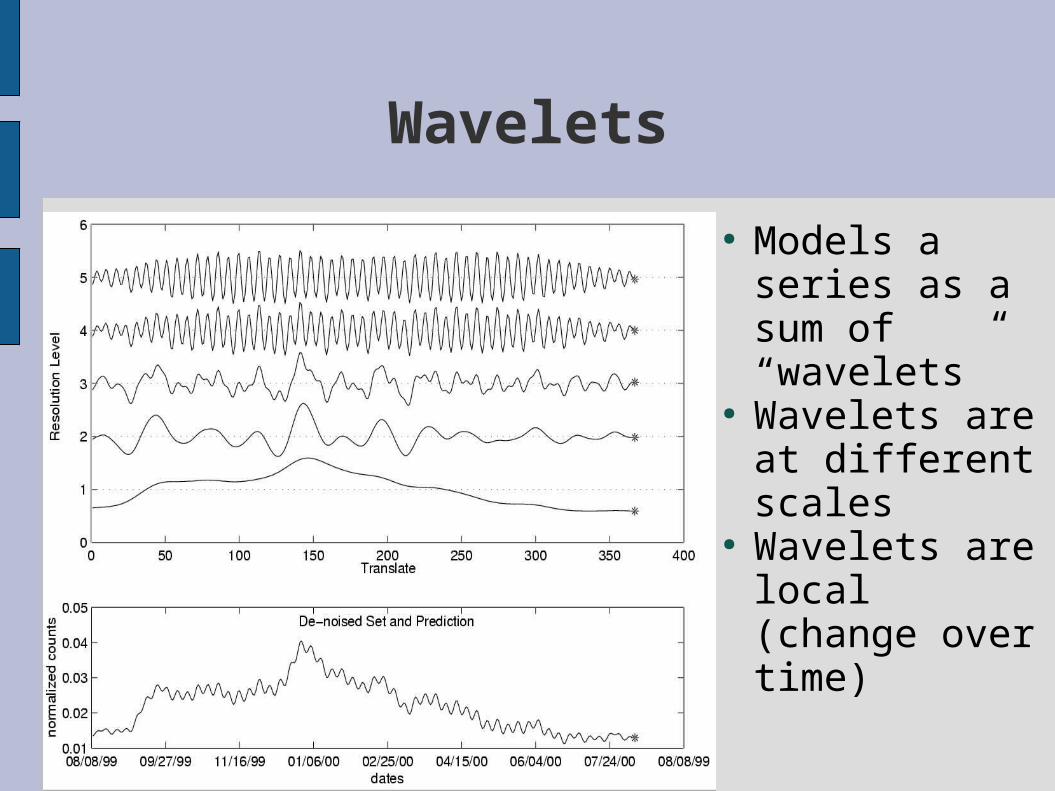
Wavelets
● Models a series as a sum of “wavelets”
● Wavelets are at different scales
● Wavelets are local (change over time)

Goldenberg et. al., 2002
Xt
SPC( )
AR(aLX)
AR(dLX)
AR(dmX)
AR(d1X)
WT
1ˆtx
Decompose the series
with desired wavelet
Use an AR at each of the detail levels and coarsest approximation
level to forecast the next point
Reconstruct series and obtain next day
forecast
Compare the forecast with the actual value.
Use a control chart to monitor the discrepancy
11ˆ tt xxW
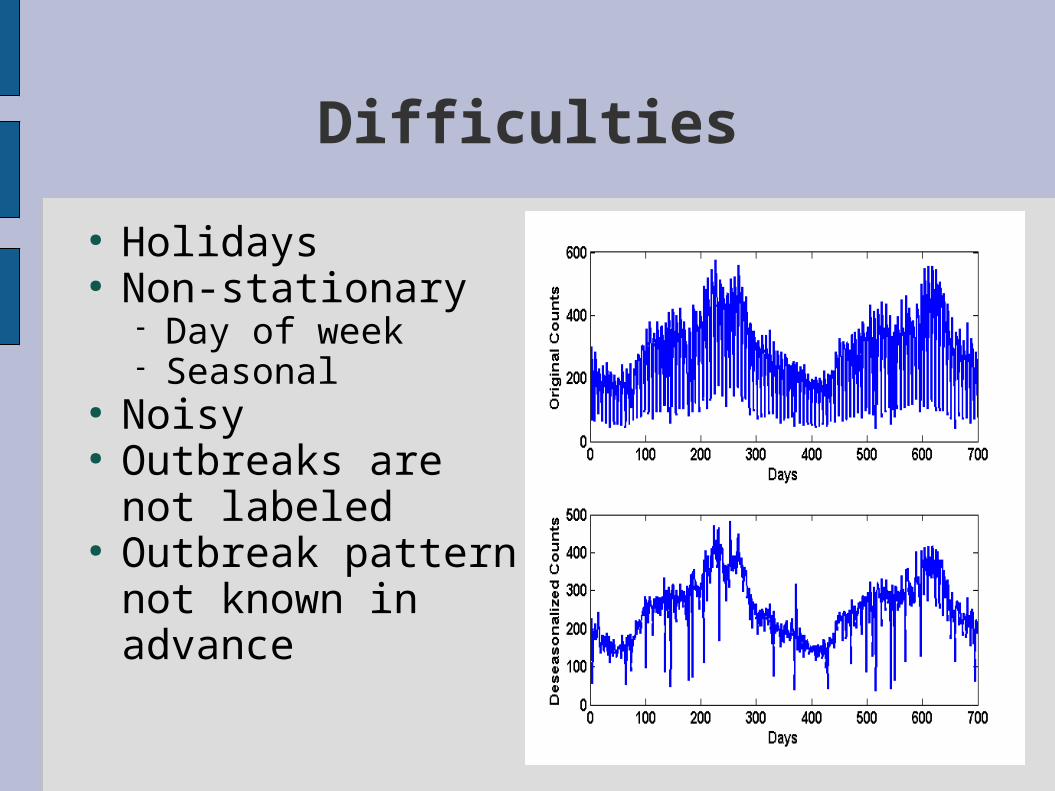
Difficulties
● Holidays● Non-stationary
Day of week Seasonal
● Noisy● Outbreaks are not
labeled● Outbreak pattern not
known in advance

Preconditioning
● Differs from Goldenberg, et. al
● Replace holidays One week previous
● Day-of-week Ratio to moving
average
Evaluation: Simulated Outbreaks
● Real data from 5 cities, Resp and Gi● Simulated outbreak patterns inserted● Specific pattern of additional syndromes over
several days● Size is normalized by standard deviation of
recent days● Inserted at different starting points within the
sample data● Average detection rates vs. false alarm rates
can be determined to create ROC curves

Results
● Comparable to Holt-Winters
● Not amazing
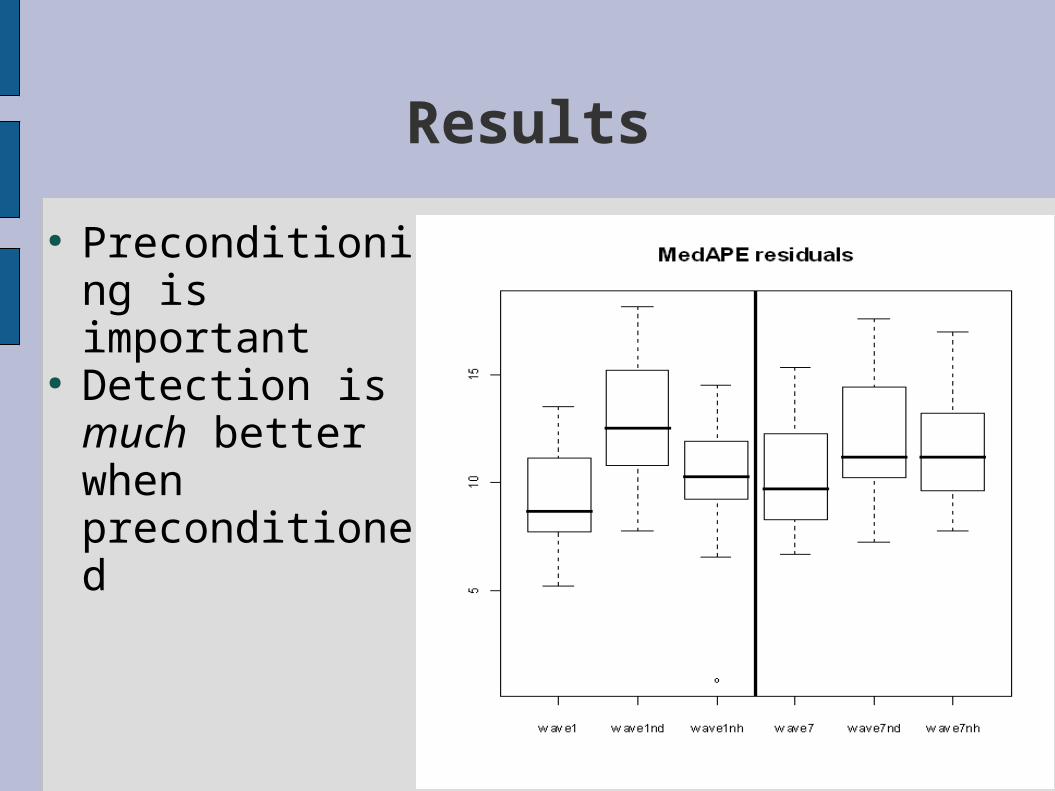
Results
● Preconditioning is important
● Detection is much better when preconditioned

Results
● Easier to detect on some days than others
● Days with low counts
● Daily preconditioning not sufficient

Summary
● Wavelets are a fairly good detection method
● Preconditioning is very important
● Day-of-week not fully accounted for

Questions?
● More details on wavelets method?
● Difficulties?● Other outbreak
signals?● Future work?● Will Microsoft
survive Bill Gates' stepping down?

Bonus: More on Wavelets
● Level 1:– Run the data through a low-
pass filter. This gives the approximation coefficients
– Run the data through a high-pass filter. This gives the detail coefficients
– Down-sample– Reconstruct approximation
and detail by up-sampling and running “reconstruction” filters.
● Level 2 and on:– Repeat the steps by applying
them to the previous level approximation coefficients.

Bonus: Wavelets on Cough Medication Sales
100 200 300 400 500
10
15
20
a1
81012141618
a2
81012141618
a3
8
10
12
14
16
a4
8
10
12
14
16
a5
10
15
20
s
Signal and Approximation(s)
10
15
20
s
cfs
Coefs, Signal and Detail(s)
54321
-2
0
2
d5
-1
0
1
d4
-1
0
1
d3
-1
0
1
d2
100 200 300 400 500-2
0
2
d1
Haar Wavelet:
h = [1/sqrt(2), 1/sqrt(2)]
g = [1/sqrt(2), -1/sqrt(2)]
Downsample
Upsample
h* = [1/sqrt(2), 1/sqrt(2)]
g* = [-1/sqrt(2), 1/sqrt(2)]
In general:
s = a5 + d1 + d2 +… + d5

Bonus: Wavelet Prediction
● Additional details:● 5 level decomposition
Can be performed with more or fewer● SWT: Fill in “holes”
Perform a decomposition for every possible position
Series are no longer independent● Edge issue
Prediction is not possible at all time steps Solution: construct wavelets “backwards” from
most recent observations

Bonus: Ratio-to-Moving-Average
● Way of normalizing day-of-week effects● 1: Determine moving averages
a(i)=(x(i-3) + x(i-2) + ... + x(i+3)) /7● 2: Determine ratio (“raw seasonal”) for each
day r(i)=x(i)/a(i)
● 3: Determine avg. ratio for each day r(Mon)=sum(r(i): i is Mon) / count(i is Mon)
● 4: Normalize ratios to sum to 1 r'(Mon)=r(Mon) / (r(Mon) + ... + r(Sun))
● 5: Divide each day by its ratio x'(i)=x(i)/r(Mon)
Bonus: Possible Extensions
● Multivariate wavelets● Each day-of-week as a separate series● Different wavelet shapes● Different wavelet scale basis● Different preconditioning● Different sizes, lengths of outbreaks● Don't normalize outbreak by standard
deviation of recent days Show when outbreaks are harder to detect
● Estimate confidence based on experience● Boosting
Bonus: Wavelet Prediction
● Decompose into timescales
● Use AR or EWMA to predict for each timescale
● Reconstruct prediction from predicted timescales
● Monitor deviations from prediction

Bonus: Alternative Preconditioning
● Regression using day-of-week predictors● 7-day differencing● Holt-Winters as preconditioner● Seasonal preconditioning

Bonus: Other Outbreak Signals
● Normalized by total size● Lognormal, exponential, step● Spike is much easier than the others


