A Wireless Software Architecture for Fast 3D Rendering of Agent-Based Multimedia Simulations on Portable Devices S. Cacciaguerra, M. Roccetti, M. Roffilli Department of Computer Science University of Bologna Mura A. Zamboni 7, 40127 Bologna, Italy E-mail:{scacciag, roccetti, roffilli}@cs.unibo.it A. Lomi Institute of Advanced Studies University of Bologna Piazza Scaravilli 1, 40127 Bologna, Italy E-mail: [email protected]Abstract— New technological developments in wireless networks and location-based information systems are greatly affecting the prominent scenarios represented by mobile markets, commercial and industrial organizations, and cooperative social environments. To model and control such complex organizational systems, the use of scientific methodologies, such as participatory simulation and agent-based modeling is becoming increasingly common. Further, users of these collaborative systems demand the availability of sophisticated tools that are able to present visually the results of cooperative simulation activities on the screen of handheld devices. In this context, we have designed and developed a software architecture able to support the execution of agent-based participatory simulation activities, and to render them in a 3D virtual world over wireless devices. We report on several experiments, gathered on the field, showing that the architecture we have developed is able to render, in a timely fashion, on a wireless device, the results of cooperative simulation activities performed by agent-based programming platforms. Smart services; 3D rendering on handheld devices; Multimedia technologies; Wireless scientific visualization; Participatory simulation; Agent-based modeling; Mobile business games I. INTRODUCTION The wireless revolution has started with Internet phones and continued with many kinds of wireless handheld devices that allow users to access the Internet. Thanks to the technical developments in high speed chips, mobile networks and software protocols, the wireless technology is enabling a wide range of exciting possibilities, including, for example, wireless sensors networks, wearable computers, ubiquitous computing and innovative use of Web phones. In this context, it is easy to envisage that future mobile users will enjoy a near ubiquitous access to the vast storehouse of technical and intellectual resources offered by high bandwidth (wireless) networks. For example, in social organizations, or in collaborative human environments, workers are starting to exploit wireless technologies to connect to colleagues and carry out different kinds of cooperative tasks, including brainstorming, task planning, resources sharing, instant messaging, and waving the Internet together. In essence, due to the use of these new technologies, secure virtual spaces (or environments) may be created where workers, after been identified, may cooperate to accomplish common tasks. In this challenging scenario, a great popularity has been gained by a modern form of “semi-automatic” collaborative scheme, termed participatory simulation [1, 2]. With the term participatory simulation Wilensky and Stroup [3] refer to such role-playing cooperative activities aimed at exploring how complex dynamic systems evolve over time. As an example of participatory simulation, consider that of a virtual stock exchange, where each player (investor) could play the role of a virtual buyer or of a seller who engages in the activities of the resulting share exchange dynamics. Obviously, we have just mentioned only a simple example, but a wide set of possible content areas for participatory simulation include different scientific and technical fields, ranging from the spread of a disease, to the flow of energy in an electric network, to the diffusion of innovation, to the distribution of goods in an inventory system [5]. From a scientific standpoint, participatory simulation typically employs some form of Agent Based Modeling Simulation (ABMS) technology. Simply put, an ABMS platform is a programmable modeling environment for simulating complex systems where programmers can give instructions to several independent agents working in parallel. In essence, in an ABMS the global state of the system emerges as a result of the interaction of hundreds, or thousands, of elementary agents engaged in a variety of local processes such as exchange, cooperation and competition. These agents (which may be either completely controlled by humans or automatically programmed) can play their moves based on an intrinsic capability of local investigation and local action. Perhaps the most common way to present the simulation results produced by the complex interactions of an ABMS- based virtual world is visual display. A prominent example of using visual representation to display the results of ABMS- based simulation is reported in Figure 1, where the graphical interface of the Massive system is reported from [4]. The problem here is that the actual ABMS-based software platforms only provide for limited graphical functionalities.
Transcript
A Wireless Software Architecture for Fast 3D Rendering of Agent-Based Multimedia Simulations
on Portable Devices
S. Cacciaguerra, M. Roccetti, M. Roffilli Department of Computer Science
University of Bologna Mura A. Zamboni 7, 40127 Bologna, Italy
E-mail:{scacciag, roccetti, roffilli}@cs.unibo.it
A. Lomi Institute of Advanced Studies
University of Bologna Piazza Scaravilli 1, 40127 Bologna, Italy
Abstract— New technological developments in wireless networks and location-based information systems are greatly affecting the prominent scenarios represented by mobile markets, commercial and industrial organizations, and cooperative social environments. To model and control such complex organizational systems, the use of scientific methodologies, such as participatory simulation and agent-based modeling is becoming increasingly common. Further, users of these collaborative systems demand the availability of sophisticated tools that are able to present visually the results of cooperative simulation activities on the screen of handheld devices. In this context, we have designed and developed a software architecture able to support the execution of agent-based participatory simulation activities, and to render them in a 3D virtual world over wireless devices. We report on several experiments, gathered on the field, showing that the architecture we have developed is able to render, in a timely fashion, on a wireless device, the results of cooperative simulation activities performed by agent-based programming platforms.
Smart services; 3D rendering on handheld devices; Multimedia technologies; Wireless scientific visualization; Participatory simulation; Agent-based modeling; Mobile business games
I. INTRODUCTION The wireless revolution has started with Internet phones
and continued with many kinds of wireless handheld devices that allow users to access the Internet. Thanks to the technical developments in high speed chips, mobile networks and software protocols, the wireless technology is enabling a wide range of exciting possibilities, including, for example, wireless sensors networks, wearable computers, ubiquitous computing and innovative use of Web phones.
In this context, it is easy to envisage that future mobile users will enjoy a near ubiquitous access to the vast storehouse of technical and intellectual resources offered by high bandwidth (wireless) networks. For example, in social organizations, or in collaborative human environments, workers are starting to exploit wireless technologies to connect to colleagues and carry out different kinds of cooperative tasks, including brainstorming, task planning, resources sharing, instant messaging, and waving the Internet together. In essence, due to the use of these new technologies, secure virtual spaces
(or environments) may be created where workers, after been identified, may cooperate to accomplish common tasks. In this challenging scenario, a great popularity has been gained by a modern form of “semi-automatic” collaborative scheme, termed participatory simulation [1, 2]. With the term participatory simulation Wilensky and Stroup [3] refer to such role-playing cooperative activities aimed at exploring how complex dynamic systems evolve over time. As an example of participatory simulation, consider that of a virtual stock exchange, where each player (investor) could play the role of a virtual buyer or of a seller who engages in the activities of the resulting share exchange dynamics.
Obviously, we have just mentioned only a simple example, but a wide set of possible content areas for participatory simulation include different scientific and technical fields, ranging from the spread of a disease, to the flow of energy in an electric network, to the diffusion of innovation, to the distribution of goods in an inventory system [5].
From a scientific standpoint, participatory simulation typically employs some form of Agent Based Modeling Simulation (ABMS) technology. Simply put, an ABMS platform is a programmable modeling environment for simulating complex systems where programmers can give instructions to several independent agents working in parallel. In essence, in an ABMS the global state of the system emerges as a result of the interaction of hundreds, or thousands, of elementary agents engaged in a variety of local processes such as exchange, cooperation and competition. These agents (which may be either completely controlled by humans or automatically programmed) can play their moves based on an intrinsic capability of local investigation and local action.
Perhaps the most common way to present the simulation results produced by the complex interactions of an ABMS-based virtual world is visual display. A prominent example of using visual representation to display the results of ABMS-based simulation is reported in Figure 1, where the graphical interface of the Massive system is reported from [4]. The problem here is that the actual ABMS-based software platforms only provide for limited graphical functionalities.
Figure 1. Massive simulator: 2D graphical display (reported from [4])
For example, well known ABMS platforms such as Netlogo, Swarm, Jas, and Repast only render their agent based models through a 2D raster graphics visualization methodology [6, 7, 8, 9].
In this context, the main contribution of our work is the design of a 3D visualization engine that can be used to represent visually simulation results of ABMS-based virtual environments on mobile devices, such as laptops, PDAs and smart phones. From a graphical standpoint, it is worth mentioning that, as typical 3D rendering problems are here exacerbated by the need to display virtual worlds on wireless (possibly handheld) devices, we resorted to special rendering techniques based on triangular meshes that guarantee an optimal trade off between fast visual reproduction and device compatibility. Alongside a detailed description of the architecture of our visualization engine, we report a set of experimental results which confirm that an appropriate integration of our visualizer with the software architecture of the ABMS system enables a fast 3D representation on wireless devices.
Figure 2. ABMS rendering on different devices
The reminder of this paper is organized as follows. In Section 2, we illustrate the main features of the software architecture of the system we developed. In Section 3, we present a set of empirical results we obtained with a prototype implementation of our system. Finally, Section 4 concludes our work with some hints for future developments of our work.
II. SYSTEM ARCHITECTURE
We have designed a (client-server) software architecture able to support the execution of ABMS-based virtual worlds and their 3D rendering on wireless devices (see Figure 2). The three main software components of our architecture are the following: i) the ABMS platform, ii) the 3D visualizer and, iii) the wireless network communication subsystem. As shown in Figure 3, a complete “execute and visualize” session of our system works as follows. Initially, a user from his/her device issues an order to his/her set of controlled agents in a virtual world.
This order is intercepted by a dedicated user process, termed Agent Manager (AM). After collecting orders from a given user, the AM sends them to its software counterpart on the ABMS platform, called the Request Manager (RM). Apart from the RM, the ABMS platform (hosted on a wired machine) is comprised of a State Updater (SU) and a Snapshot Creator (SC). In essence, the SU computes, on a periodical basis, a new state of the virtual world, based on the interactions with the system users. After that a new state has been computed, the SC constructs a text-based image of the newly calculated state. Upon reception of these data, the visualizer displays them on the screen of the wireless device. It is worth pointing out that all the above mentioned communications are carried out by the wireless network communication subsystem based on a TCP/IP stack.
Figure 3. An “execute and visualize” session
State Updater
Request Manager
Snapshot Creator
AM
Visualizer
AMBS platform
Wireless devices
AM
Visualizer
Figure 4. System architecture
The next Subsections are devoted to examine, in turn, the
two main software components (i.e., the ABM platform and the visualizer of Figure 4) of our system, along with a number of relevant design and implementation details.
A. The ABMS Platform The AMBS platform, on the top of which our system is
built, is partially based on the Netlogo software environment [6]. In particular, the RM and the SU are technologies provided by Netlogo; instead, we developed a Snapshot Creator (SC) that is able to capture the states of the system generated by Netlogo, and to transform them into input parameters for our visualizer.
As to the functions provided by Netlogo, it is important to notice that all the most complex models produced by Netlogo may be built based on three different types of agents, namely: observers, turtles and patches. In substance, each model has only one observer that represents the most general framework where all other agents live and cooperate. Turtles, in turn, are the most active types of agents which can be defined in a Netlogo model: they can perform several types of actions, on a local basis, ranging from spatial movements, to visual interpretation of other agents actions, and generic data exchange. Finally, patches are agents which are typically used, within the Netlogo framework, to represent static pieces of information, such as background colors and spatial landscapes, for example. Patches may also represent “resources” that turtles produce and/or consume. Hence, within Netlogo, agents are able to perceive their environment and respond to changes in a timely fashion, further they are able to interact with each other to perform cooperative activities.
Our contribution to the Netlogo platform, here, has been that of developing a software module which captures, on a periodical basis, all the data which refer to a given model and inputs them into a FIFO queue. Subsequently, following the order given by the queue, the data are fetched and sent to the
visualizer for 3D rendering, as described in the following Subsection.
B. The 3D Visualizer The main obstacles that need to be tackled for the
development of the visual engine for an ABMS system concern the choice of the most appropriate structuring of the hardware/software architecture. This architecture must be able to render visually on a wireless device the states of the 3D virtual worlds generated by the simulative platform. To this aim, we have developed a visual engine, based on open source graphical libraries, whose architecture is depicted in Figure 4. The main software components of our 3D visualizer are the Snapshot Manager (SM), the Virtual World Creator (VWC) and the Rendering Engine (RE). Upon receiving data into a FIFO queue from the ABMS through a wireless connection, the SM manages the subsequent activity of data decompression, and checks for their integrity. In turn, the VWC extracts data from the FIFO queue and creates the 3D virtual world based on a scene graph model which exploits triangular meshes as basic 3D objects [10, 11, 12]. This is accomplished by following an augmented reality strategy, where real images, captured with a camera, can be attached to the virtual world generated by Netlogo. The final activity is performed by the RE which renders in 3D on the wireless screen the virtual world generated by the VWC. It is important to mention that our RE is able to support the introduction of graphical optimizations (such as the use of textures) without affecting the rendered data. In addition, it has the capability to sustain dynamically the display of a given frame rate (on the wireless device) while scaling down with respect to the graphical quality of the rendered 3D objects. Further, this software module allows for frame skipping, when a too large transmission delay is experienced at the client side. Finally, it is worth mentioning that our RE displays the virtual world generated by the VWC based on the OpenRM/OpenGL graphical libraries [13, 14], the main advantage of this graphical library being its portability across different operating systems. (Thus, our visualizer may run on different hardware equipments, such as laptops, tablet PCs and PDAs.)
III. SYSTEM ARCHITECTURE
To test the efficacy of our visualizer, we developed an experimental study based on the use of the following prototype implementation of our system.
We run the Netlogo-based ABMS platform (RM+SU+SC) on a server equipped with a Windows 2000 Pentium III, working at 900 MHz and with 512 MB RAM. The client, instead, was running on either a laptop machine (a Dell Inspiron 8200 equipped with a NVIDIA GeForce4 Go 440 with 64Mb of RAM) or on a PDA (iPAQ 3970). The laptop mounted a Windows 2000 OS, while the PDA mounted the Familiar Linux OS equipped with the GPE x-Windows graphical interface [15, 16]. Both clients where connected to the server through a TCP/IP wireless connection on a Wi-Fi 802.11b network.
We wish to illustrate now the results we obtained both on a visual and on a numerical standpoint. To this aim, in Figure 5 we present the 3D results we have obtained by rendering, on
VI
II
III
I
IV
V
Requests Manager
State Updater
Snapshot Creator
Snapshot Manager
Virtual World Creator
Rendering Engine
ABMS PLATFORM
M
3D VISUALIZER
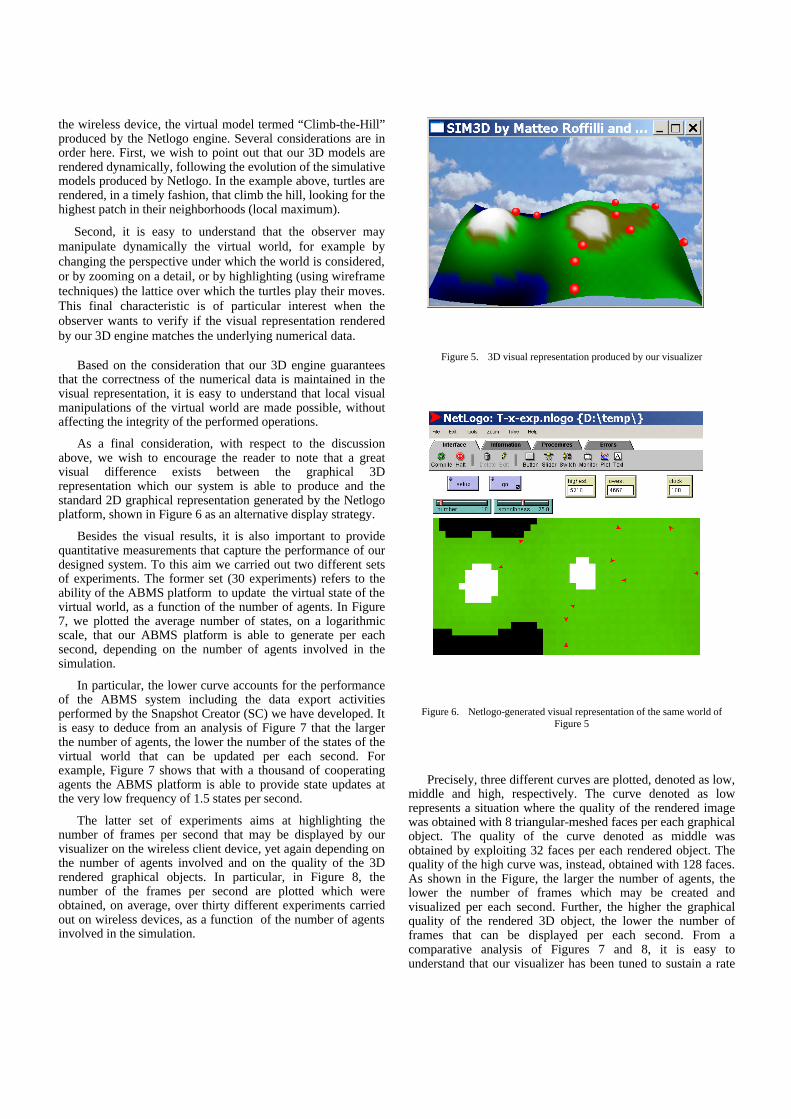
the wireless device, the virtual model termed “Climb-the-Hill” produced by the Netlogo engine. Several considerations are in order here. First, we wish to point out that our 3D models are rendered dynamically, following the evolution of the simulative models produced by Netlogo. In the example above, turtles are rendered, in a timely fashion, that climb the hill, looking for the highest patch in their neighborhoods (local maximum).
Second, it is easy to understand that the observer may manipulate dynamically the virtual world, for example by changing the perspective under which the world is considered, or by zooming on a detail, or by highlighting (using wireframe techniques) the lattice over which the turtles play their moves. This final characteristic is of particular interest when the observer wants to verify if the visual representation rendered by our 3D engine matches the underlying numerical data.
Based on the consideration that our 3D engine guarantees
that the correctness of the numerical data is maintained in the visual representation, it is easy to understand that local visual manipulations of the virtual world are made possible, without affecting the integrity of the performed operations.
As a final consideration, with respect to the discussion above, we wish to encourage the reader to note that a great visual difference exists between the graphical 3D representation which our system is able to produce and the standard 2D graphical representation generated by the Netlogo platform, shown in Figure 6 as an alternative display strategy.
Besides the visual results, it is also important to provide quantitative measurements that capture the performance of our designed system. To this aim we carried out two different sets of experiments. The former set (30 experiments) refers to the ability of the ABMS platform to update the virtual state of the virtual world, as a function of the number of agents. In Figure 7, we plotted the average number of states, on a logarithmic scale, that our ABMS platform is able to generate per each second, depending on the number of agents involved in the simulation.
In particular, the lower curve accounts for the performance of the ABMS system including the data export activities performed by the Snapshot Creator (SC) we have developed. It is easy to deduce from an analysis of Figure 7 that the larger the number of agents, the lower the number of the states of the virtual world that can be updated per each second. For example, Figure 7 shows that with a thousand of cooperating agents the ABMS platform is able to provide state updates at the very low frequency of 1.5 states per second.
The latter set of experiments aims at highlighting the number of frames per second that may be displayed by our visualizer on the wireless client device, yet again depending on the number of agents involved and on the quality of the 3D rendered graphical objects. In particular, in Figure 8, the number of the frames per second are plotted which were obtained, on average, over thirty different experiments carried out on wireless devices, as a function of the number of agents involved in the simulation.
Figure 5. 3D visual representation produced by our visualizer
Figure 6. Netlogo-generated visual representation of the same world of Figure 5
Precisely, three different curves are plotted, denoted as low, middle and high, respectively. The curve denoted as low represents a situation where the quality of the rendered image was obtained with 8 triangular-meshed faces per each graphical object. The quality of the curve denoted as middle was obtained by exploiting 32 faces per each rendered object. The quality of the high curve was, instead, obtained with 128 faces. As shown in the Figure, the larger the number of agents, the lower the number of frames which may be created and visualized per each second. Further, the higher the graphical quality of the rendered 3D object, the lower the number of frames that can be displayed per each second. From a comparative analysis of Figures 7 and 8, it is easy to understand that our visualizer has been tuned to sustain a rate
of rendered frames which is attuned with the frequency according to which the ABMS platform provides updates of the virtual world state. In other words, from a communication viewpoint it suffices that our wireless communication subsystem be able to transport, over the air, per each second the same number of state updates produced by the ABMS platform. This would guarantee a perfect synchronization between the producer (the ABMS platform) and the consumer (the visualizer).
Following this consideration, our experiments with an iPAQ 3970 PDA, equipped with the pocketGL graphical library, show that an average rate of 10-15 frames per second may be safely tolerated over a Wi-Fi connection with a hundred of agents.
Figure 7. Performances of the ABMS (server-side)
Figure 8. Performances of the visualizer (wireless device)
IV. CONCLUSIONS
We have designed and developed a software architecture able to support the execution of agent-based participatory simulation activities and to render them in a 3D virtual world over wireless devices. We have conducted several empirical trials (both visual and numerical) that confirm that the structuring of the software architecture we have devised is able to guarantee the visual delivery of ABMS-based virtual worlds on wireless devices in a timely fashion. We wish to point out here that the visual aspect of the 3D virtual worlds we are able to reproduce with our system is very realistic, as our current implementation permits us to manage textures and other augmented reality-based objects in a sophisticated fashion. As an example of the use of texture-based 3D virtual worlds we report in Figure 9 a landscape where the photos of the four authors of this paper are mounted on the represented surfaces. Further, two visual examples of the use of 3D augmented reality-based worlds are depicted in Figures 10 and 11. We wish to conclude by mentioning that possible future developments of our system may foster new applications relevant to the fields of participatory simulation, mobile business, digital cinema, edutainment, multiplayer games and pervasive computing on wireless devices [17, 18, 19, 20, 21, 22, 23, 24, 25].
Figure 9. A virtual world with textures representing the faces of this paper’s authors
Figure 10. A virtual world generated by real geospatial data with minotaurs as characters
Figure 11. A virtual world generated by real geospatial data with sonics as characters
ACKNOWLEDGMENT
This research has been partially funded by the Italian M.I.U.R. (Interlink project), by Microsoft Research (UK) and by European FP5 RTD project (IST-2001-34069). We wish to thank the anonymous referees for their helpful suggestion about an earlier version of this paper.
REFERENCES [1] Profit from Peer-to-Peer, Economist, June 21, 2001. [2] T. G. Kanter, “Attaching Context-Aware Services to Moving
Locations”, IEEE Internet Computing, March - April 2003, Vol. 7, No. 2, 43-51.
[3] U. Wilensky, W. Stroup, “Networked Gridlock: Students Enacting Complex Dynamic Phenomena with the HubNet Architecture”, Proceedings of the Fourth Annual International Conference of the Learning Sciences, Ann Arbor, MI, June 2000.
[4] Lord of the Rings http://www.lordoftherings.net/effects/index.html. [5] A. Lomi, E. R. Larsen, “Learning with Simulation: Understanding the
Strategic Implications of Deregulation and Competition in the Electricity Industry”, Proceedings of the Workshop on Agent Simulation: Applications, Models, and Tools, Chicago, IL, October 1999, 73-95.
[6] Netlogo, http://www.ccl.sesp.northwestern.edu/netlogo. [7] Swarm, http://www.swarm.org. [8] Jas, http://sourceforge.net/projects/jaslibrary/. [9] Repast, http://repast.sourceforge.net/. [10] S. Clarke-Wilson, “the Design of Virtual Environments – Value Added
Entertainment”, Computer Graphics, Vol. 28, N. 2, 1994. [11] W. Bethel, R. Frank, J. D. Brederson, “Combining a Multithreaded
Scene Graph System with a Tiled Display Environment”, Proceedings of the 2002 IS&T/SPIE Conference on Electronic Imaging and Technology, San Jose, CA, January 2002.
[12] J. Clark, “Hierarchical Geometric Models for Visible Surface Algorithms”, Communications of the ACM, October 1976, 547- 554.
[13] W. Bethel, RM Scene Graph, White Paper, December 1999, http://www.r3vis.com/RMSceneGraph.
[14] M. Segal, K. Akeley, The OpenGL Graphics System: A Specification (Version 1.4), http://www.opengl.org.
[15] Familiar Linux distribution web site, http://familiar.handhelds.org. [16] GPE, The GPE Palmtop Environment web site, http://gpe.handhelds.org. [17] G. Camponovo, Y. Pigneur, “Analyzing The Actor Game In M-
Business”, Annals of Telecommunications, January - February 2003, Vol. 58.
[18] S. Ferretti, S. Cacciaguerra, “A Design for Networked Multiplayer Games: an Architectural Proposal”, Proceedings of the Euromedia 2003, Plymouth (UK), April 2003.
[19] S. Ferretti, M. Roccetti, “On Designing an Event Delivery Service for Multiplayer Networked Games: An Approach based on Obsolescence”, Proceedings of the 7th International Conference on Internet, Multimedia Systems and Applications, Hawaii, Honolulu, August 2003.
[20] F. Espinoza, P. Persson, A. Sandin, H. Nyström, E. Cacciatore, M. Bylund, “GeoNotes: Social and Navigational Aspects of Location-Based Information Systems”, Proceedings of the Ubiquitous Computing International Conference, Atlanta, GA, September- October 2001, 2-17.
[21] J. Bates, M. D. Spiteri, D. Halls, J. Bacon, “Integrating Real-World and Computer-Supported Collaboration in the Presence of Mobility”, Proceedings of the IEEE 7th International Workshops in Enabling Technologies: Infrastructure for Collaborative Enterprises, Stanford, CA, June 1998, 256-261.
[22] G. Iacucci, K. Kuutti, M. Ranta, “On the Move with a Magic Thing: Role Playing in Concept Design of Mobile Services and Devices”, Proceedings of the ACM Symposium on Designing Interactive Systems, Brooklin, NY, 2000, 193-202.
[23] D. Chen and W. Stroup, “General Systems Theory: Toward a Conceptual Framework for Science and Technology Education for All”, Journal for Science Education and Technology, 1993.
[24] V. Colella, R. Borovoy, and M. Resnick, “Participatory Simulations: Using Computational Objects to Learn about Dynamic Systems”. Proceedings of the Computer Human Interface (CHI) '98 Conference, Los Angeles, April 1998.
[25] M. Resnick, and U. Wilensky, “Diving into Complexity: Developing Probabilistic Decentralized Thinking through Role-Playing Activities”, Journal of the Learning Sciences, 1998, 7(2), 153-171.


![High-Quality Rendering of Compressed Volume …jmk/papers/fout_eurovis05.pdfFout et al. / High-Quality Rendering of Compressed Volume Data Formats Hesselink [NH92] as fast, direct,](https://static.documents.pub/doc/80x56/5afdb5527f8b9a256b8bfe99/high-quality-rendering-of-compressed-volume-jmkpapersfout-et-al-high-quality.jpg)


![Fast Primitive Distribution for Illustrationajsecord/hatching/ajsecord_rw2002.pdf · CCS): I.3.3 [Computer Graphics]: Nonrealistic Rendering, Halftoning & Dithering, Monte Carlo Techniques,](https://static.documents.pub/doc/80x56/5f082beb7e708231d420b1d1/fast-primitive-distribution-for-illustration-ajsecordhatchingajsecord-ccs.jpg)


