A7.1 LOGIC Things to Learn (Key words, Notation & Formulae) Universal Set Set A A = { , , , … } A union B A intersection B Complement of A (i.e. Not in set A) A is a subset of B Empty or Null set x is an element of set A x A The number of elements in set A n(A) Section 1. Two- Way Tables: Q1. Data on the number of people who passed or failed their driving test at the first time is shown below. MALE FEMALE TOTAL PASSED 14 FAILED 8 TOTAL 25 45 a) Complete the two-way table above. b) How many people failed their test on their first attempt? Q2. Data on the performance of two rival train companies is shown below. On Time Early Late TOTAL Virgin Trains 29 250 South West Trains 174 6 TOTAL 384 49 a) Complete the two-way table above. b) What is the total number of people who were early?
Transcript
A7.1 LOGIC
Things to Learn (Key words, Notation & Formulae)
Universal Set
Set A A = { , , , … }
A union B
A intersection B
Complement of A (i.e. Not in set A)
A is a subset of B
Empty or Null set
x is an element of set A x A
The number of elements in set A n(A)
Section 1. Two- Way Tables:
Q1. Data on the number of people who passed or failed their driving test at the first time is shown below.
MALE FEMALE TOTAL
PASSED 14
FAILED 8
TOTAL 25 45
a) Complete the two-way table above.
b) How many people failed their test on their first attempt?
Q2. Data on the performance of two rival train companies is shown below.
On Time Early Late TOTAL
Virgin Trains 29 250
South West Trains 174 6
TOTAL 384 49
a) Complete the two-way table above.
b) What is the total number of people who were early?
A7.1 LOGIC
Section 2. Completing Venn Diagrams:
Q1. A group of 50 children were asked if they liked Teletubbies and/or if they liked Rosie &
Jim. 12 children liked Rosie & Jim, 42 liked Teletubbies, 8 liked both programmes.
a) Draw a Venn Diagram showing this information.
b) How many children did not like either programme?
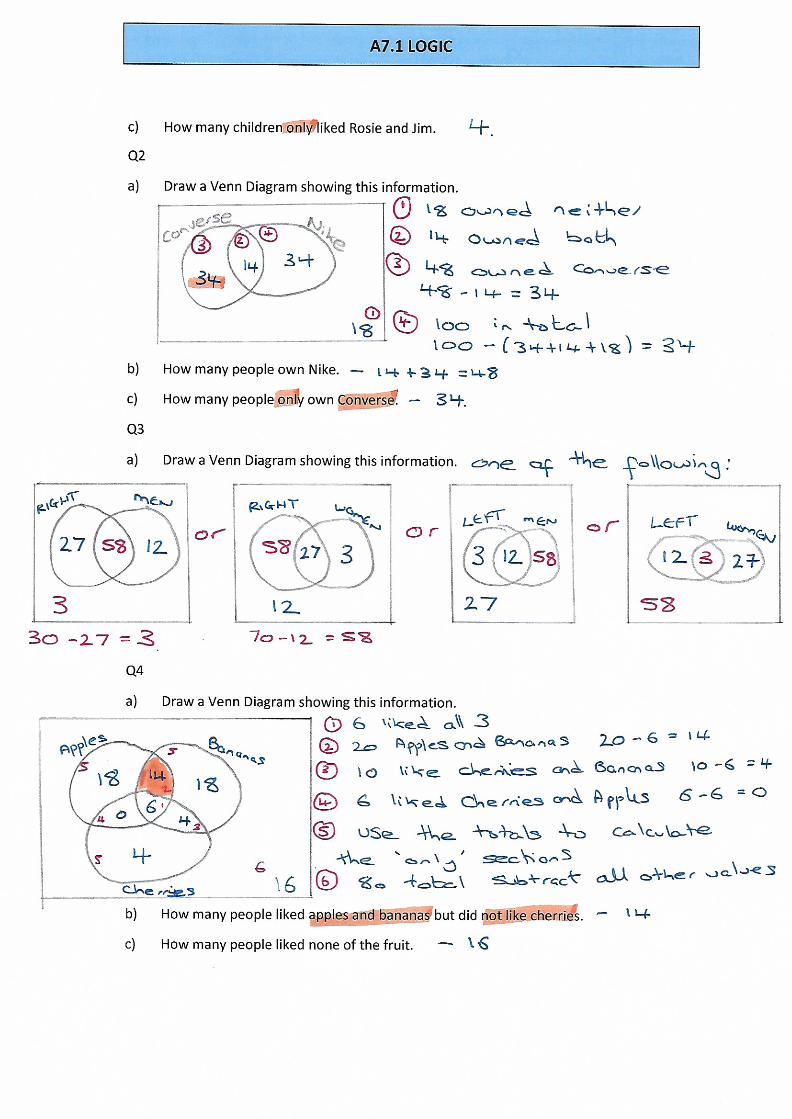
c) How many children only liked Rosie and Jim?
Q2. A group of 100 people were asked if they owned a pair of Converse shoes and if they
owned a pair of Nike trainers. 48 people owned Converse, 14 people owned both
types of footwear, 18 people owned neither.
a) Draw a Venn Diagram showing this information.
b) How many people own Nike?
c) How many people only own Converse?
Q3. People were asked if they were Right or Left Handed. The group consisted of 30
women and 70 men. 27 of the women were Right Handed, 12 of the men were Left
Handed.
a) Draw a Venn Diagram showing this information.
Q4. A group of 80 people were asked if they liked different fruit. 38 said they liked
apples, 42 like bananas, and 14 like cherries. 6 liked all 3 fruits. 20 people like apples and
bananas, 10 of the people who liked cherries also liked bananas. 6 people like cherries and
apples.
a) Draw a Venn Diagram showing this information.
b) How many people liked apples and bananas but did not like cherries?
c) How many people liked none of the fruit?
d) How many people liked just one of the fruits?
e) How many people liked at least 2 of the fruits?
A7.1 LOGIC
Q5. A group of 40 people were asked what they ate for lunch. ¾ of the group had a
sandwich, ½ the group had some fruit, 12 people had yoghurt. 10 of the people who
had yoghurt also had fruit, ¼ of the group had all 3 items, 2/3 of the sandwich eaters
also had fruit. 11 of the sandwich eaters also had yoghurt.
a) Draw a Venn Diagram to show this information.
b) How many people had just 1 of the named items?
c) How many people had fruit and yoghurt but no sandwich?
d) How many people had none of the named item?
e) How many people just had yoghurt?
f) How many people had a sandwich plus one other item?
Section 3. Venn Diagram Notation:
Q1. Which diagram correctly shades the region for set X?
Q2 Mrs Smith asks 24 pupils in her class
about their families. She sorts them into: S - {has sisters} B - {has brothers}
She showed her results on a Venn diagram.
a) Describe the shaded region in words.
X Y X Y
X Y X Y
A B
C D
A7.1 LOGIC
b) Describe the region S ’ B ’ in words.
c) What is the value of n( S ’ ) ?
d) How many students are in (S B) ?
Q3 O – {odd numbers} T – {Multiples of three} a) Using numbers from 1 to 10, complete this Venn diagram.
b) Shade in the region showing a multiple of three but not an odd number.
c) Describe the region O T in words.
d) How many numbers are in O ’ ?
e) What is the value of n(O T) ?
f) Work out the number of elements in (O T ’).
Q4. I = {the letters in the word India} E = {the letters in the word Europe} A= {the letters in the word America} a) Complete the Venn diagram.
b) List the elements of I E:
Make sure you include all 26 letters!
A7.1 LOGIC
c) List the elements of I A:
d) List the elements of A E:
e) What is n ( E I ) ?
f) What is n ( E A ) ?
g) How many elements are there in I A ?
h) How many elements are there in I A ‘ ?
i) How many elements are there in E ‘ A ‘ ?
Section 4. Solving Problems using two-way tables & Venn Diagrams:
Q1. A garden centre is offering three collections of fruit trees (Apple, Pear, Plum and
Cherry). There are 10 trees in collection A, 8 trees in collection B and 5 trees in collection C. All collections have at least one of each tree apart from collection C which has no Cherry trees. The numbers of Apple, Pear and Plum trees in collection C are all odd. All three collections have a total of 5 Pear trees and 4 Plum trees. Collection B has 2 Pear trees and 2 Plum trees. Collections B and C have the same number of apple trees and Collection A has the same number as B and C added together. How many Cherry trees are there in total from all three collections?
Q2. Out of 136 students in school, 60 take French, 100 take Chemistry and 16 take neither.