Aalborg Universitet CLIMA 2016 - proceedings of the 12th REHVA World Congress Heiselberg, Per Kvols Publication date: 2016 Document Version Publisher's PDF, also known as Version of record Link to publication from Aalborg University Citation for published version (APA): Heiselberg, P. K. (Ed.) (2016). CLIMA 2016 - proceedings of the 12th REHVA World Congress: volume 2. Aalborg: Aalborg University, Department of Civil Engineering. General rights Copyright and moral rights for the publications made accessible in the public portal are retained by the authors and/or other copyright owners and it is a condition of accessing publications that users recognise and abide by the legal requirements associated with these rights. ? Users may download and print one copy of any publication from the public portal for the purpose of private study or research. ? You may not further distribute the material or use it for any profit-making activity or commercial gain ? You may freely distribute the URL identifying the publication in the public portal ? Take down policy If you believe that this document breaches copyright please contact us at [email protected] providing details, and we will remove access to the work immediately and investigate your claim. Downloaded from vbn.aau.dk on: august 17, 2018
Transcript
Aalborg Universitet
CLIMA 2016 - proceedings of the 12th REHVA World Congress
Heiselberg, Per Kvols
Publication date:2016
Document VersionPublisher's PDF, also known as Version of record
Link to publication from Aalborg University
Citation for published version (APA):Heiselberg, P. K. (Ed.) (2016). CLIMA 2016 - proceedings of the 12th REHVA World Congress: volume 2.Aalborg: Aalborg University, Department of Civil Engineering.
General rightsCopyright and moral rights for the publications made accessible in the public portal are retained by the authors and/or other copyright ownersand it is a condition of accessing publications that users recognise and abide by the legal requirements associated with these rights.
? Users may download and print one copy of any publication from the public portal for the purpose of private study or research. ? You may not further distribute the material or use it for any profit-making activity or commercial gain ? You may freely distribute the URL identifying the publication in the public portal ?
Take down policyIf you believe that this document breaches copyright please contact us at [email protected] providing details, and we will remove access tothe work immediately and investigate your claim.
Abstract Further reduction of primary energy for heating and cooling of buildings requires new intelligent solutions in air conditioning with a high operational flexibility. One option is the functional combination of technical textiles with the ability of heating and cooling into thermo-active textiles. It is expected, that these textile constructions have a set of advantages compared to conventional panel heating and cooling systems. Small water pipes with an inner diameter of 3 mm are sewn into the textile. It is important to keep the pressure loss as low as possible. Hence, underserved areas can be avoided. Several textile prototypes with thermo-active abilities were produced. The prototypes vary in their size and water flow pattern. The dimensions are 0.5 m x 0.5 m and 0.12 m x 1.2 m. The prototypes were analyzed for their mechanical and thermal properties. Heating and cooling performance data of textiles have been derived from experiments carried out under reproducible conditions in a test chamber designed for this kind of testing. The test chamber is 0.84 m long, 0.51 m wide and 1.50 m high. One wall of the test chamber is a thermo-active wall. All other walls of the test chamber are made from Styrofoam. Additionally, comprehensive numerical studies of the thermal behavior of the prototypes were performed. The available data show a very good match between experimental und numerical results as well as a great potential of thermo-active textiles for space heating and cooling.
People from developed countries spend more than 90% of their life indoors [1]. Hence, it is of particular interest to ensure the thermal comfort in a room. Next to this point, particular attention should be paid to the further reductions of primary energy in heating and cooling of buildings. For this reason, new and intelligent solutions for air conditioning of buildings are needed. One possibility could be the functional combination of technical textiles with the ability of heating and cooling. The following investigation provides a first impression of the application possibilities.
2. Experimental Analysis of Thermo-active Textiles
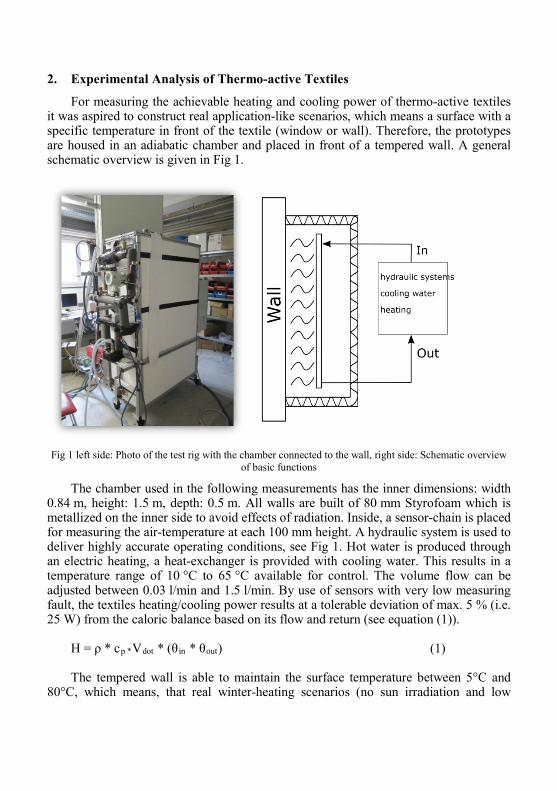
For measuring the achievable heating and cooling power of thermo-active textiles it was aspired to construct real application-like scenarios, which means a surface with a specific temperature in front of the textile (window or wall). Therefore, the prototypes are housed in an adiabatic chamber and placed in front of a tempered wall. A general schematic overview is given in Fig 1.
Fig 1 left side: Photo of the test rig with the chamber connected to the wall, right side: Schematic overview
of basic functions
The chamber used in the following measurements has the inner dimensions: width 0.84 m, height: 1.5 m, depth: 0.5 m. All walls are built of 80 mm Styrofoam which is metallized on the inner side to avoid effects of radiation. Inside, a sensor-chain is placed for measuring the air-temperature at each 100 mm height. A hydraulic system is used to deliver highly accurate operating conditions, see Fig 1. Hot water is produced through an electric heating, a heat-exchanger is provided with cooling water. This results in a temperature range of 10 °C to 65 °C available for control. The volume flow can be adjusted between 0.03 l/min and 1.5 l/min. By use of sensors with very low measuring fault, the textiles heating/cooling power results at a tolerable deviation of max. 5 % (i.e. 25 W) from the caloric balance based on its flow and return (see equation (1)).
H = ρ * cp *Vdot * (θ in * θout) (1) The tempered wall is able to maintain the surface temperature between 5°C and
80°C, which means, that real winter-heating scenarios (no sun irradiation and low
window temperature), as well as certain cooling conditions can be set up. Wall and chamber can be separated for changing textile prototypes.
2.1 Set of Thermo-active Textiles
A brief overwiev of the six different prototype designs investigated so far is given in the following.
• Type A: 50 (silicon) tubes woven in polyester textile, each connected to collector/distributor; first design being developed, 0.5 m x 0.5 m
• Type B: as Type A but with only 25 (polyurethane, pu) tubes, five sets of tubes led up and down
• Type C: curtain slat, six (pu) tubes led up and down, 0.12 m x 1.20 m • Type D: as Type A, but with two meandering (pu) tubes • Type E: one pu tube woven in polyester textile, meandering , 0.5 m x 0.5 m • Type F: first welded design, polyurethane coated nylon-web, one meandering
water-bearing channel, no collector/distributer necessary, 0.5 m x 0.5 m
Fig 2: Three examples of the prototypes, from left to right: type B, C and F
2.2 Thermography Analysis
Before starting tests of the textiles heating/cooling performance, the flow through parallel pipes was checked with thermography images. As one can see in Fig 3, there are tubes on the left side providing lower temperatures than on the right hand side. This indicates flow-inhomogeneities caused by unbalanced flow rates.
Fig 3: Thermography images Type A, left: heating mode, right: Cooling mode
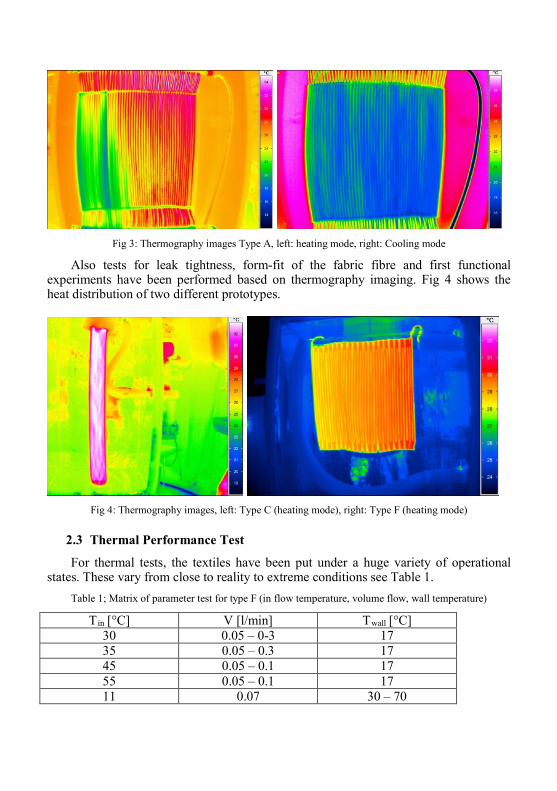
Also tests for leak tightness, form-fit of the fabric fibre and first functional experiments have been performed based on thermography imaging. Fig 4 shows the heat distribution of two different prototypes.
Fig 4: Thermography images, left: Type C (heating mode), right: Type F (heating mode)
2.3 Thermal Performance Test
For thermal tests, the textiles have been put under a huge variety of operational states. These vary from close to reality to extreme conditions see Table 1.
Table 1; Matrix of parameter test for type F (in flow temperature, volume flow, wall temperature)
The wide range is chosen to get information about the performance for steady state operation, as well as maximum characteristics for transient conditions, like sudden high sun radiation in cooling cases.
The volume flow was chosen in a range between a minimum that ensures correct flow in all tubes or channels (0.05 l/min) and a maximum where there is no significant rise in power output in connection with the risk of flow noise (0.3 l/min).
Tests have been performed for in total six different prototype designs. Following further explanations will be given related to the ultrasonic welded (Type F, see Fig 2, right) textile.
2.4 Results of the Experimental Investigations for Type F
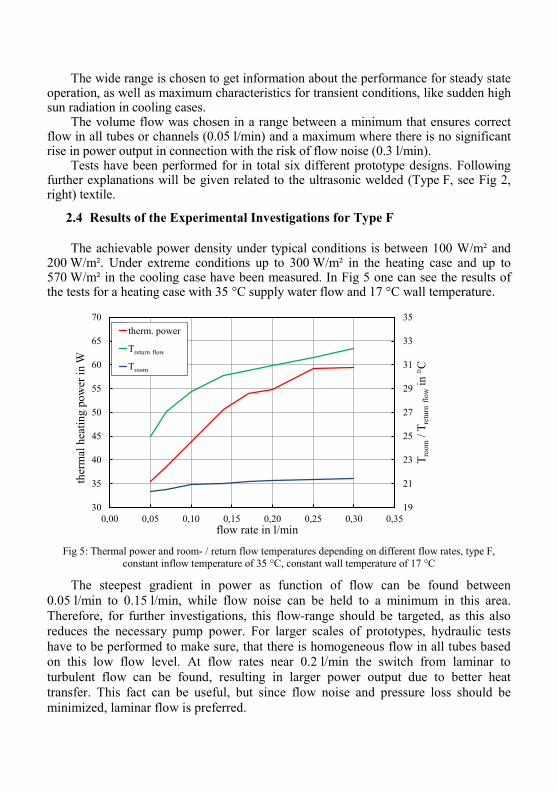
The achievable power density under typical conditions is between 100 W/m² and 200 W/m². Under extreme conditions up to 300 W/m² in the heating case and up to 570 W/m² in the cooling case have been measured. In Fig 5 one can see the results of the tests for a heating case with 35 °C supply water flow and 17 °C wall temperature.
19
21
23
25
27
29
31
33
35
30
35
40
45
50
55
60
65
70
0,00 0,05 0,10 0,15 0,20 0,25 0,30 0,35
T roo
m/ T
retu
rnflo
win
°C
ther
mal
hea
ting
pow
er in
W
flow rate in l/min
H(T_in35)
Out(T_in35)
T_Room
therm. power
Treturn flow
Troom
Fig 5: Thermal power and room- / return flow temperatures depending on different flow rates, type F,
constant inflow temperature of 35 °C, constant wall temperature of 17 °C
The steepest gradient in power as function of flow can be found between 0.05 l/min to 0.15 l/min, while flow noise can be held to a minimum in this area. Therefore, for further investigations, this flow-range should be targeted, as this also reduces the necessary pump power. For larger scales of prototypes, hydraulic tests have to be performed to make sure, that there is homogeneous flow in all tubes based on this low flow level. At flow rates near 0.2 l/min the switch from laminar to turbulent flow can be found, resulting in larger power output due to better heat transfer. This fact can be useful, but since flow noise and pressure loss should be minimized, laminar flow is preferred.
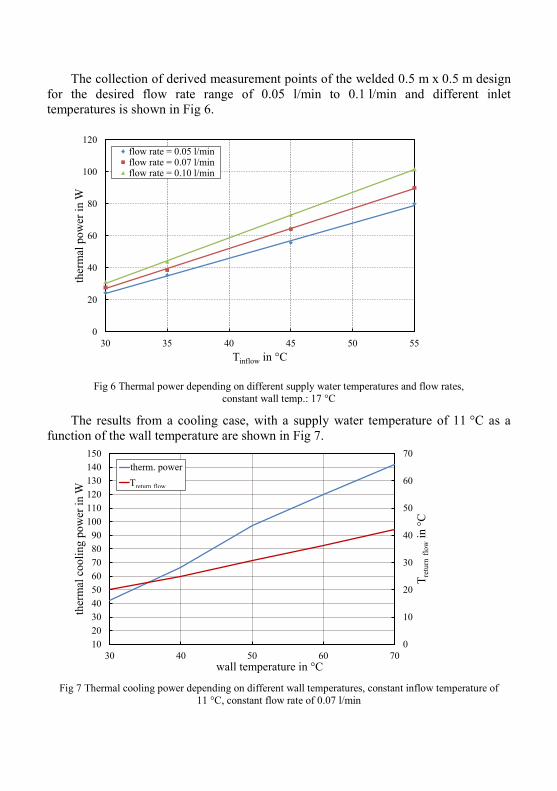
The collection of derived measurement points of the welded 0.5 m x 0.5 m design for the desired flow rate range of 0.05 l/min to 0.1 l/min and different inlet temperatures is shown in Fig 6.
Fig 6 Thermal power depending on different supply water temperatures and flow rates, constant wall temp.: 17 °C
The results from a cooling case, with a supply water temperature of 11 °C as a function of the wall temperature are shown in Fig 7.
0
10
20
30
40
50
60
70
102030405060708090
100110120130140150
30 40 50 60 70
T ret
urn
flow
in °C
ther
mal
coo
ling
pow
er in
W
wall temperature in °C
therm. powerT_outTreturn flow
Fig 7 Thermal cooling power depending on different wall temperatures, constant inflow temperature of
11 °C, constant flow rate of 0.07 l/min
The experiments that have been carried out so far show the great potential of thermo-active textiles both for the heating case and for the cooling case.
3. Numerical Investigations
Numerical investigations are carried out by coupling dynamic building simulation with Computational Fluid Dynamics (CFD). Whereas building simulation is applied to model the test chamber including heat conduction and radiation, CFD is used for the air flow inside the chamber as well as the three-dimensional heat conduction and the water flow inside the thermo-active textile. In this way all the thermal, aerodynamic and hydrodynamic phenomena could be taken into account.
The calculation procedure is a co-simulation of TRNSYS-TUD, a special version of the commercially available dynamic building and system simulation code TRNSYS [2],[3], ParallelNS, an in house Finite-Element-CFD code [4] and ANSYS /Fluent, a well-known commercially available CFD program [5].
3.1 Simulation Model of the Test Chamber
The test chamber as well as the thermo-active textile is modelled in detail. Therefore, numerical models exist for all three above mentioned programs resolved and coupled in space and time. In this way, the above discussed experiments can be repeated in the computational space in a virtual test chamber; see Fig 8.
Fig 8 Virtual test chamber with thermo-active textiles of type C (left) and F (right), inner surface
temperatures, test parameters according to Table 2
As results there are all quantities of the transient numerical coupled simulation, like surface, air and water temperatures, air and water velocities and integral data like the heat output from the textile, subdivided into the convective and radiative part, and the corresponding mass and enthalpy flows. In addition, the surface temperature reveals the flow path across the textile, which is also a matter of investigation; see Fig 8.
3.2 Comparison between the Experimental and the Numerical Results
Comparing the data from the experiments and from the calculations a good accordance between the results can be stated, see Table 2. The surface temperature of the cooling plate is 17 °C in both cases. The mass flow and the inflow temperatures are different. Table 2 Comparison between simulation- and measurement results, types C and F, different test parameters
type volume
flow rate in l/min
inflow temp. in °C
return temp. in °C measured
return temp. in °C simulated
therm. power in W
measured
therm. power in W
simulated C 0.07 30.0 24.68 24.81 25.73 25.15 F 0.17 35.0 27.60 27.43 28.75 29.12
Due to the good concordance between measurement and simulation the extrapolation of the simulation models to real thermo-active textiles under practical conditions should be possible.
3.3 Numerical Extrapolation to Real Indoor Situations
The perseptions from the experiment and the numerical simulations in the virtual test chamber are used to specify situations of practical interest like a heating and cooling curtain in an office room, see Fig 9 for geometrical details. Additionally the thermo-active textiles in operation and the inner wall temperatures are shown.
To this end, within the program system, already described the modeling of a thermo-active textile, based on the type A in a typical two-person office with floor area of 5.8 m x 6.0 m and a ceiling height of 3.0 m takes place. The office has one outer wall, a 3.0 m wide and 1.5 m high window and furniture for two people. Accordingly, the system technology and the internal thermal loads are also specified for two people. Specifically, since an old-building renovation as an application makes sense, the wall constructions correspond to a typical building from the 70s. For ventilation air intakes are diverse, outside air vent elements and window ventilation available.
The simulations are carried out over a transient simulation period of 15 days, the building simulation the first 14 days runs uncoupled to ensure steady states in the building envelope. Then, on the 15th day, the coupled simulation with indoor air flow calculation takes place.
Fig 9: Inner surface temperatures of a two person office with thermo-active textiles near the outer wall, snapshot at 2 p.m. (simulation time), left: heating case, right: cooling case, textile in front of the window
For the heating case a cold period with outdoor temperatures of -5 °C is assumed, for cooling case a hot summer period with temperatures above 30 °C and high solar loads is applied. The thermo-active textile is simplified based on the prototype examination modeled by controlled thermo-active layers. For heating, the data correspond to a flow / return temperature of 55 °C / 45 °C, for cooling temperatures of 18 °C / 21 °C are designed. Set point for heating is an operational temperature of 22.0 °C and in the case cooling of 24.5 °C in the occupied zone in 0.6 m height.
Due to the high spatial and temporal resolution of the procedure are at any point in the simulation highly detailed simulation results. As an example a good criterion for controlling the operation of thermo-active textiles in heating and cooling mode that takes into account the air velocity, the turbulence intensity, the relative humidity in addition to compliance with the operating temperature, is the Predicted Mean Vote (PMV) in accordance with DIN ISO 7730. In Fig 10 are the values of the PMV for 2 p.m. visible for both cooling and heating.
Fig 10: Horizontal sections of the Predicted Mean Vote (PMV) at 2 p.m. - left with active cooling, right with active heating
It can be seen with reference to the PMV values close to zero that it is possible to achieve thermally comfortable conditions under summer and winter conditions with the thermo-active textiles.
4. Conclusions and Outlook
Thermo-active textiles offer an interesting way of flexible heating and cooling. To proof this, experiments and numerical calculations are carried out in a test chamber similar to radiator testing. The results of the experiments show heat flux densities between 100 W/m² and 300 W/m² in heating case and up to 570 W/m² to compensate solar gains in cooling case.
In addition, numerical studies of the thermal behavior and the heat output of the prototypes were performed. The data from comparative simulations with the experiments show a very good match between experimental and numerical results. The results were transferred to applications in real rooms and show the great potential of thermo-active textiles for space heating and cooling.
In the near term more practical investigations will follow, like the connection to water supply by a water socket and investigations concerning durability. Future applications may reach from thermo-active solar shading up to textile architecture including heating and cooling functions, see e.g. [6].
Acknowledgement
The work is supported by the German Research Foundation under contract FE1179/2.
References
[1] Sprengler JD, Sexton K, “Indoor air pollution: a public health perspective”, Science, 221, 9-17, 1983 [2] Klein, S. A., Duffie J. A., Beckman, W. A.: TRNSYS - A Transient Simulation Program. ASHRAE Trans 82 (1976), S. 623 [3] Perschk, A.: Gebäude- und Anlagensimulation – „Ein Dresdner Modell“. GI Gesundheitsingenieur / Haustechnik / Bauphysik / Umwelttechnik, Bd. 131, Nr.4 [4] Knopp, T., Lube, G., Gritzki, R., Rösler, M. 2005. A near-wall strategy for buoyancy-affected turbulent flows using stabilized FEM with applications to indoor air flow simulation. Computer Meths. Applied Mechan. Engrg. 194, 3797-3816 [5] Ansys Fluent 17 Tutorial Guide. January 2016 [6] www.textile-architektur.de (access on 01.03.2016)