Aalborg Universitet Wind Farm Active Power Dispatch for Output Power Maximizing Based on a Wind Turbine Control Strategy for Load Minimizing Zhang, Baohua; Hu, Weihao; Hou, Peng; Soltani, Mohsen; Chen, Zhe Published in: International Conference on Sustainable Mobility Applications, Renewables and Technology (SMART), 2015 DOI (link to publication from Publisher): 10.1109/SMART.2015.7399215 Publication date: 2015 Document Version Accepted author manuscript, peer reviewed version Link to publication from Aalborg University Citation for published version (APA): Zhang, B., Hu, W., Hou, P., Soltani, M., & Chen, Z. (2015). Wind Farm Active Power Dispatch for Output Power Maximizing Based on a Wind Turbine Control Strategy for Load Minimizing. In International Conference on Sustainable Mobility Applications, Renewables and Technology (SMART), 2015 (pp. 1-6). IEEE Press. https://doi.org/10.1109/SMART.2015.7399215 General rights Copyright and moral rights for the publications made accessible in the public portal are retained by the authors and/or other copyright owners and it is a condition of accessing publications that users recognise and abide by the legal requirements associated with these rights. ? Users may download and print one copy of any publication from the public portal for the purpose of private study or research. ? You may not further distribute the material or use it for any profit-making activity or commercial gain ? You may freely distribute the URL identifying the publication in the public portal ? Take down policy If you believe that this document breaches copyright please contact us at [email protected] providing details, and we will remove access to the work immediately and investigate your claim.
Transcript
Aalborg Universitet
Wind Farm Active Power Dispatch for Output Power Maximizing Based on a WindTurbine Control Strategy for Load Minimizing
Published in:International Conference on Sustainable Mobility Applications, Renewables and Technology (SMART), 2015
DOI (link to publication from Publisher):10.1109/SMART.2015.7399215
Publication date:2015
Document VersionAccepted author manuscript, peer reviewed version
Link to publication from Aalborg University
Citation for published version (APA):Zhang, B., Hu, W., Hou, P., Soltani, M., & Chen, Z. (2015). Wind Farm Active Power Dispatch for Output PowerMaximizing Based on a Wind Turbine Control Strategy for Load Minimizing. In International Conference onSustainable Mobility Applications, Renewables and Technology (SMART), 2015 (pp. 1-6). IEEE Press.https://doi.org/10.1109/SMART.2015.7399215
General rightsCopyright and moral rights for the publications made accessible in the public portal are retained by the authors and/or other copyright ownersand it is a condition of accessing publications that users recognise and abide by the legal requirements associated with these rights.
? Users may download and print one copy of any publication from the public portal for the purpose of private study or research. ? You may not further distribute the material or use it for any profit-making activity or commercial gain ? You may freely distribute the URL identifying the publication in the public portal ?
Take down policyIf you believe that this document breaches copyright please contact us at [email protected] providing details, and we will remove access tothe work immediately and investigate your claim.
Abstract— Inclusion of the wake effect in the wind farm
control design (WF) can increase the total captured power by wind turbines (WTs), which is usually implemented by derating upwind WTs. However, derating the WT without a proper control strategy will increase the structural loads, caused by operation in stall mode. Therefore, the WT control strategy for derating operation should be considered in the attempt at maximizing the total captured power while reducing structural loads. Moreover, electrical power loss on the transmission system inside a WF is also not negligible for maximizing the total output power of the WF. In this paper, an optimal active power dispatch strategy based on a WT derating strategy and considering the transmission loss is proposed for maximizing the total output power. The active power reference of each WT is chosen as the optimization variable. A partial swarm optimizing algorithm is used for solving the problem. Simulation results show the effectiveness of the proposed strategy.
Keywords—wind farm active power dispatch; power
maximizing; wake effect; transmission loss; load minimizing
I. INTRODUCTION
Wakes in a wind farm (WF) may bring a significant loss of wind power due to the reduction of wind speed at downwind wind turbines (WTs). However, many research works have claimed that derating the power captured by the upwind WTs can reduce the wake effect and increase the total power captured in the WF [1-8].
These works maximize the total captured power of WFs by optimizing the control settings to each WT. In [1] and [2], a model free approach and a data-driven adaptive scheme are proposed to adjust the control settings of each WT. The control variables used in these works are axial induction factors. In [3], both the axial induction factor and the yaw offset angle are adopted as control variables and a steepest descent algorithm is applied to find the optimal combination. In [4], the control parameters are the thrust coefficient of individual turbines as a function of time, and a receding-horizon predictive control setting was employed in solving the optimization problem. The
above methods did not include the WT model into the optimization problem. In [5], a static WT model was adopted to represent the WT aerodynamics and the pitch angle was chosen as the optimization variable. In [6], the pitch angle of each WT is chosen as the control variable and blade element momentum theory and the eddy viscosity model are used to describe the WT aerodynamics and the wakes. The pitch angle and rotational speed of each WT are chosen as the optimization variables in [7], and Jensen model is used to present the wake effect. In [8], the pitch angle and tip speed ratio are used as the optimization variable. However, using the tip speed ratio has the same effect with using the rotational speed, because one can be easily transformed to the other if the wind speed is known.
In the above works, the optimizing variables are chosen as the axial induction factor, the yaw offset angle, the thrust coefficient, the pitch angle, the rotational speed (tip speed ratio), or the combination of two of them. However, they tried to find the maximum power by derating the upwind WTs, without giving much attention to the control strategy of each WT. Furthermore, derating the WT without a proper control strategy may cause more load on the mechanical structure and may risk the WT running into the stall region, where more turbulence will be caused and more loads will be produced on the downwind WTs. Therefore, the WT control strategy for derating operation should be considered in maximizing the total captured power in the WF. A Max-Ω control strategy for WT derating control is proposed in [9], which claimed that the strategy can reduce the load on the WT structure, decrease the risk of going to stall region and bring bigger inertia in the rotor for the WT to provide inertial response. Besides the WT derating control strategy, the power loss in the transmission system was also not considered in the above works.
In this paper, an optimal active power dispatch strategy for maximizing the total output power is proposed, which considers the WT derating control strategy and the electrical loss on the transmission cables. The active power reference of each WT is chosen as the optimization variable and the Max-Ω control strategy is used for WT derating control. The WT active power is modeled by static lookup tables and the wakes
This research work is supported by the Danish Strategic Research Centre
(Grant DSF 09-067255), “Development of a Secure, Economic and
Environmentally-friendly Modern Power System” (SEEMPS)
are modelled by Jensen wake model. A full Newton–Raphson method is adopted to calculate the electrical loss on the transmission system. The whole optimization problem is solved by a partial swarm optimizing (PSO) algorithm.
This paper is organized as follows: Section II describes the WF model. Section III shows the formulation of the optimization problem and the method used to solve the problem. The effect of the new strategy is illustrated in Section IV, and finally conclusions are drawn in Section V.
II. WIND FARM MODEL
The wake model and the power loss model on transmission cables are specified in this section. The WT model using traditional control strategy with no derating is also illustrated and will be used as a baseline for comparison.
A. Wind Turbine Model
The WT model used in this paper is a static model, which is
based on the look-up tables of the power coefficient PC and
the thrust coefficient TC . Then, the WT mechanical power
mecP and the thrust force TF can be calculated using the
following equations [10]:
2 3 ,2
mec pP R v C (1)
2 2 ,2
T TF R v C (2)
where is the air density, R is the rotor radius, v is the
wind speed, is the blade pitch angle and is the tip-speed
ratio.
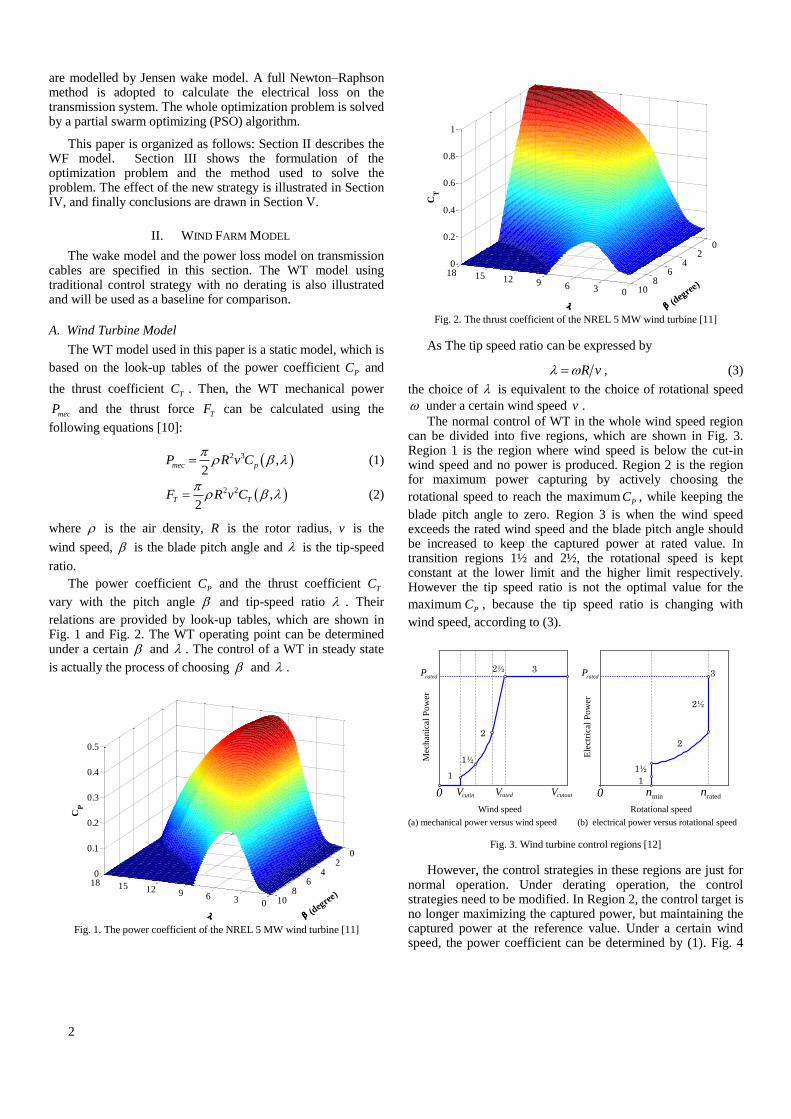
The power coefficient PC and the thrust coefficient
TC
vary with the pitch angle and tip-speed ratio . Their
relations are provided by look-up tables, which are shown in Fig. 1 and Fig. 2. The WT operating point can be determined under a certain and . The control of a WT in steady state
is actually the process of choosing and .
0369121518
02
46
810
0
0.1
0.2
0.3
0.4
0.5
(deg
ree)
CP
Fig. 1. The power coefficient of the NREL 5 MW wind turbine [11]
0369121518
02
46
810
0
0.2
0.4
0.6
0.8
1
(deg
ree)
CT
Fig. 2. The thrust coefficient of the NREL 5 MW wind turbine [11]
As The tip speed ratio can be expressed by
R v , (3)
the choice of is equivalent to the choice of rotational speed
under a certain wind speed v .
The normal control of WT in the whole wind speed region can be divided into five regions, which are shown in Fig. 3. Region 1 is the region where wind speed is below the cut-in wind speed and no power is produced. Region 2 is the region for maximum power capturing by actively choosing the
rotational speed to reach the maximumPC , while keeping the
blade pitch angle to zero. Region 3 is when the wind speed exceeds the rated wind speed and the blade pitch angle should be increased to keep the captured power at rated value. In transition regions 1½ and 2½, the rotational speed is kept constant at the lower limit and the higher limit respectively. However the tip speed ratio is not the optimal value for the
maximumPC , because the tip speed ratio is changing with
wind speed, according to (3).
Mec
han
ical
Po
wer
0
ratedP
ratedV cutoutVcutinV
Wind speed
1
1½
2½
2
3
Ele
ctri
cal
Po
wer
0
ratedP
Rotational speed
1
1½
2½
2
3
minn ratedn
(a) mechanical power versus wind speed (b) electrical power versus rotational speed
Fig. 3. Wind turbine control regions [12]
However, the control strategies in these regions are just for normal operation. Under derating operation, the control strategies need to be modified. In Region 2, the control target is no longer maximizing the captured power, but maintaining the captured power at the reference value. Under a certain wind speed, the power coefficient can be determined by (1). Fig. 4
3
shows the level curve when PC is 0.3. It can be observed there
are many options for choosing and . In Region 2, the
rotational speed can be changed between its lower and
upper limits, which gives a wide range of .
(degree)
0 2 4 6 8 102
7
12
17
Fig. 4. The power coefficient level curve for the value of 0.3
The Max-Ω control strategy for derating operation proposed in [9] maximizes the rotational speed for each wind speed under each demanded power. Fig. 5 shows the operating
points on the PC level curve for Max-Ω control strategy when
the demanded power is 2.5MW in the whole wind region. The red circles are the operating points. It can be seen the tip speed ratio is maximized rather than being kept at the optimal
value 7.55 in normal Region 2 control strategy. The Max-Ω control strategy can reduce the load on the WT structure, decrease the risk of going to stall region and bring bigger inertia in the rotor for providing inertial response for the grid. Therefore, it is used in this paper for the WT derating control.
0 5 10 15 20 25 300
5
10
15
20
(degree)
Fig. 5. Wind turbine operating points on the power coefficient level curve for
Max-Ω control strategy when derating to 2.5MW in the whole wind region
B. Wake Model
The aerodynamic interaction between WTs in the WF is presented by wake models. In this paper, Jensen model is used to simulate the wakes, which assumes a linear wake expanding behind the upstream WT [13], [14]. In a large WF, the downstream WT would be affected by several upstream WTs. Therefore, the multiple wake model is needed to evaluate the deficit on the downwind WTs, which is specifically explained in [15]:
2
,00 0
0
- * 1- 1- * *over
ij
lap ij
t
ij
SRv v v C
R S
(4)
0 * ij ijR R k L (5)
where all the parameters have the same meaning as in the
references. By using this model, the wind velocity at the WT at
row n, column m can be derived as:
_ _2
0*
1 1 0
[1- [1- ] ]N rowN col
ij
nm
i j
vv v
v
(6)
C. Power loss model on transmission cables
Consider the cable connecting the two buses i and j in Fig. 6, where y and I is the admittance and current of each cable,
and V is the voltage on each bus. The cable current,ijI ,
measured at bus i and j defined positive in the direction i j
is given by
0 0ij l i ij i j i iI I I y V V y V . (7)
Similarly, the cable current jiI is given by
0 0ji l j ij j i j jI I I y V V y V . (8)
0iI 0jI
lI
0iy
jVjiI
ijy
0jy
ijI iV
Fig. 6. The cable model for calculating losses [16]
The power loss in cable ij is the algebraic sum of the
complex powers ijS from bus i and j and
jiS from bus j and i,
* *loss
ij ij ji i ij j jiS S S V I V I . (9)
So, the active power loss in cable ij is:
real ( )loss loss
ij ijP S (10)
III. PROBLEM FORMULATION AND OPTIMIZATION
The optimization problem including the objective function and constraints are formulated in this section, and is solve by an improved PSO algorithm that is adopted as the optimization method.
A. Application of Max-Ω control strategy
As discussed in section II, the power extracted by each WT
is based on the PC value and wind speed, while the wind speed
at downwind WTs is determined by the TC value at upwind
WTs. Both PC and
TC are functions of and , so and
can be chosen as the optimization variables. However, in
this paper, the reference power of each WT is chosen as the optimization variable and the Max-Ω control strategy is chosen as the WT control strategy. Therefore, and are
4
determined by solving the following optimization problem for each wind speed in Region 2.
Maximize , (11)
Subject to min rated (12)
,P ref wC P P (13)
where min and
rated are the minimum and rated rotational
speed, refP and
wP are the reference power and the total
available power on the rotor disc. This optimization problem can be solved offline to generate
look-up tables for and with respect to wind speed and
refP . Therefore, when the wind speed and refP is determined,
and of upwind WTs by searching the , refv P and the
, refv P lookup tables. Then TC can be determined by
searching the ,TC lookup table. Thus the wind speed at
the downwind WTs can be calculated using the wake model (4)–(6).
B. Optimization problem formulation
The total output power of the WF can be calculated by:
1 1, 1
W BN NWF k loss
out mec ij
k i j
P P P
(14)
where k
mecP is the captured power from WT k , WN is the
number of WTs, loss
ijP is the active power loss in cable ij ,
BN is the number of buses.
The objective function of the problem can be expressed as:
1 1, 1
maxW
kref
BN Nk loss
mec ij
k i jP
P P
(15)
Constraints:
1
cosBN
j j i ji ji j i
i
P V V Y
(16)
1
sinBN
j j i ji ji j i
i
Q V V Y
(17)
min max
j j jV V V (18)
min max
j j j (19)
min k max (20)
0 k
ref ratedP P (21)
, 0PC
(22)
, 0PC
(23)
where jP and jQ are the active power and reactive power
injected at bus j , jV and j are the voltage and angle of
each bus, jiY is the entry in the j
th row i
th column of the
admittance matrix.
The reviewed papers take the axial induction factors, the yaw offset angle, the thrust coefficient, the pitch angle, the rotational speed (tip speed ratio), or the combination of two of them as the control variables. However for the optimal power flow problems in power system engineering, it is more usual to use the active power of each WT as the optimizing variable. Therefore, the active power reference of each WT is chosen as the control variable and the other variables as the dependent variables, such as the pitch angles, the rotational speed, the thrust coefficient, the bus voltage and bus angles. In the power flow problem, the point of common coupling is treated as slack bus and all the other buses are treated as PQ buses. A full Newton–Raphson method is used to solve the power flow equations. The power flow constraints include the power flow balance limits (16), (17), and the bus voltage and angle limits (18), (19). In this paper, the voltage range is assumed as [0.95; 1.05], and the angle is assumed in the range of [-π/2; π/2]. The
control variable should within zero and the rated power ratedP
and the pitch angle should be within its minimum and maximum value, which are chosen as 0° and 10°. In order to ensure the WT not to fall into stall region, 𝜆 and β has to be limited to the right side of 𝜆–CP curve and β–CP curve, respectively. The constraints are expressed as (22), (23).
C. Optimization method
Since the problem is nonlinear and non-convex. Heuristic algorithm should be a suitable choice to solve this problem. Based on the social behavior of fish schooling and bird flocking, Kennedy and Eberhart [17] proposed the PSO algorithm which has a good performance of solving non-linear optimization problem. In this paper, the PSO algorithm is adopted to solve the optimization problem.
IV. CASE STUDY
In this paper, a WF with 5 turbines in 5 rows is chosen to test the proposed strategy. The WF is in a rectangular pattern with 882 m (seven times the WT diameter) between the turbines. The layout of the WF is shown in Fig. 7.
Wind
Tranformer
Grid
4
3
2
1
1 2 3 4 5
0°
90°
180°
270°
270°
5
Fig. 7. The layout of the wind farm
5
The cables in the WF are 95, 150 or 240 mm2
(chosen by load, corresponding to cables between row 1 and row 3, between row 3 and row 5 and between row 5 and the transformer, respectively) XLPE-Cu, operated at 34 kV nominal voltage [18]. The parameters of the cables are shown in Table I. The WT used here is the 5 MW NERL WT, whose parameters are listed in Table II.
In normal operations, the WTs are controlled using the
traditional five region control strategy, which is specified in section II. In this section, the effects of the proposed strategy and the traditional strategy are compared when wind speed is 10 m/s and wind direction is 0°, 90°, 180° and 270°. The total captured power by WTs, the transmission cable loss, and the total output power of the WF are listed in Table III. It can be seen, the proposed dispatch strategy can maximize the total output power at every working conditions. The transmission cable loss is decreased at 180° and 270°, whereas is increased at 0° and 90°. The reason is that when wind direction is 0° or 90°, the WTs with higher wind speed are nearer to the PCC, thus the active power circulation distance is almost the smallest, which means smaller loss on cables. Therefore, if upwind WTs are derated to increase the total captured power, it will increase the circulation distance of active power, resulting in higher cable loss.
TABLE III
COMPARISION OF THE RESULTS BEFORE AND AFETER OPTIMIZATION
Wind direction 0° 90° 180° 270°
Traditional
strategy
Total captured power (MW) 49.872 49.872 49.872 49.872
Cable loss (MW) 0.117 0.133 0.167 0.199
Total output power (MW) 49.755 49.739 49.705 49.673
Proposed
strategy
Total captured power (MW) 52.135 52.431 52.887 52.852
Cable loss (MW) 0.136 0.147 0.166 0.188
Total output power (MW) 51.999 52.284 52.721 52.664
Increase
percentage Total output power 4.51% 5.12% 6.07% 6.02%
The active power set points and the tip-speed ratio of each WT when wind direction is 270° are shown in Fig. 8 and Fig. 9 respectively. The red points give the values after optimization. It can be seen from Fig. 8 that the upwind WTs are derated, especially the first column, whereas the power of downwind WTs is increased. From Fig. 9 we can see that the tip-speed
ratios of each WT are increased by using the Max-Ω control strategy, which is in accordance with the theory.
1 2 3 4 512
34
50
1
2
3
4
Column
Row
Pre
f (M
W)
Traditional Strategy
Proposed Strategy
Fig. 8. Active power set points of each WT in the wind farm before and
after optimization when wind direction is 270°
1 2 3 4 512
34
50
2
4
6
8
10
Column
Row
Traditional Strategy
Proposed Strategy
Fig. 9. Tip-speed ratios of each WT in the wind farm before and after
optimization when wind direction is 270°
V. CONCLUSION
The optimal active power dispatch strategy proposed in this paper shows the ability to improve the total output power of a WF. Comparing with previous work, the control variables in this paper are the active power references of each WT, which can be received as a command signal by commercial WTs. The proposed dispatch also considered the power loss on cables. The results show that the cable loss is reduced at some wind directions, but may be increased at other wind directions. However, the total output power is always increased. The WT derating control strategy used in this paper is the Max-Ω strategy, which can reduce the load on the WT structure, decrease the risk of going to stall region and bring bigger inertia in the rotor for providing inertial response for the grid. The optimal active power dispatch strategy proposed in this paper can be used to generate look-up tables for the active power dispatch in a WF. The look-up table can be
6
implemented in WF energy management systems or wind power dispatch centers for real-time operation.
REFERENCES
[1] J. R. Marden, D. R. Shalom, L.Y. Pao, “A model-free approach to wind farm control using game theoretic methods,” IEEE Trans. Control Syst. Technol., vol. 21, no. 4, pp. 1207–1214, July 2013.
[2] P. M. O. Gebraad, and J. W. Wingerden, “Maximum power point tracking control for wind farms,” Wind Energy, vol. 18, pp. 429–447, 2015.
[3] J. Park, S. Kwon, and K. H. Law, “Wind farm power maximization based on a cooperative static game approach,” in Proceedings of the SPIE active and passive smart structures and integrated systems conference, San Diego, CA, USA, 2013.
[4] J. P. Goit and Meyers J, “Analysis of turbulent flow properties and energy fluxes in optimally controlled wind-farm boundary layers,” in The science of making torque from wind, Lyngby, Denmark, 2014.
[5] T. Horvat, V. Spudić, M. Baotić, “Quasi-stationary optimal control for wind farm with closely spaced turbines,” in MIPRO, 2012 Proceedings of the 35th International Convention, Opatija, 2012, pp. 829–834.
[6] J. Lee, E. Son, B. Hwang, et al, “Blade pitch angle control for aerodynamic performance optimization of a wind farm,” Renew. Energy, vol. 54, pp. 124–130, 2013.
[7] A. Behnood, H. Gharavi, B. Vahidi, et al, “Optimal output power of not properly designed wind farms, considering wake effects,” Int. J. of Electric. Power & Energy Syst., vol. 63, pp. 44–50, 2014.
[8] J. S. González, M. B. Payán, J. R. Santos, et al, “Maximizing the overall production of wind farms by setting the individual operating point of wind turbines,” Renewable Energy, vol. 80, pp. 219–229, 2015.
[9] M. Mirzaei, M. Soltani, N. K. Poulsen, et al, “Model based active power control of a wind turbine,” in 2014 American Control Conference (ACC), Portland, Oregon, 2014, pp. 5037–5042.
[10] V. Spudić, M. Jelavić, M. Baotić, “Wind turbine power references in coordinated control of wind farms,” Automatika‒J. for Control, Measurement, Electron., Computing and Commun., vol. 52, no. 2, pp. 82–94, 2011.
[11] J. Jonkman, S. Butterfield, W. Musial, et al, “Definition of a 5-MW Reference Wind Turbine for Offshore System Development,” CO: NREL, Golden, Tech. Rep. NREL/TP-500-38060, Feb. 2009.
[12] A. D. Hansen., C. Jauch, P. Sørensen, et al, “Dynamic wind turbine models in power system simulation tool DIgSILENT,” Tech. Rep. Risø-R-1400, Risø, Roskilde, Denmark, 2003.
[13] N. O. Jensen, “A Note on Wind Generator Interaction,” Tech. Rep. Risø -M-2411, Risø, Roskilde, Denmark, 1983.
[14] F. González-Longatt, P. Wall and V. Terzija, “Wake effect in wind farm performance: Steady-state and dynamic behavior,” Renewable Energy, vol. 39, pp. 329–338, Sep. 2011.
[15] F. Port´e-Agel, Y. Wu, C. Chen, “A Numerical Study of the Effects of Wind Direction on Turbine Wakes and Power Losses in a large Wind Farm,” Energies, vol. 6, pp. 5297–5313, MDPI, 2013.
[16] H. Saadat, Power System Analysis. New York: McGraw-Hill, 1999, pp. 189–219.
[17] R.C. Eberhart, J. Kennedy, “A new optimizer using particle swarm theory,” in Proceedings 6th International Symposium Micromachine Human Science, Nagoya, Japan, 1995, pp. 39–43.
[18] ABB. XLPE Submarine Cable Systems [Online]. Available: http://www05.abb.com/global/scot/scot245.nsf/veritydisplay/2fb0094306e48975c125777c00334767/$file/XLPE%20Submarine%20Cable%20Systems%202GM5007%20rev%205.pdf