AARST ANNUAL RADON CONFERENCE OCTOBER 4,5,6 1990 COMPARISON OF LONG TERM TESTING DEVICES INDOOR AND OUTDOOR Bill Brodhead WPB Enterprises, Inc. 2844 Slifer Valley Rd. Riegelsville, Pa., 18077 610-346-8004, Fax 410-346-8575 ABSTRACT The author exposed nine different long term radon detectors for two months in the basement of his own home. Included in the study were twenty-six alpha track detectors from four different companies, six Kodak film strips, six standard size ion-chambers and eight of the new smaller size LLT unit ion chambers and three At-Ease monitors. One of the At-Ease units included the upgraded with the new higher sensitivity. Fifteen blank alpha track detectors and six film badges were left unexposed their original bags during the test period determine what background reading they might accumulate. The actual radon levels were being determined by two AB-5 Pylons that had been first exposed in the Radon QC chamber in Easton, Pa., for calibration. The average daily radon levels fluctuated from five to sixty pCi/L in the basement. Radon decay product measurements were also made to determine the equilibrium ratio because of their effect on the film units. Thoron measurements were also made to determine if there was any significant amount in the basement that might influence the Pylon ,. readings.
Transcript
AARST ANNUAL RADON CONFERENCE OCTOBER 4,5,6 1990
COMPARISON OF LONG TERM TESTING DEVICES INDOOR AND OUTDOOR
Bill Brodhead WPB Enterprises, Inc. 2844 Slifer Valley Rd. Riegelsville, Pa., 18077
610-346-8004, Fax 410-346-8575
ABSTRACT
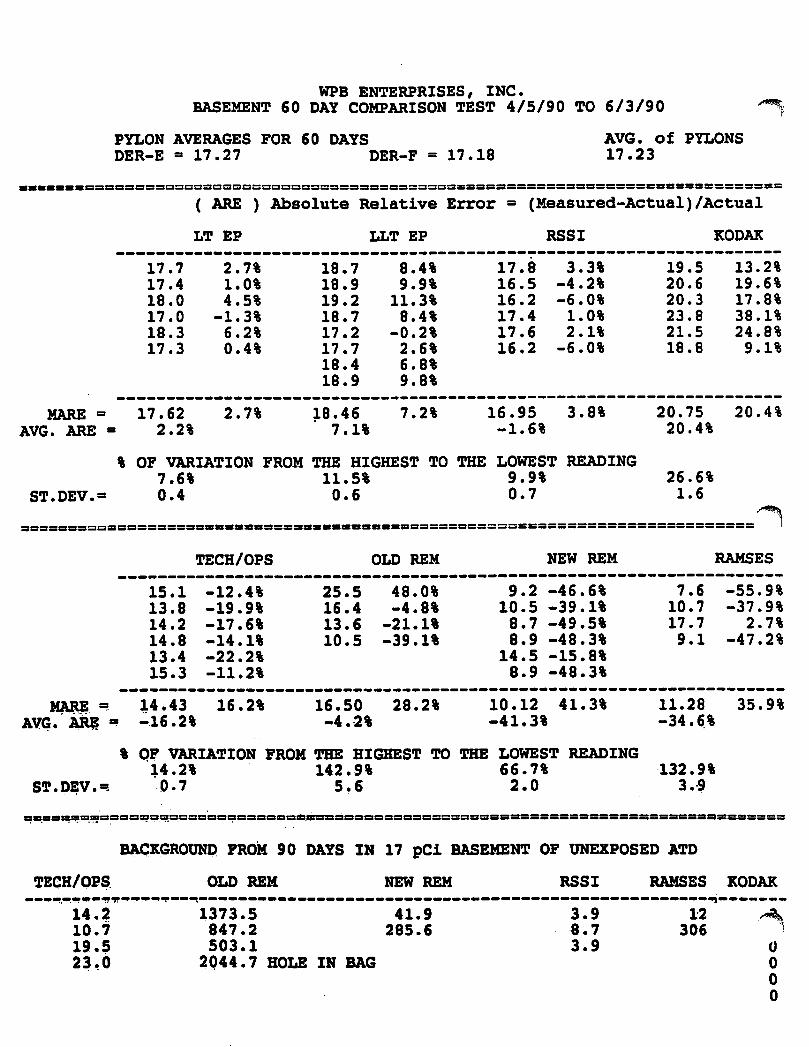
The author exposed nine different long term radon detectors
for two months in the basement of his own home. Included in the
study were twenty-six alpha track detectors from four different
companies, six Kodak film strips, six standard size ion-chambers
and eight of the new smaller size LLT unit ion chambers and three
At-Ease monitors. One of the At-Ease units included the upgraded
with the new higher sensitivity.
Fifteen blank alpha track detectors and six film badges were
left unexposed their original bags during the test period
determine what background reading they might accumulate.
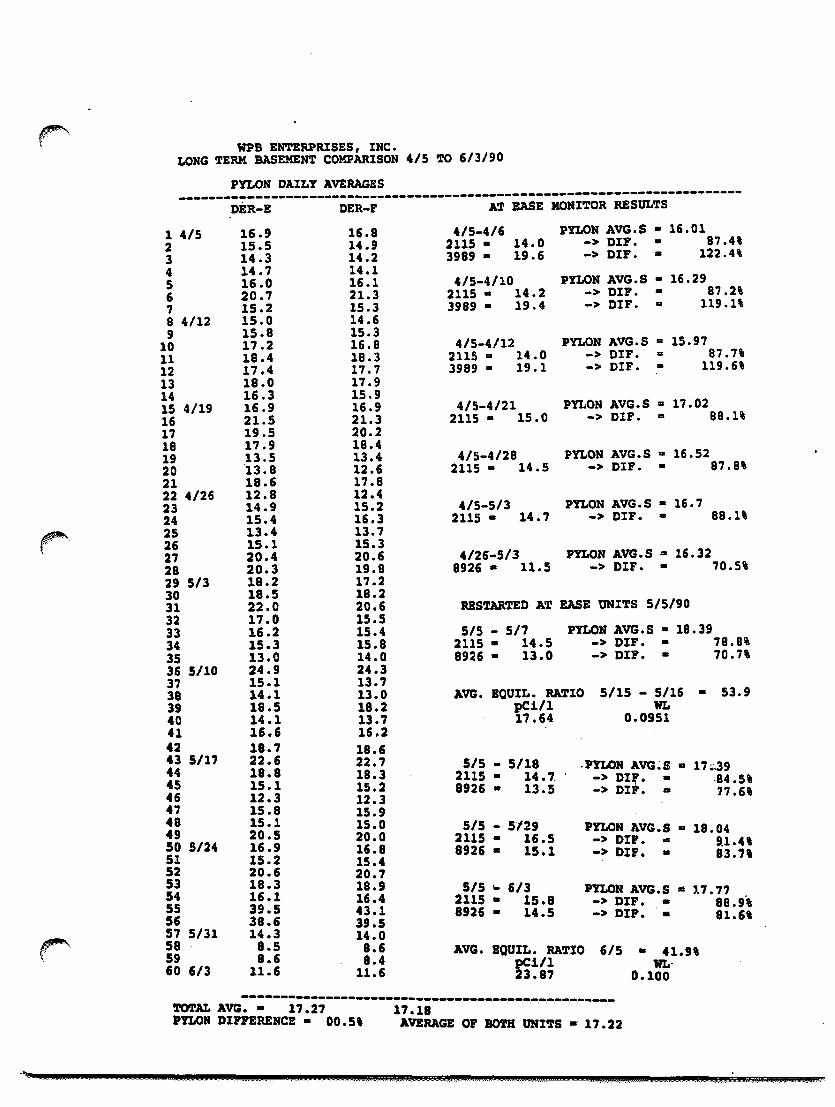
The actual radon levels were being determined by two AB-5
Pylons that had been first exposed in the Radon QC chamber in
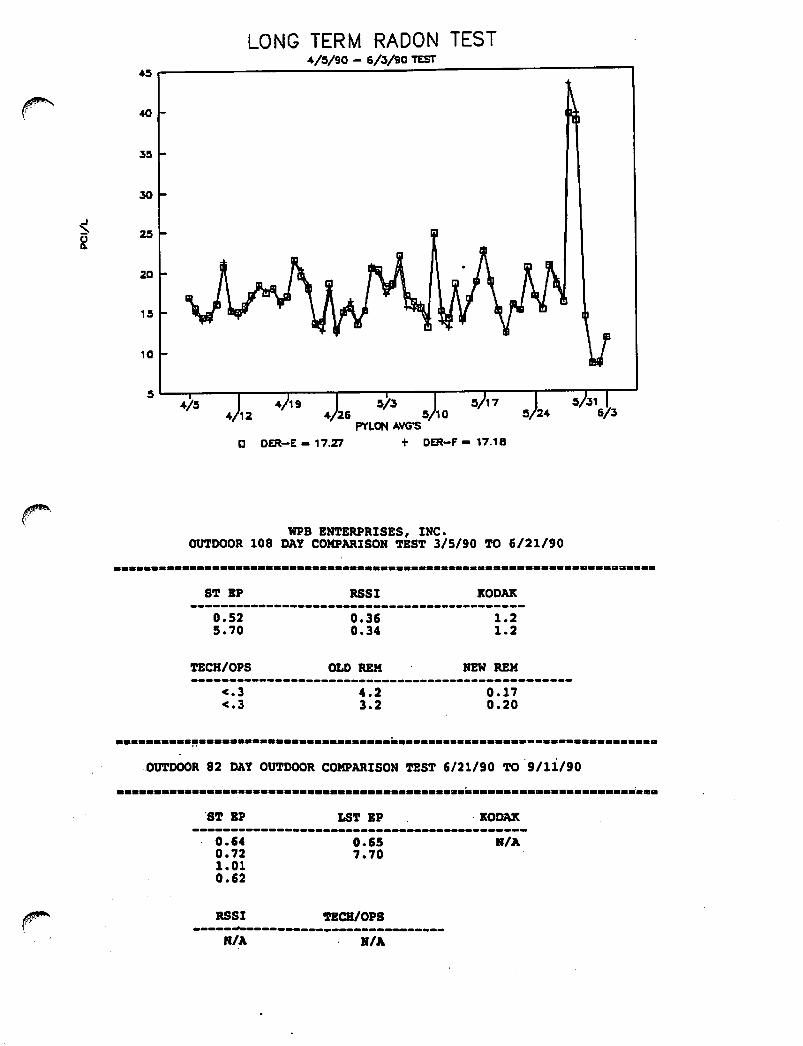
Easton, Pa., for calibration. The average daily radon levels
fluctuated from five to sixty pCi/L in the basement. Radon decay
product measurements were also made to determine the equilibrium
ratio because of their effect on the film units. Thoron
measurements were also made to determine if there was any
significant amount in the basement that might influence the Pylon
,. readings.
LONG TERM TEST COMPARISON
A comparison of all of the detectors except the At Ease units
was also done outdoors. Two of each detector except the LST ion
chambers were exposed outdoors* No continuous monitor was used
outdoors. The outdoor units were exposed for 108 days.
A second exposure of detectors was begun outdoors and will be
presented, but the levels were not available at the time of this
printing.
INTRODUCTION
The EPA recommends that a screening radon measurement that
falls between 4 pCi/l and 20 pCi/l be followed with a long term
measurement in the lived in area of a dwelling for confirmation
and determination of actual risk to the occupants. A long term
measurement is defined as a measurement lasting more than three
months although any measurement over one month is typically 7
considered a long term measurement. There are a number of
detectors that can be used for this purpose. These detectors fall
into four groups; alpha track, film badge, ion chamber, and
electronic silicone chip. The radon industry has, in the past,
questioned the accuracy of these detectors. One of the problems
associated with the accuracy of alpha track detectors is that if
they are exposed to radon before or after the designated exposure
time, the detector will include this exposure with the total
exposure* There is also a variation in the quality of the plastic
that is used for the detector.
This paper is an attempt to quantify the accuracy of these
types of detectors exposed under real time conditions. ~ o s t
calibration of long term radon detectors is done in a radon
LONG TERM TEST COMPARISON
chamber that typically holds the radon levels to a steady
concentration. Also the chamber is often run at high
concentrations in order to shorten the exposure time. Real time
conditions have constantly varying radon levels.
RADON CHAMBER
The detectors were exposed in the author's own basement for
60 days. The author's house is a 100 year old wood frame with a
rubble stone foundation. The basement floor is concrete with a
vapor barrier under it, but no sub-floor gravel. The heating
system is oil fired hot water. A three point sub-slab suction
system was installed a few years ago. The exhaust pipework runs
outside and below grade to a fan installed about thirty feet from
the house in some shrubbery. The radon levels in the basement,
with the fan system turned off, vary from 5 to 60 pCi/l. The
radon on the first and second floor of the dwelling is
considerably less because the ceiling of the basement is insulated
with sprayed in place urethane and the basement to first floor
door is weatherstripped. With the radon system fan activated, the
radon levels in the basement drop to 1 to 5 pCi/l. The comparison
test was done with the radon system turned off. The basement
temperature varies from 58 to 61 degrees Fahrenheit. The humidity
varies from 75% to 90%. There are no windows in the basement and
no measurable air flow.
MONITOR CALIBRATION
Two Pylon AB-5 radon monitors, each with passive radon
diffusion heads ( PRO ), were used to determine the radon levels
in the basement during the test. These units were on loan from
page 3
LONG TERM TEST COMPARISON
the Pa. DER. They had been used for an earlier study of charcoal
canisters and E-perms. The background counts of the PRO and
signal noise of the instruments was determined by running nitrogen
through the PRD head for 24 hours so that an absolute background
could be attained. The units, along with a third pylon had been
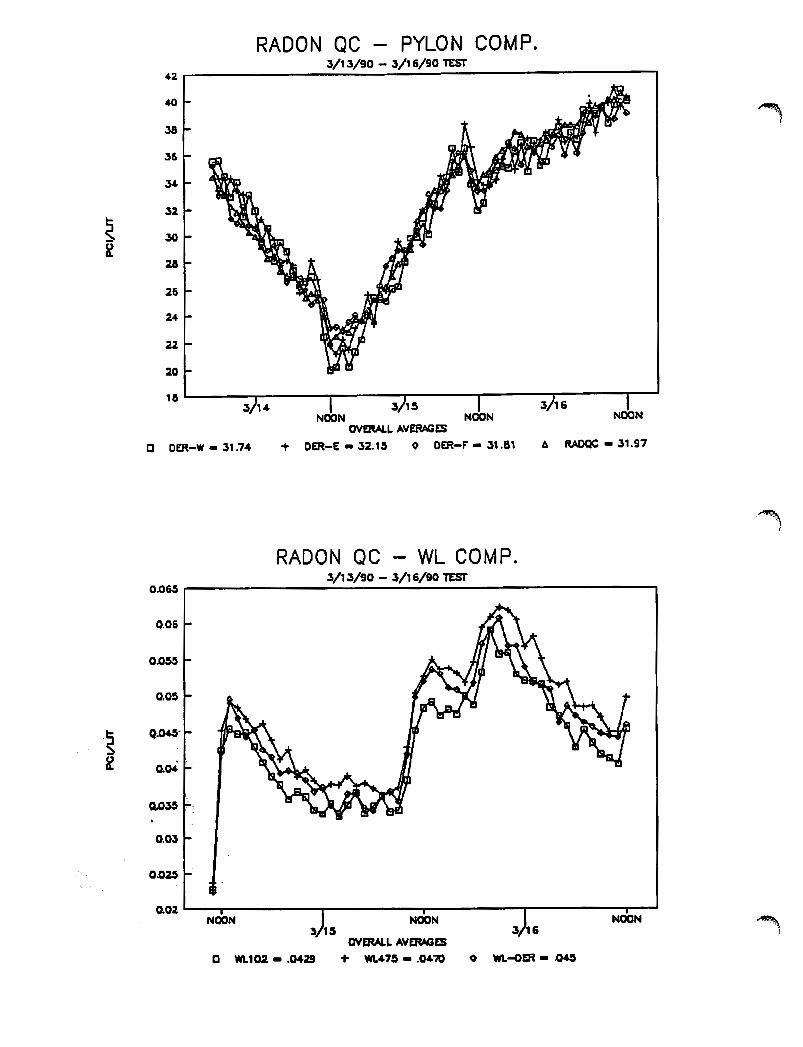
calibrated at Radon QC the first week in September, 1989. The
three units were calibrated again by placing them in the yellow
chamber, which is the middle concentration,, at Radon QC for three
days, from 3/13 to 3/16/90. Refer to the Radon QC - Pylon Comp. figure. The average concentration reported from Radon QC was
31.97. Using the calibration factors developed from the previous
session the units reported 31.74, 32.15, 31.81. This is less than
1% difference from the reported value. The calibration factors
were adjusted this small amount to match the exact reported value
of Radon QC. An Eberline working level monitor was also placed in
the chamber and checked for calibration. This unit fell with the
reported values of two Radon QC WL monitors that were in the
chamber at the same time. Refer to the Radon QC - WL Comp. figure.
MONITORS IN THE STUDY
A number of manufacturers were contacted about the study.
They were informed what kind of study it would be and that it was
not funded. They were asked if they would provide free test kits.
Of those contacted, the following generously provided test kits
for free: Tech/Ops Landauer, Kodalpha, Rad Elec, Radon
Environmental Monitoring, Radiation Safety Services. The
following companies were also contacted about the study but they
LONG TERM TEST COMPARISON
did not supply any detectors and thus were not included in the