Mon. Not. R. Astron. Soc. 000, 1–20 (—-) Printed 27th March 2022 (MN L A T E X style file v2.2) Absorption signatures of warm-hot gas at low redshift: Broad H i Lyα Absorbers Thorsten Tepper-Garc´ ıa, 1? Philipp Richter, 1 Joop Schaye, 2 Craig M. Booth, 2,3,4 Claudio Dalla Vecchia, 2,5 Tom Theuns 6,7 1 Institut f¨ ur Physik und Astronomy, Universit¨ at Potsdam, Karl-Liebknecht-Str. 24/25, 14476 Potsdam, Germany 2 Leiden Observatory, Leiden University, P.O. Box 9513, 2300 RA Leiden, The Netherlands 3 Department of Astronomy & Astrophysics, The University of Chicago, Chicago, IL 60637, USA 4 Kavli Institute for Cosmological Physics and Enrico Fermi Institute, The University of Chicago, Chicago, IL 60637, USA 5 Max Planck Institut f¨ ur Extraterrestrische Physik, Giessenbachstraße 1, 85748 Garching, Germany 6 Institute for Computational Cosmology, Department of Physics, University of Durham, South Road, Durham, DH1 3LE, UK 7 Department of Physics, University of Antwerp, Groenenborgerlaan 171, B-2020 Antwerpen, Belgium Accepted 2012 June 14. Received 2012 May 14; in original form 2012 January 26 ABSTRACT We investigate the physical state of H i absorbing gas at low redshift (z = 0.25) using a subset of cosmological, hydrodynamic simulations from the OWLS project, focusing in particular on broad (b H I > 40 km s -1 ) H i Lyα absorbers (BLAs), which are believed to originate in shock-heated gas in the warm-hot intergalactic medium (WHIM). Our fiducial model, which includes radiative cooling by heavy elements and feedback by supernovae and active galactic nuclei, predicts that by z = 0.25 nearly 60 per cent of the gas mass ends up at densities and temperatures characteristic of the WHIM and we find that half of this fraction is due to outflows. The standard H i observables (distribution of H i column densities N H I , distribution of Doppler parameters b H I , b H I - N H I correlation) and the BLA line number density predicted by our simulations are in remarkably good agreement with observations. BLAs arise in gas that is hotter, more highly ionised and more enriched than the gas giving rise to typical Lyα forest absorbers. The majority of the BLAs arise in warm-hot (log (T / K) ∼ 5) gas at low (log Δ < 1.5) overdensities. On average, thermal broadening ac- counts for at least 60 per cent of the BLA line width, which in turn can be used as a rough indicator of the thermal state of the gas. Detectable BLAs account for only a small fraction of the true baryon content of the WHIM at low redshift. In order to detect the bulk of the mass in this gas phase, a sensitivity at least one order of magnitude better than achieved by current ultraviolet spectrographs is required. We argue that BLAs mostly trace gas that has been shock-heated and enriched by outflows and that they therefore provide an important window on a poorly understood feedback process. Key words: cosmology: theory — methods: numerical — intergalactic medium — quasars: absorption lines — galaxies: formation 1 INTRODUCTION The analysis of intervening H i Lyα absorption in the spectra of dis- tant quasars (QSO) has become an extremely powerful tool to study the spatial distribution of the diffuse intergalactic medium (IGM) that follows the large-scale distribution of cosmological filaments, and to constrain the baryon content of the IGM as a function of redshift. At redshifts z > 3, more than 95 per cent of the baryonic matter resides in the form of photo-ionised, diffuse gas giving rise to the “Lyα forest” in the spectra of distant QSOs (e.g. Rauch et al. ? E-mail: [email protected]1997). As a consequence of expansion, the Lyα forest thins out, and at z ≈ 0 the contribution of the Lyα forest to the total baryon budget has decreased to ∼ 20 per cent (e.g. Penton et al. 2004; Lehner et al. 2007). At the same time, the formation of galactic structures and the gravitational heating of the IGM by collapsing large-scale filaments lead to a gradually increasing amount of shock-heated intergalactic gas at temperatures T & 10 5 K, which is referred to as the warm-hot intergalactic medium (WHIM, Cen & Ostriker 1999; Theuns et al. 1998; Dav´ e et al. 2001; Bertone et al. 2008). Since collisional ionisation determines the ionisation state of the shock-heated IGM, the neutral gas fraction in the WHIM is significantly lower, by at least one order of magnitude, than in the c —- RAS arXiv:1201.5641v2 [astro-ph.CO] 2 Jul 2012
Transcript
Mon. Not. R. Astron. Soc. 000, 1–20 (—-) Printed 27th March 2022 (MN LATEX style file v2.2)
Absorption signatures of warm-hot gas at low redshift: Broad H iLyα Absorbers
Thorsten Tepper-Garcıa,1? Philipp Richter,1 Joop Schaye,2 Craig M. Booth,2,3,4
Claudio Dalla Vecchia,2,5 Tom Theuns6,71Institut fur Physik und Astronomy, Universitat Potsdam, Karl-Liebknecht-Str. 24/25, 14476 Potsdam, Germany2Leiden Observatory, Leiden University, P.O. Box 9513, 2300 RA Leiden, The Netherlands3Department of Astronomy & Astrophysics, The University of Chicago, Chicago, IL 60637, USA4Kavli Institute for Cosmological Physics and Enrico Fermi Institute, The University of Chicago, Chicago, IL 60637, USA5Max Planck Institut fur Extraterrestrische Physik, Giessenbachstraße 1, 85748 Garching, Germany6Institute for Computational Cosmology, Department of Physics, University of Durham, South Road, Durham, DH1 3LE, UK7Department of Physics, University of Antwerp, Groenenborgerlaan 171, B-2020 Antwerpen, Belgium
Accepted 2012 June 14. Received 2012 May 14; in original form 2012 January 26
ABSTRACT
We investigate the physical state of H i absorbing gas at low redshift (z = 0.25) usinga subset of cosmological, hydrodynamic simulations from the OWLS project, focusing inparticular on broad (bH I > 40 km s−1) H i Lyα absorbers (BLAs), which are believed to originatein shock-heated gas in the warm-hot intergalactic medium (WHIM). Our fiducial model, whichincludes radiative cooling by heavy elements and feedback by supernovae and active galacticnuclei, predicts that by z = 0.25 nearly 60 per cent of the gas mass ends up at densities andtemperatures characteristic of the WHIM and we find that half of this fraction is due to outflows.The standard H i observables (distribution of H i column densities NH I, distribution of Dopplerparameters bH I, bH I − NH I correlation) and the BLA line number density predicted by oursimulations are in remarkably good agreement with observations.
BLAs arise in gas that is hotter, more highly ionised and more enriched than the gasgiving rise to typical Lyα forest absorbers. The majority of the BLAs arise in warm-hot(log (T/K) ∼ 5) gas at low (log ∆ < 1.5) overdensities. On average, thermal broadening ac-counts for at least 60 per cent of the BLA line width, which in turn can be used as a roughindicator of the thermal state of the gas. Detectable BLAs account for only a small fractionof the true baryon content of the WHIM at low redshift. In order to detect the bulk of themass in this gas phase, a sensitivity at least one order of magnitude better than achieved bycurrent ultraviolet spectrographs is required. We argue that BLAs mostly trace gas that hasbeen shock-heated and enriched by outflows and that they therefore provide an importantwindow on a poorly understood feedback process.
Key words: cosmology: theory — methods: numerical — intergalactic medium — quasars:absorption lines — galaxies: formation
1 INTRODUCTION
The analysis of intervening H i Lyα absorption in the spectra of dis-tant quasars (QSO) has become an extremely powerful tool to studythe spatial distribution of the diffuse intergalactic medium (IGM)that follows the large-scale distribution of cosmological filaments,and to constrain the baryon content of the IGM as a function ofredshift. At redshifts z > 3, more than 95 per cent of the baryonicmatter resides in the form of photo-ionised, diffuse gas giving riseto the “Lyα forest” in the spectra of distant QSOs (e.g. Rauch et al.
1997). As a consequence of expansion, the Lyα forest thins out, andat z ≈ 0 the contribution of the Lyα forest to the total baryon budgethas decreased to ∼ 20 per cent (e.g. Penton et al. 2004; Lehner et al.2007). At the same time, the formation of galactic structures and thegravitational heating of the IGM by collapsing large-scale filamentslead to a gradually increasing amount of shock-heated intergalacticgas at temperatures T & 105 K, which is referred to as the warm-hotintergalactic medium (WHIM, Cen & Ostriker 1999; Theuns et al.1998; Dave et al. 2001; Bertone et al. 2008).
Since collisional ionisation determines the ionisation state ofthe shock-heated IGM, the neutral gas fraction in the WHIM issignificantly lower, by at least one order of magnitude, than in the
photo-ionised IGM of the same density (e.g. Richter et al. 2008).Because of this very small neutral hydrogen fraction in the WHIM,most of the recent observational campaigns to study warm-hot in-tergalactic gas at low redshift have concentrated on interveningabsorption by highly ionised metals in ultraviolet (UV) spectra ofbright QSOs. In particular, five-times ionised oxygen (O vi) hasbeen used extensively to trace shock-heated intergalactic gas at lowredshift and to constrain the baryon content of the WHIM (e.g. Trippet al. 2000; Richter et al. 2004; Danforth et al. 2006; Danforth &Shull 2008; Thom & Chen 2008b; Tripp et al. 2008; Danforth et al.2010). However, because O vi predominantly traces metal-enrichedgas in a critical (in terms of ionisation balance) temperature regimeat T ≈ 3 × 10⁵ K, and because the metals may well be poorly mixedon small scales (Schaye et al. 2007) the interpretation of interveningO vi absorbers is still controversial (e.g. Oppenheimer & Dave 2009;Tepper-Garcıa et al. 2011; Smith et al. 2011). In particular, it isnot yet clear whether O vi absorbers predominantly arise in photo-ionised (e.g. Thom & Chen 2008a) or collisionally ionised gas (e.g.Danforth & Shull 2008), or in complex absorbing structures withcool gas intermingled with warm-hot gas (Tripp et al. 2008).
An alternative to highly ionised metals as tracers of warm-hotgas is offered by H i absorption. Due to the low neutral hydrogen frac-tion expected from collisional ionisation at temperatures T & 105 K,Lyα absorption from shock-heated WHIM filaments is expected tobe very weak. In addition, H i absorption lines arising in gas at tem-peratures T > 105 K are expected to be relatively broad because ofthe effect of thermal broadening. Such broad (bH I > 40 km s−1) andshallow ([NH I/bH I] ∼ 1011cm−2km−1s or τ0(H i) ∼ 0.1) Lyα absorp-tion features, the so-called Broad Lyα Absorbers (BLAs; Richteret al. 2006a), are hence difficult to identify in the UV spectra ofQSOs because of the limited signal-to-noise (S/N) and the lowresolution of spectral data obtained with current space-based UVspectrographs.
In spite of being observationally challenging, directly detectingthe small amounts of neutral hydrogen in the WHIM in absorption isa feasible task. The first systematic studies of BLAs at low redshifthave been conducted using high-resolution Hubble Space Telescope(HST) Space Telescope Imaging Spectrograph (STIS) spectra ofbright QSOs (Richter et al. 2004; Sembach et al. 2004; Richteret al. 2006a; Williger et al. 2006; Lehner et al. 2007; Danforth et al.2010). These studies indicate that BLAs may indeed account fora substantial fraction of the baryons in the WHIM at z ≈ 0. Theyalso show, however, that identification and interpretation of broadspectral features in UV spectra with limited data quality is afflic-ted with large systematic uncertainties. In particular, the effects ofnon-thermal broadening and unresolved velocity-structure in thelines lead to the occurrence of broad spectral features that do notnecessarily arise in gas at high temperatures. The Cosmic OriginsSpectrograph (COS; Green et al. 2012), a new UV spectrographwhich has recently been installed on HST, is expected to substan-tially increase the number of BLA candidates at low redshift. Dueto the limited spectral resolution of COS (∼ 17 km s−1), the system-atic uncertainties in identifying thermally broadened H i lines in theWHIM temperature range will nevertheless remain.
To investigate the physical properties and spectral signaturesof BLAs at low redshift, Richter et al. (2006b) have studied broadH i absorption features using a cosmological simulation based ona grid-based adaptive mesh refinement (AMR) method (Norman& Bryan 1999). Their simulation reproduces the observed BLAnumber density and supports the idea that BLAs trace (at least ina statistical sense) a substantial fraction of shock-heated gas in theWHIM at temperatures T ∼ 105 − 106 K. However, since this (early)
simulation ignored several important physical processes that areexpected to affect the thermal state of this gas phase (i.e. energeticfeedback, radiative heating and cooling by hydrogen and metals),it is important to re-assess the frequency and physical propertiesof BLAs using state-of-the-art cosmological simulations with morerealistic gas physics.
In this paper, we present a systematic study of BLAs at lowredshift based on a set of cosmological simulations from the Over-Whelmingly Large Simulations (OWLS) project (Schaye et al. 2010).This work complements our previous study on intervening O vi ab-sorbers and their relation to the WHIM based on a slightly differentset of OWLS simulations (Tepper-Garcıa et al. 2011, henceforthPaper I). The main features of the simulations we use are brieflydescribed in Sec. 2. As we have done in Paper I for the case of lowredshift O vi absorbers, we compare the predictions from our fidu-cial model to a set of standard H i observables, and discuss variousphysical properties of the general H i absorber population in Sec. 3.Given the dependence of the WHIM mass fraction predicted by sim-ulations on the particular implementation of the relevant physicalprocesses reported in the past (e.g. Cen & Ostriker 2006), we invest-igate the impact of different physical models on the thermal state ofthe various gas phases in our simulations in Sec. 4. In this sectionwe also present and discuss the results on the physical properties ofthe absorbing gas traced by BLAs. Finally, we summarise our mainfindings in Sec. 5. In the Appendix we include: a full descriptionof our fitting algorithm (Appendix A); a detailed calculation of theobservability of H i absorbing gas in terms of optical depth as afunction of density and temperature (Appendix B); a discussion ofthe convergence of our results with respect to the adopted physicalmodel (Appendix C), and with respect to the adopted resolution andsimulation box size (Appendix D).
2 SIMULATIONS
The simulations used in this work are part of a large set of cos-mological simulations that together comprise the OWLS project,described in detail in Schaye et al. (2010, and references therein).Briefly, the simulations were performed with a significantly exten-ded version of the N-Body, Tree-PM, Smoothed Particle Hydro-dynamics (SPH) code gadget iii – which is a modified version ofgadget ii (last described in Springel 2005) –, a Lagrangian codeused to calculate gravitational and hydrodynamic forces on a systemof particles. The initial conditions were generated from an initialglass-like state (White 1996) with cmbfast (version 4.1; Seljak & Za-ldarriaga 1996) and evolved to redshift z = 127 using the Zeldovich(1970) approximation.
The reference model, dubbed REF, in the OWLSframework adopts a flat ΛCDM cosmology character-ised by the set of parameters Ωm, Ωb, ΩΛ, σ8, ns, h =
0.238, 0.0418, 0.762, 0.74, 0.95, 0.73 as derived from theWilkinson Microwave Anisotropy Probe (WMAP) 3-year data1
(Spergel et al. 2007). This model includes star formation followingSchaye & Dalla Vecchia (2008), metal production and timedrelease of mass and heavy elements by intermediate mass stars, i.e.asymptotic giant-branch (AGB) stars and supernovae of Type Ia(SNIa), and by core-collapse supernovae (SNIIe) as described by
1 These parameter values are largely consistent with the WMAP 7-yearresults (Jarosik et al. 2011), the largest difference being the value of σ 8,which is 2σ lower in the WMAP 3-year data than allowed by the WMAP7-year data.
Table 1. Overview of the simulations used in this study. All model variationsare relative to REF.
Model Description
NOSN NOZCOOL neglects SNe energy feedback andcooling assumes primordial abundances
NOZCOOL cooling assumes primordial abundancesREF OWLS reference model (see text for details)AGN includes feedback by AGN (fiducial model)
Wiersma et al. (2009b). It further incorporates kinetic feedback bySNIIe based on the method of Dalla Vecchia & Schaye (2008), aswell as thermal feedback by SNIa (Wiersma et al. 2009b). Radiativecooling by hydrogen, helium and heavy elements is includedfollowing the method of Wiersma et al. (2009a). The ionisationbalance for each SPH particle is computed as a function of redshift,density, and temperature using pre-computed tables obtained withthe photoionisation package cloudy (version 07.02.00 of the codelast described by Ferland et al. 1998), assuming the gas to beoptically thin and exposed to the Haardt & Madau (2001) model forthe X-Ray/UV background radiation from galaxies and quasars. Itis worth noting that a simulation run that adopts the REF model,although with a slightly different set of values for the cosmologicalparameters (from WMAP7), has been shown to reproduce the H iabsorption observed at z = 3 in great detail (Altay et al. 2011).
Along with REF, we consider three further models fromthe OWLS suite respectively referred to as NOSN NOZCOOL,NOZCOOL, and AGN. All these models differ from the referencemodel in one or more respects. NOSN NOZCOOL neglects kineticfeedback by SNIIe, and the calculation of radiative cooling assumesprimordial abundances. It is the most simple model in terms of inputphysics, and it is similar (and hence useful for comparison) to thesimulation used by Richter et al. (2006b). The model NOZCOOLassumes primordial abundances when computing radiative cool-ing, and the model AGN includes feedback by active galactic nuclei(AGN) based on the model of black hole growth developed by Booth& Schaye (2009, see also Springel et al. 2005).
All these simulations were run in a cubic box of 100h−1 co-moving Mpc on a side, containing 5123 dark matter (DM) particlesand equally many baryonic particles. The initial mass resolution is4.1 × 108h−1 M (DM) and 8.7 × 10⁷h−1 M (baryonic). The gravit-ational softening is set to 8 h−1 co-moving kpc and is fixed at 2h−1
proper kpc below z = 3.In this study, we choose AGN as our fiducial model since it
is the most complete model in terms of input physics. In addi-tion to reproducing various standard H i statistics (see AppendixC), this model has been shown to reproduce: the observed massdensity in black holes at z = 0; the black hole scaling relations(Booth & Schaye 2009) and their evolution (Booth & Schaye 2011);the observed optical and X-ray properties, stellar-mass fractions,star-formation rates (SFRs), stellar-age distributions and the ther-modynamic profiles of groups of galaxies (McCarthy et al. 2010);and the steep decline in the cosmic star formation rate below z = 2(Schaye et al. 2010; van de Voort et al. 2011). Note that, while theH i statistics predicted by the AGN model are very similar to thepredictions of the other models considered here (see Appendix C),there are notable differences in the temperatures of the gas tracedby BLAs (see Fig. 11). We will address this point in more detailin Sec. 4.4. Table 1 briefly summarises the relevant features of themodels described above. For a more detailed description of these
(and other) models that are part of the OWLS project, see Schayeet al. (2010).
3 THE GENERAL H i ABSORBER POPULATION
In this section we test the predictions of our fiducial model (AGN)against observations using a set of well-measured H i observables:the H i column density distribution function (CDDF), the distributionof H i line widths, and the correlation between H i column densityand line width.
3.1 Synthetic spectra
For a meaningful comparison to existing data, we generate 5000 ran-dom sightlines (1000 at five redshifts spanning the range 0 6 z 6 0.5with step dz = 0.125) through the simulation box covering a totalredshift path ∆z = 189, corresponding to an absorption path length∆χ = 275.
We use the package specwizard written by Schaye, Booth, &Theuns to generate a synthetic spectrum for each sightline contain-ing absorption by H i Lyα only. Briefly, we draw a random phys-ical sightline across the simulation box of size L, which is simplydefined as the line between a given point on opposite faces of thebox, and the collection of SPH particles with projected distances tothis line smaller than their smoothing length. Next, we calculate theionisation balance for each SPH particle as a function of redshift,density, and temperature, which we do using precomputed tablesobtained with the photoionisation package cloudy (version 07.02of the code last described by Ferland et al. 1998), assuming thegas to be optically thin and exposed to the Haardt & Madau (2001)model for the X-Ray/UV background radiation from galaxies andquasars. We divide the physical sightline into N pix = [a(z) L/h] /∆xpixels of constant width ∆x, where h and a(z) are the Hubble con-stant in units of 100 km s−1Mpc−1 and the expansion factor at thebox’s redshift z, respectively, and compute the smoothed ion densitynion, the ion density-weighted gas temperature, and the ion density-weighted peculiar velocity at each pixel. Proper distance bins ofwidth ∆x along the sightline are transformed into velocity bins ofwidth ∆v = H(z)∆x, where H(z) is the Hubble parameter at redshiftz; ion number densities are transformed into ion column densitiesvia Nion = nion∆x, and gas temperatures into Doppler parametersusing bT =
√2kT/mion., where k is Boltzmann’s constant and mion
is the ion’s mass. The H i optical depth τ(v) at each pixel is com-puted assuming a thermal (i.e. Gaussian) profile, taking peculiarvelocities into account, as described by Theuns et al. (1998, theirAppendix 4). Finally, the optical depth spectrum is transformed intoa continuum-normalised flux via F(v) = exp[−τ(v)].
We convolve our spectra with a Gaussian line-spread function(LSF) with a full width at half-maximum (FWHM) = 7 km s−1 andre-sample our spectra onto 3.5 km s−1 pixels. We add Gaussian noiseto each spectrum assuming a flux dependent root-mean-square (rms)amplitude given by (S/N)−1 F(v), where S/N is the adopted signal-to-noise ratio. We assume a minimum, i.e. flux-independent noise levelσmin = 10−4. This implies that our algorithm will underestimate thetrue column density of absorption features with a flux of the orderof (or lower than) σmin, which corresponds to a logarithmic centraloptical depth log τ0 ∼ 1 (see Appendix A). Our choice of a perhapsunrealistically low value for σmin thus allows us to reduce the gapbetween the true and the fitted column density of saturated lines.
We generate three sets of spectra, adopting S/N=10, S/N=30,and S/N=50, respectively. The spectra with S/N=10 and S/N=30
Figure 1. Column-density distribution function, f (NH I), obtained fromobservations and from 5000 simulated spectra with different S/N valuesspanning the redshift range [0, 0.5]. Error bars along the y-axis show Pois-son uncertainties computed using the tables by Gehrels (1986). Assumingf (NH I) ∝ NH I
−β for logarithmic column densities in the range [13.0, 15.2]([12.5, 15.2]), we find β = 1.916 ± 0.044 (β = 1.917 ± 0.032) for S/N=10(S/N=30). The inset shows the comparison between the true (x-axis) and thefitted (y-axis) H i column density integrated along each individual sightline.For clarity, only the result for S/N=10 is shown. The dashed line correspondsto a perfect match (see text for discussion).
thus closely match the properties of the large sample thus far ob-tained with HST/STIS; these will be used in Secs. 3.2, 3.3, and 3.4to test the predicted H i observables against observations; the syn-thetic spectra with S/N=50 are intended to investigate the physicalproperties of the H i absorbing gas following a statistical approach,in the remaining sections of the paper.
Fitting of our 5000 synthetic spectra using the procedure de-scribed in Appendix A yields a total of 93430, 66705, and 28649components for S/N =50, 30, and 10, respectively. The resultingline-number densities and their corresponding Poisson uncertaintiesare (dN/dz) = 494 ± 22 (S/N=50), 353±19 (S/N=30), and 152±12(S/N=10). For reference, the sample of 341 Lyα absorbers at z . 0.4identified in seven FUSE+STIS spectra with average S/N & 10 byLehner et al. (2007) along an unblocked redshift path ∆z = 2.064yields (dN/dz) = 165 ± 13 at S/N ≈ 10, which agrees (within thePoisson uncertainties) with our result at a similar S/N.
3.2 Column-density distribution function
In Fig. 1 we show the column-density distribution function (CDDF),f (NH I), obtained from our spectra with S/N=10 (red) and S/N=30(blue) spanning the redshift range [0, 0.5], together with results fromdifferent observations at similar redshifts using spectra with compar-able (average) S/N values. Assuming that the CDDF can be paramet-rized in the form of a single power-law, f (NH I) ∝ NH I
−β, we findβ = 1.916 ± 0.044 (β = 1.917 ± 0.032) for S/N=10 (S/N=30) forlogarithmic column densities in the range [13.0, 15.2] ([12.5, 15.2]).The lower limit in log NH I approximately corresponds in each caseto the completeness limit as given by eq. (A3), while the upperlimit roughly indicates the column density above which our fittingalgorithm underestimates the true H i column density due to theminimum noise-level adopted (see Appendix A).
The slope we obtain is in fairly good agreement withthe slope measured from different observations. For z . 0.4Lehner et al. (2007, their table 7) measure a range of values
β = 1.52 − 1.92 for absorbers in selected column-density inter-vals between log (NH I/cm−2) = 13.2 and 16.5, and line widthsbH I 6 40 km s−1 or bH I 6 80 km s−1. If we extend the fitted columndensity range to log (NH I/cm−2) = 16.5, we find β = 1.90 ± 0.06and β = 1.95 ± 0.06 for S/N=10 and S/N=30, respectively. Willigeret al. (2010) use a subsample from the Lehner et al. (2007) data andtheir own data at log (NH I/cm−2) 6 12.3, and find β = 1.79 ± 0.1.Dave et al. (2001) measure β = 2.04 ± 0.23 for absorbers withcolumn densities log (NH I/cm−2) > 12.9 at a median redshiftz = 0.17. Note, however, that a significantly shallower slope is foundby Penton et al. (2004) who identify 109 Lyα absorbers at z < 0.069along 15 STIS spectra with S/N & 20, and measure β = 1.65 ± 0.07for logarithmic H i column densities in the range [12.5, 14.5].
The amplitude of the CDDF resulting from the analysis ofour synthetic spectra adopting different S/N is also in remarkableagreement with the observations. Note that the amplitude comes outnaturally from our simulation, i.e. the CDDF has not been norm-alised to match the data in any way (even though that could havebeen justified because of uncertainties in the intensity of the UVbackground). At column-densities log (NH I/cm−2) . 15, our pre-dicted amplitude agrees well with the data all the way down tothe lowest column densities measured, log (NH I/cm−2) = 12.3. Atlog (NH I/cm−2) > 15, the amplitude of our predicted CDDF appearsslightly lower (or its slope is steeper) than the result by Lehneret al. (2007). Note, however, that their data point at highest meas-ured column-density bin has a rather large uncertainty. On theother hand, it is very likely that our choice of fitting parametersleads us to underestimate the amplitude of the predicted CDDF atlog (NH I/cm−2) & 14.5 by underestimating the true column dens-ity of saturated lines, as explained in Appendix A. A comparisonbetween the true and the fitted H i column densities integrated alongeach sightline reveals that our fitting procedure indeed yields integ-rated H i column densities which are systematically lower than thetrue total column density, in particular for log (NH I/cm−2) & 15 (seeinset in Fig. 1). This could explain the difference between our pre-dicted CDDF and the result by Lehner et al. (2007) at the high-NH I
end.
3.3 Line width distribution
Fig. 2 shows the distribution of Doppler parameters, bH I, obtainedfrom our synthetic spectra for S/N=10 and 30 spanning the redshiftrange [0, 0.5], together with the line width distributions obtainedfrom data with comparable S/N values and redshifts by Lehneret al. (2007, green data points) and Danforth & Shull (2008, orangedata points). The median values of our predicted distributions arebH I ≈ 30.4 km s−1, 29.8 km s−1, and 29.4 km s−1 for S/N = 10, 30,and 50 (not shown), respectively. All of these agree well with themedian value found by Heap et al. (2002), bH I = 27 km s−1, byShull et al. (2000), bH I = 28 km s−1, and with the median valuebH I = 31 km s−1 for the full Lehner et al. (2007) sample. Note thatall of these values are significantly larger than the median valuebH I = 21 km s−1 measured by Dave & Tripp (2001). Our simulationshows a lower fraction of broad (bH I > 40 km s−1) absorbers whencompared to the Lehner et al. (2007) b-value distribution, but ourresults compare well to the line width distribution from Danforth &Shull (2008).
The predicted median bH I-values indicate that a lower S/Nvalue systematically shifts the line width distribution to slightlylarger values. Yet, the number of components with bH I > 40 km s−1
relative to the total number of components identified in each casedecreases from ∼ 26 to ∼ 23 per cent when the adopted S/N value
Figure 2. Distribution of bH I-values from observations and from 5000 simu-lated spectra with S/N=10 (red), and S/N=30 (blue), spanning the redshiftrange [0, 0.5]. Data points from Lehner et al. (2007, green) and Danforth& Shull (2008, orange) with y-error bars showing Poisson uncertainties.The dashed vertical line indicates our adopted minimum allowed b-value.The distributions from both data and simulations have been binned using∆bH I = 5 km s−1.
decreases from 50 to 10. Here, two competing mechanisms are atwork: On the one hand, a low S/N value results in a stronger blendingof narrow components into (artificial) broad features. On the otherhand, since broader lines are shallower (at a given column density),and thus more difficult to detect at low S/N, the number of broadcomponents detected decreases with decreasing S/N. Compared toa higher S/N value, the net effect of a low S/N value is to yield asmaller number (both relative and absolute) of broad absorptionfeatures (at a given resolution and sensitivity).
3.4 The bH I − NH I distribution
Last, we compare the bH I − NH I distribution obtained from oursimulated spectra with S/N=30 and S/N=10 to two different setsof observations used for the comparison of our predicted CDDFand the line width distribution discussed in the last sections. Tothis end, we bin the lines from observations and from our syntheticspectra in NH I using ∆ log(NH I/cm−2) = 0.3, and compute themedian bH I-value, and 25-/75-percentiles in each bin. The resultis shown in Fig. 3. The bH I − NH I distribution from our simulatedspectra matches the observations well within the uncertainties.Even the drop in bH I observed at low NH I in the Dave & Tripp(2001) is well reproduced by our simulation. Note that lines withlog(NH I/cm−2) < 13.4 identified in spectra with S/N=30 generallyhave larger widths. This is a consequence of the fact that, at a fixedcolumn density, lines with a given width are shallower with respectto narrower lines, and they can only be detected if the S/N is highenough.
Summarising, we conclude that the H i observables predictedby our fiducial model are in excellent agreement with observations.This agreement may be surprising in view of the uncertainty in theinput physics used in our simulation. However, in Appendix C weshow that these results are quite robust against the model variationswith respect to our fiducial model considered here (see Sec. 4.1). Wenow proceed with the analysis of the physical conditions in low-zH i absorbers.
101
102
1012 1013 1014 1015
b HI [
kms−
1 ]
NHI [cm−2]
AGN; S/N=10S/N=30
Lehner et al. 2007 (mean)Davé and Tripp 2001
Figure 3. bH I − NH I distribution obtained from 5000 simulated spectra withS/N=10 (red), and S/N=30 (blue), spanning the redshift range [0, 0.5], andmeasurements by Lehner et al. (2007, green data points from their Table 3 forbH I > 0 km s−1) and Dave & Tripp (2001, olive data points). Points show themedian bH I-value in each bin of size ∆ log(NH I/cm−2) = 0.3, while the errorbars parallel the y-axis correspond to 25 and 75 percentiles, respectively.Note that the red (blue) histogram on the right sub-panel corresponds to thered (blue) histogram in Fig. 2, but with a different binning and on a differentscale.
3.5 Physical state of the H i absorbing gas
In this section we present and discuss the physical properties ofthe gas detected via H i absorption in our fiducial model (AGN; seeTab. 1). The method we use is similar to the method described inPaper I, in which we used optical-depth weighted quantities. Briefly,to compute the desired H i optical-depth weighted quantity (e.g.density) associated with a given absorption line, we first compute theoptical-depth weighted density in redshift space along the sightlineas in Schaye et al. (1999). Next, we compute the average of theoptical-depth weighted density over the line profile, weighted againby the optical depth in each pixel and assign this last weightedaverage to the line. In concordance with Paper I, in the followingwe shall denote quantities weighted by H i optical depth by addinga corresponding subscript; thus, for example, the H i optical-depthweighted temperature is denoted by TH I. We refer the reader toSec. 5.1 of Paper I for a more detailed description about our methodfor computing optical depth-weighted quantities.
For simplicity, we obtain a new line sample of H i absorbersidentified in synthetic spectra with S/N=50 generated from 5000sightlines across a simulation box at a single redshift 2, z = 0.25,spanning a total redshift path ∆z = 187.5, which corresponds to anabsorption path length ∆χ = 270. These spectra have been fittedfollowing the method described in Appendix A.
We restrict our analysis to “simple”, i.e. single-component,absorbers, unless stated otherwise, We define an absorber i as‘simple’ if the velocity distance from its centre to any othercomponent j along the same sightline satisfies ∆v > 2σb, whereσ2
b ≡ 0.5[b2H I(i) + b2
H I( j)]. Absorption lines that do not satisfy thiscondition are referred to as ‘complex’.
2 Note that our chosen redshift is slightly higher than the median redshift ofmost H i absorption-line studies at low redshift (e.g. z ≈ 0.17 in Lehner et al.2007). Although some evolution does take place from z = 0.5→ 0.0, we donot expect the choice of this particular redshift to affect our conclusions inany significant way.
Table 2. Line-number density, (dN/dz), total baryon content in H i, ΩH I,and total baryon content in gas traced by H i, Ωb(H i), related to simple H iabsorbers identified in 5000 spectra with S/N=50, 30, and 10 at z = 0.25.
S/N=50 S/N=30 S/N=10
components (rel. to S/N=50) 1 0.72 0.31simple absorbers (rel. to total) 0.47 0.53 0.65(dN/dz) a 460 ± 22 332 ± 18 144 ± 12ΩH I [10−7] b 1.20 1.15 1.12Ωb(H i)/Ωb 0.57 0.47 0.29
a Quoted uncertainties are purely Poissonian. For comparison, Lehner et al.(2007) obtain (dN/dz) = 165 ± 13 at S/N ≈ 10.b Total baryon content in H i obtained by adding the column densities ofall identified H i components. The true total baryon content in H i along thefitted sightlines at z = 0.25 is ΩH I = 2.11 × 10⁻⁵.
Table 2 contains various statistical and physical quantities res-ulting from the analysis of these new line sample, such as the relativenumber of identified components, the relative number of simple ab-sorbers, the line-number density, (dN/dz), the total baryon content3
in H i, ΩH I, and the total baryon content in gas traced by H i, Ωb(H i)(see also Sec. 4.5). Note that the statistical and physical propertiesof this new sample are very similar to the corresponding propertiesof the line sample discussed in Secs. 3.2 – 3.4.
3.5.1 Physical density and absorber strength
As previously noted by several studies (e.g. Schaye et al. 1999; Daveet al. 1999), there exists a tight correlation between H i column-density, NH I, and overdensity4, ∆ ≡ ρb/ 〈ρb〉, of the absorbing gasusually parametrized in the form of a power-law, ∆/∆0 = (NH I/N0)a.Due to variations in the (local) ionising radiation field, the influenceof other heating mechanism (shocks), and other factors such asthe geometry of the absorbing structures, etc., this relation has anintrinsic scatter, which decreases with increasing redshift (Dave et al.1999).
The relation between overdensity and H i column density forthe diffuse IGM has been derived analytically by Schaye (2001),who assuming local hydrostatic equilibrium5 and optically thin gasfinds
log ∆ ∝2
3 + α (1 − 2b)
(log NH I −
92
log(1 + z)). (1)
In the above equation, α is the slope of the temperature-densityrelation, T = T0 ∆α, which results from the balance between photo-heating and adiabatic cooling (Hui & Gnedin 1997), and −b isthe power of the temperature in the expression for the H i recom-bination rate coefficient which behaves as ∝ T−b. If re-ionisationof the IGM takes place at sufficiently high redshifts, its imprintson the thermal state of the IGM are eventually washed out, andthe slope of temperature-density relation is expected to reach
3 The total baryon content in H i is computed via
ΩH I =mH
ρc
cH0
NLOS∑i=1
∆χi
−1 NLOS∑
i=1
Nabs∑j=1
(NH I)i j .
4 The mean baryonic density in our model is〈ρb〉 = 4.18 × 10⁻³¹ (h/0.73)2 (1 + z)3 g cm−3.5 The assumption of ‘local hydrostatic equilibrium’ implies that the size ofa self-gravitating gas cloud is of the order of the local Jeans length.
−1
0
1
2
3
4
11 12 13 14 15
log
∆ HI
log (NHI/cm−2)
S/N=50; AGNS/N=30S/N=10
Figure 4. ∆H I − NH I relation for simple H i absorbers identified in spectrawith different S/N values at z = 0.25 for. Points show the median overdensityin each bin of size ∆ log(NH I/cm−2) = 0.1. Error bars along the y-directioncorrespond to 25 and 75 percentiles in each bin. For clarity, only the errorbars for the S/N=50 result are shown, but they are similar for S/N=30 andS/N=10. The horizontal arrows indicate the formal completeness limit foreach adopted S/N value as given by eq. (A3). Note the deviation of the∆H I − NH I relation from a single power-law for column densities belowthe formal completeness limit (at a given S/N) and in the column densityrange for which the H i Lyα line generally saturates (shaded area). A power-law with the theoretical expected slope 0.738 (but with arbitrary amplitude;Schaye 2001) has been included to guide the eye (black, dashed line).
an asymptotic limit determined by the temperature dependenceof the H i recombination rate. More specifically, at low redshiftα→ 1/(1 + b). We find6 b = 0.755 ± 0.001 in the temperature range[103, 5 × 10⁴] K, and hence α→ 0.570. Inserting this value intoeq. (1) gives ∆ ∝ NH I
0.738 · (1 + z)−3.36. Thus, the value of the amp-litude ∆0 in the ∆ − NH I relation decreases with redshift, implyingthat absorbers of a given column density trace gas at higher over-densities at lower redshift.
In Fig. 4 we show the ∆H I − NH I relation resulting from ourfiducial model for all simple H i absorbers identified in spectrawith different S/N values at z = 0.25. The turn-over in overdensityat column densities below the sensitivity limit (eq. A3) for eachadopted S/N is caused by errors in the measured NH I below thislimit. Note also the deviation of the ∆H I − NH I relation from a singlepower-law at column densities log(NH I/cm−2) & 14.5 (indicated bythe shaded area), which corresponds approximately to the columndensity for which the Lyα line saturates. This is in part due to theinability of our algorithm to properly fit saturated lines.
Performing a least-square, error-weighted fit to the S/N=50result for column densities above the corresponding sensitiv-ity limit (log(NH I/cm−2) = 12.3; see eq. A3) and restricted tolog(NH I/cm−2) 6 14.5, we find a = 0.786 ± 0.010 and ∆0 = 48.3,normalised to N0 = 1014cm−2. The resulting slope for S/N=30(S/N=10) is a = 0.798 ± 0.010 (a = 0.847 ± 0.014) in the logar-ithmic column density range [12.5, 14.5] ([13.0, 14.5]), where thelower column density limit is given by eq. (A3). A power-law withthe theoretical expected slope 0.738 and arbitrary amplitude hasbeen included in this figure for reference (black, dashed line).
For comparison, Dave et al. (2010, their equation 3) find
6 We compute the recombination rate coefficient for recombination case Anumerically, and fit a power law in the given temperature range.
Figure 5. Ratio of H i line thermal width, (bT / km s−1) = 12.9√
TH I/104 K,to total line width, bH I, as a function of the optical depth at line centre,τ0, inferred from Voigt profile fits, for simple H i absorbers identified inspectra at z = 0.25 adopting different S/N values. The top axis indicatesthe corresponding H i column density assuming bH I = 30 km s−1, whichcorresponds to the median value of the Doppler parameter distribution (seeSec. 3.3). The points show the median (bT /bH I) value in each bin of size∆ log τ0 = 0.25 indicated by the error bars parallel to the x-axis; the lowerand upper error bars parallel to the y-axis correspond to the 25 and 75percentiles in each bin, respectively. For clarity, only the error bars for theS/N=50 result are shown, but they are similar for S/N=30 and S/N=10.Note that the values corresponding to S/N=30 (blue crosses) have beenslightly shifted for display purposes. The horizontal arrows indicate theformal completeness limit for each adopted S/N value as given by eq. (A3).The dashed horizontal lines enclose the range 0.5bH I 6 bT 6 bH I, and havebeen included to guide the eye. The gray, shaded area indicates the centraloptical depth (or column density) range for which the H i Lyα line generallysaturates. The hatched area indicates the typical range in τ0 for BLAs,−1.34 < log τ0 < 0, detected in spectra with S/N=50 (see Sec. 4.2.1).
a = 0.741 ± 0.003 and ∆0 = 38.9 at z = 0.25, for absorbers arisingin gas with temperatures log (T/K) < 4.5 in their simulation.If we restrict our sample to single-component absorbers withlog (TH I/K) < 4.5, we find a = 0.786 ± 0.014 and ∆0 = 45.1. Wenote that we do not rescale the amplitude of the UV background inour simulation, while Dave et al. (2010) adjust its amplitude by afactor 3/2 to bring their predicted evolution of the H i optical depthinto better agreement with observations.
3.5.2 Gas temperature and line width
A matter of interest is to which extent the measured H i linewidth can be used to estimate the temperature of the H i absorb-ing gas. We explore this by comparing the H i thermal line width,bT = 12.9
√TH I/104 K, computed from the optical depth-weighted
gas temperature, TH I, to the total H i line width, bH I, as a functionof the line strength as given by the optical depth at the line centre,τ0. The optical depth at the line centre is computed using the H icolumn density and the H i line width inferred from a Voigt profilefit to the line (see Appendix A). We bin the ratio (bT /bH I) in τ0, andplot in Fig. 5 the median value and the 25-/75-percentiles in eachbin as a function of τ0, for all single component absorbers identifiedin our synthetic spectra with different S/N values at z = 0.25.
We see that thermal broadening becomes increasingly import-ant with increasing line strength (or H i column density), and itcontributes with at least 50 per cent to the total line width, i.e.bT & 0.5 bH I, irrespective of the line strength and the adopted S/N
value. The temperature of gas giving rise to absorption lines withcentral optical depths in the range 1 < τ0 < 8.5 (corresponding tostrong lines) on average contributes with at least 90 per cent to thetotal line width, i.e. bT & 0.9 bH I. The lower (bT /bH I) value shownby highly saturated lines, i.e. lines with τ0 > 8.5 (gray, shaded area)is most probably due to the uncertainty in the fit parameters ofsuch lines. These results suggest, in view of the tight ∆H I − NH I
relation discussed above, that absorption arising in low density gasis subject to more significant non-thermal (i.e. Hubble) broadeningthan gas at higher density. This is consistent with the idea that lowdensity, unbound gaseous structures are subject to the universalexpansion, while gas at higher densities residing closer to galax-ies may have detached from the overall expansion. We find (notshown) that the line width correlates well with the gas temperaturefor log
(NH I/cm−2
)& 13, but that it is a poor indicator of the thermal
state of the gas for lower column densities.Fig. 5 shows also that lines with central optical depths cor-
responding to H i column densities below the formal completenesslimit for each adopted S/N value (indicated by the arrows) as givenby eq. (A3) have, on average, bT > bH I, which is un-physical. Theselines correspond to absorption by gas at high temperatures, whichgives rise to very shallow and extremely broad features that are (in-correctly) fitted with several components, thus yielding line widthsthat are narrower than allowed by the gas temperature.
In the central optical depth range typical for BLAs detected inspectra with S/N=50, −1.34 < log τ0 < 0 (see Sec. 4.2.1) indicatedby the hatched area, the contribution of thermal broadening to theline width amounts to 60 to 90 per cent. If non-thermal processes(e.g. turbulence) contribute to the line broadening in such a waythat the total line width is given by b2
H I = b2T + b2
nt, where bnt is thenon-thermal broadening (as would be the case for a purely Gaussianturbulence field), then the ratio of non-thermal broadening to totalline width can be important, even though the thermal contributionis substantial. Take as an example the maximum, average thermalbroadening to total line ratio for BLAs bT /bH I = 0.9; this valuetogether with b2
H I = b2T + b2
nt implies bnt/bH I = 0.4.
3.5.3 The (NH I, bH I)-plane
A deeper insight into the physical state of gas giving rise to H iabsorption identified in real QSO spectra can be gained by study-ing the relation between selected physical quantities and the lineobservables, NH I and bH I, simultaneously. We have followed suchan approach in Paper I in order to study the physical conditions ofO vi absorbing gas, and now apply it to study gas traced via H i ab-sorption. We focus on four quantities: gas temperature TH I, neutralhydrogen fraction (nH I/nH)H I, total hydrogen column density NH,and gas metallicity Z. Note that gas temperature and metallicityare ‘true’ optical depth-weighted quantities, while total hydrogencolumn-density and ionisation fraction are ‘derived’ quantities. Forinstance, the neutral fraction is computed using the optical depth-weighted hydrogen particle density, (nH)H I, and the optical depth-weighted gas temperature, using pre-computed tables obtained withthe photoionisation package cloudy (version 07.02 of the code lastdescribed by Ferland et al. 1998), as described in Sec. 2.
For each of these physical quantities we proceed as follows:First we compute the desired physical quantity, e.g. TH I, for each ofthe simple absorbers in our S/N=50 line sample. We then divide the(NH I, bH I)-plane into cells, and compute the median value for thedesired quantity using the values of all absorbers with (NH I, bH I)values in that cell. Fig. 6 displays the result for temperature (top-left), neutral hydrogen fraction (top-right), metallicity (bottom-left),
Figure 6. Temperature (top-left), neutral hydrogen fraction (top-right), metallicity (bottom-left), and total hydrogen column density NH (bottom-right) of the gasat z = 0.25 traced by simple H i absorbers identified in spectra with S/N=50, as a function of the line parameters NH I and bH I. The colour coding shows themedian value in each cell of the corresponding physical quantity. The white contours show the distribution (by number) of the sample of simple H i absorbers, andthey are identical in all panels. These contours enclose, starting from the innermost, 20, 40, 60, 80, and 90 per cent of the total number of single-component H iabsorbers. The horizontal and diagonal dashed lines indicate the usual BLA selection criteria bH I > 40 km s−1 and (NH I/bH I) = 3 × 1012cm−2km−1s (S/N)−1
(e.g. Richter et al. 2006a), respectively. Absorbers within this boundaries typically trace gas at log(T/K) & 4.7, have total hydrogen column densities18 . log(NH/cm−2) . 18.9, and low ionisation fractions log(nH I/nH)H I . −5.5. Also, the (local) metallicity of the gas traced by these absorbers is typicallylog(ZH I/Z) & −2.5.
and total hydrogen column density (bottom-right). The colour codeindicates the median value of the corresponding physical quant-ity. For reference, we include contours (white solid curves) show-ing the distribution by number of the simple H i absorbers on the(NH I, bH I)-plane. These contours enclose, starting from the inner-most, 20, 40, 60, 80, and 90 per cent of the total number of H i com-ponents. The dashed horizontal and diagonal lines at the top-rightcorner of each panel indicate, respectively, the BLA selection cri-teria bH I > 40 km s−1 and (NH I/bH I) = 3 × 1012cm−2km−1s (S/N)−1
(Richter et al. 2006a) adopting S/N=50.
There are several interesting features in this figure. First, allfour physical quantities appear to have a relatively simple depend-ence on NH I and bH I. The temperature of the gas (top-left panel),for example, shows a positive correlation with the line width, whichappears to be tighter for absorbers at a given NH I (range), in agree-ment with the results presented in Sec. 3.5.2. In this respect, notethe population of narrow (bH I ∼ 10 km s−1), low-column density(NH I < 1012cm−2) absorbers with high (log (TH I/K) > 4.8) opticaldepth-weighted temperatures. These correspond to the absorbers
with column densities below the formal completeness limit and withbT > bH I, previously discussed.
The neutral hydrogen fraction (top-right panel) increases withNH I, but strongly decreases with bH I. This can be interpreted asa temperature-dependence, given the positive correlation betweenTH I and bH I. Correspondingly, the total hydrogen column density(bottom-right panel) increases with both NH I and bH I. The bottom-left panel shows that the (local) metallicity of the gas is strongly cor-related with the line width. Given the correlation between gas tem-perature and line width shown the top-left panel, this suggests thatthere is a correlation between gas temperature and (local) gas metalli-city. This correlation is very likely a consequence of strong feedback.Indeed, high-temperature, high-metallicity absorbers could be tra-cing shock-heated, enriched outflows in the surroundings of galaxiesthat have not had enough time to mix with the surrounding gas andto cool down, whereas low-temperature, low-metallicity absorberscould be tracing both gas that has not yet been impacted by outflows,and wind material that has been ejected at redshifts high enough forit to cool down and to dilute its metal content in the ambient gas.
The BLA selection regime defined by the dashed lines in
Table 3. Definition of the various gas phases we consider in terms of temper-ature and density thresholds. For example, we define the warm-hot, diffusegas (WHIM) to have temperatures T > 5 × 10⁴ K and overdensities ∆ 6 102.
a We consider ‘star-forming’ the gas with physical densities that exceedour adopted star-formation threshold n∗H = 0.1 cm−3 and which is allowed toform stars. The temperature of this gas phase is set by an imposed equationof state (EoS) of the form P ∝ ρ4/3. This gas phase can be thought of asthe inter-stellar medium (ISM). Note that, although this gas is cold, it is notincluded in the gas phase defined as ‘cool’.
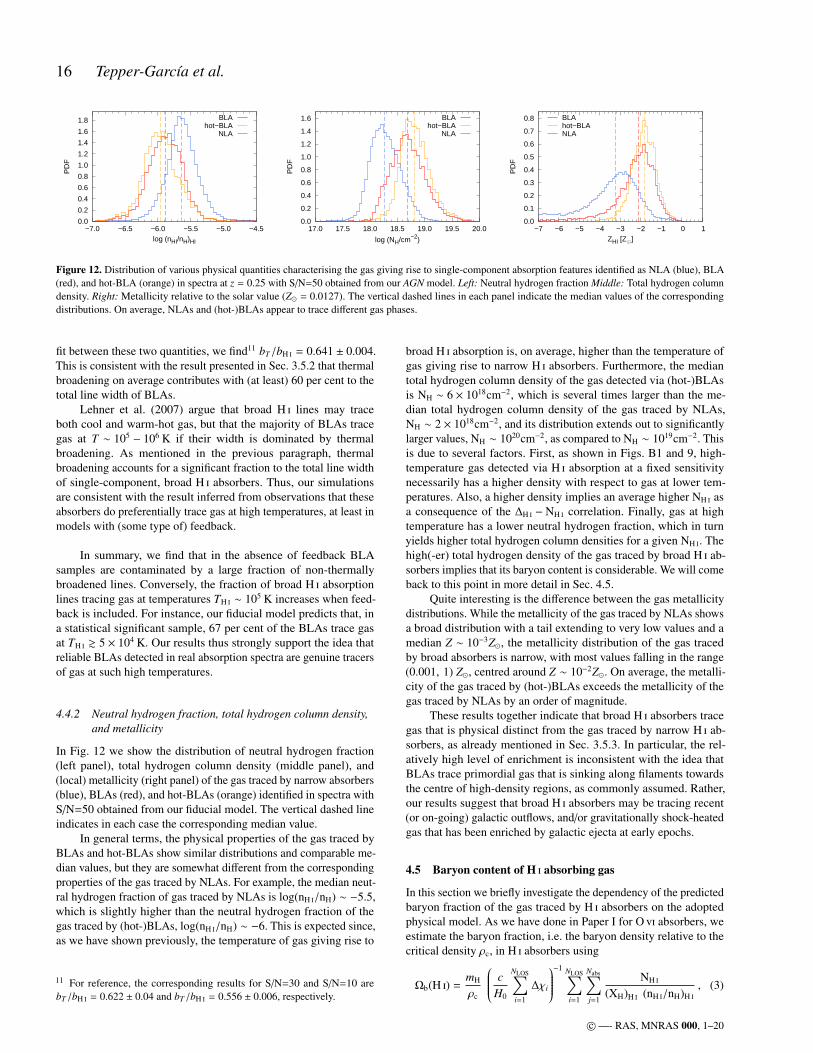
each panel reveals a population of H i absorbers tracing highlyionised (log(nH I/nH)H I ∼ −6) gas with median temperatureslog (TH I/K) & 4.7, median (local) metallicities log(ZH I/Z) & −2.5,and total hydrogen column densities log(NH/cm−2) ≈ 18.7, which isalmost an order of magnitude higher than the total hydrogen columndensity of typical Lyα forest absorbers (see also Fig. 12). Accordingto our previous interpretation of the TH I − ZH I correlation, theseresults suggests that BLAs may be tracing galactic outflows. Wewill come back to this point in Sec. 4.4.2.
The results presented in this section indicate that the H i columndensity of unsaturated absorbers is a reliable tracer of the underlyingphysical density of the gas giving rise to the detected H i Lyα absorp-tion. Moreover, the temperature of the absorbing gas may be roughlyestimated from the measured line width, as suggested by the averagecontribution of thermal broadening to the total line width of theseabsorbers. Finally, H i absorbers subject to the commonly adoptedBLA selection criteria trace gas which appears to be physicallydistinct from the gas traced by typical Lyα forest absorbers.
4 THE WARM-HOT DIFFUSE GAS
In the next sections we explore in detail the effect of feedback andmetal-line cooling on the physical state (i.e. density and temperature)of the gas in our simulations. Also, we investigate the H i absorptionsignatures of warm-hot diffuse gas, and the physical properties ofthe gas traced by broad H i absorption features (BLAs) identifiedin synthetic QSO absorption spectra. For this purpose, we use theH i sample from our fiducial model AGN presented in Sec. 3.5, andgenerate similar samples for all the other model runs. Comparisonbetween model predictions and observations (whenever possible)are done exclusively for our fiducial run.
4.1 Model-dependence of the predicted warm-hot gas mass
On super-galactic scales, two mechanisms are able to shock-heatintergalactic gas to temperatures T & 5 × 10⁴ K: a) galactic out-flows driven by SNII explosions and by AGN activity; b) accretionshocks caused by infall onto the potential wells of dark matterhalos. We have selected four model runs from the OWLS project,NOSN NOZCOOL, NOZCOOL, REF, and AGN, to investigate theeffect of each of these mechanisms on the properties of diffuse gas
and its imprints on simulated absorption spectra. Note that thesemodels have already been described in Sec. 2 (see also Tab. 1).
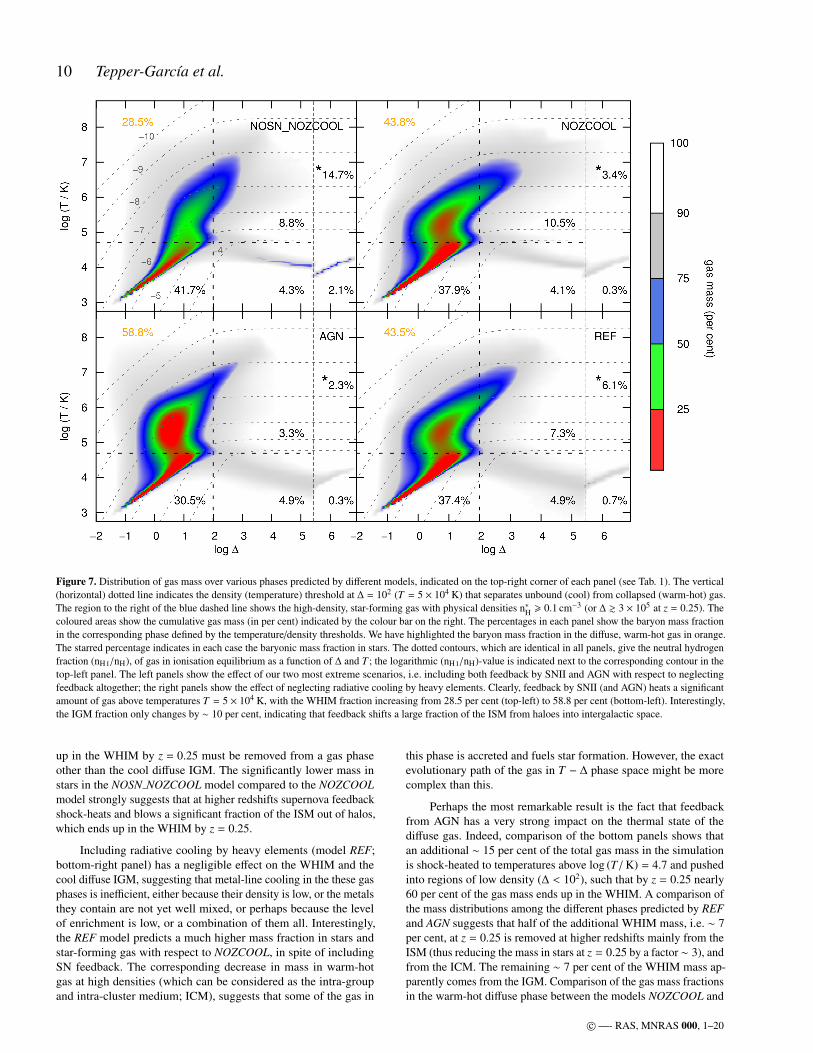
We are interested in the predicted distribution of gas massamong the various (gas) phases –in particular the warm-hot dif-fuse phase– defined in Tab. 3. We adopt a temperature thresholdat log (T/K) = 4.7 (or T ≈ 5 × 10⁴ K) and a density threshold at∆ = 102 to distinguish these gas phases. The density threshold hasbeen chosen so as to roughly separate unbound gas from collapsedstructures (at z = 0.25). The temperature threshold is motivated bythe bi-modality in the gas mass distribution predicted by the modelsconsidered here (see below). Note that our value is somewhat belowthe ‘canonical’ but to some extent arbitrary T = 105 K commonlyadopted to distinguish cool from warm-hot intergalactic gas (but seeWiersma et al. 2010).
The distribution of gas mass as a function of temperature and(over-)density predicted by the different models is presented in Fig. 7.The coloured areas show the cumulative gas mass (in per cent) in-dicated by the colour bar on the right. The vertical (horizontal)solid line in each panel indicates the density (temperature) thresholdseparating the various phases. Star-forming gas, which is definedas gas with physical densities n∗H > 0.1 cm−3 (or7 ∆ ≈ 3 × 10⁵ atz = 0.25), is shown to the right of the blue, vertical dashed line ineach panel. The percentage included in each separate region indic-ates the baryonic mass in the corresponding (gas) phase relative tothe total baryonic mass. In particular, the number (orange) in thetop-left corner of each panel gives the mass fraction of gas withT > 5 × 10⁴ K and ∆ 6 102, i.e. warm-hot diffuse gas. The starredpercentage indicates in each case the baryonic mass confined in stars.Note that our adopted temperature threshold seems appropriate toseparate cool, photo-ionised from shock-heated gas; the gas massdistribution at ∆ 6 102 is clearly bimodal, with two phases havingsignificant gas mass fractions above and below log (T/K) = 4.7.The dotted contours indicate the neutral hydrogen fraction, (nH I/nH),as function of density and temperature at z = 0.25; it has been com-puted using pre-computed cloudy tables as described in Sec. 2. Thelogarithmic (nH I/nH)-value is indicated next to the correspondingcontour in the top-left panel.
The sequence of models given by moving clock-wise fromthe top-left panel is essentially a sequence of increasing feedbackstrength (and model complexity). The mass fraction in warm-hotdiffuse gas in the model NOSN NOZCOOL (top-left panel) indicatesthat by z = 0.25 roughly 30 per cent of the gas mass is shock-heatedto temperatures log (T/K) > 4.7 by gravity alone. In the absence ofany feedback on galactic scales, a large fraction of the gas that isaccreted via gravitational infall at higher redshifts is able to cooland fuel star formation, with nearly 15 per cent of the gas massending up in stars by z = 0.25. The cool, photo-ionised diffuse gasat log (T/K) . 4.7 and ∆ 6 102 in this model contains roughly 40per cent of the total gas mass.
Moving on to the top-right panel (model NOZCOOL), we seethat nearly 45 per cent of the baryonic mass in the simulation is inthe form of warm-hot diffuse gas as a consequence of the kineticenergy released by supernova explosions. This corresponds to anabsolute increase in mass of 15 per cent in this gas phase comparedto NOSN NOZCOOL. At the same time, the mass fraction in thecool diffuse IGM predicted by NOZCOOL decreases with respectto NOSN NOZCOOL, but by a far smaller amount (∼ 4 per cent inabsolute terms). Thus, about 10 per cent of the gas mass that ends
7 The relation between hydrogen particle density nH and (baryonic) over-density ∆ is given by eq. (B7) in Appendix B.
Figure 7. Distribution of gas mass over various phases predicted by different models, indicated on the top-right corner of each panel (see Tab. 1). The vertical(horizontal) dotted line indicates the density (temperature) threshold at ∆ = 102 (T = 5 × 10⁴ K) that separates unbound (cool) from collapsed (warm-hot) gas.The region to the right of the blue dashed line shows the high-density, star-forming gas with physical densities n∗H > 0.1 cm−3 (or ∆ & 3 × 10⁵ at z = 0.25). Thecoloured areas show the cumulative gas mass (in per cent) indicated by the colour bar on the right. The percentages in each panel show the baryon mass fractionin the corresponding phase defined by the temperature/density thresholds. We have highlighted the baryon mass fraction in the diffuse, warm-hot gas in orange.The starred percentage indicates in each case the baryonic mass fraction in stars. The dotted contours, which are identical in all panels, give the neutral hydrogenfraction (nH I/nH), of gas in ionisation equilibrium as a function of ∆ and T ; the logarithmic (nH I/nH)-value is indicated next to the corresponding contour in thetop-left panel. The left panels show the effect of our two most extreme scenarios, i.e. including both feedback by SNII and AGN with respect to neglectingfeedback altogether; the right panels show the effect of neglecting radiative cooling by heavy elements. Clearly, feedback by SNII (and AGN) heats a significantamount of gas above temperatures T = 5 × 10⁴ K, with the WHIM fraction increasing from 28.5 per cent (top-left) to 58.8 per cent (bottom-left). Interestingly,the IGM fraction only changes by ∼ 10 per cent, indicating that feedback shifts a large fraction of the ISM from haloes into intergalactic space.
up in the WHIM by z = 0.25 must be removed from a gas phaseother than the cool diffuse IGM. The significantly lower mass instars in the NOSN NOZCOOL model compared to the NOZCOOLmodel strongly suggests that at higher redshifts supernova feedbackshock-heats and blows a significant fraction of the ISM out of halos,which ends up in the WHIM by z = 0.25.
Including radiative cooling by heavy elements (model REF;bottom-right panel) has a negligible effect on the WHIM and thecool diffuse IGM, suggesting that metal-line cooling in the these gasphases is inefficient, either because their density is low, or the metalsthey contain are not yet well mixed, or perhaps because the levelof enrichment is low, or a combination of them all. Interestingly,the REF model predicts a much higher mass fraction in stars andstar-forming gas with respect to NOZCOOL, in spite of includingSN feedback. The corresponding decrease in mass in warm-hotgas at high densities (which can be considered as the intra-groupand intra-cluster medium; ICM), suggests that some of the gas in
this phase is accreted and fuels star formation. However, the exactevolutionary path of the gas in T − ∆ phase space might be morecomplex than this.
Perhaps the most remarkable result is the fact that feedbackfrom AGN has a very strong impact on the thermal state of thediffuse gas. Indeed, comparison of the bottom panels shows thatan additional ∼ 15 per cent of the total gas mass in the simulationis shock-heated to temperatures above log (T/K) = 4.7 and pushedinto regions of low density (∆ < 102), such that by z = 0.25 nearly60 per cent of the gas mass ends up in the WHIM. A comparison ofthe mass distributions among the different phases predicted by REFand AGN suggests that half of the additional WHIM mass, i.e. ∼ 7per cent, at z = 0.25 is removed at higher redshifts mainly from theISM (thus reducing the mass in stars at z = 0.25 by a factor ∼ 3), andfrom the ICM. The remaining ∼ 7 per cent of the WHIM mass ap-parently comes from the IGM. Comparison of the gas mass fractionsin the warm-hot diffuse phase between the models NOZCOOL and
AGN suggests that SN and AGN contribute roughly a similar amountto the baryon content of the WHIM. Equally important, the gas massin this gas phase predicted by the models NOSN NOZCOOL (∼ 30per cent) and AGN (∼ 60 per cent) indicates that (strong) feed-back (both by SN and AGN) may be able to shock-heat an amountof gas comparable to the gas shock-heated via gravitational infall.This results thus indicate that it is crucial to understand feedbackprocesses on super-galactic scales before being able to make anyreliable predictions about the baryon content of warm-hot gas in theUniverse.
Consider finally the hydrogen neutral fraction (nH I/nH) indic-ated by the dotted contours. The logarithmic value of (nH I/nH) isindicated next to the corresponding contour in the top-left panel, andthey are identical in all the other panels. At a fixed temperature, theneutral hydrogen fraction increases with density, since the ionisationstate of the gas is dominated by photo-ionisation. However, at suffi-ciently high densities, i.e. ∆ & 102 at z = 0.25, collisional ionisationdominates and the neutral hydrogen fraction depends only on thegas temperature, resulting in contours running parallel to the ∆-axis.In either case, the neutral hydrogen fraction steeply decreases withtemperature at all densities (see also Richter et al. 2008; Danforthet al. 2010). As a consequence, the gas at densities and temperaturescharacteristic of the warm-hot diffuse gas is expected to be highlyionised. In particular, the model AGN predicts that the vast major-ity of the gas in the WHIM contains a neutral hydrogen fraction(nH I/nH) . 10−6. This has important implications for the detectabil-ity of this gas phase via H i absorption which will be discussed indetail in Sec. 4.2.1.
4.2 Observability of (warm-hot) gas using (broad) H iabsorption
In this section we explore to what extent the actual gas mass (distri-bution) in the cool and warm-hot diffuse phases are traced by theH i detected in absorption. In particular, we investigate the thermalstate of the gas traced by absorbers selected in terms of their linewidth, albeit only on a statistical basis. At the same time, we invertthe approach and inquire about the spectral signatures (and physicalproperties) of H i absorbers arising in warm-hot gas. Even thoughwe are interested primarily in broad absorbers, we include narrowabsorbers in our analysis as well. This allows for a more robustinterpretation of our results. We define the following classes of H iabsorbers in terms of their spectral and/or physical properties:
(i) NLA: H i absorber components with Doppler parametersbH I < 40 km s−1. We adopt the notation introduced by Lehner et al.(2007).
(ii) BLA: H i absorber components with Doppler parametersbH I > 40 km s−1 that satisfy the sensitivity limit introduced byRichter et al. (2006a) and adopted in other studies (Danforth et al.2010; Williger et al. 2010)(
NH I/cm−2
bH I/ km s−1
)> 3 × 10¹² (S/N)−1 .
This limit is equivalent to a H i Lyα central optical depth
τ0 > 2.27 (S/N)−1 . (2)
We feel that using a detection limit in terms of τ0 is more intuitivethan the limit in terms of (NH I/bH I), in particular for small valuesof τ0, since in this limit τ(v) ≈ 1 − F(v). Henceforth, we will useeq. (2) instead of the limit in terms of (NH I/bH I) as our second BLAselection criterion; also, all corresponding results will be expressedin terms of τ0 rather than (NH I/bH I).
0.40.50.60.70.80.91.01.11.2
Tra
nsm
issi
on
log (NHI /cm−2) = 13.03
log (NH /cm−2) = 19.62
log ∆HI = 1.60
log (THI/K) = 5.32
| |
0.1
1.0
10.0
∆
104
105
106
107
108
T [K
]
−4 −3 −2 −1 0 1 2 3 4
−800 −600 −400 −200 0 200 400 600 800
v pec
[100
km
s−1 ]
Restframe Velocity [kms−1]
Figure 8. Example of a sightline through a simulation box at z = 0.25 froma run adopting our fiducial model (AGN). The top panel shows a syntheticspectrum generated by specwizard using S/N=50 (black) and the correspond-ing fit (red) centred on a simple BLA with bH I ≈ 63 km s−1, and showingan additional narrow H i Lyα absorption line (vertical marks flag the linecentres). The subsequent panels show, from top to bottom, the gas overdens-ity, the gas temperature, and the peculiar velocity along the sightline. Black,solid lines indicate smoothed quantities; red, dashed lines H i optical-depthweighted quantities. The dotted horizontal line in the second panel (fromthe top) indicates the detection limit at S/N=50 (see eq. A3) expressed interms of ∆ using the NH I(∆) relation discussed in Sec. 3.5.1. The valuesin the lower-left and lower-right corner of the top panel give, respectively,the H i column density and the H i optical depth-weighted total hydrogencolumn density, and the overdensity and the temperature of the gas tracedby the BLA. Note that log (T/K) = 5.32 corresponds to a thermal widthbT = 59.0 km s−1, implying that the width of this BLA is dominated bythermal broadening.
(iii) hot-BLA: BLAs with optical-depth weighted temperaturesTH I > 5 × 10⁴ K. This class is defined in order to isolate BLAsgenuinely tracing warm-hot gas. Note that our adopted temperat-ure threshold is lower than the actual temperature implied by Dop-pler parameters bH I > 40 km s−1 assuming pure thermal broadening8.This is, however, not an issue since as we have shown ins Sec. 3.5.2,the line width of BLAs is never entirely set by thermal broadening.
As in previous sections, all the results presented here referto simple absorbers as defined in Sec. 3.5, unless stated otherwise.
8 The thermal width of an H i line arising in gas at T & 5 × 10⁴ K isbH I & 30 km s−1.
Table 4. Number fraction (in percent) of simple absorbers relative to thetotal number of H i components in each class identified in synthetic spectraat z = 0.25 with S/N=50 for different models.
NOSN NOZCOOL NOZCOOL REF AGN
all a 43 44 44 47NLA b 37 37 37 38BLA 4.5 5.5 5.6 7.1hot-BLA 1.0 1.7 1.7 3.1
a Note that about half of the identified absorbers are single-component,irrespective of the model.b Note that the fraction of NLA is similar for all models, suggesting thatthe gas traced by these absorbers is not significantly affected by feedback.
Tab. 4 gives an overview of the statistics of simple absorbers ineach of the classes defined above, for all four models consideredhere. An example of such a simple (broad) H i absorber is shownin Fig. 8. The top panel shows the spectrum (black) and corres-ponding fit (red) centred at a H i Lyα line with bH I = 63 km s−1 andNH I ∼ 1013cm−2. The next panel shows the smoothed overdensity(black) and the H i optical depth-weighted overdensity (red dashed)along the sightline. Note the relative simple density structure of theabsorbing gas. The smoothed (black) and H i optical depth-weighted(red dashed) temperatures are shown in the third panel (from the top).Clearly, the gas giving rise to the BLA shown in the top panel has atemperature T & 105 K. As a consequence of the high temperature,the absorbing gas is highly ionised, with a total H i column dens-ity NH ≈ 4 × 1019cm−2, and it represents thus a significant baryonreservoir. The slight off-set between the BLA and the density peakof the absorbing gas is due to its (small) peculiar velocity along thesightline (bottom panel).
4.2.1 Spectral sensitivity
Before we investigate the physical and statistical properties of BLAsin our simulations, we need to assess how setting a fixed sensitivitylimit as given by eq. (2) may bias the detection of warm-hot gas.Under rather simple assumptions, it is possible to model the H i Lyαcentral optical depth, τ0, of H i absorbing gas as a function of itstemperature and density. This allows one to put constraints on thephysical state of the gas phase traced using H i absorption, given aset of instrumental limitations that lead to a minimum detection (orsensitivity) limit. Conversely, following this approach it is possibleto estimate the sensitivity needed to detect gas at a given temper-ature and density. We describe the basic assumptions and give adetailed calculation of our model in Appendix B. In particular, weshow that it depends on the assumed size of the absorbing structure.With no better estimate at hand, we assume the absorbers to have alinear size9 of order the local Jeans length (Schaye 2001, see alsoeq. B5). Note that we have already showed in Section 3.5.1 thatthis assumption can account for the NH I(∆) relation predicted bythe simulations. Also, our model neglects non-thermal broadening,implying that all sensitivities in terms of τ0 given henceforth arestrict lower limits.
We now investigate the relation between the gas mass distribu-tion in our simulations and the gas mass detected in H i absorption.For each of the BLAs in the line sample obtained for each model
9 Note that the simulation runs we use do resolve the Jeans length, inparticular at the relatively low densities consider here.
considered here, we estimate ∆H I and TH I, and plot the resultingdistribution on the TH I − ∆H I plane. The result is shown in Fig. 9.The coloured areas indicate the cumulative number fraction (in percent) of BLAs at a given density and temperature. The gray solidcontours correspond in each case to the gas mass distribution shownin Fig. 7. Note that for the contours the axes indicate the actual gasoverdensity and gas temperature. We plot in each panel a series ofblack dashed contours which indicate the central optical depth, τ0,as a function of ∆H I and TH I as given by eq. (B6). The correspondingcontour values are indicated next to each curve only in the top-leftpanel, but they are identical for all the other panels. Note in particu-lar the thick dashed contour (magenta) which indicates our adoptedsensitivity limit as given by eq. (2) for S/N=50, i.e. log τ0 = −1.34(or log (NH I/bH I) = 10.8).
One notable feature in this figure is the bi-modality of the dis-tribution of gas traced by broad H i absorbers, irrespective of themodel. We see in each case a population of BLAs tracing gas atlow temperatures (TH I < 5 × 10⁴ K) and overdensities log ∆H I < 0.5,and a second population tracing warm-hot gas at TH I > 5 × 10⁴ Kand overdensities log ∆H I > 0.5. Note, however, that the amplitudeof the distribution varies from model to model. Comparing the graycontours to the coloured distribution we see clearly that the H idetected in absorption traces only a fraction of the gas mass inthe simulations. In particular, the model AGN (bottom-left panel)shows a large fraction of gas mass at 105 K . TH I . 3 × 10⁵ K andlog ∆H I ∼ 0.5 which is not detected in H i absorption. The same istrue for the models NOZCOOL and REF, although at slightly dif-ferent temperatures and overdensities. Consideration of the thickdashed contour reveals that this is a selection effect, i.e. the gas issimply not detectable at our adopted sensitivity limit. As discussedabove, this comes about because the gas at such high temperaturesand relative low densities is extremely ionised, with neutral hy-drogen fractions log (nH I/nH) . −6, and its absorption simply fallsbelow our adopted detection threshold (cf. Fig. B1).
Thus, in our fiducial model BLAs detected in spectra withS/N=50 typically have −2 < log τ0 < 0, while the bulk of the gasmass at 105 K . TH I . 3 × 10⁵ K and log ∆H I ∼ 0.5 is predicted togive rise to absorption with log τ0 < −2. The fact that we do detectin absorption some of the gas at temperatures and densities whichcorrespond to sensitivities slightly smaller than our adopted value(i.e. to the left of the thick dashed contour) reflects the simplicity ofthe assumptions that go into modelling the absorption strength interms of ∆ and T . Nevertheless, the expected and actual detectionsare fairly consistent with each other. Based on this, we estimatethat in order to detect most of the baryonic mass in the WHIMusing thermally broadened H i absorption, spectra with very highS/N are required that allow detection at the log τ0 ∼ −2 level, whichis roughly an order of magnitude lower than the typical sensitivitiesadopted in BLA studies (Richter et al. 2006a; Danforth et al. 2010;Williger et al. 2010) .
4.3 BLA number density
Since our adopted sensitivity limit matches the value used to identifyBLA candidates in real QSO spectra, we may directly compare thepredicted and observed line frequencies. Applying the selection cri-teria described above (i.e. bH I > 40 km s−1 and τ0 > 2.27 (S/N)−1)to our AGN H i line sample obtained from spectra with S/N=50 atz = 0.25 results in 6120 BLA candidates, which corresponds to aline-number density (dN/dz)BLA = 33 ± 6, where the quoted uncer-tainty is pure Poissonian. The number densities of BLAs identifiedin spectra with S/N=30 and S/N=10 are given in Tab. 5. For com-
Figure 9. Distribution of temperature and overdensities of the gas traced by simple BLAs (coloured regions) identified in spectra with S/N=50 at z = 0.25obtained from various models. In each panel, the coloured regions show the cumulative number fraction (in per cent) of BLAs. For instance, the red regioncontains 25 per cent of the total number of BLAs, while the green and red regions together contain half of them. The gray contours correspond to the gas massdistributions shown in Fig. 7. Note the change in scale on both the x- and y-axes with respect to Fig. 7. The vertical (horizontal) solid line in each panel indicatesthe density (temperature) threshold adopted to distinguish the different gas phases (see Tab. 3). The dashed contours, which are identical in all panels, indicatethe central optical depth, τ0, as a function of (over-)density and temperature (see Appendix B, eq. B6). For clarity, the corresponding logarithmic value of τ0 isincluded next the each curve only in the top-left panel. The magenta dashed contour indicates our adopted sensitivity limit for S/N=50, log τ0 = −1.34 (eq. 2).The percentage (orange) in each panel indicates the fraction of baryonic mass of the gas traced by simple BLAs with TH I > 5 × 10⁴ K, i.e. simple hot-BLAs.Reassuringly, the overwhelmingly majority of the identified BLAs lie below the thick magenta contour, irrespective of the model. However, the large fraction ofmass in gas at T & 105 K and ∆ . 10 (in particular for AGN) is not observable at our adopted sensitivity. The dashed contours indicate that at least log τ0 ∼ −2is required. BLAs selected in terms of their width and eq. (2) thus only trace the low-temperature regime of the warm-hot diffuse gas, since the gas at highertemperatures is not observable, probably due it its high ionisation degree (see Fig. B1). Note that the estimated baryon content of the absorbing gas in each casecorresponds to ∼ 10 per cent of the actual baryonic mass in the this phase for the corresponding model (cf. Fig. 7).
pleteness, we also include in this table the corresponding numbersfor NLAs. Note that the absolute number of BLAs decreases whilethe relative number of simple BLAs increases with decreasing S/N.This is due to a low S/N causing line blending and increasing theline widths, as discussed in Sec. 3.3 (see also Richter et al. 2006a,their figure 2).
In Fig. 10 we compare the cumulative BLA number densityas a function of τ0 predicted by our fiducial run obtained fromspectra with various S/N values to the available observational resultsobtained from QSO spectra at comparable redshifts and with similar(average) S/N. The arrows indicate the BLA sensitivity limit interms of τ0 for the corresponding S/N value as given by eq. (2). Thepredictions for simple BLAs are indicated by the solid lines. Sinceour definition of simple absorbers is somewhat arbitrary, we includethe corresponding predictions for all, i.e. simple and complex, BLA
candidates as well (dashed lines). These two sets of lines thus spanour predicted line-frequency range for S/N ∈ [10, 50].
It is noteworthy that our predictions are broadly consist-ent with the observed range of BLA number densities. Forexample, our prediction for S/N=30 (blue solid) agrees withthe results by Lehner et al. (2007, green data points). Theseauthors find in their data with an average S/N ≈ 15, discard-ing lines with associated line-parameter errors larger than 40per cent, a fraction of single-component BLAs close to 30per cent and a mean (averaged over 7 sightlines) line-numberdensity (dN/dz)BLA = 30 ± 7 at log τ0 & −1.10 (equivalent tolog (NH I/bH I) & 11.02), and (dN/dz)BLA = 9 ± 3 at log τ0 & −0.66(or log (NH I/bH I) & 11.46 ). Both our S/N=50 (black) andS/N=30 (blue) predictions match the result by Danforth et al.(2010, orange data point), who find (dN/dz)BLA = 18 ± 11 at
Table 5. Line-number density, (dN/dz), and corresponding Poisson uncer-tainties for BLAs and NLAs identified in spectra with various S/N valuesfrom our fiducial run at z = 0.25.
S/N=50 S/N=30 S/N=10
all a 460±21 332±18 144±12simple 214±15 175±13 94±10NLA (simple) 173±13 140±12 73±9 b
NLA (all) 343±19 248±16 110±10 b
BLA (simple) 33±6 28±5 15±4BLA (all) 95±10 66±8 25±5
a This corresponds simple and complex H i absorbers taken together.b For reference, Lehner et al. (2007) find a mean (dN/dz)NLA = 66 ± 17over 7 sightlines for all NLAs in their data with an average S/N ≈ 10,discarding lines with associated Voigt-profile parameter errors larger than 40per cent.
−0.5
0.0
0.5
1.0
1.5
2.0
−1.5 −1.0 −0.5 0.0 0.5 1.0 1.5 2.0
log
(dN
/dz)
> lo
g τ 0
log τ0
simpleall
Richter et al. 2006aLehner et al. 2007a
Danforth et al. 2010aWilliger et al. 2010a
AGN; S/N=50S/N=30S/N=10
Figure 10. Cumulative number density of BLAs as a function of centraloptical depth, τ0. Measurements available in the literature are plotted alongwith the predictions of our fiducial run AGN at z = 0.25 (see text for details).The solid lines show the result for simple BLAs identified in 5000 spectrawith S/N=50 (black), S/N=30 (blue), and S/N=10 (red). We include ourresults for all (i.e. simple and complex) BLA candidates as well (dashedlines). The arrows indicate the BLA sensitivity limit in terms of τ0 for thecorresponding S/N value as given by eq. (2).
log τ0 & −1.12 (log (NH I/bH I) & 11.0) along seven sightlines atz . 0.5, spanning a total redshift path ∆z = 2.193, with S/N > 5.Their sample consists of 15 single-component BLAs and 48BLAs with uncertain velocity structure. Williger et al. (2010,magenta data point) estimate their detection limit at log τ0 & −1.22(or log (NH I/bH I) & 10.9) and obtain (dN/dz)BLA = 25 ± 15 and(dN/dz)BLA = 8.5 ± 8.5 for their full and single-component BLAsamples, respectively, along a single sightline (∆z = 0.117) andcorresponding spectrum with S/N=20 – 30. Finally, Richter et al.(2006a, black data point) measure (dN/dz)BLA = 22 using theirreliable sample of single-component BLAs, detected along foursightlines at z . 0.4 (∆z = 0.928), at a sensitivity log τ0 & −0.82 (orlog (NH I/bH I) & 11.3), in spectra with an average S/N ≈ 15.
4.4 Physical properties of broad H i absorbers
In Sec. 3 we discussed the relation between the physical conditionsof the gas traced by typical H i absorbers and their line observables
(NH I, bH I) using our fiducial model. We now focus on the physicalconditions of the gas giving rise to H i absorbers identified as simpleBLAs in our synthetic spectra at z = 0.25; these correspond to single-component H i absorbers falling within the region defined by thepolygon in Fig. 6 which is defined through two criteria: a) the linewidth satisfies bH I > 40 km s−1; b) the central optical depth obeyseq. (2), i.e. τ0 > 2.27 (S/N)−1.
Given the importance of broad H i absorbers as potentialWHIM tracers, and the dependence of the predicted WHIM massfraction on the adopted physical model, we next explore the rela-tion between the measured line width and the temperature of theabsorbing gas using the models introduced in Sec. 2. We further useour fiducial model (AGN) to investigate the ionisation state, neutralhydrogen fraction, and metallicity of the gas traced by differentclasses of H i absorbers. Finally, we estimate the baryon content ofthe gas traced by BLAs using all models, but compare our results toobservations using only the model AGN.
4.4.1 Temperature distribution of (broad) lines
In Fig. 11 we show the distribution of temperatures of the gas tracedby both BLAs (red histograms) and NLAs (blue histograms) identi-fied our spectra with S/N = 50 at z = 0.25 obtained from differentmodels. The dashed, vertical line in each panel indicates the tem-perature threshold adopted to separate cool from warm-hot gas (seeTab. 3).
In all models, the temperature distribution of the gas tracedby NLAs shows that lines with Doppler parameters bH I < 40 km s−1
preferentially arise in gas at temperatures TH I . 5 × 10⁴ K with apeak at TH I ∼ 104 K, as expected from their width. The few lineswhich are narrower than allowed by the temperature of the absorbinggas (i.e. the section of the blue histogram to the right of the ver-tical, dashed line) are mostly weak lines that fall below the formalcompleteness limit, as discussed in Sec. 3.5.2. But some of theselines are real detections, which suggest that gas at different temper-atures overlaps in velocity space (due to redshift-space distortions),and some of it may even overlap in position space, indicating theexistence of multi-phase absorbing structures. In models with feed-back (NOZCOOL, REF, AGN), the temperature distribution of thegas traced by NLAs is broader than in the model without feedback(NOSN NOZCOOL), and the fraction of lines with ‘un-physical’widths is higher. This can be explained as follows. Outflows drivenby SNe and AGN follow the path of least resistance in space, thusescaping into the voids while leaving the cooler, denser filamentsintact (Theuns et al. 2002). With increasing feedback strength, thecross-section of such high-temperature outflows increases as well,and so does the chance for a random sightline to intersect both cool,dense filaments and shock-heated material, with their correspondingabsorption overlapping from time to time along the spectrum.
Note that the NLA temperature distributions in the modelsNOZCOOL and REF are very similar to each other, and the same istrue for the corresponding BLA temperature distributions. Moreover,the fraction of hot-BLAs is only slightly lower in REF than inNOZCOOL. This indicates that metal-line cooling is of secondaryimportance in setting the thermal state of the gas phase traced by(broad) H i absorbers.
In contrast to narrow H i absorbers, broad H i lines trace gasaround two different temperatures, TH I ∼ 104 K and TH I ∼ 105 K,irrespective of the model (red histograms). Clearly, BLAs arising ingas at low temperatures must be subject to substantial non-thermal
Figure 11. Temperature distribution of the gas traced by simple H i absorbers identified in spectra at z = 0.25 with S/N=50 obtained from different models. Theblue histograms show in each case the distribution for gas traced by narrow (i.e. bH I < 40 km s−1) absorbers, while the red histograms indicate the temperaturedistribution of gas traced by BLAs. The percentage shown in each panel indicates the number fraction of BLAs arising in gas at TH I > 5 × 10⁴ K, i.e. hot-BLAs.Note the correspondence between increasing mass fraction of warm-hot diffuse gas in Fig. 7 and the increasing fraction of BLAs tracing warm-hot gas shownhere. The distribution predicted by our fiducial run (AGN) suggests that, statistically, two out of three BLA candidates trace gas at T & 5 × 10⁴ K.
broadening, such as bulk flows and/or Hubble broadening10. Sincethe line width of an H i absorber with bH I = 40 km s−1 arising ingas at T ∼ 104 K is completely dominated by non-thermal broad-ening, its linear size (assuming the line width is entirely due toHubble broadening) must be ∼ 500 kpc, which is consistent withthe Jeans length of a filament with a mean density nH ∼ 10−6cm−3
and temperature T ∼ 104 K (eq. B5).Interestingly, the fraction of BLAs tracing gas at low
(TH I ∼ 104 K) and high (TH I ∼ 105 K) temperatures is very differentin each model, as can be judged qualitatively by the shape of thecorresponding histograms and quantitatively by the percentage in-cluded in each panel which gives the fraction of hot-BLAs, i.e. BLAstracing gas with T > 5 × 10⁴ K. In fact, the ratio of BLAs tracingcool gas to those tracing warm-hot gas appears to be very sensitiveto feedback strength. In principle, this could be used to constrain
10 Note that our simulations lack the resolution to capture small-scale turbu-lence within the gas.
feedback models observationally. The caveat is that a statisticallysignificant sample of confirmed BLAs would be required for whichthe gas temperature can be measured reliably. In our fiducial model(AGN), which includes the strongest feedback, the majority of theBLAs trace gas at TH I ∼ 105 K, with little contamination by non-thermally broadened lines. In fact, two out of three BLA candidatesarise in gas at temperatures T > 5 × 10⁴ K.
The bi-modal character of the gas temperature distributions forBLAs predicted by the model NOSN NOZCOOL is also consistentwith previous results. Richter et al. (2006b) find in a simulationthat included a model similar to our NOSN NOZCOOL that ∼ 30per cent of the BLAs trace gas at T < 2 × 10⁴ K, and a significantfraction gas at TH I & 5 × 10⁴ K. The quantitative difference betweentheirs and our result for NOSN NOZCOOL is probably caused bythe difference in the simulation methods used. Using a linear modelto fit the thermal to total line width, Richter et al. (2006b) find thatbT /bH I = 0.91 (no error quoted). We note that we do not find sucha tight correlation between bT and bH I, but if we perform a linear
Figure 12. Distribution of various physical quantities characterising the gas giving rise to single-component absorption features identified as NLA (blue), BLA(red), and hot-BLA (orange) in spectra at z = 0.25 with S/N=50 obtained from our AGN model. Left: Neutral hydrogen fraction Middle: Total hydrogen columndensity. Right: Metallicity relative to the solar value (Z = 0.0127). The vertical dashed lines in each panel indicate the median values of the correspondingdistributions. On average, NLAs and (hot-)BLAs appear to trace different gas phases.
fit between these two quantities, we find11 bT /bH I = 0.641 ± 0.004.This is consistent with the result presented in Sec. 3.5.2 that thermalbroadening on average contributes with (at least) 60 per cent to thetotal line width of BLAs.
Lehner et al. (2007) argue that broad H i lines may traceboth cool and warm-hot gas, but that the majority of BLAs tracegas at T ∼ 105 − 106 K if their width is dominated by thermalbroadening. As mentioned in the previous paragraph, thermalbroadening accounts for a significant fraction to the total line widthof single-component, broad H i absorbers. Thus, our simulationsare consistent with the result inferred from observations that theseabsorbers do preferentially trace gas at high temperatures, at least inmodels with (some type of) feedback.
In summary, we find that in the absence of feedback BLAsamples are contaminated by a large fraction of non-thermallybroadened lines. Conversely, the fraction of broad H i absorptionlines tracing gas at temperatures TH I ∼ 105 K increases when feed-back is included. For instance, our fiducial model predicts that, ina statistical significant sample, 67 per cent of the BLAs trace gasat TH I & 5 × 10⁴ K. Our results thus strongly support the idea thatreliable BLAs detected in real absorption spectra are genuine tracersof gas at such high temperatures.
4.4.2 Neutral hydrogen fraction, total hydrogen column density,and metallicity
In Fig. 12 we show the distribution of neutral hydrogen fraction(left panel), total hydrogen column density (middle panel), and(local) metallicity (right panel) of the gas traced by narrow absorbers(blue), BLAs (red), and hot-BLAs (orange) identified in spectra withS/N=50 obtained from our fiducial model. The vertical dashed lineindicates in each case the corresponding median value.
In general terms, the physical properties of the gas traced byBLAs and hot-BLAs show similar distributions and comparable me-dian values, but they are somewhat different from the correspondingproperties of the gas traced by NLAs. For example, the median neut-ral hydrogen fraction of gas traced by NLAs is log(nH I/nH) ∼ −5.5,which is slightly higher than the neutral hydrogen fraction of thegas traced by (hot-)BLAs, log(nH I/nH) ∼ −6. This is expected since,as we have shown previously, the temperature of gas giving rise to
11 For reference, the corresponding results for S/N=30 and S/N=10 arebT /bH I = 0.622 ± 0.04 and bT /bH I = 0.556 ± 0.006, respectively.
broad H i absorption is, on average, higher than the temperature ofgas giving rise to narrow H i absorbers. Furthermore, the mediantotal hydrogen column density of the gas detected via (hot-)BLAsis NH ∼ 6 × 1018cm−2, which is several times larger than the me-dian total hydrogen column density of the gas traced by NLAs,NH ∼ 2 × 1018cm−2, and its distribution extends out to significantlylarger values, NH ∼ 1020cm−2, as compared to NH ∼ 1019cm−2. Thisis due to several factors. First, as shown in Figs. B1 and 9, high-temperature gas detected via H i absorption at a fixed sensitivitynecessarily has a higher density with respect to gas at lower tem-peratures. Also, a higher density implies an average higher NH I asa consequence of the ∆H I − NH I correlation. Finally, gas at hightemperature has a lower neutral hydrogen fraction, which in turnyields higher total hydrogen column densities for a given NH I. Thehigh(-er) total hydrogen density of the gas traced by broad H i ab-sorbers implies that its baryon content is considerable. We will comeback to this point in more detail in Sec. 4.5.
Quite interesting is the difference between the gas metallicitydistributions. While the metallicity of the gas traced by NLAs showsa broad distribution with a tail extending to very low values and amedian Z ∼ 10−3Z, the metallicity distribution of the gas tracedby broad absorbers is narrow, with most values falling in the range(0.001, 1) Z, centred around Z ∼ 10−2Z. On average, the metalli-city of the gas traced by (hot-)BLAs exceeds the metallicity of thegas traced by NLAs by an order of magnitude.
These results together indicate that broad H i absorbers tracegas that is physical distinct from the gas traced by narrow H i ab-sorbers, as already mentioned in Sec. 3.5.3. In particular, the rel-atively high level of enrichment is inconsistent with the idea thatBLAs trace primordial gas that is sinking along filaments towardsthe centre of high-density regions, as commonly assumed. Rather,our results suggest that broad H i absorbers may be tracing recent(or on-going) galactic outflows, and/or gravitationally shock-heatedgas that has been enriched by galactic ejecta at early epochs.
4.5 Baryon content of H i absorbing gas
In this section we briefly investigate the dependency of the predictedbaryon fraction of the gas traced by H i absorbers on the adoptedphysical model. As we have done in Paper I for O vi absorbers, weestimate the baryon fraction, i.e. the baryon density relative to thecritical density ρc, in H i absorbers using
Figure 13. Top: Baryon content (in per cent) relative to the cosmic valueΩb = 0.0418 of the gas traced by H i absorbers identified in synthetic spectrawith S/N=50 for different model runs. The H i absorber sample has beendissected into NLA (blue squares), BLAs (red filled circles), and hot-BLAs(orange open circles); these classes have in turn been divided into single-component absorbers (solid lines) and complex systems (dotted lines). Theblack, dot-dashed lines indicate in each case the result for all (i.e. simple andcomplex) absorbers of a given class. Bottom: Gas mass traced by a givenH i absorber type relative to the actual gas mass in the phase expected tobe traced by that particular type (see text for details). Symbols, lines, andcolours as in the top panel.
where mH is the hydrogen mass, and XH and (nH I/nH)H I are theoptical-depth weighted hydrogen mass fraction and neutral hydrogenfraction, respectively. Note that NH I, (XH)H I, and (nH I/nH)H I arecomputed for individual absorbing components along each sightline,but we have omitted the running indices for simplicity.
The top panel of Fig. 13 shows the baryonic mass fractions,Ωb(H i)/Ωb, predicted by various models in different types of ab-sorbers: NLAs (blue squares), BLAs (red filled circles), and hot-BLAs (orange open circles), where each of these classes have beensub-divided into simple (solid lines) and complex (dotted lines)absorbers (see Secs. 3.5 and 4.2). Note that we consider the ba-ryonic mass fraction of the gas traced by both simple and complexabsorbers, since our adopted criterium to define simple absorbersis somehow arbitrary. The net baryon fractions of simple and com-plex absorbers (of a given class) taken together are indicated by thedot-dashed lines.
The baryonic mass fraction in NLAs (simple or complex) isvery similar in all models, being only slightly lower in our fiducial
run AGN. This is consistent with the lower gas mass fraction inthe cool diffuse gas (which is expected to be traced by NLAs) inthis model compared to all other models (see Fig. 7). The smalldifference in Ωb(NLA)/Ωb between all the models indicates thatfeedback has a negligible impact on the gas phase typically tracedby NLAs. This in turn is consistent with the fact that the predictedH i statistics (which are dominated by these absorbers) are ratherinsensitive to variations in the feedback model (see Appendix C).
The baryonic mass fraction of gas traced by simple BLAs isrelatively low, and varies significantly between the models, from ∼ 3per cent (NOSN NOZCOOL) to ∼ 7 per cent (AGN). The baryonicmass fractions in complex BLAs are much higher than the baryonicmass fractions in simple BLAs, and they are also very different ineach model. For instance, the baryon fraction of complex BLAs inthe model NOZCOOL is higher (∼ 5 per cent) than in the modelNOSN NOZCOOL; this is consistent with the fact that SN feedbacksignificantly increases the mass in warm-hot diffuse gas, as has beenshown previously (see Fig. 7 and corresponding text), together withthe idea that BLAs preferentially trace this gas phase. In contrast, thebaryon fraction in complex BLAs predicted by the models REF andAGN, is lower (by ∼ 5 and ∼ 10 per cent, respectively) compared topredictions of the model NOZCOOL.
The lower baryon fraction in complex BLAs predicted by themodel REF with respect to NOZCOOL can be explained as follows.Complex absorbers trace kinematically disturbed gas, most probablySN-driven outflows. These ejecta carry heavy elements with them,which allow a significant fraction of the gas to cool down radiatively,thus reducing the number of thermally broadened lines and theirnet baryonic mass. However, the lower baryonic mass content ofcomplex BLAs in the model AGN with respect to all other modelsis in contrast with the actual total mass fraction in the warm-hotphase predicted by this model, which is higher compared to all othermodels (see bottom-left panel of Fig. 7). The discrepancy betweenthe predicted mass fraction in the warm-hot phase and the baryoncontent of the gas traced by BLAs in the AGN model can be under-stood as consequence of the limited sensitivity. As already discussed,AGN feedback shifts a significant fraction of gas into the warm-hot phase; however, most of this mass ends up at temperatures anddensities which lead to a H i fraction and corresponding absorptionsignal that is beyond our adopted detection limit (see Fig. 9).
Note that the baryon fractions traced by hot-BLAs are onlysightly lower than for BLAs, irrespective of the model. This is im-portant because it implies that the contamination of the BLA sampleby non-thermally broadened lines does not significantly affect theinferred baryon fraction of the WHIM. In other words, the baryonfraction in warm-hot gas is dominated by the absorbers arising ingas at the highest temperatures. This is a direct consequence of thesteep decline of the hydrogen neutral fraction with temperature.
The bottom panel of Fig. 13 shows the recovered mass fraction(in per cent) of a given gas phase. This quantity is defined as thetotal baryonic mass in a given absorber class relative to the actualgas mass in the phase (Fig. 7) expected to be traced by that particularabsorber class. So, for example, the gas mass recovered from hot-BLAs is given in each model as the total baryonic mass in theseabsorbers (orange, filled squares in the top panel of Fig. 13) dividedby the gas mass in the warm-hot diffuse phase (orange percentagesin the top-left sections of Fig. 7). The gas mass recovered fromNLAs is correspondingly given as the total baryonic mass in theseabsorbers (blue squares in the top panel of Fig. 13) divided by thegas mass in the cool diffuse phase (percentages indicated in thebottom-left sections of Fig. 7).
Apparently, none of the absorber classes traces the total gas
mass in its corresponding (expected) phase, with exception per-haps of the full (i.e. simple and complex) BLA sample (red filledcircles) in the model NOSN NOZCOOL. The gas mass fractiontraced by both simple and complex NLAs is very similar in all mod-els, and taken together these absorbers trace between ∼ 70 per cent(NOSN NOZCOOL) and ∼ 90 per cent (AGN) of the gas mass incool diffuse gas. This again is consistent with our previous state-ment that the gas in this phase is left almost intact by feedbackmechanisms such as SN-driven winds and AGN outflows,
Note that simple (hot-)BLAs trace roughly 10 to 15 per cent ofthe true baryonic mass in warm-hot gas, irrespective of the model.This suggests that baryonic mass estimates based on this type ofabsorbers are robust. In contrast, the gas mass traced by complex(hot-)BLAs is very different in each model. As already mentionedabove, in the model NOSN NOZCOOL the full BLA sample tracespractically all the mass contained in warm-hot gas, with complexBLAs contributing with more than 80 per cent to the recoveredgas mass. This suggests that the bulk of gas shock-heated bygravity (which is the only possible heating mechanism in the modelNOSN NOZCOOL) can be fully accounted for using (simple andcomplex) BLAs, at our adopted sensitivity. The recovered WHIMmass is, however, systematically lower in models that include SNand AGN feedback, and metal-line cooling.
Taking the result from our fiducial run AGN at face value, weestimate the total baryon content in gas traced by H i in our simula-tion at z = 0.25 to be Ωb(H i)/Ωb = 0.57 (S/N=50), 0.48 (S/N=30),and 0.29 (S/N=10). The last two values are in remarkable agreementwith the results from observations at comparable sensitivity. Assum-ing a simple ionisation model, Penton, Stocke & Shull (2004) meas-ure12 Ωb(H i)/Ωb = 0.31 ± 0.04 at z ≈ 0 for absorbers with columndensities 12.5 6 log
(NH I/cm−2
)6 17.5 and bH I . 100 km s−1. Sim-
ilarly, assuming the gas to be isothermal and photo-ionised, Lehneret al. (2007) obtain13 Ω(H i)/Ωb = 0.40 from their data withan average S/N ≈ 15 and for 12.4 6 log
(NH I/cm−2
)6 16.5 and
bH I . 150 km s−1.
4.5.1 Baryon content of warm-hot gas at low z
Estimates of baryonic mass contained in the WHIM based on broadH i absorbers detected in real QSO spectra are very uncertain, evenwith a reliable sample of BLA candidates at hand, since they arehighly sensitive to the ionisation state of the absorbing gas (seeeq. 3), which is probably dominated by collisions between ions andelectrons in the plasma. In this case, the neutral hydrogen fractionis a steeply decreasing function of temperature, and an accurateestimate of the WHIM baryon content thus relies on a precise meas-urement of the temperature of the absorbing gas. As we have shownin Sec. 3.5.2, temperature estimates from the line width of broad H iabsorbers may yield values that are uncertain by, at least, factors ofa few.
The first attempt to measure the baryon content of theWHIM using BLAs was undertaken by Richter et al. (2004),who found Ωb(BLA) 6 3.2 × 10⁻³ (h/0.73)−1 assuming CIE,which represents less than 8 per cent of the cosmic baryonbudget. In a follow-up study, Richter et al. (2006a) measured
12 Relative to Ωb = 0.0418, rather than Ωb = 0.047 assumed by Penton et al.(2004), and re-scaled to h = 0.73.13 Relative to Ωb = 0.0418, rather than Ωb = 0.044, and re-scaled toh = 0.73 rather than h = 0.7.
Ωb(BLA) > 2.6 × 10⁻³ (h/0.73)−1, corresponding to at least 6 percent of the baryons in the Universe. These authors also assumedCIE, but recognised the potential importance of photo-ionisation(PI) in determining the ionisation state of the WHIM, and concludedthat their baryon content measurement could be underestimated by15 - 50 per cent.
Using a significantly larger sample than previous studies,Lehner et al. (2007) report Ωb(BLA)/Ωb = 0.08 assuming the gas tobe in collisional ionisation equilibrium (CIE) for absorbers with13.2 6 log
(NH I/cm−2
)6 16.5 and 40 km s−1 < bH I . 150 km s−1.
Using the same sample and assuming a hybrid model (includingphoto- and collisional ionisation) to compute the neutral hydrogenfraction, these authors find Ωb(BLA)/Ωb = 0.20. Both estimates arebased on a series of assumptions. First, in order to account for thepossible contamination of their sample with lines broadened by unre-solved velocity structure or any other non-thermal mechanism, theseauthors randomly discard one third of the BLAs in their sample.Moreover, they assume the thermal width to be 90 per cent of theobserved line width, based on the results from previous simulationsby Richter et al. (2006b). If, instead, the line width is dominatedby thermal broadening, they get Ωb(BLA)/Ωb = 0.13 (CIE) andΩb(BLA)/Ωb = 0.32 (PI+CIE).
In a more recent study14, Danforth et al. (2010) re-port Ωb(BLA) = 6.0+1.1
−0.02. These authors analyse in detail thesystematic uncertainties that afflict their (and others’) baryonestimates, such as unresolved velocity structure, sample com-pleteness, ionisation corrections, and the assumed relationbetween line width and gas temperature, and find their es-timate to vary between Ωb(BLA) = 2.3 × 10⁻³ (h/0.73)−1 andΩb(BLA) = 15.2 × 10⁻³ (h/0.73)−1, i.e. between ∼ 6 and ∼ 36 percent of the cosmic baryon budget. Clearly, there is still a highuncertainty in the estimate of the baryonic mass traced by observedBLAs.
The results from our fiducial model are as follows. If we takesimple and complex BLAs together, we find that they trace ∼ 25(S/N=50), ∼ 20 (S/N=30), and ∼ 10 (S/N=10) per cent of the totalbaryon budget in our simulation. For comparison, BLAs (simple andcomplex) that arise in gas at T > 5 × 10⁴ K yield ∼ 24 (S/N=50),∼ 18 (S/N=30), and ∼ 9 (S/N=10) per cent, which are very closethe values obtained from the whole BLA sample. If we restrict theBLAs to be single-component, the resulting baryon fractions inthese absorbers are ∼ 7 (S/N=50), ∼ 6 (S/N=30), and ∼ 5 (S/N=10)per cent. This confirms that contamination of the BLA sample bynon-thermally broadened lines does not significantly affect theinferred baryon fraction of the WHIM. Incidentally, this suggeststhat there should be little overlap between the estimates of Ωb(NLA)and Ωb(BLA).
One final important remark. We have demonstrated that thebroad H i absorbers trace only a fraction of the total mass in theWHIM phase. Thus, even in the case that one could accuratelyestimate the baryon fraction in a given sample of absorbers, there isstill a large gap between the observed and true mass contained inthis gas phase. Although our simulation suggests that the baryonicmasses estimated from observations represent 1/10 to 1/3 of the true
14 We note that there is an error in the computation of the total absorptionpath length in Danforth et al. (2010, their Table 1), which might haveaffected their reported estimate of the baryon content in BLAs (C.Danforth,private communication).
baryonic mass in the WHIM, it is not clear how to use the measuredbaryonic mass to infer the true, total amount of baryons in this gasphase.
5 SUMMARY
In this paper, we have used a set of cosmological simulationsfrom the OverWhelmingly Large Simulations (OWLS) project(Schaye et al. 2010) to study the physical conditions of the gastraced by Broad H i-Lyα Absorbers (BLAs) with low and moderatecolumn densities (log
(NH I/cm−2
). 15) observed in QSO spectra.
We have chosen the AGN model of the OWLS suite to test thepredictions of our simulations against a set of H i observables. Wehave investigated the impact of metal-line cooling, kinetic feedbackby supernovae (SNe) explosions, and feedback by active galacticnuclei (AGN) on the distribution of the gas mass over differentphases such as the photo-ionised intergalactic medium (IGM) andthe shock-heated, warm-hot intergalactic medium (WHIM). Finally,we have explored the relation between the physical state and thebaryon content of these gas phases and both narrow H i absorbers(NLAs) and BLAs.
Our detailed results can be summarised as follows:
• Accretion shocks due to gravitational infall into the potentialwells of dark matter halos heat ∼ 30 per cent of the total gas massto temperatures T > 5 × 10⁴ K by z = 0.25 (Sec. 4.1).• Feedback by SNe and AGN each remove a similar amount of
gas from the ISM in haloes at early epochs and displace it to thewarm-hot diffuse phase, increasing its total mass fraction by another∼ 30 per cent by z = 0.25 (Sec. 4.1); in other words, roughly half ofof the gas mass predicted to be in the WHIM at low redshift (∼ 60per cent) has been heated by accretion shocks while the other half isdue to strong feedback.• The predictions from our simulations are in excellent agree-
ment with standard H i observables (CDDF, line-width distribution,bH I − NH I correlation; Secs. 3.2 – 3.4); these observables are ratherinsensitive to feedback and/or metal-line cooling (Appendix C).• The line-number density of narrow (bH I > 40 km s−1; NLA)
and broad (bH I > 40 km s−1; BLA) Lyα absorbers predicted by ourfiducial run AGN are in broad agreement with the correspondingobserved line-frequencies (Sec. 4.3).• The density of the H i absorbing gas shows a tight correlation
with the H i column density, which agrees well with the analyticprediction of Schaye (2001, Sec. 3.5.1); this implies that our simula-tions are consistent with the assumption that typical H i absorbersare self-gravitating clouds in hydrostatic equilibrium with linearsizes of the order of the local Jeans length.• The temperature of the H i absorbing gas correlates well with
the H i line width for log(NH I/cm−2
)& 13, but it is a poor indicator
of the thermal state of the gas for lower column densities; thermalbroadening contributes, on average, with at least 60 per cent to theline width of BLAs (Sec. 3.5.2).• The overwhelming majority of NLAs are found to trace gas at
T ∼ 104 K; their number, temperature distribution and baryon con-tent is very similar in models with/without feedback, thus stronglysuggesting that feedback has a negligible impact on the cool, diffusegas (i.e. the IGM; Sec. 4.4).• BLAs trace gas both at T ∼ 104 K and at T ∼ 105 K; our fidu-
cial model, which includes feedback by both SNe and AGN, predictsthat 2 out of 3 BLAs arise in gas at T & 5 × 10⁴ K; the number ratio
of thermally to non-thermally broadened H i absorbers is very sens-itive to (the adopted) feedback (model), and could in principle beused as an indicator of feedback strength (Secs. 4.2, 4.4).• The ionisation state, the total hydrogen content, and the level of
enrichment of the gas traced by BLAs indicates that these absorbersarise in gas that is physically distinct from the gas traced by NLAs;we argue that BLAs mostly trace gas that has been recently shock-heated and enriched by outflows (Secs.3.5.3, 4.4).• While models including SN and AGN feedback predict a higher
fraction of gas mass to be in the warm-hot diffuse phase, the baryonfraction of the gas inferred from BLAs in these models is lowercompared to a model without feedback; the reason is that much ofthe mass is displaced to temperatures and densities for which theH i fraction is too low for the gas to be detectable at the adoptedsensitivity (Sec. 4.5).• The baryon fraction of the gas traced by both NLAs and BLAs
predicted by our fiducial model shows broad agreement with corres-ponding measurements from observations (Sec. 4.5).• Baryonic mass estimates using simple BLAs are robust; in
contrast, the gas mass traced by complex BLAs is very sensitive tothe adopted (feedback) model (Sec. 4.5).• Our fiducial model predicts that roughly 6 per cent of the total
gas mass is traced by single-component BLAs, which representsabout 10 per cent of the total WHIM mass in this model; if therestriction that the absorbers be single-component is dropped, thenaround 25 per cent of the total gas mass (40 per cent of the WHIMmass) can be recovered from the detected broad H i absorption(Sec. 4.5).• Although some of the gas mass with temperatures
T > 5 × 10⁴ K and densities ∆ . 102 (i.e. the diffuse warm-hotphase) can be traced using BLAs, a significant fraction remainsundetected as a consequence of a minimum (instrumental) sensitiv-ity limit. Detection of the bulk of warm-hot gas requires a sensitivity(in terms of the H i central optical depth) of log τ0 . −2 (Secs. 4.2,4.5).
ACKNOWLEDGMENTS
The simulations presented here were run on Stella, the LOFARBlue Gene/L system in Groningen and on the Cosmology Machineat the Institute for Computational Cosmology in Durham aspart of the Virgo Consortium research programme. This workwas sponsored by the National Computing Facilities Foundation(NCF) for the use of supercomputer facilities, with financialsupport from the Netherlands Organisation for Scientific Research(NWO), an NWO VIDI grant, the Marie Curie Initial TrainingNetwork CosmoComp (PITN-GA-2009-238356), and the DeutscheForschungsgemeinschaft (DFG) through Grant DFG-GZ: Ri1124/5-1.
References
Altay G., Theuns T., Schaye J., Crighton N. H. M., Dalla VecchiaC., 2011, ApJ, 737, L37+, 1012.4014
Bertone S., Schaye J., Dolag K., 2008, Space Science Reviews,134, 295
Booth C. M., Schaye J., 2009, MNRAS, 398, 53, 0904.2572Booth C. M., Schaye J., 2011, MNRAS, 413, 1158Cen R., Ostriker J. P., 1999, ApJ, 514, 1, 9806281
Cen R., Ostriker J. P., 2006, ApJ, 650, 560, astro-ph/0601008Dalla Vecchia C., Schaye J., 2008, MNRAS, 387, 1431, 0801.2770Danforth C. W., Shull J. M., 2008, ApJ, 679, 194, 0709.4030Danforth C. W., Shull J. M., Rosenberg J. L., Stocke J. T., 2006,ApJ, 640, 716, astro-ph/0508656
Danforth C. W., Stocke J. T., Shull J. M., 2010, ApJ, 710, 613,0912.1603
Dave R., Cen R., Ostriker J. P., Bryan G. L., Hernquist L., Katz N.,Weinberg D. H., Norman M. L., O’Shea B., 2001, ApJ, 552, 473,astro-ph/0007217
Dave R., Hernquist L., Katz N., Weinberg D. H., 1999, ApJ, 511,521, 9807177
Dave R., Hernquist L., Weinberg D. H., Katz N., 1997, ApJ, 477,21, astro-ph/9609115
Dave R., Oppenheimer B. D., Katz N., Kollmeier J. A., WeinbergD. H., 2010, MNRAS, 408, 2051, 1005.2421
Dave R., Tripp T. M., 2001, ApJ, 553, 528, arXiv:astro-ph/0101419Ferland G. J., Korista K. T., Verner D. A., Ferguson J. W., KingdonJ. B., Verner E. M., 1998, PASP, 110, 761
Gehrels N., 1986, ApJ, 303, 336Green J. C., Froning C. S., Osterman S., Ebbets D., Heap S. H.,
Leitherer C., Linsky J. L., Savage B. D. e. a., 2012, ApJ, 744, 60,1110.0462
Haardt F., Madau P., 2001, in D. M. Neumann & J. T. V. Tran ed.,Clusters of Galaxies and the High Redshift Universe Observed inX-rays Modelling the UV/X-ray cosmic background with CUBA
Heap S. R., Williger G. M., Dave R., Weymann R. J., JenkinsE. B., Tripp T. M., 2002, in J. S. Mulchaey & J. T. Stocke ed.,Extragalactic Gas at Low Redshift Vol. 254 of AstronomicalSociety of the Pacific Conference Series, HST/STIS Spectroscopyof 3C 273. pp 63–+, arXiv:astro-ph/0109100
Hui L., Gnedin N. Y., 1997, MNRAS, 292, 27, 9612232Jarosik N., Bennett C. L., Dunkley J., Gold B., Greason M. R.,
Halpern M., Hill R. S., Hinshaw e. a., 2011, ApJS, 192, 14,1001.4744
Lanzetta K. M., Turnshek D. A., Wolfe A. M., 1987, ApJ, 322, 739Lehner N., Savage B. D., Richter P., Sembach K. R., Tripp T. M.,Wakker B. P., 2007, ApJ, 658, 680, 0612275
Levenberg K., 1944, Q. Appl. Math., 2, 164Marquardt D., 1963, J. Soc. Ind. Appl. Math., 11, 431McCarthy I. G., Schaye J., Ponman T. J., Bower R. G., Booth
C. M., Dalla Vecchia C., Crain R. A., Springel V., Theuns T.,Wiersma R. P. C., 2010, MNRAS, 406, 822, 0911.2641
Norman M. L., Bryan G. L., 1999, in S. M. Miyama, K. Tomisaka,& T. Hanawa ed., Numerical Astrophysics Vol. 240 of Astro-physics and Space Science Library, Cosmological Adaptive MeshRefinement. pp 19–+, arXiv:astro-ph/9807121
Oppenheimer B. D., Dave R., 2009, MNRAS, 395, 1875,0806.2866
Penton S. V., Stocke J. T., Shull J. M., 2004, ApJS, 152, 29, astro-ph/0401036
Press W. H., Teukolsky S. A., Vetterling W. T., Flannery B. P.,1992, Numerical Recipes in Fortran 77, second edn. CambridgeUniversity Press
Rauch M., Haehnelt M. G., Steinmetz M., 1997, ApJ, 481, 601,astro-ph/9609083
Richter P., Paerels F. B. S., Kaastra J. S., 2008, Space ScienceReviews, 134, 25, 0801.0975
Richter P., Savage B. D., Sembach K. R., Tripp T. M., 2006a, A&A,445, 827, astro-ph/0509539
Richter P., Savage B. D., Tripp T. M., Sembach K. R., 2004, ApJS,153, 165, 0403513
Schaye J., 2001, ApJ, 559, 507, astro-ph/0104272Schaye J., Carswell R. F., Kim T., 2007, MNRAS, 379, 1169,
astro-ph/0701761Schaye J., Dalla Vecchia C., 2008, MNRAS, 383, 1210, 0709.0292Schaye J., Dalla Vecchia C., Booth C. M., Wiersma R. P. C., TheunsT., Haas M. R., Bertone S., Duffy A. R., McCarthy I. G., van deVoort F., 2010, MNRAS, 402, 1536, 0909.5196
Schaye J., Theuns T., Leonard A., Efstathiou G., 1999, MNRAS,310, 57, astro-ph/9906271
Seljak U., Zaldarriaga M., 1996, ApJ, 469, 437, astro-ph/9603033Sembach K. R., Tripp T. M., Savage B. D., Richter P., 2004, ApJS,155, 351, astro-ph/0407549
Shull J. M., Giroux M. L., Penton S. V., Tumlinson J., StockeJ. T., Jenkins E. B., Moos H. W., Oegerle W. R., Savage B. D.,Sembach K. R., York D. G., Green J. C., Woodgate B. E., 2000,ApJ, 538, L13
Smith B. D., Hallman E. J., Shull J. M., O’Shea B. W., 2011, ApJ,731, 6, 1009.0261
Spergel D. N., Bean R., Dore O., Nolta M. R., Bennett C. L.,Dunkley J., Hinshaw G., Jarosik N. e. a., 2007, ApJS, 170, 377,astro-ph/0603449
Springel V., 2005, MNRAS, 364, 1105, astro-ph/0505010Springel V., White S. D. M., Jenkins A., Frenk C. S., Yoshida N.,
Gao L., Navarro J., Thacker R., Croton D., Helly J., Peacock J. A.,Cole S., Thomas P., Couchman H., Evrard A., Colberg J., PearceF., 2005, Nature, 435, 629, 0504097
Tepper-Garcıa T., 2006, MNRAS, 369, 2025, astro-ph/0602124Tepper-Garcıa T., Richter P., Schaye J., Booth C. M., Dalla Vec-
chia C., Theuns T., Wiersma R. P. C., 2011, MNRAS, 413, 190,1007.2840
Theuns T., Leonard A., Efstathiou G., Pearce F. R., Thomas P. A.,1998, MNRAS, 301, 478, astro-ph/9805119
Theuns T., Viel M., Kay S., Schaye J., Carswell R. F., TzanavarisP., 2002, ApJ, 578, L5, 0208418
Thom C., Chen H.-W., 2008a, ApJS, 179, 37, 0801.2381Thom C., Chen H.-W., 2008b, ApJ, 683, 22, 0801.2380Tripp T. M., Savage B. D., Jenkins E. B., 2000, The AstrophysicalJournal Letters, 534, L1
Tripp T. M., Sembach K. R., Bowen D. V., Savage B. D., JenkinsE. B., Lehner N., Richter P., 2008, ApJS, 177, 39, 0706.1214
van de Voort F., Schaye J., Altay G., Theuns T., 2011, ArXive-prints, 1109.5700
White S. D. M., 1996, in R. Schaeffer, J. Silk, M. Spiro & J. Zinn-Justin ed., Cosmology and Large Scale Structure Formation andEvolution of Galaxies. pp 349–+
Wiersma R. P. C., Schaye J., Dalla Vecchia C., Booth C. M., TheunsT., Aguirre A., 2010, MNRAS, 409, 132, 1005.3921
Wiersma R. P. C., Schaye J., Smith B. D., 2009a, MNRAS, 393,99, 0807.3748
Wiersma R. P. C., Schaye J., Theuns T., Dalla Vecchia C., TornatoreL., 2009b, MNRAS, 399, 574, 0902.1535
Williger G. M., Carswell R. F., Weymann R. J., Jenkins E. B.,Sembach K. R., Tripp T. M., Dave R., Haberzettl L., Heap S. R.,2010, MNRAS, 405, 1736, 1002.3401
Williger G. M., Heap S. R., Weymann R. J., Dave R., Ellingson E.,Carswell R. F., Tripp T. M., Jenkins E. B., 2006, ApJ, 636, 631,0505586
We fit our spectra using a significantly modified version of autovp(Dave et al. 1997), assuming each absorption component to be de-scribed by a Voigt profile given by the analytic approximation ofTepper-Garcıa (2006). autovp identifies absorption features usingthe equivalent-width significance criterion of Lanzetta et al. (1987).The spectrum is scanned using a window of width n pixels in searchof regions with significant absorption. A region is considered sig-nificant in absorption if its equivalent width satisfies W > N σW ,where N is the significance level, and σW is the uncertainty in theequivalent width, integrated over n pixels, given by
σW ≈√
n(∆v
cλ0
)· (1 + z) · (S/N)−1 . (A1)
Here, ∆v is the pixel width, S/N is the adopted signal-to-noise ratio,z is the (central) redshift of the absorption feature, λ0 is the rest-frame wavelength of the transition considered (e.g. H i Lyα), and cis the speed of light. We adopt N = 7 and n = 25 (corresponding toapprox. 88 km s−1 for our chosen resolution), and ∆v = 3.5 km s−1.With these values, the significance value translates into a rest-frameequivalent width
Wr ≈ 500 (S/N)−1 mÅ . (A2)
Note that our adopted window width does not affect the parametersof the fitted line(s) in any way.
If fitted by a single component, this implies that our line sampleis formally complete down to H i column densities15
NH I ≈ 9 × 10¹³ (S/N)−1 cm−2 . (A3)
For Doppler parameters in the range bH I > 40 km s−1, characteristicof BLAs, the above corresponds to a sensitivity limit in terms ofabsorption strength(
NH I/cm−2
bH I/ km s−1
). 2.3 × 10¹² (S/N)−1 , (A4)
which is equivalent to a H i Lyα optical depth at the line centre16
τ0 & 1.74 (S/N)−1. Note that the values implied by the above equa-tion are below the value commonly adopted for the identification ofBLA candidates in real QSO spectra (see eq. 2).
A spectrum is fitted in two steps. In the first step, an absorp-tion component is fitted at the pixel with the minimum flux in eachdetection region, starting with the region with the overall minimumflux. The column density, NH I, and the Doppler parameter, bH I, ofthe line are both iteratively reduced by a factor 0.99 starting fromlarge values (e.g. NH I = 1020cm−2 and bH I = 300 km s−1; see below)until the flux at that pixel is within 2σ below the actual flux level,i.e. in the range [F − 2σ, F], where σ is the local noise. Furthercomponents are added and their parameters correspondingly adjus-ted, taking all previous fitted lines into account, until the residualflux (i.e. the difference between actual flux and model flux) acrossthe detection region is below 2σ. This procedure is repeated forall detected regions. In a second step, the line parameters (velocitycentroid v0, column density NH I, and Doppler parameter bH I) of all
15 The quoted value is valid only for absorption lines on the linear part ofthe curve-of-growth, which is the case for the majority of the componentsidentified in our synthetic spectra. Also note that we do detect lines withcolumn densities (and rest-frame equivalent widths) smaller than the quotedvalues, since a detected region can be fitted by more than one component.16 The relation between line-strength and central optical depth for the Lyαline is given by eq. (B3) in Appendix B.
lines are simultaneously adjusted using the Levenberg-Marquardt al-gorithm (Levenberg 1944; Marquardt 1963) as implemented in Presset al. (1992) until the reduced χ2-value, i.e. the χ2-value dividedby the degrees of freedom, is below χ2
bad ≡ 1.2. If convergence isnot achieved, the sightline is discarded. We note that the fraction ofdiscarded sightlines is vanishingly small, and it amounts to 1/5000for our spectra at z = 0.25 and none for our spectra in the range0 6 z 6 0.5.
Since we do not take higher order H i Lyman transitions into ac-count, saturated H i Lyα lines deserve special attention. A pixelis considered saturated if the corresponding flux is below 2σ.For (S/N) & 10, this implies that the flux is of the order of, orlower than, 2σmin (where σmin = 10−4), which is equivalent to aH i Lyα central optical depth τ0 ≈ 8.52 or a H i column densitylog(NH I/cm−2) ≈ 13.1 + log(bH I/ km s−1) (see eq. B3). Assuminga Doppler parameter bH I = 30 km s−1 (which approximately cor-responds to the median b-value of our line sample, see Sec. 3.3),this corresponds to log(NH I/cm−2) ≈ 14.5. In order to prevent ouralgorithm from severely underestimating the true column dens-ity of such saturated lines, and at the same time to avoid fittinglines with unrealistically large column densities along a givensightline, during the second fitting step we limit the column dens-ity of an individual absorption line17 to five times this value, e.g.log(NH I/cm−2)max ≈ 15.2 for bH I = 30 km s−1. Note that this valueis not a strict limit but may still vary (in particular, it can be lar-ger) depending on the actual b-value of the saturated line. As aconsequence, we highly underestimate (by up to two orders of mag-nitude; see Table 2) the actual baryon content in H i along all fittedsightlines, which is dominated by high H i column density gas. Yet,the properties of the H i absorbers, in particular the broad H i ab-sorbers that are relevant for the present study, are not affected, sincethese are dominated by the low column density population withlog(NH I/cm−2) . 14.5.
During the second fitting step, we impose a minimum linewidth of bH I = 10 km s−1, corresponding to T ≈ 6000 K assumingpure thermal broadening. Lines narrower than this are discardedduring the fitting process unless the new χ2-value increases above1.2 χ2
bad. We note that this cut-off does not appreciably affect the res-ulting b-value distribution (see Fig. 2). Indeed, observations indicatethat narrow (i.e. bH I . 15 km s−1) H i absorbers at low redshift arescarce (Lehner et al. 2007).
Since our synthetic spectra are continuum-normalised by con-struction, we do not fit a continuum prior to line identification. Welimit the line width to a maximum value of bH I = 300 km s−1, al-though larger values are allowed if doing so reduces the χ2-valuebelow 1.2 χ2
bad. As a consequence, we find a small number of verybroad (bH I > 200 km s−1), very shallow absorption features, whichbecome less numerous with decreasing S/N. Since most of thesefeatures are real, though scarce, we do not discard them but includethem in our resulting line sample.
Finally, any candidate lines with formal relative errors in NH I
or bH I larger than 50 per cent are sequentially discarded unless theχ2-value increases above 1.2 χ2
bad. Note that the final formal errorsare typically much smaller than this, around 10 per cent for bothNH I and bH I.
17 This particular value chosen is arbitrary, but has been found to givesatisfactory results. Note that our algorithm may still underestimate the truecolumn density of heavily saturated lines.
The neutral hydrogen column density NH I is given by
NH I = NH · fH I ,
where NH and fH I ≡ (nH I/nH) are the total hydrogen column densityand neutral hydrogen fraction, respectively. The total hydrogencolumn density can be written using the hydrogen particle densitynH as
NH =
∫ L
0nH dl = nH · L ,
where L is the physical, linear extension of the absorbing structurealong the sightline, and nH is the average hydrogen particle density.In the following we will write nH ≡ nH, but the reader should keepthe (slight) difference in mind.
The width of an H i absorbing line as measured by the Dopplerparameter bH I may be modelled as
b2H I = b2
T + b2H + b2
nt .
The thermal width, i.e. the broadening due to the temperature T ofthe absorbing gas is given by[
bT / km s−1]
= 12.9√
T/104 K ,
and the Hubble broadening by (see e.g. Schaye 2001)
bH ∼12
H(z) · L ,
where H(z) is the Hubble parameter (at the appropriate epoch),expressed as
H(z) ≡ h(z) · 102 km s−1Mpc−1 , (B1)
with
h(z) = h0 [Ωm (1 + z)3 + ΩΛ]1/2 . (B2)
We adopt the cosmological parameters Ωm, ΩΛ, h0 =
0.238, 0.762, 0.73 as derived from the Wilkinson Mi-crowave Anisotropy Probe (WMAP) 3-year data, and find,e.g. h(z = 0.25) = 0.81.
The remaining term, bnt, in the expression for bH I includes allother forms of non-thermal broadening and is less straightforward tomodel. It may include turbulence within the absorbing gas, peculiarmotions of the absorbing structures, etc. Assuming that these arenegligible compared to the thermal and Hubble components, theline width can be approximated by[
bH I/ km s−1]2≈ 166 ·
[T/104 K
]+
14
104 [h(z) · L/Mpc
]2 .
Putting all the above equations together and simplifying, we findthat the H i Lyα absorption strength of the gas is given by(
Figure B1. H i Lyα central optical depth, τ0, as given by eq. (B6), requiredto detect gas with a given temperature for a range of densities at z = 0.25.The value along each curve indicates the corresponding logarithmic hydro-gen particle density, log
(nH/cm−3
). The number in parentheses indicates
the corresponding logarithmic overdensity. For reference, we include thealternative y-axis which shows the corresponding value of the H i Lyα ab-sorption strength at the line centre, log (NH I/bH I) in units of cm−2/ km s−1
(see equation B3). The dashed horizontal line indicates the adopted BLAdetection threshold given by eq. (2).
Note that fH I = fH I(nH,T, z), where the z-dependence comes aboutthrough the redshift dependence of the ionisation background in-cluded in the calculation of fH I.
If we assume that the absorbers have linear sizes of the orderof the local Jeans length (Schaye 2001)
where we have assumed the fraction of mass in gas to be closeto its universal value18 fg ≡ Ωb/Ωm = 0.168. Note that the aboveequation does no longer depend explicitly on the temperature, but itdoes depend implicitly on it through the dependence on fH I.
Using
nH =〈ρb〉
mHXH (1 + z) 3∆ ≈ 1.88 × 10⁻⁷cm−3
( XH
0.752
)(1 + z) 3∆
the above equations can all be expressed in terms of the overdensity∆ as well.
Fig. B1 shows the H i Lyα central optical depth, τ0, as a func-tion of gas temperature for a range of densities typical of inter-galactic gas, as given by eq. (B6). The alternative y-axis showsthe corresponding values for log (NH I/bH I) in units of cm−2/ km s−1.The value along each curve indicates the assumed logarithmic hydro-gen particle density, log
(nH/cm−3
), and the value in parentheses in-
dicates the corresponding logarithmic overdensity, log ∆, at z = 0.25.The horizontal dashed line indicates our adopted sensitivity limit
18 The total mass density parameter is Ωm = Ωb + Ωc. The most recentmeasurements of the baryonic and dark matter density parameters yield,respectively, Ωb = 0.0449 ± 0.0028 and Ωc = 0.222 ± 0.026 (Jarosik et al.2011).
Figure C1. CDDF for different model runs in a box L = 100h−1 Mpc per sideat z = 0.25 using 5000 random sightlines. Dashed lines show the distributionof column densities for individual absorption lines obtained from fittingthe synthetic spectra adopting S/N=50. Solid lines show the distributionof integrated NH I along each sightline. Note that the adopted S/N value ishigher than the S/N of the data, and the latter are only included for reference.The distribution of column densities for individual absorption componentsextends to much lower values since a spectrum (corresponding to a singlephysical sightline) is generally fitted with more than one component.
as given by eq. (2). This figure demonstrates that the detectabilityof H i absorbing gas at a given density drops sharply with temperat-ure. For example, the detection of gas with log(nH/cm−3) = −4.75(which corresponds to ∆ ∼ 50 at z = 0.25) and log (T/K) ∼ 6 re-quires a minimum sensitivity which is two orders of magnitudehigher than the one required to detect gas with the same densityand log (T/K) ∼ 5. The reason behind the strong dependence oflog (NH I/bH I) on temperature is that, at a given density, τ0 is com-pletely dominated by the neutral fraction, fH I.
APPENDIX C: CONVERGENCE WITH RESPECT TOTHE PHYSICAL MODEL
In this section, we demonstrate that the predicted H i observablesare robust with respect to variations of the adopted physical model.
Fig. C1 shows the H i column-density distribution (CDDF) fordifferent models run in a box L = 100h−1 Mpc per side at z = 0.25,using 5000 random sightlines. Dashed lines show the distributionof column densities for individual absorption components obtainedfrom fitting the synthetic spectra adopting S/N=50, as describedin Sec. 3; solid lines show the distribution of the integrated H icolumn density along each sightline. The latter are important inorder to remove the uncertainty introduced in the CDDF by ourfitting algorithm. We include various data sets in this figure forreference, but note that our adopted S/N value is higher than theS/N of the data. The distribution of column densities for individualabsorption components extends over a range of much lower valuessince a spectrum (corresponding to a single physical sightline) isgenerally fitted with more than one component. Also, as mentionedin Sec. 3, our version of autovp tends to fit (highly) saturated lineswith more than one component, thus generally yielding lower NH I
values for each individual component with respect to the NH I valueobtained by integrating over the corresponding absorption feature.
Fig. C2 shows the distribution of Doppler parameters ofindividual components identified in 5000 spectra at z = 0.25
0.0
0.5
1.0
1.5
2.0
2.5
3.0
3.5
4.0
4.5
0 20 40 60 80 100
PD
F [1
0−2 ]
bHI [km s−1]
NOSN_NOZCOOLNOZCOOL
REFAGN
Figure C2. Distribution of Doppler parameters of individual componentsidentified in 5000 spectra at z = 0.25 with S/N=50 adopting different phys-ical models in a L = 100h−1 Mpc box. The dashed vertical line indicates theminimum Doppler parameter during the fitting process (see Sec. 3). Notethat feedback (both by SNe and AGN) leads to a slightly larger number ofbroad lines, although the effect is small.
with S/N=50 adopting different physical models run in a boxL = 100h−1 Mpc per side. Note that feedback (both by SNe andAGN) leads to a slightly larger number of broad lines, although theeffect is not large.
Finally, Fig. C3 shows the corresponding bH I−NH I distributionof individual components. The bH I − NH I distribution for eachmodel has been obtained as described in Sec. 3.4. For each model,the corresponding median values at each bin are connected bycontinuous lines. For simplicity, only the result for model AGNdisplays x- and y-error bars indicating, respectively, the bin sizeand 25-/75-percentiles; but note that the bin-size is identical andthe scatter similar for all other models. Although the models differslightly from each other, the various bH I − NH I distributions arefully consistent with each other.
Clearly, feedback by supernovae and AGN does not signific-antly affect the observed properties (H i column density distribution,Doppler parameter distribution, bH I − H i correlation) of the gaseousstructures giving rise to H i absorption. This result is consistentwith previous results by Theuns et al. (2002) who, however, did notconsider AGN feedback or metal-line cooling.
APPENDIX D: NUMERICAL CONVERGENCE
In this section, we address the convergence of our results with re-spect to varying the box size and the mass and spatial resolution. Tothis end, we compare the H i CDDF and Doppler parameter distribu-tion of individual components identified in 5000 spectra obtainedfrom simulation runs with different box sizes and resolutions, whichall adopt the model REF at z = 0.25. Note that the use of this par-ticular model does not affect our results, since we have shown inAppendix C that both the H i CDDF and the distribution of Dopplerparameters are insensitive to the adopted model. In the following,the simulation runs we use are denoted by LxxxNyyy, where xxxcorresponds to the linear size of the cubic box in h−1 Mpc, and yyyto the number of (dark matter, baryonic) particles per side.
To investigate the convergence with the box size, we usethe simulation runs L025N128, L050N256, and L100N512, which
Figure C3. bH I − NH I distribution of individual components identified in5000 spectra at z = 0.25 with S/N=50 adopting different physical modelsin a box L = 100h−1 Mpc per side. For clarity, errors bars (corresponding tothe bin size along the x-axis and to the 25-/75-percentiles along the y-axis)are shown only for the AGN result. We note that the scatter for the othermodels is similar.
all have the same mass- and spatial resolution. The convergencewith resolution is investigated using simulations run in a boxL = 50h−1 Mpc per side, and varying the (dark matter, baryonic)particle number; more specifically, we use the runs L050N128,L050N256, and L050N512, whose mass (spatial) resolution variesin factors of 8 (2). The choice of this particular box size is arbitrarybut justified, since our results are converged with respect to the boxsize, as we will show next.
Fig. D1 shows the H i CDDF and the distribution of Dopplerparameters using 5000 sightlines obtained from simulation runswith different box size but fixed mass- and spatial resolution. Thetop panel shows the distribution obtained from the H i columndensity integrated along each individual sightline; the middle panelshows the distribution obtained from the H i column density of eachcomponent identified in the corresponding spectra with S/N=50.The H i CDDF of integrated column densities is fully convergedfor column densities NH I < 1017cm−2. At higher column densities,we do not expect a good convergence, since these column densitiescorrespond to the optically thick regime, while our calculationsassume optically thin gas. The H i CDDF of individual componentsis fully converged at column densities NH I < 1015cm−2, which is therelevant column density range for this study. The difference betweenthe various H i CDDFs of individual components in the rangeNH I > 1015cm−2 is due to the inability of our fitting algorithm toaccurately determine the column density of saturated H i absorptionfeatures. Finally, the bottom panel demonstrates that the Dopplerparameter distribution in the range 10 km s−1 6 bH I 6 100 km s−1 isfully converged with respect to the box size.
Fig. D2 shows the H i CDDF and the distribution of Dopplerparameters using 5000 sightlines obtained from simulations run in abox L = 50h−1 Mpc per side with different mass and spatial resolu-tion. Both the distribution of H i column densities integrated alongeach sightline (top panel) and the distribution of H i column densit-ies of individual components identified in the corresponding spectra(middle panel) appear to be fully converged with respect to resolu-tion at column densities NH I < 1015cm−2. At higher column densit-ies, neither distribution is fully converged, although the differencebetween the two highest resolution runs, L050N256 and L050N512,
−22
−20
−18
−16
−14
−12
12 13 14 15 16 17 18 19 20 21
f(N
HI)
log (NHI/cm−2)
REF_L025N128REF_L050N256REF_L100N512
−20
−18
−16
−14
−12
−10
11 12 13 14 15 16
f(N
HI)
log (NHI/cm−2)
REF_L025N128REF_L050N256REF_L100N512
0.0
0.5
1.0
1.5
2.0
2.5
3.0
3.5
4.0
4.5
0 20 40 60 80 100
PD
F [1
0−2 ]
bHI [km s−1]
REF_L025N128REF_L050N256REF_L100N512
Figure D1. Numerical convergence with respect to the box size at afixed mass and spatial resolution using 5000 sightlines and correspond-ing spectra obtained from a simulation which adopts the model REF in aL = 100h−1 Mpc box per side at z = 0.25. Top: H i CDDF obtained from theH i column density integrated along each sightline. Middle: H i CDDF ofthe H i absorbing components identified in the corresponding spectra withS/N=50. Note the difference in the plotted range between the top and middlepanels. Bottom: Distribution of Doppler parameters. The dashed vertical lineindicates the minimum Doppler parameter allowed during the fitting process(see Appendix A).
is very small for the integrated column densities. In the case of theH i CDDFs for individual components at NH I > 1015cm−2, this isagain in part due to the difficulty in determining the true columndensity of saturated H i absorption features.
The Doppler parameter distribution shown in the bottom panelof Fig. D2 indicates that the resolution of the L050N128 run is nothigh enough. The distribution in the L050N256 run, which has thesame resolution as our fiducial run, does not show full convergenceat Doppler parameters in the BLA regime (bH I > 40 km s−1)with respect the higher resolution run, L050N512, although thedifference is small (see also Theuns et al. 1998).
In summary, our results are robust with respect to varying thesize of the simulation box, and our adopted resolution is high enoughto guarantee the convergence of our results in the range of columndensities relevant for this study. However, the distribution of Dopplerparameters is slightly sensitive to the adopted resolution in the rangeof interest for BLAs, i.e. for Doppler parameters bH I > 40 km s−1.Thus, some caution is advised when interpreting results based on ormaking predictions for this observable.
−22
−20
−18
−16
−14
−12
12 13 14 15 16 17 18 19 20 21
log
f(N
HI)
log (NHI/cm−2)
REF_L050N128REF_L050N256REF_L050N512
−20
−18
−16
−14
−12
−10
11 12 13 14 15 16
log
f(N
HI)
log (NHI/cm−2)
REF_L050N128REF_L050N256REF_L050N512
0.0
1.0
2.0
3.0
4.0
5.0
0 20 40 60 80 100
PD
F [1
0−2 ]
bHI [km s−1]
REF_L050N512REF_L050N256REF_L050N128
Figure D2. Same as Fig. D1 for the numerical convergence with respect tothe mass and spatial resolution at a fixed box size.