1 Nitrate Behavior in Ground Waters of the Southeastern United States Bernard T. Nolan* ABSTRACT Principal components analysis (PCA) was performed with water-quality data from studies conducted during 1993-1995 to explore potential nitrate-attenuation processes in ground waters of the southeastern United States. Nitrate reduction is an important attenuation process in selected areas of the Southeast. A "nitrate-reduction" component explains 23% of the total variance in the data and indicates that nitrate and dissolved oxygen are inversely related to ammonium, iron, manganese, and dissolved organic carbon. Additional components extracted by PCA include "calcite dissolution" (18% of variance explained) and "phosphate dissolution" (9% of variance explained). Reducing conditions in ground waters of the region influence nitrate behavior through bacterially mediated reduction in the presence of organic matter, and by inhibition of nitrate formation in anoxic ground water beneath forested areas. Component scores are consistent with observed water-quality conditions in the region. For example, median nitrate concentration in ground-water samples from the ALBE Coastal Plain is <0.05 mg/L, median dissolved organic carbon concentration is 4.2 mg/L, and median dissolved oxygen (DO) concentration is 2.1 mg/L, consistent with denitrification. Nitrate reduction does not occur uniformly throughout the Southeast. Median DO concentrations in ground- water samples from the Apalachicola-Chattahoochee-Flint River Basin are 6.2-7.1 mg/L, and median nitrate concentrations are 0.61-2.2 mg/L, inconsistent with denitrification. Similarly, median DO concentration in samples from the Georgia-Florida Coastal Plain is 6.0 mg/L and median nitrate concentration is 5.8 mg/L. U.S. Geological Survey, 413 National Center, Reston, VA 20192. *[email protected]BACKGROUND Ground water is an important national resource, providing drinking water for more than one-half of the people in the United States (Solley and others, 1993). Additionally, ground water accounted for 39 percent of water withdrawn to supply cities and towns and 96 percent of water withdrawn by private users in 1990. Ground water is vulnerable to contamination by chemicals, including nitrate, that can pass through soil to the water table. Nitrate comes from nitrogen supplied primarily by inorganic fertilizer and animal manure. Additionally, airborne nitrogen compounds emitted by industry and automobiles are deposited on the land in precipitation, gases, and dry particles (Puckett, 1994). Nitrate is soluble in water, can easily leach through soil, and can persist in shallow ground water for decades. Ingestion of nitrate in drinking water by infants can cause low oxygen levels in the blood, a potentially fatal condition (Spalding and Exner, 1993). For this reason, the U.S. Environmental Protection Agency (USEPA) has established a maximum contaminant level (MCL) of 10 milligrams per liter (mg/L) nitrate as nitrogen (U.S. Environmental Protection Agency, 1995). Natural ground water typically contains less than 2 mg/L of nitrate (Mueller and Helsel, 1996).
Transcript
1
Nitrate Behavior in Ground Waters of the Southeastern United States
Bernard T. Nolan*
ABSTRACT
Principal components analysis (PCA) was performed with water-quality data from studies conducted during 1993-1995 to explore potential nitrate-attenuation processes in ground waters of the southeastern United States. Nitrate reduction is an important attenuation process in selected areas of the Southeast. A "nitrate-reduction" component explains 23% of the total variance in the data and indicates that nitrate and dissolved oxygen are inversely related to ammonium, iron, manganese, and dissolved organic carbon. Additional components extracted by PCA include "calcite dissolution" (18% of variance explained) and "phosphate dissolution" (9% of variance explained). Reducing conditions in ground waters of the region influence nitrate behavior through bacterially mediated reduction in the presence of organic matter, and by inhibition of nitrate formation in anoxic ground water beneath forested areas. Component scores are consistent with observed water-quality conditions in the region. For example, median nitrate concentration in ground-water samples from the ALBE Coastal Plain is <0.05 mg/L, median dissolved organic carbon concentration is 4.2 mg/L, and median dissolved oxygen (DO) concentration is 2.1 mg/L, consistent with denitrification. Nitrate reduction does not occur uniformly throughout the Southeast. Median DO concentrations in ground-water samples from the Apalachicola-Chattahoochee-Flint River Basin are 6.2-7.1 mg/L, and median nitrate concentrations are 0.61-2.2 mg/L, inconsistent with denitrification. Similarly, median DO concentration in samples from the Georgia-Florida Coastal Plain is 6.0 mg/L and median nitrate concentration is 5.8 mg/L. U.S. Geological Survey, 413 National Center, Reston, VA 20192. *[email protected]
BACKGROUND Ground water is an important national resource, providing drinking water for more than
one-half of the people in the United States (Solley and others, 1993). Additionally, ground water accounted for 39 percent of water withdrawn to supply cities and towns and 96 percent of water withdrawn by private users in 1990.
Ground water is vulnerable to contamination by chemicals, including nitrate, that can pass through soil to the water table. Nitrate comes from nitrogen supplied primarily by inorganic fertilizer and animal manure. Additionally, airborne nitrogen compounds emitted by industry and automobiles are deposited on the land in precipitation, gases, and dry particles (Puckett, 1994). Nitrate is soluble in water, can easily leach through soil, and can persist in shallow ground water for decades.
Ingestion of nitrate in drinking water by infants can cause low oxygen levels in the blood, a potentially fatal condition (Spalding and Exner, 1993). For this reason, the U.S. Environmental Protection Agency (USEPA) has established a maximum contaminant level (MCL) of 10 milligrams per liter (mg/L) nitrate as nitrogen (U.S. Environmental Protection Agency, 1995). Natural ground water typically contains less than 2 mg/L of nitrate (Mueller and Helsel, 1996).
2
Additional adverse health effects have been implicated in recent studies of ground water contaminated by nitrate. A case study in Indiana indicated that nitrate concentrations of 19-29 mg/L in rural, domestic wells might have caused eight spontaneous abortions among four women during 1991-1994 (Centers for Disease Control and Prevention, 1996). Nitrate concentrations of 4 mg/L or more in water from community wells in Nebraska have been associated with increased risk of non-Hodgkin's lymphoma (Ward and others, 1996).
Patterns of nitrate contamination of ground water vary considerably in the United States. A national map describing the risk of nitrate contamination of shallow ground water was compiled by Nolan and others (1997). (See http://wwwrvares.er.usgs.gov/nawqa/wcp/index.html for an online version of the map.) The national map shows four levels of contamination risk to shallow ground water, based on nitrogen input and aquifer vulnerability: (1) low nitrogen input and low aquifer vulnerability (low risk); (2) low nitrogen input and high aquifer vulnerability (moderately low); (3) high nitrogen input and low aquifer vulnerability (moderately high); and (4) high nitrogen input and high aquifer vulnerability (high). “Nitrogen input” refers to nitrogen deposited on the land surface, and “aquifer vulnerability” indicates the likelihood that nitrate from a nitrogen source at the land surface will migrate into shallow aquifers. High-risk areas generally have high nitrogen input, well-drained soils, and less extensive woodland relative to cropland. The national risk map was calibrated to historical data collected during 1969-1992 and compiled by Mueller and others (1995). The map shows that the Midwest and parts of the western and northeastern U.S. have a high risk of ground-water contamination by nitrate. In contrast, contamination risk mainly is low to moderate in the southeastern U.S.
Nolan and others (1998) statistically verified the national risk map with nitrate data from more than 1,400 wells sampled during 1993-1995 as part of the U.S. Geological Survey's National Water-Quality Assessment (NAWQA) Program. Based on this independent data set, median nitrate concentration was 4.3 mg/L in wells representing the high-risk group, and the USEPA's MCL of 10 mg/L was exceeded 24% of the time (see bar chart on http://wwwrvares.er.usgs.gov/nawqa/wcp/index.html). In contrast, median nitrate concentration was 0.34 mg/L in wells representing the low-risk group, and the MCL was exceeded only 5% of the time. The analysis focused on shallow ground water (less than 30 meters deep), which is closest to the land surface and to potential sources of contamination. Nitrate contamination of ground-water greater than about 60 meters deep is unlikely, even in high-risk areas (Nolan and others, 1998).
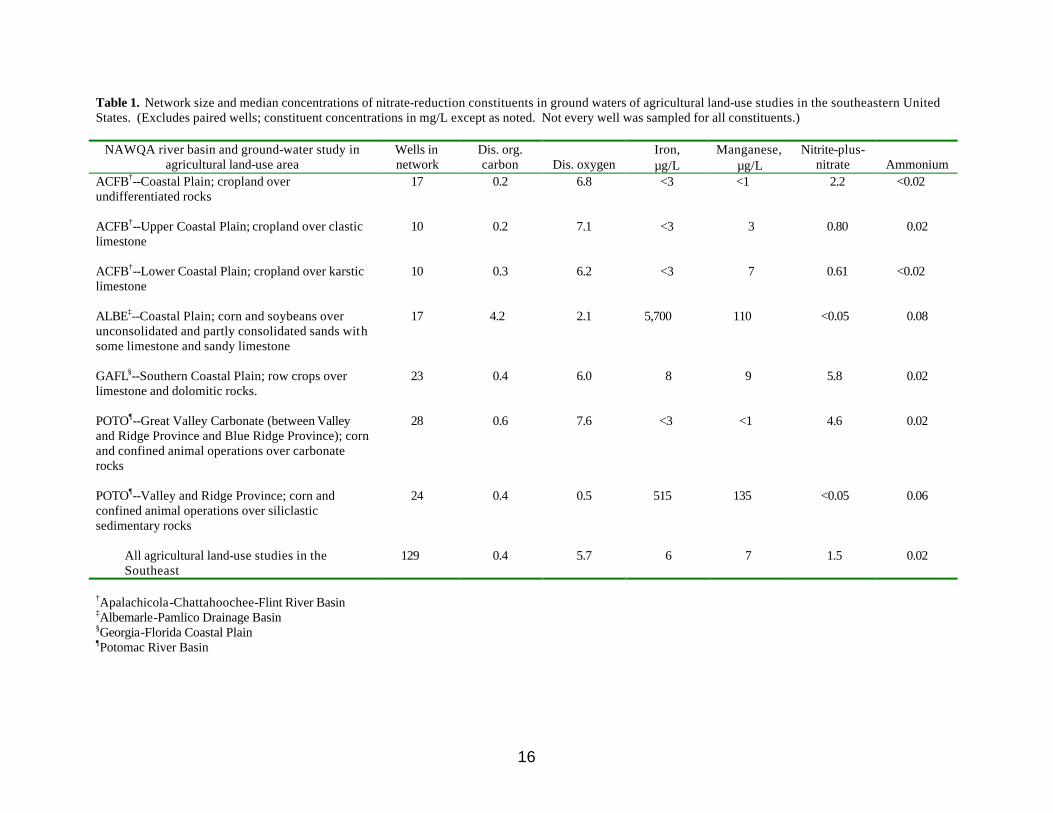
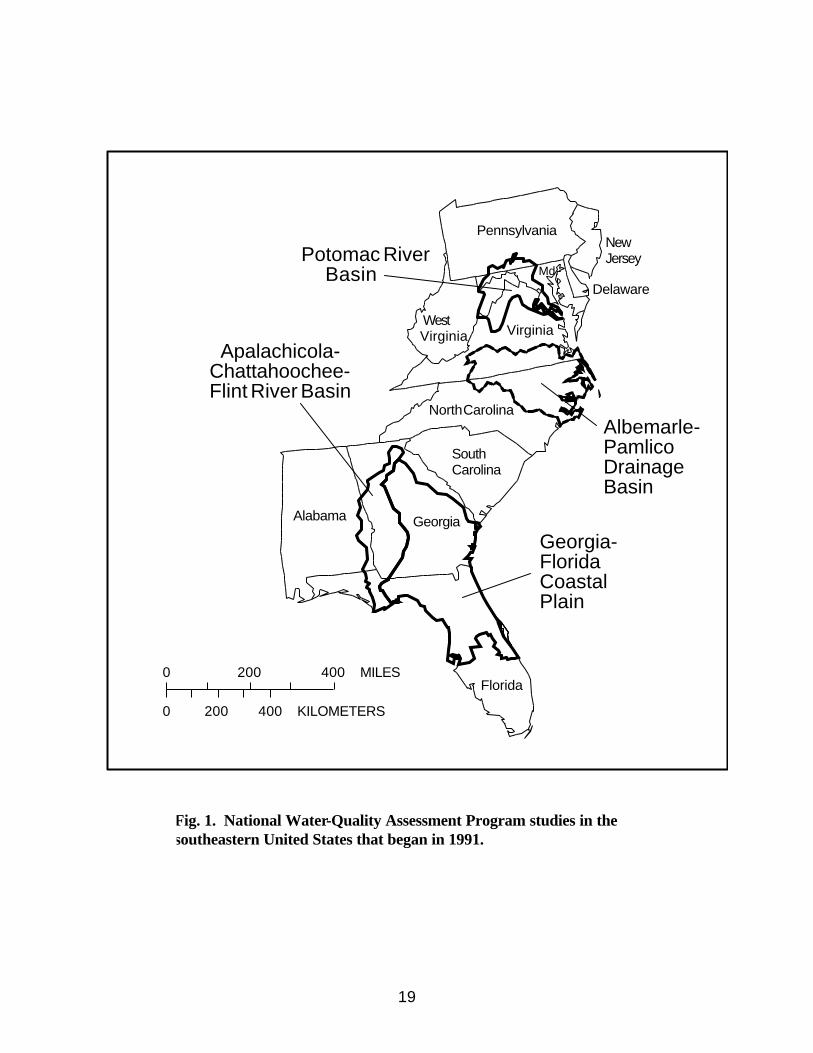
Contamination risk (low to moderate) and ground-water nitrate concentration are lower than expected in the southeastern U.S., given the high nitrogen input in the region and, in some cases, well-drained soils. The NAWQA data indicate that the median concentration of nitrate in ground-water samples from agricultural study areas in the region is 1.5 mg/L, below the background level of 2 mg/L (Table 1). NAWQA studies that started in the southeastern U.S. in 1991 were the Apalachicola-Chattahoochee-Flint River Basin (ACFB), the Albemarle-Pamlico Drainage Basin (ALBE), the Georgia-Florida Coastal Plain (GAFL), and the Potomac River Basin (POTO) (Fig. 1). Median nitrate concentration in ground water is less than the background level of 2.0 mg/L in four out of seven ground-water studies in agricultural areas of these river basins, and data from a fifth ground-water study indicates only slightly elevated nitrate (2.2 mg/L) (Table 1). The comparatively low nitrate concentration in agricultural areas of the region suggests attenuation by natural processes.
3
A national map compiled by Kellogg and others (1992) shows high potential for ground-water contamination by nitrogen fertilizer in the southeastern U.S. Their result is based on soil-leaching potential, precipitation, and chemical use, but does not consider the potential for nitrate attenuation by natural processes. Nolan and others (1997, 1998) used the extent of cropland versus woodland in agricultural areas to represent a combination of nitrate-attenuation processes, including denitrification, dilution, and plant uptake. Precipitation seeping through forest soils to ground water contains less nitrogen than seepage beneath an agricultural field, and Lowrance (1992) discussed denitrification and plant uptake beneath forests bordering streams near cropland on the Coastal Plain of Georgia.
The goal of the current paper is to explore mechanisms by which nitrate concentration in ground-waters of the southeastern Unites States potentially is attenuated. Ground-water geochemistry, rather than land-use, is emphasized in this paper. Although previous studies (Nolan and others, 1997) have attempted to relate land use to ground-water quality, land use is difficult to quantify at the regional and national scales. Alternatively, analysis of ground-water geochemistry can yield chemical signatures related to contamination and attenuation patterns. Multivariate methods, which can simultaneously analyze several explanatory variables, are emphasized in this study to accommodate the large number of water-quality variables. In particular, principal components analysis (PCA) can reduce a complex data set with dozens of variables to a few meaningful, composite variables. PCA also can identify which samples (and, hence, which river basins) are influenced by a given process. Multivariate analysis of ground-water geochemistry is possible at the regional scale because of the extensive suite of water-quality parameters analyzed in the NAWQA Program. The objectives of the study are
• to identify potential nitrate-attenuation processes in shallow ground waters of the southeastern United States; and
• to identify any secondary processes influencing ground-water quality in the region.
METHODS The National Water-Quality Assessment (NAWQA) is the first program to analyze
ground-water quality at the national scale using consistent methods with respect to analytical techniques and sensitivity, well type, sampling depth, and targeted land use. NAWQA generally conducts three types of ground-water studies: (1) "land-use studies," which sample shallow ground water beneath a targeted land use (such as agricultural or urban land); (2) "major aquifer surveys," which sample deeper ground water irrespective of overlying land use; and (3) "flowpath studies" that investigate ground water-surface water interactions by sampling ground water along an individual flow path that terminates in a stream. Results of each type of study are aggregated to yield assessments of ground-water quality at large spatial scales. This paper focuses on agricultural land-use studies conducted in the southeastern U.S.
The NAWQA Program is designed to enhance understanding of natural and human factors that affect water quality. NAWQA ground-water land-use studies evaluate the quality of recently recharged ground water (generally less than 10-years old) for regionally extensive combinations of land use and hydrogeologic conditions (Gilliom and others, 1995). The land-use studies (referred to as "study areas" in the remainder of this paper) represent the intersection of a targeted land use and an aquifer of interest. Ground water within a land-use study might or might not be used for drinking.
4
All wells in this study were sampled according to NAWQA protocols and procedures (Koterba and others, 1995). NAWQA uses consistent guidelines to select existing wells or locations for installation of new monitoring wells. Adherence to well-design and construction criteria ensures that the water-quality sample represents the targeted aquifer (Lapham and others, 1995; Lapham and others, 1997). Well locations are randomly selected within land-use and major-aquifer study areas to facilitate statistical analysis of ground-water quality.
The data set used in this investigation consists of values of nutrients, major ions, and field-measured water properties (Table 2) in ground-water samples from studies conducted during 1993-1995 in agricultural areas of the ACFB, ALBE, GAFL, and POTO river basins. Nutrients and ions were analyzed by the National Water Quality Laboratory using procedures described in Fishman (1993) and in Patton and Truitt (1992). Wells without a nitrate sample were not used in the investigation. Additionally, spatially co-located networks were excluded from the data set to minimize sampling bias (in some instances monitoring wells are installed next to domestic wells for comparison purposes). Springs and agricultural drains also were excluded because of uncertainties in the source of water and contributing land-use area. The final data set comprises 129 wells in seven study areas (Table 1). However, cases with missing data are deleted in principal components analysis, which used data primarily from the ACFB, ALBE, and POTO river basins. Several GAFL samples lacked the full suite of water-quality data required by principal components analysis (PCA).
Medians were used to measure the central tendency of nutrient and ion concentrations and water properties. The median is resistant to outliers, which commonly cause water-quality data to be highly skewed (Helsel and Hirsch, 1992). Only one observation per well was used to preclude undue influence by wells having several samples. Censored values were converted to one-half the detection limit before computing medians. Variation in water quality with sampling depth was explored using a locally weighted, scatterplot smoothing (LOWESS) method (Helsel and Hirsch, 1992). The smooth line is useful in exploring the relation between two variables in a scatterplot.
Principal components analysis, a multivariate statistical method, was used to identify processes affecting nitrate concentration in ground water. Multivariate methods typically analyze three or more variables and, compared with univariate analysis, explain more variation in a data set. PCA reduces a large data set to a few independent, composite variables (principal components) that explain much of the variance of the original data (Puckett and Bricker, 1992). Extracted components are linear combinations of the original variables (Helsel and Hirsch, 1992). Component loadings show the degree of correlation between the original variables and each principal component. The greater the loading (regardless of sign), the greater the correlation. Variables that are highly correlated with a principal component are considered to represent a particular process influencing the data. Interpreting principal components, however, is a subjective process.
Component scores show the influence of a principal component on individual samples. Information on which samples are influenced by a given process can be obtained by plotting the scores in relation to x- and y-axes representing extracted components. The composite variables and associated scores yield insight into the data that could not be easily obtained by analyzing one explanatory variable at a time.
5
Principal components analysis was performed using sample correlations as input to account for different measurement units associated with the original variables. Because Pearson's r standardizes a variable by dividing the difference from the mean by the sample standard deviation, it is dimensionless and invariant to scale changes (Helsel and Hirsch, 1992). Variables were rank-transformed before computing correlations because the statistical distributions of the water-quality variables are highly skewed. Pearson's r, which measures linear relations, is not resistant to outliers because it is based on non-resistant measuresthe mean and variance. In contrast, rank-based procedures are well-suited for variables that exhibit skewness. Additionally, rank-based procedures can accommodate censored values (Helsel and Hirsch, 1992).
Principal component axes were rotated to make high component loadings higher and low component loadings lower, enhancing interpretation of the data. Oblique rotation was performed using the Direct Oblimin method, to maximize the strength of component loadings and to minimize the number of factors associated with each variable. With oblique rotation, each principal component axis may be rotated independently, and the axes might not be perpendicular after rotation. Compared with orthogonal rotation such as Varimax rotation (axes remain perpendicular after rotation), oblique rotation usually yields components that are correlated. The main objective of this investigation, however, was to uncover factors that are meaningful representations of water-quality processes. Compared with orthogonal rotation, it is often possible to derive more interpretable factors using oblique rotation (Kleinbaum and others, 1988).
Confidence ellipses (50% significance level) are shown for each river basin on scatterplots of factor scores to emphasize patterns in the data. The confidence ellipse is a Gaussian bivariate confidence interval centered on the means of the x and y variables in the scatterplot (Statistical Products and Service Solutions Inc., 1996). The smaller the significance level, the larger the ellipse, and the greater the chance that the ellipse contains the true means of the x and y variables. The sample standard deviations of x and y determine the major and minor axes of the ellipse, and the sample covariance between x and y determines the ellipse's directional orientation. Conceptually, the confidence ellipse may be likened to a univariate confidence interval. The 50% value was used with this data set because smaller significance levels (e.g., 5%) resulted in confidence ellipses that extended beyond the axes of the plot. The main purpose of the confidence ellipse is to show the central tendency and directional orientation of the factor scores in the scatterplots.
RESULTS AND DISCUSSION
Component loadings
Principal components analysis (PCA) was used to reduce two dozen variables in the
original data set to a few meaningful, composite variables that represent water-quality processes in agricultural areas of the southeastern U.S. After oblique rotation, the first three principal components explain 50% of the variance in the data (Table 2). The percent variance explained by factors extracted after the third component decreases and such factors are difficult to interpret. As the percent variance explained by successive components decreases, the
6
information content of the component is attributable more to noise in the data set than to a water-quality process. Variables with the highest loadings for a given principal component are shown in bold type in Table 2.
Biologically mediated transformation of nitrate, iron, and manganese
Component 1, designated "nitrate reduction," indicates that dissolved oxygen (DO) and
nitrite-plus-nitrate (NO2- plus NO3
-, referred to as "nitrate" in this study) are inversely related to iron (Fe), manganese (Mn), ammonium (NH4
+), and dissolved organic carbon (DOC) (Table 2). (Although ammonium concentration is reported as ammonia (NH3) by the USGS's National Water Quality Laboratory, it will be referred to as "ammonium" in this study. Ammonia in natural ground water typically exists as ammonium ion.) Additionally, pairwise correlations indicate that nitrate is positively correlated with dissolved oxygen (0.69) and negatively correlated with iron (-0.69), manganese (-0.60), ammonium (-0.45), and dissolved organic carbon (-0.16). The inverse relation of DO and nitrate to ammonium, iron, and manganese indicates an anaerobic, reducing environment in selected areas of the southeastern U.S. Ground water that contains significant amounts of soluble iron (Fe2+) and/or manganese (Mn2+) commonly lacks dissolved oxygen and has high carbon-dioxide content (Sawyer and McCarty, 1978). Accumulation of dissolved inorganic carbon in ground water indicates bacterial oxidation of organic matter or carbonate mineral dissolution. Ground water with a pH of 6-8 and that is sufficiently reducing can contain up to 50 mg/L of ferrous iron at equilibrium (Hem, 1989).
Processes that transform nitrogen in ground water include mineralization, hydrolysis, and bacterially mediated reactions. Organic forms of nitrogen, such as urea, are mineralized to ammonia under both aerobic and anaerobic conditions when organic matter decomposes (Speiran, 1996). The reaction for mineralization of urea to ammonia is (Speiran, 1996)
NH2CONH2 + H2O = 2NH3 + CO2 . (1)
Hydrolysis of ammonia in water yields ammonium hydroxide, most of which is ionized to ammonium and hydroxyl (OH-) ions. The hydroxyl commonly is converted to bicarbonate in natural waters, and the net reaction is (Speiran, 1996)
NH3 + H2O + CO2 = NH4
+ + HCO3- . (2)
Under aerobic conditions, ammonium is converted by bacteria to nitrate in a two-step process known as nitrification (Speiran, 1996):
2NH4
+ + 3O2 = 2NO2- + 2H2O + 4H+ , and (3)
2NO2
- + O2 = 2NO3- . (4)
The inverse relation of nitrate to DOC, the direct relation between nitrate and DO, and the
inverse relation between DO and dissolved iron and manganese (Table 2) suggest bacterially mediated reduction processes. Nitrate, manganese oxides (Mn4+ as MnO2), and iron oxides
7
(Fe3+ as FeOOH) all can function as electron acceptors in microbially mediated transformations occurring under anaerobic conditions (Korom, 1992). The transformations involve reduction of the electron acceptor and require energy from a source such as organic carbon (an electron donor). Higher organic carbon concentrations support more heterotrophs (Tiedje and others, 1982), which use the organic carbon as an energy source to obtain cellular carbon (Korom, 1992). The sequence of the transformations is controlled by the oxidation-reduction (redox) potential of the ground-water environment (Korom, 1992; Stumm and Morgan, 1981). Denitrification occurs after reduction of oxygen, followed by manganese-oxide reduction, other forms of nitrate reduction, iron-oxide reduction, and other transformations as conditions become more reducing and electron activity increases. The progression of transformations generally corresponds to increasing depth below the water table (Korom, 1992). Denitrification may be represented by (John K. Böhlke, U.S. Geological Survey, unpublished data, 1998)
4NO3
- + 5CH2O = 2N2 + 5HCO3- + H+ + 2H2O , (5)
where CH2O indicates organic matter that is oxidized in the bacterially mediated reaction. After denitrification, manganese oxides and iron oxides are transformed to soluble manganese and iron, respectively, as conditions in ground water become more reducing.
Median nitrate, dissolved iron, and dissolved manganese concentrations in ground-water samples from the ALBE Coastal Plain and POTO Valley and Ridge indicate reducing conditions (Table 1). In particular, the relations between nitrate (electron acceptor) and dissolved iron (final product of iron-oxide reduction) in the ALBE fit a geochemical framework described by Chapelle and others (1995). The framework uses patterns of electron-acceptor consumption, final-product accumulation, and hydrogen (H2) concentration to identify terminal electron accepting processes. Because hydrogen data were not available in the current study, however, only patterns of electron-acceptor consumption and final-product accumulation are discussed here.
High dissolved iron concentration in selected study areas suggests accumulation of final product from biologically mediated reduction of iron oxide. For example, ground-water samples from the ALBE Coastal Plain study have a median nitrate concentration of <0.05 mg/L, and the median dissolved iron concentration of 5,700 µg/L is the highest of any of the study areas (Table 1). According to the geochemical framework, a ground-water nitrate concentration of <0.5 mg/L and accumulation of dissolved iron indicate that both nitrate reduction (i.e., denitrification) and Fe3+ reduction have progressed to completion (Chapelle and others, 1995). Iron-oxide reduction occurs after nitrate reduction as conditions become more reducing. Presence of dissolved iron indicates that an Fe2+ sink is absent. Low dissolved iron concentration would not have ruled out iron-oxide reduction, because iron can be removed from solution by formation of siderite (FeCO3) and pyrite (FeS2). Iron-oxide reduction may be represented by (John K. Böhlke, U.S. Geological Survey, unpublished data, 1998)
4FeOOH(s) + CH2O + 7H+ = 4Fe++ + HCO3
- + 6H2O , (6)
where CH2O represents organic matter oxidized in the reaction. Denitrification potential can vary within an aquifer, and the median concentrations of
nitrate-reduction constituents in Table 1 reflect "typical" water-quality conditions. The median
8
DO concentration of 2.1 mg/L in ALBE ground water is somewhat high for denitrification, but the minimum DO concentration in the ALBE is 0.2 mg/L, indicating high denitrification potential in portions of the aquifer. All of the aquifers summarized in Table 1 are "surficial," but DO and chemical characteristics can vary significantly with depth within a given aquifer.
Although not considered by the geochemical framework of Chapelle and others (1995), high dissolved manganese concentration suggests that manganese oxides also have been reduced. Ground-water samples from the ALBE Coastal Plain study have a median dissolved manganese concentration of 110 µg/L (Table 1). Manganese-oxide reduction in the presence of organic matter may be represented by (John K. Böhlke, U.S. Geological Survey, unpublished data, 1998)
2MnO2(s) + CH2O + 3H+ = 2Mn++ + HCO3
- + 2H2O . (7) High median ammonium concentration (0.06 mg/L) in ground-water samples from the
POTO Valley and Ridge suggests mineralization and hydrolysis of nitrogen (equations 1 and 2) without subsequent nitrification (equations 3 and 4). Median nitrate concentration of ground water in the area is <0.05 mg/L, and the median dissolved oxygen concentration of 0.5 mg/L is the lowest of any of the southeastern study areas (Table 1). The Valley and Ridge is 80% forested, and ground-water ammonia concentration there is higher in forested areas than in agricultural and urban areas (Ator and Denis, 1997). Large amounts of leaves and other natural debris compose a significant source of organic nitrogen in forested areas. Ammonia is formed naturally in forest soils by transformation of nitrogen in the organic materials. Ammonia concentration in ground water is significantly correlated (Spearman rho equals 0.48) with the percent of forest land upgradient from wells sampled in the Valley and Ridge, and is negatively correlated with percent agricultural land (-0.47) and urban land (-0.36). Dissolved oxygen in ground water is negatively correlated (-0.62) with percent of forest land, indicating reducing conditions in the forested areas.
Dissimilatory nitrate reduction (DNR)another bacterially mediated nitrate-reduction processalso can produce ammonium in ground water. DNR in aquifers is poorly documented, however. Most of the nitrate reduction in soils and lake sediments probably results from denitrification rather than DNR (Tiedje and others, 1982). DNR occurs in strongly anaerobic habitats (e.g., estuarine sediments) where the lack of electron acceptors limits microorganism cell growth.
Nitrate attenuation does not occur in all study areas of the southeastern U.S. Ground water samples from the ACFB Coastal Plain, GAFL Southern Coastal Plain, and POTO Great Valley Carbonate contain 2.2-5.8 mg/L of nitrate and 6.0-7.6 mg/L of dissolved oxygen (Table 1). Dissolved iron concentration in these areas is 8 µg/L or less, and the manganese concentration is 9 µg/L or less. Aerobic conditions in these areas are not conducive to biologically mediated reactions involving denitrification and reduction of iron and manganese oxides.
Moderately high loadings of bromide (0.62), sodium (0.59), and silica (0.55) on component 1 suggest that these constituents have some relation to nitrate reduction. Of these, sodium and silica are more likely associated with nitrate reduction. Silica can be produced in weathering reactions common to glauconitic sediments beneath the Atlantic Coastal Plain. Böhlke and Denver (1995) used mass-balance equations to determine reactants and products
9
associated with oxygen reduction and denitrification in ground waters of agricultural watersheds on the Delmarva Peninsula. The equations indicated that oxygen and nitrate are reduced during oxidation of organic carbon and/or ferrous iron, which is in several forms, including glauconite. Oxidation of glauconite is accompanied by release of SiO2. Additionally, fine-grain sediments in the Atlantic Coastal Plain are a potential source of sodium and silica (John K. Böhlke, U.S. Geological Survey, unpublished data, 1998). Fine-grain sediments restrict drainage and create reducing conditions commonly associated with denitrification. Finally, bromide could be derived from sea water in estuarine environments of the Outer Coastal Plain. Bromide is positively correlated with chloride (pairwise correlation equals 0.55), a common constituent of sea water, in the data set used in the current study.
Calcite dissolution
Component 2, designated "calcite dissolution," indicates positive relations between calcium,
alkalinity as CaCO3, pH, specific conductivity, and dissolved solids (DS) (Table 2). Additionally, pairwise correlations indicate that calcium is positively correlated with alkalinity (0.85), pH (0.46), specific conductivity (0.85), and DS (0.83). The high calcium loading (0.85) on component 2 suggests dissolution of calcite (CaCO3). This is consistent with the hydrogeology of the Potomac River Basin, where the Great Valley is underlain by carbonate bedrock (Ator and others, 1998). Median concentrations of calcium (87 mg/L), alkalinity (243 mg/L), specific conductivity (620 µS/cm), and dissolved solids (353 mg/L) in ground-water samples from the Great Valley Carbonate are the highest of any of the study areas shown in Table 3. Additionally, high loadings of bicarbonate alkalinity, pH, and calcium were associated with calcite dissolution in prior research involving PCA analysis of stream-water quality in the Blue Ridge and Valley and Ridge physiographic provinces of Virginia and Maryland (Puckett and Bricker, 1992).
Component 2 also could represent an agricultural signature. Ground-water samples from the Great Valley Carbonate have a median nitrate concentration of 4.6 mg/L (Table 1), more than twice the background level of 2 mg/L; and on the Eastern Shore of Virginia, agriculturally affected ground water is characterized by calcium and sulfate-plus-nitrate ions (Speiran, 1996). Liming of agricultural soils on the Delmarva Peninsula contributes calcium and magnesium to ground water (Hamilton and Shedlock, 1992). Gypsum (CaSO4•2H2O), a soil conditioner and fertilizer, contributes both calcium and sulfate. Calcium, magnesium, and sulfate are positively related to component 2 (Table 2), and median magnesium concentration (19 mg/L) in ground-water samples from the Great Valley Carbonate is the highest of any of the studies (Table 3). Pairwise correlations indicate that calcium is positively correlated with both magnesium (0.56) and sulfate (0.49). Additionally, carbonate bedrock areas beneath agricultural lands have high ground-water nitrate concentration because of solution channels that conduct chemicals to ground water (Ator and others, 1998). For these reasons, distinguishing between carbonate dissolution and an agricultural signature for POTO ground waters is difficult.
Although two potential sources of calciumcarbonate rock and lime applied to agricultural soilsmight exist in the area, the source of calcium likely is nonagricultural. Nitrate loading on component 2 is only 0.13 (Table 2), and soils in the Great Valley Carbonate area are less acidic than those on the Delmarva peninsula and do not receive substantial amounts of lime.
correlations indicate that phosphorus is positively correlated with orthophosphorus (0.64) and fluoride (0.16). The phosphorus-orthophosphorus relation is expected because orthophosphorus is a significant component of dissolved phosphorus in natural water. In the ALBE river basin, phosphorus concentration is significantly higher in deeper ground water, compared with shallow ground water (Spruill and others, 1998). The comparatively high phosphorus concentration at depth suggests a mineral source such as fluorapatite, Ca5(PO4)3F, in the aquifer sediments.
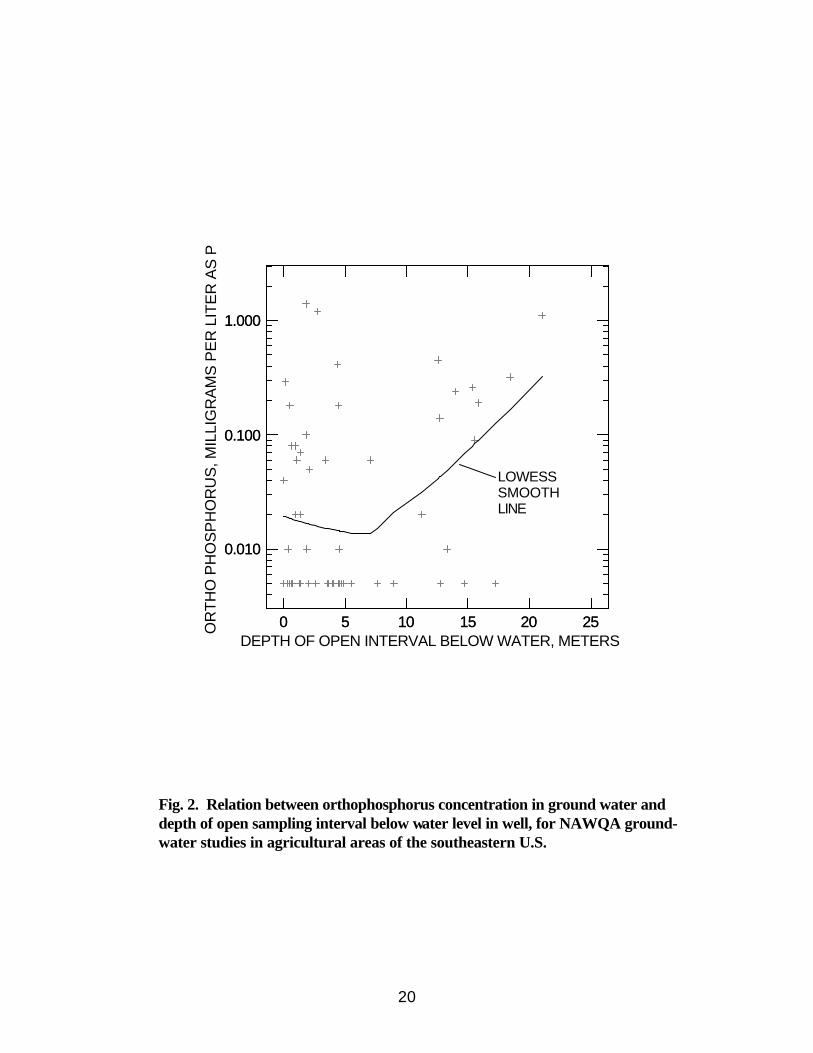
The phosphorus-depth relation was analyzed for ALBE ground-water samples by plotting dissolved orthophosphorus concentration versus the depth of the open interval below water level, or sampling depth. Sampling depth indicates the relative age of a ground-water sample. In contrast to shallow, recently recharged ground water, deeper ground water commonly is older and relatively unaffected by recent land use. Only sampling depths of less than 30 meters less were used in the analysis to preclude undue influence on a LOWESS smooth of two isolated ALBE samples from depths of 46 and 59 meters that had very high orthophosphorus concentration. The LOWESS smooth indicates that on average orthophosphorus concentration increased more than one order of magnitude with an increase in sampling depth of from about 7 to about 20 meters (Fig. 2). High phosphorus concentration in ground water of the region is derived predominantly from mineral sources at depth, rather than from fertilizer or manure applied at the land surface.
Component scores
Scores plotted along component axes indicate the influence of componentshere
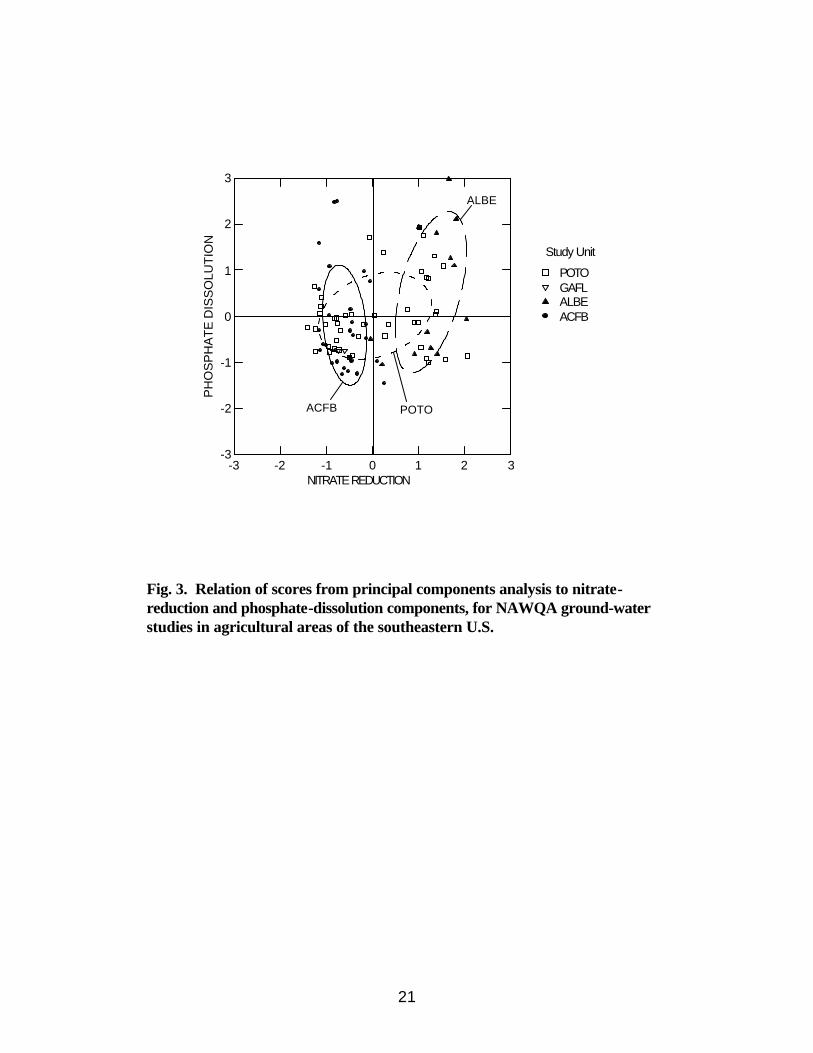
interpreted as measures of process influenceon individual ground-water samples from agricultural areas in southeastern NAWQA river basins. Whereas component loadings describe the relation between components and variables, scores describe the influence of a component on an individual sample. Confidence ellipses show patterns in the data for ACFB, ALBE, and POTO river basins. (Data used in PCA contained too few GAFL samples to construct a confidence ellipse for this river basin.) The location of the confidence ellipse relative to a principal-component axis indicates the influence of components on samples from a river basin. For example, a confidence ellipse centered in the lower-right quadrant of Fig. 3 would indicate that ground-water samples from that river basin generally are "above average" with respect to nitrate reduction and "below-average" with respect to phosphate dissolution.
Component scores are consistent with observed water-quality conditions in southeastern study areas. The ALBE confidence ellipse in Fig. 3 indicates that ground-water samples from the area are influenced by both nitrate reduction and phosphate dissolution. Water and sediment of the North Carolina-Virginia Coastal Plain contain sufficient organic carbon for bacterial reduction of nitrate to nitrogen gas and reduced nitrogen species (Spruill and others, 1998). Median nitrate concentration in ground-water samples from the ALBE Coastal Plain study is <0.05 mg/L, and the median DOC concentration is 4.2 mg/L (Table 1), consistent with denitrification. Median orthophosphorus (0.02 mg/L) in ALBE ground water is more than twice
11
the regional median of <0.01 mg/L (Table 3). Dissolved phosphorus in ground waters of the area likely comes from dissolution of phosphate minerals in deep aquifer sediments.
On average, ground-water samples from the Potomac River Basin are influenced by carbonate dissolution (Fig. 4). The Great Valley of the Potomac River Basin is underlain by carbonate rock (Ator and others, 1998). Acidic water creates and enlarges solution channels in the carbonate rocks, which form subsurface conduits for contaminants. Concentrations of nitrate, calcium, alkalinity, specific conductance, and dissolved solids in ground water samples from the POTO Great Valley Carbonate study are significantly elevated (Tables 1 and 3).
Component scores also indicate that nitrate attenuation does not occur uniformly in ground waters of the Southeast. Confidence ellipses in Figs. 3 and 4 indicate that ground-water samples in the ACFB are not greatly influenced by nitrate reduction. Median concentrations of DO in ACFB ground-water samples are 6.2-7.1 mg/L, and median nitrate concentrations are 0.61-2.2 mg/L (Table 1). The DO levels indicate aerobic conditions not conducive to denitrification.
Confidence ellipses were not calculable for GAFL scores, but individual GAFL scores indicate little influence by nitrate reduction, calcite dissolution, and phosphate dissolution (Figs. 3 and 4). The median nitrate concentration of 5.8 mg/L in ground-water samples from the GAFL Southern Coastal Plain is the highest of any of the studies, and median DO concentration is 6.0 mg/L (Table 1), indicating an aerobic environment not conducive to denitrification. Median levels of calcium (5 mg/L), dissolved solids (94 mg/L), and specific conductivity (140 µS/cm) in GAFL ground-water samples are among the lowest of any of the studies, and median fluoride and orthophosphorus concentrations are below detectable limits (Table 3).
Fig. 4 indicates that POTO scores cluster with respect to the nitrate-reduction component, and that ACFB scores cluster with respect to the calcite-dissolution component. POTO and ACFB scores are plotted by individual land-use study in Fig. 5 to discern process variation within these river basins. Fig. 5 indicates that ground-water samples from the POTO Valley and Ridge are influenced by the nitrate-reduction component. Samples from the Valley and Ridge have low median concentrations of nitrate (<0.05 mg/L) and dissolved oxygen (0.5 mg/L), moderately high dissolved iron concentration (515 µg/L), and high dissolved manganese concentration (135 µg/L). Conditions in forested areas of the Valley and Ridge might be sufficiently reducing to inhibit transformation of ammonium to nitrite and nitrate as shown in equations (3) and (4).
Fig. 5 indicates that ground-water samples from the POTO Great Valley Carbonate are not greatly influenced by the nitrate-reduction component. Carbonate rocks beneath agricultural lands in the area have high median nitrate concentration in ground-water (4.6 mg/L) because the fractured bedrock is vulnerable to contamination. Additionally, aerobic conditions in the ground water (median DO concentration equals 7.6 mg/L) are not conducive to denitrification.
ACFB clusters indicate the aquifer from which the ground-water samples were drawn. ACFB sampled tile drains in clay-rich soils, wells completed in shallow sand aquifers beneath these soils, and wells completed in flood-plain deposits near streams (Frick and others, 1998). Component scores in the upper cluster (Fig. 5) suggest influence by calcite dissolution on ground-water samples from the shallow, calcareous sand aquifer, which contains shell fragments and bedded limestone that contribute significant amounts of calcium and bicarbonate ions and dissolved solids. Calcium, alkalinity, and dissolved solids are highly loaded on component 2 (calcite-dissolution) (Table 2). In contrast, component scores in the lower cluster represent
12
ground-water samples that are not greatly influenced by calcite dissolution (Fig. 5). These samples likely are from well-oxidized, clay-rich soils above the shallow sand aquifer. The clay soils are highly weathered and have been stripped of cations. The dissolved solids concentration of tile drainage in the clay soils is low and is dominated by nitrate and other anions from agricultural chemicals applied at the land surface.
CONCLUSIONS
Reducing conditions in ground water strongly influence nitrate behavior in selected areas of
the southeastern United States. Principal components analysis (PCA) extracted three components that explain 50% of the total variation in ground-water quality data from the region: a "nitrate-reduction" component indicating that dissolved oxygen and nitrate are inversely related to ammonium, iron, manganese, and dissolved organic carbon (23% of variance explained); a "calcite-dissolution" component indicating positive relations between calcium, alkalinity, pH, specific conductivity, and dissolved solids (18%); and a "phosphate-dissolution" component indicating positive relations between phosphorus, orthophosphorus, and fluoride (9%).
Two reducing mechanisms were identified in this study. The first, represented by samples from the Albemarle-Pamlico Drainage Basin (ALBE), involves bacterially mediated reduction of nitrate in the presence of organic matter. The second mechanism, represented by samples from the Valley and Ridge Province of the Potomac River Basin (POTO), involves inhibition of nitrate formation in anoxic ground water beneath forested areas. The 41 wells in these areas comprise almost a third of the wells in the data subset representing the southeastern United States.
Component scores (which indicate the relation between individual samples and extracted factors considered to control ground-water quality) are consistent with observed water-quality conditions. Scores associated with the Albemarle-Pamlico Drainage Basin (ALBE) indicate that ground-water samples there are influenced by nitrate reduction and phosphate dissolution. The median nitrate concentration in ALBE ground-water samples is <0.05 mg/L, and the median orthophosphorus concentration (0.02 mg/L) is more than twice the regional median. Water and aquifer sediment in the area contain sufficient carbon for bacterially mediated reduction of nitrate and oxides of iron and manganese; and phosphorus in ground water is derived mainly from phosphate minerals in deep aquifer sediments. Ground-water samples from the Potomac River Basin (POTO), which is partly underlain by carbonate rock, are influenced by calcite dissolution. Ground-water samples from the POTO Great Valley Carbonate have median nitrate and calcium concentrations of 4.6 and 87 mg/L, respectively, suggesting ground-water contamination via solution channels in carbonate rock.
Principal components analysis yielded insights into a complex data set that would have been difficult to gain by univariate analysis. Clustering of component scores indicates variation in water-quality processes within river basins. POTO score clusters indicate that ground-water samples from the Valley and Ridge are influenced by the nitrate-reduction component, but that samples from the Great Valley Carbonate are not. Clustering of ACFB scores indicates the source of the ground-water samples. Scores aligned with the calcite-dissolution component suggest that these ground-water samples came from a shallow sand aquifer dominated by a calcium-carbonate water type. Samples not influenced by this process likely came from overlying clay-rich soils dominated by nitrate and other anions.
13
The extent of nitrate attenuation varies in ground waters of the Southeast. Ground-water samples from the Georgia-Florida Coastal Plain (GAFL) and Apalachicola-Chattahoochee-Flint River Basin (ACFB) are not greatly influenced by nitrate reduction. Median dissolved oxygen (DO) and nitrate concentrations in ground-water samples from the GAFL are 6.0 and 5.8 mg/L, respectively, indicating aerobic conditions not conducive to denitrification. Median DO concentration in ground-water samples from the ACFB Coastal Plain is 6.8 mg/L, and the median nitrate concentration of 2.2 mg/L is greater than the background level of 2 mg/L.
Acknowledgments
I thank the NAWQA personnel who collected the water-quality data used in this
investigation. I also thank the three anonymous reviewers whose comments resulted in substantial improvement to this paper. Lastly, thanks to Scott W. Ator, Daniel J. Hippe, and Timothy B. Spruill for providing insight into water-quality conditions in their respective NAWQA study areas.
REFERENCES Ator, S.W., J.D. Blomquist, J.W. Brakebill, J.M. Denis, M.J. Ferrari, C.V. Miller, and H.
Zappia. 1998. Water quality in the Potomac River Basin, Maryland, Pennsylvania, Virginia, West Virginia, and the District of Columbia, 1992-1996. U.S. Geological Survey Circular 1166.
Ator, S.W., and J.M. Denis. 1997. Relation of nitrogen and phosphorus in ground water to land use in four subunits of the Potomac River Basin. U.S. Geological Survey Water-Resources Investigations Report 96-4268.
Böhlke, J.K., and J.M. Denver. 1995. Combined use of groundwater dating, chemical, and isotopic analyses to resolve the history and fate of nitrate contamination in two agricultural watersheds, Atlantic coastal plain, Maryland. Wat. Resources Res. 31:2319-2339.
Centers for Disease Control and Prevention. 1996. Spontaneous abortions possibly related to ingestion of nitrate-contaminated well waterLaGrange County, Indiana, 1991-1994. Morbidity and Mortality Weekly Report 45:569-572.
Chapelle, F.H., P.B. McMahon, N.M. Dubrovsky, R.F. Fujii, E.T. Oaksford, and D.A. Vroblesky. 1995. Deducing the distribution of terminal electron-accepting processes in hydrologically diverse groundwater systems. Wat. Resources Res. 31:359-371.
Fishman, M.J. (ed.) 1993. Methods of analysis by the U.S. Geological Survey National Water Quality Laboratorydetermination of inorganic and organic constituents in water and fluvial sediments. U.S. Geological Survey Open-File Report 93-125.
Frick, E.A., D.J. Hippe, G.R. Buell, C.A. Couch, E.H. Hopkins, D.J. Wangsness, and J.W. Garret. 1998. Water quality in the Apalachicola-Chattahoochee-Flint River Basin, Georgia, Alabama, and Florida, 1992-95. U.S. Geological Survey Circular 1164.
Gilliom, R.J., W.M. Alley, and M.E. Gurtz. 1995. Design of the National Water-Quality Assessment Program: occurrence and distribution of water-quality conditions. U.S. Geological Survey Circular 1112.
Hamilton, P.A., and R.J. Shedlock. 1992. Are fertilizers and pesticides in the ground water? U.S. Geological Survey Circular 1080.
14
Helsel, D.R., and R.M. Hirsch. 1992. Statistical methods in water resources. Elsevier, New York.
Hem, J.D. 1989. Study and interpretation of the chemical characteristics of natural water. U.S. Geological Survey Water-Supply Paper 2254.
Kellogg, R.L., M.S. Maizel, and D.W. Goss. 1992. Agricultural chemical use and ground water quality: where are the potential problem areas? U.S. Department of Agriculture.
Kleinbaum, D.G., L.L. Kupper, and K.E. Muller. 1988. Applied regression analysis and other multivariable methods. PWS-KENT Publishing Company, Boston.
Korom, S.F. 1992. Natural denitrification in the saturated zone: a review. Wat. Resources Res. 28:1657-1668.
Koterba, M.T., F.D. Wilde, and W.W. Lapham. 1995. Ground-water data-collection protocols and procedures for the National Water-Quality Assessment Program: collection and documentation of water-quality samples and related data. U.S. Geological Survey Open-File Report 95-399.
Lapham, W.W., F.D. Wilde, and M.T. Koterba. 1995. Ground-water data-collection protocols and procedures for the National Water-Quality Assessment Program: selection, installation, and documentation of wells, and collection of related data. U.S. Geological Survey Open-File Report 95-398.
Lapham, W.W., F.D. Wilde, and M.T. Koterba. 1997. Guidelines and standard procedures for studies of ground-water quality: selection and installation of wells, and supporting documentation. U.S. Geological Survey Water-Resources Investigations Report 96-4233.
Lowrance, R. 1992. Groundwater nitrate and denitrification in a Coastal Plain riparian forest. J. Environ. Qual. 21:401-405.
Mueller, D.K., P.A. Hamilton, D.R. Helsel, K.J. Hitt, and B.C. Ruddy. 1995. Nutrients in ground water and surface water of the United Statesan analysis of data through 1992. U.S. Geological Survey Water-Resources Investigations Report 95-4031.
Mueller, D.K., and D.R. Helsel. 1996. Nutrients in the Nation’s waterstoo much of a good thing? U.S. Geological Survey Circular 1136.
Nolan, B.T., B.C. Ruddy, K.J. Hitt, and D.R. Helsel. 1997. Risk of nitrate in groundwaters of the United States—a national perspective. Environ. Sci. and Technol. 31:2229-2236.
Nolan, B.T., B.C. Ruddy, K.J. Hitt, and D.R. Helsel. 1998. A national look at nitrate contamination of ground water. Wat. Cond. and Purif. 39:76-79.
Patton, C.J., and E.P. Truitt. 1992. Methods of analysis by the U.S. Geological Survey National Water Quality Laboratorydetermination of total phosphorus by a Kjeldahl digestion method and an automated colorimetric finish that includes dialysis. U.S. Geological Survey Open-File Report 92-146.
Puckett, L.J. 1994. Nonpoint and point sources of nitrogen in major watersheds of the United States. U.S. Geological Survey Water-Resources Investigations Report 94-4001.
Puckett, L.J., and O.P. Bricker. 1992. Factors controlling the major ion chemistry of streams in the Blue Ridge and Valley and Ridge physiographic provinces of Virginia and Maryland. Hydrolog. Proc. 6:79-98.
Sawyer, C.N., and P.L. McCarty. 1978. Chemistry for environmental engineering. McGraw-Hill Book Company, New York.
Solley, W.B., R.R. Pierce, and H.A. Perlman. 1993. Estimated use of water in the United States in 1990. U.S. Geological Survey Circular 1081.
15
Spalding, R.F., and M.E. Exner. 1993. Occurrence of nitrate in groundwater—a review. J. of Environ. Qual. 22:392-402.
Speiran, G.K. 1996. Geohydrology and geochemistry near coastal ground-water- discharge areas of the Eastern Shore, Virginia. U.S. Geological Survey Water-Supply Paper 2479.
Spruill, T.B., D.A. Harned, P.M. Ruhl, J.L. Eimers, G. McMahon, K.E. Smith, D.R. Galeone, and M.D. Woodside. 1998. Water quality in the Albemarle-Pamlico drainage basin, North Carolina and Virginia, 1992-1995. U.S. Geological Survey Circular 1157.
Statistical Products and Service Solutions, Inc. 1996. StatisticsSystat 6.0 for Windows. SPSS, Inc., Chicago.
Stumm, W., and J.J. Morgan. 1981. Aquatic chemistry. John Wiley and Sons, New York. Tiedje, J.M., A.J. Sexstone, D.D. Myrold, and J.A. Robinson. 1982. Denitrification: ecological
niches, competition and survival. Antonie van Leeuwenhoek 48:569-583. U.S. Environmental Protection Agency. 1995. Drinking water regulations and health advisories.
Office of Water, Washington, D.C. Ward, M.H., S.D. Mark, K.P. Cantor, D.D. Weisenburger, A. Correa-Villaseñor, and S.H.
Zahm. 1996. Drinking water nitrate and the risk of non-Hodgkin's lymphoma. Epidemiol. 7:465-471.
16
Table 1. Network size and median concentrations of nitrate-reduction constituents in ground waters of agricultural land-use studies in the southeastern United States. (Excludes paired wells; constituent concentrations in mg/L except as noted. Not every well was sampled for all constituents.)
NAWQA river basin and ground-water study in agricultural land-use area
Wells in network
Dis. org. carbon
Dis. oxygen
Iron, µg/L
Manganese, µg/L
Nitrite-plus- nitrate
Ammonium
ACFB†--Coastal Plain; cropland over undifferentiated rocks
17 0.2 6.8 <3 <1 2.2 <0.02
ACFB†--Upper Coastal Plain; cropland over clastic limestone
10 0.2 7.1 <3 3 0.80 0.02
ACFB†--Lower Coastal Plain; cropland over karstic limestone
10 0.3 6.2 <3 7 0.61 <0.02
ALBE‡--Coastal Plain; corn and soybeans over unconsolidated and partly consolidated sands with some limestone and sandy limestone
17 4.2 2.1 5,700 110 <0.05 0.08
GAFL§--Southern Coastal Plain; row crops over limestone and dolomitic rocks.
23 0.4 6.0 8 9 5.8 0.02
POTO¶--Great Valley Carbonate (between Valley and Ridge Province and Blue Ridge Province); corn and confined animal operations over carbonate rocks
28 0.6 7.6 <3 <1 4.6 0.02
POTO¶--Valley and Ridge Province; corn and confined animal operations over siliclastic sedimentary rocks
24 0.4 0.5 515 135 <0.05 0.06
All agricultural land-use studies in the Southeast
129 0.4 5.7 6 7 1.5 0.02
†Apalachicola-Chattahoochee-Flint River Basin ‡Albemarle-Pamlico Drainage Basin §Georgia-Florida Coastal Plain ¶Potomac River Basin
17
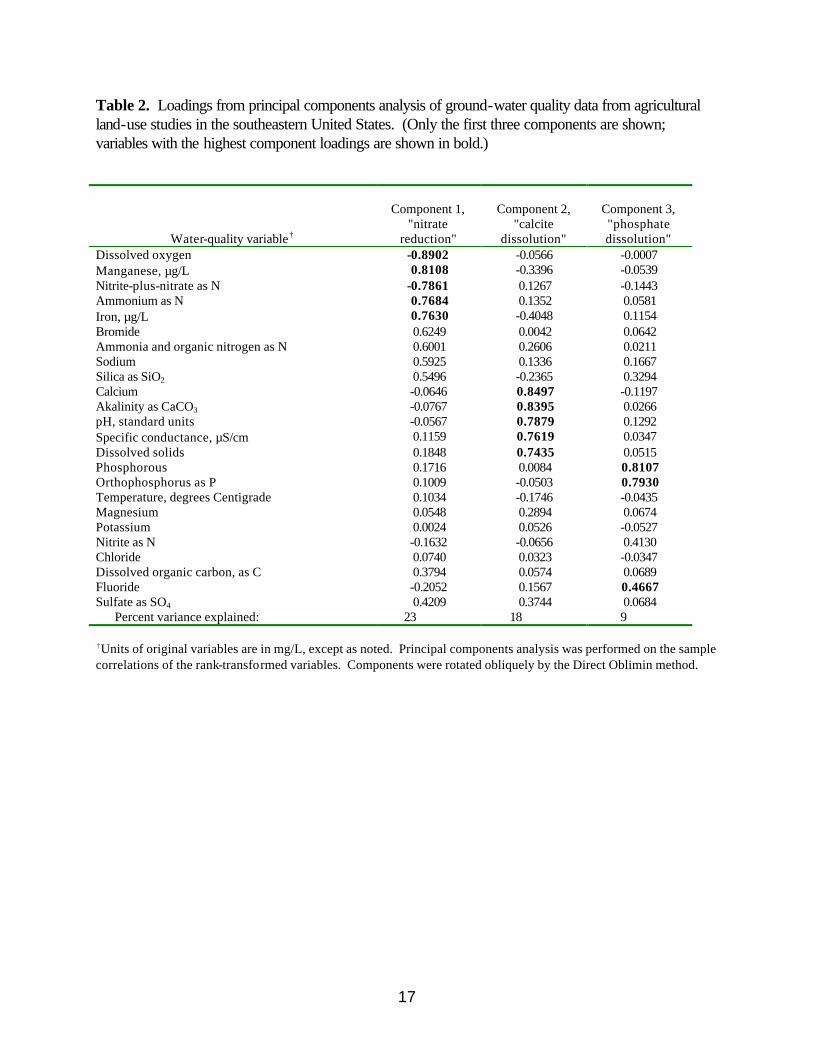
Table 2. Loadings from principal components analysis of ground-water quality data from agricultural land-use studies in the southeastern United States. (Only the first three components are shown; variables with the highest component loadings are shown in bold.)
Water-quality variable†
Component 1,
"nitrate reduction"
Component 2,
"calcite dissolution"
Component 3, "phosphate dissolution"
Dissolved oxygen -0.8902 -0.0566 -0.0007 Manganese, µg/L 0.8108 -0.3396 -0.0539 Nitrite-plus-nitrate as N -0.7861 0.1267 -0.1443 Ammonium as N 0.7684 0.1352 0.0581 Iron, µg/L 0.7630 -0.4048 0.1154 Bromide 0.6249 0.0042 0.0642 Ammonia and organic nitrogen as N 0.6001 0.2606 0.0211 Sodium 0.5925 0.1336 0.1667 Silica as SiO2 0.5496 -0.2365 0.3294 Calcium -0.0646 0.8497 -0.1197 Akalinity as CaCO3 -0.0767 0.8395 0.0266 pH, standard units -0.0567 0.7879 0.1292 Specific conductance, µS/cm 0.1159 0.7619 0.0347 Dissolved solids 0.1848 0.7435 0.0515 Phosphorous 0.1716 0.0084 0.8107 Orthophosphorus as P 0.1009 -0.0503 0.7930 Temperature, degrees Centigrade 0.1034 -0.1746 -0.0435 Magnesium 0.0548 0.2894 0.0674 Potassium 0.0024 0.0526 -0.0527 Nitrite as N -0.1632 -0.0656 0.4130 Chloride 0.0740 0.0323 -0.0347 Dissolved organic carbon, as C 0.3794 0.0574 0.0689 Fluoride -0.2052 0.1567 0.4667 Sulfate as SO4 0.4209 0.3744 0.0684
Percent variance explained: 23 18 9 †Units of original variables are in mg/L, except as noted. Principal components analysis was performed on the sample correlations of the rank-transformed variables. Components were rotated obliquely by the Direct Oblimin method.
18
Table 3. Network size and median concentrations of calcite-dissolution and phosphate-dissolution constituents in ground waters of agricultural land-use studies in the southeastern United States. (Excludes paired wells; constituent concentrations in mg/L except as noted. Not every well was sampled for all constituents.)
NAWQA river basin and ground-water study in
agricultural land-use area
Wells in Network
Alkal. As
CaCO3
pH, stand. units
Spec. cond., µS/cm
Dis.
solids
Calcium
Magne-
sium
Sulfate
Fluoride
Ortho- Phos.
ACFB†--Coastal Plain; cropland over undifferentiated rocks
17 111 7.3 233 140 35 0.78 1.7 <0.1 <0.01
ACFB†--Upper Coastal Plain; cropland over clastic limestone
10 82 7.6 188 119 34 0.44 1.6 <0.1 0.02
ACFB†--Lower Coastal Plain; cropland over karstic limestone
10 124 7.0 139 121 26 0.74 1.9 0.1 <0.01
ALBE‡--Coastal Plain; corn and soybeans over unconsolidated and partly consolidated sands with some limestone and sandy limestone
17 73 6.1 317 174 12 4.3 16 0.1 0.02
GAFL§--Southern Coastal Plain; row crops over limestone and dolomitic rocks.
23 -- 4.7 140 94 5 2.6 1.0 <0.1 <0.01
POTO¶--Great Valley Carbonate (between Valley and Ridge Province and Blue Ridge Province); corn and confined animal operations over carbonate rocks
28 243 7.1 620 353 87 19 12 0.2 <0.01
POTO¶--Valley and Ridge Province; corn and confined animal operations over siliclastic sedimentary rocks
24 132 7.3 411 243 38 14 25 0.1 <0.01
All agricultural land-use studies in the Southeast
129 138 6.8 272 161 36 4.9 5.5 0.1 <0.01
†Apalachicola-Chattahoochee-Flint River Basin ‡Albemarle-Pamlico Drainage Basin §Georgia-Florida Coastal Plain ¶Potomac River Basin
19
Fig. 1. National Water-Quality Assessment Program studies in the southeastern United States that began in 1991.
Apalachicola-Chattahoochee-Flint River Basin
Albemarle-PamlicoDrainageBasin
Potomac River Basin
Georgia-FloridaCoastalPlain
0 200 400 MILES
0 200 400 KILOMETERS
Alabama Georgia
SouthCarolina
North Carolina
Virginia WestVirginia
Pennsylvania
Md.
Delaware
NewJersey
Florida
20
0 5 10 15 20 25DEPTH OF OPEN INTERVAL BELOW WATER, METERS
0.010
0.100
1.000
OR
THO
PH
OS
PH
OR
US
, MIL
LIG
RA
MS
PE
R L
ITE
R A
S P
0 5 10 15 20 25
0.010
0.100
1.000
LOWESSSMOOTHLINE
Fig. 2. Relation between orthophosphorus concentration in ground water and depth of open sampling interval below water level in well, for NAWQA ground-water studies in agricultural areas of the southeastern U.S.
21
-3 -2 -1 0 1 2 3NITRATE REDUCTION
-3
-2
-1
0
1
2
3
PH
OS
PH
AT
E D
ISS
OLU
TIO
N
ACFBALBEGAFLPOTO
Study Unit
ALBE
POTOACFB
Fig. 3. Relation of scores from principal components analysis to nitrate-reduction and phosphate-dissolution components, for NAWQA ground-water studies in agricultural areas of the southeastern U.S.
22
-3 -2 -1 0 1 2 3NITRATE REDUCTION
-3
-2
-1
0
1
2
3
CA
LCIT
E D
ISS
OLU
TIO
N
ACFBALBEGAFLPOTO
Study Unit
POTO
ACFB ALBE
Fig. 4. Relation of scores from principal components analysis to nitrate-reduction and calcite-dissolution components, for NAWQA ground-water studies in agricultural areas of the southeastern U.S.
23
-3 -2 -1 0 1 2 3NITRATE REDUCTION
-3
-2
-1
0
1
2
3
CA
LCIT
E D
ISS
OLU
TIO
N
ACFB undifferentiatedACFB clastic limestoneACFB karstic limestonePOTO Great Valley CarbonatePOTO Valley and Ridge
Ground-Water Study
Fig. 5. Relation of score clusters to nitrate-reduction and calcite-dissolution components, for selected NAWQA ground-water studies in agricultural areas of the southeastern U.S.