Volume 13, Number 1 Print ISSN: 1544-1458 Online ISSN: 1939-6104 ACADEMY OF STRATEGIC MANAGEMENT JOURNAL SHAWN CARRAHER OXFORD JOURNAL DISTINGUISHED RESEARCH PROFESSOR EDITOR The Academy of Strategic Management Journal is owned and published by Jordan Whitney Enterprises, Inc.. Editorial Content is controlled by the Allied Academies, a non-profit association of scholars, whose purpose is to support and encourage research and the sharing and exchange of ideas and insights throughout the world.
Transcript
Volume 13, Number 1 Print ISSN: 1544-1458 Online ISSN: 1939-6104
ACADEMY OF STRATEGIC MANAGEMENT JOURNAL
SHAWN CARRAHER OXFORD JOURNAL DISTINGUISHED RESEARCH PROFESSOR
EDITOR
The Academy of Strategic Management Journal is owned and published by Jordan Whitney Enterprises, Inc.. Editorial Content is controlled by the Allied Academies, a non-profit association of scholars, whose purpose is to support and encourage research and the sharing and exchange of ideas and insights throughout the world.
Page ii
Academy of Strategic Management Journal, Volume 13, Number 1, 2014
Authors execute a publication permission agreement and assume all liabilities. Neither Jordan Whitney Enterprises, Inc. nor Allied Academies is responsible for the content of the individual manuscripts. Any omissions or errors are the sole responsibility of the authors. The Editorial Board is responsible for the selection of manuscripts for publication from among those submitted for consideration. The Publishers accept final manuscripts in digital form and make adjustments solely for the purposes of pagination and organization.
The Academy of Strategic Management Journal is owned and published by Jordan Whitney Enterprises, Inc., PO Box 1032, Weaverville, NC 28787, USA. Those interested in communicating with the Journal, should contact the Executive Director of the Allied Academies at [email protected].
Copyright 2014 by Jordan Whitney Enterprises, Inc., USA
Page iii
Academy of Strategic Management Journal, Volume 13, Number 1, 2014
EDITORIAL REVIEW BOARD
Peter Antoniou California State University San Marcos
Stephanie Huneycutt Bardwell Christopher Newport University
James Bishop New Mexico State University
ThomasBox Pittsburg State University
Marty Bressler Southeast Oklahoma State University
Steve Brown Eastern Kentucky University
Richard Caldarola Troy State University
Eugene Calvasina Southern University
Shawn Carraher Minot State University
Robert Carton Western Carolina University
Beth Castiglia Felician College
John James Cater Louisiana State University
Ronald Cheek University of Louisiana at Lafayette
Iain Clelland Radford University
Meredith Downes Illinois State University
Thomas Garsombke Claflin University
Edward Haberek Briarwood College
Paul Jacques Western Carolina University
Raghu Korrapati Walden University
Rick Koza Chadron State College
Catherine Levitt California State University at Los Angeles
Chris Lockwood Northern Arizona University
Lee Makamson Hampton University
Terry Maris Ohio Northern University
James Maxwell Indiana State University
David McCalman University of Central Arkansas
Page iv
Academy of Strategic Management Journal, Volume 13, Number 1, 2014
EDITORIAL REVIEW BOARD
James McLaurin American University of Sharjah
Mohsen Modarres Humboldt State University
Chynette Nealy University of Houston-Downtown
John Kalu Osir Washington State University
Mildred Golden Pryor Texas A&M University-Commerce
Oswald Richards Lincoln University
Stanley Ross Bridgewater State College
Robert Scully Barry University
Claire Simmers Saint Joseph's University
Prasanna Timothy Karunya Institute of Technology & Sciences
Jennifer Villa New Mexico State University
Page v
Academy of Strategic Management Journal, Volume 13, Number 1, 2014
TABLE OF CONTENTS EDITORIAL REVIEW BOARD .................................................................................................. III LETTER FROM THE EDITOR .................................................................................................. VII A PRELIMINARY EXAMINATION OF SUSTAINABLE DISCLOSURES ON FORTUNE 500 COMPANY WEBSITES ......................................................................................................... 1
Michelle B. Kunz, Morehead State University Janet M. Ratliff, Morehead State University Marlene Blankenbuehler, Morehead State University Traci Bard, Morehead State University
DOES COMPANY SIZE AFFECT MISSION STATEMENT CONTENT? .............................. 21
Darwin L. King, St. Bonaventure University Carl J. Case, St. Bonaventure University Kathleen M. Premo, St. Bonaventure University
SIX SIGMA IMPLEMENTATION BY INDIAN MANUFACTURING SMES - AN EMPIRICAL STUDY ............................................................................................................ 35
A. Raghunath, Centre For Research, Anna University, Chennai R.V. Jayathirtha, Bullseye Consulting Group, Bangalore
CEO’S SHARE OF TOP-MANAGEMENT COMPENSATION, CHARACTERISTICS OF THE BOARD OF DIRECTORS AND FIRM-VALUE CREATION .......................................... 57
Sébastien Deschênes, University of Moncton Mohamed Zaher Bouaziz, University of Moncton Tania Morris, University of Moncton Miguel Rojas, University of Moncton Hamadou Boubacar, University of Moncton
RESOURCE VALUE AS A SOURCE OF NEGOTIATING POWER: DETERMINANTS OF ALLIANCE FUNDING AMOUNTS IN THE US BIOTECH INDUSTRY. .............................. 75
Paul Forshey, High Point University
Page vi
Academy of Strategic Management Journal, Volume 13, Number 1, 2014
SERVANT LEADERSHIP, HUMANE ORIENTATION, AND CONFUCIAN DOCTRINE OF JEN .................................................................................................................... 97
Mary Jo Hirschy, Taylor University Doris Gomez, Regent University Kathleen Patterson, Regent University Bruce E. Winston, Regent University
DETERMINANTS OF INTERFIRM RIVALRY OR COOPERATION: IMPLICATIONS FOR MANAGEMENT .................................................................................. 113
William T. Jackson, University of South Florida St. Petersburg Terry Nelson, University of Alaska, Anchorage Lei Gao, University of Memphis Jeffrey A. Krug, Loyola University New Orleans Peter Wright, University of Memphis
BOARD HETEROGENEITY: DOUBLE-EDGED SWORD? FOCUSING ON THE MODERATING EFFECTS OF RISK ON HETEROGENEITY-PERFORMANCE LINKAGE .................................................................................................... 129
Kong-Hee Kim, St. Cloud State University
Page vii
Academy of Strategic Management Journal, Volume 13, Number 1, 2014
LETTER FROM THE EDITOR Welcome to the Academy of Strategic Management Journal. The Journal is owned and published by Jordan Whitney Enterprises, Inc.. The Editorial Board and the Editors are appointed by the Allied Academies, Inc., a non profit association of scholars whose purpose is to encourage and support the advancement and exchange of knowledge, understanding and teaching throughout the world. The editorial mission of the Journal is to advance the field of strategic management. To that end, the journal publishes theoretical and empirical manuscripts pertaining to the discipline. The manuscripts contained in this volume have been double blind refereed. The acceptance rate for manuscripts in this issue, 25%, conforms to our editorial policies. Our editorial review policy maintains that all reviewers will be supportive rather than destructive, helpful versus obtrusive, mentoring instead of discouraging. We welcome different points of view, and encourage authors to take risks with their research endeavors. The Editorial Policy, background and history of the organization, and calls for conferences are published on our web site. In addition, we keep the web site updated with the latest activities of the organization. Please visit our site at www.alliedacademies.org and know that we welcome hearing from you at any time.
Shawn Carraher Oxford Journal Distinguished Research Professor
Page viii
Academy of Strategic Management Journal, Volume 13, Number 1, 2014
Page 1
Academy of Strategic Management Journal, Volume 13, Number 1, 2014
A PRELIMINARY EXAMINATION OF SUSTAINABLE DISCLOSURES ON FORTUNE 500 COMPANY
WEBSITES
Michelle B. Kunz, Morehead State University Janet M. Ratliff, Morehead State University
Marlene Blankenbuehler, Morehead State University Traci Bard, Morehead State University
ABSTRACT
An exploratory study of the sustainable information posted on Fortune 500 corporate
websites found differences in the sustainable actions of these companies based upon industry, and the size of the firm. Findings of the study also indicate that more than three-fourths of the companies examined engage in one or more sustainable actions. Additionally, researchers present suggestions for future analysis and review of publicly available corporate sustainability information and present questions for consideration in future research.
BACKGROUND
Sustainability has been termed an emerging megatrend (Lubin & Esty, 2010), as the environmental issues have steadily increased in the list of issues corporate executives consider when reporting corporate standing, as well as finding ways to create value for stakeholders. Furthermore, Holden (2012) cites a 2011 McKinsey survey that indicated one third of respondents indicated the top reason for pursuing sustainability initiatives was to lower operations costs and improve efficiency. This is also supported by Heffes (2010) as she reports that sustainability and green initiatives have a place in corporate strategy, but corporate executives still have difficulty conveying to their stakeholders how such actions create value. Finally, Stafford and Hartman (2013) echo these sentiments, stating that today’s corporations recognize the value of increasing sustainability. The authors cite reduced costs and risks, preservation of resources, goodwill among regulators, stockholders, customers and other stakeholders. Thus business understands how sustainability will benefit the corporation, but still need to convey these benefits to stakeholders. Corporations recognize that it is imperative they meet stakeholder expectations, while addressing sustainability, however Ballou, Heitger, Landed and Adams, (2006) also emphasize business must demonstrate how sustainability also creates social and environmental value. In order to operationalize these efforts, essentially organizations are systematically implementing eco-effective management practices that are strategic in nature (Huppes & Ishikawa, 2005). Burnett, Skousen and Wright (2011) found empirical evidence to support the proposition that sustainable
Page 2
Academy of Strategic Management Journal, Volume 13, Number 1, 2014
corporate effort goes beyond just environmental impact, to create long-term value for shareholders and the firm as well.
The push to provide information regarding sustainable actions and corporate social responsibility can be traced back to the social movements of the 1960s and 1970s (Kleine & von Hauff, 2009). In 1987 the Brundtland Report (Casimir & Dutilh, 2003) introduced the concept of sustainable development, stating that the needs of the present should be met without compromising the ability of future generations to meet their needs. By 1992, the United Nations Conference for Environment and Development was globally accepted (Kleine & von Hauff, 2009). Research in the area also has a history dating back to the 1970s (Montiel, 2008). Articles at that time addressed corporate social responsibility (CSR), while a couple decades later corporate sustainability (CS) began to appear. More recently, 2000-2005, articles that focused on environmental management (EM), were greater than the number of CSR and CS articles combined. Additionally, the Academy of Management implemented initiatives in this direction, including special issues of the Academy of Management Review and the Academy of Management Journal. As these topics merge and take a permanent place on the business agenda, it necessary to examine how corporations are disseminating information about their sustainable activities. In fact, there were 7,700 companies in 130 countries that voluntarily signed the UN global compact in 2008 (Lozano, 2012), and by 2010 this number had increased to 10,000 companies in 130 countries ("Overview of the UN Global Compact," 2011).
DEFINITION OF TERMS
In 1996, The International Organization for Standardization defined a corporate environmental policy as a “statement by the organization of its intentions and principles in relation to its overall environment performance”(Ramus & Montiel, 2005) . In turn, this provided the framework necessary to set environmental objectives and targets and allow corporations to commit to implementation of proactive policies aimed at sustainability. Yet today, confusion exists in terminology and definition of sustainability and related issues. Sustainability, environmental sustainability, sustainable development, corporate social responsibility, as well as corporate responsibility and corporate sustainability are all used, with similar, while varying definitions (Roca & Searcy, 2012). In some instances, terms are used interchangeably, and definitions can be as varied as the terminology used. Dilling (2010) indicated that there is no globally accepted definition of CSR or sustainability reporting. To add to this confusion, while many consider sustainability from the ecological or environmental perspective, others address sustainability from the “triple bottom line” approach, with the three dimensions of economic/financial, environmental and social responsibility (Montiel, 2008). Montiel continues by positing that CSR and CS are converging, with environmental issues a subset of CSR. Thus, corporate social responsibility could or would include an environmental/corporate sustainability component. This perspective of sustainability as a component included in corporate social responsibility is supported by others as
Page 3
Academy of Strategic Management Journal, Volume 13, Number 1, 2014
well (Dilling, 2010; Katrinli, Gunay, & Biresselioglu, 2011; Matthews & Rusinko, 2010; Shih-Fang & Her-Jiun, 2007). Sustainability is part of the corporate vision for companies in which it is integrated across the business functions of the organization (Lubin & Esty, 2010), and as such may be integrated into annual reports or other reporting mechanisms of the corporate reporting function. To further add to the confusion, corporate reports also use various names, such as corporate responsibility or social responsibility, as well as sustainability report (Roca & Searcy, 2012).
CORPORATE EXAMPLES
Sustainability efforts have been implemented and integrated across many companies (Lubin & Esty, 2010). Some examples include: DuPont’s attempt to become more eco-efficient through “zero waste” and increased future earnings by removing businesses with large eco-footprints from their operations. Coca-Cola for example, created new packaging which was modified to be more light-weight and saves the company tens of millions of dollars. By 2015 their new vending machines are to be HFC-free, reducing greenhouse gas emissions by 99%. Walmart launched Sustainability 360 initiative with goals of creating zero waste, cutting greenhouse gas emissions, purchasing 100% renewable energy, and selling products that sustain the environment and world resources. Companies are adopting sustainability approaches that create more efficient operations, positively affect the bottoms line, and engage outsiders to consider sustainability (Lubin & Esty, 2010).
The technology industry seems to be leading the charge, while banking and the oil and gas industries are poor performers. However, the report which identified the top 25 Global Corporate Reputation index included companies from across the board. Some of those identified as good corporate citizens were: Adidas, Apple, Avon, Bosch, Canon, Coca-Cola, Danone, Electrolux, Ford, Google, Heinz, Honda, Lego, McDonald’s, Microsoft, Nestle, Mike, Nokia, Phillips, Puma, Sharp, Sony, Toshiba, Via and Volkswagen. Other corporations identified for their sustainability efforts include Campbell’s Soup (Kruschwitz, 2012a), Dell (Kruschwitz, 2012b), Johnson & Johnson (Borkowski, Welsh, & Wentzel, 2010), as well as Coca-Cola’s water stewardship program (Walsh & Dowding, 2012). Wal-Mart has invested heavily in sustainability, both within the corporation itself, both in-store as well as in productions facilities (Ladd, 2010). Furthermore, Wal-Mart has been aggressive in promoting sustainability in the processes of suppliers worldwide.
Intel is the largest purchaser of green power in the U.S (Kruschwitz, 2012c). According to Intel, sustainability creates value in four ways: brand value, operational excellence and cost savings, revenue and new market opportunities, and risk management. Intel realizes sustainability efforts may increase costs but has been willing to spend more on green energy as a way to increase future demand and long-term value for their company. To deal with sustainability–related issues, Dell has created a hub within the company (Kruschwitz, 2012b). Four individuals report to a director of sustainability. The areas in which they focus include: 1) environmental strategy, 2) social strategy, 3) operational strategies, and 4) services organization which focuses on
Page 4
Academy of Strategic Management Journal, Volume 13, Number 1, 2014
performance and bottom-line effects. One goal reached by Dell included reducing power consumption of desktops and laptops by 40%. Also, packaging goals of the company follow three C’s created by the company: 1) cube, reduce the size of the package, 2) content – make the materials used more sustainable, and 3) curb – package materials are recyclable or compostable. Greif, a leading manufacturer of industrial packaging indicates four keys to their sustainability agenda: 1) attention to sustainability by top management, 2) approach to sustainability collaboration, 3) business model innovation, and 4) new internal organizational structures (Kiron, Kruschwitz, Reeves, & Goh, 2013). In a survey created by Greif to analyze the response to sustainability within its business model, results indicated that 48% of the companies changed their business model, 46% said the sustainability activities added to profits. Additionally, of the half of survey respondents who made three to four changes to their business model, they profited from their sustainability activities in comparison to only 37% of those who only changed one aspect of their business model. Lastly, Timberland positions sustainability as the triple bottom line by focusing on what they refer to as the four pillars (Kruschwitz, 2013). These pillars include building sustainable living environments at their factories, community service and greening communities, corporate footprint, and product footprint.
Companies implementing corporate sustainability are creating stronger sustainability efforts that go beyond eco-efficiency and pollution control (Young & Tilley, 2006). Kraft collaborated with a company called TerraCycle that rewards consumers for returning non-recyclable packaging. Kraft wanted to divert packaging that was unable to be recycled from going to landfills. By working with TerrCycle they were able to raise their brands’ profile and influence consumers to make better choices (Kruschwitz, 2012d). Kraft Foods Group, Inc. employs business teams worldwide to reduce the Kraft’s global environmental impact (Kruschwitz, 2012d). Efforts include sustainable agriculture practices which have been used for almost two decades, with coffee. In addition, the company has committed to invest in sustainable cocoa farming in Ghana. Furthermore, the company has taken action to reduce CO2 emissions, decrease needed water for processes, reduced waste, as well as the poundage of packaging and removed 60 million road miles from the transportation and distribution network.
Some corporations embrace sustainability after pressure from consumers (Fromartz, 2009). Nike is one example, after criticism of the labor practices of suppliers put pressure on the company. The company’s response to these concerns led to further questions about Nike’s product design and manufacturing processes. This resulted in a goal of zero waste as one of several long-term goals for 2020, and a product line (named Considered), and production and design standards (named Considered Design) which reduce waste, cut energy use and slash the use of solvent. While Wal-Mart still has detractors of the corporation’s stand on sustainability, it all began when consumer pressure in 2005, led to the development of Wal-Mart’s Sustainability Index (Merchant, 2009), a complex plan to measure the sustainability of every product it sells. This effort resulted in collaboration with suppliers and supply chain partners to move toward zero waste initiatives. The goal is to provide consumers with a scorecard for over 100 product categories. According to
Page 5
Academy of Strategic Management Journal, Volume 13, Number 1, 2014
the Wal-Mart corporate website, the goal was to have this available by the end of 2012 ("Sustainability Index," 2012).
CONSUMER INTEREST
For many companies, communicating the company’s focus on sustainability by addressing corporate actions has become a significant part of the corporate agenda (Reilly, 2009). Greening efforts that lead to aggressive cost cutting and reduction of the carbon footprint can help companies be successful and at the same time produce a healthy revenue stream (Ladd, 2010). Consumers also want to know about green products, and corporate practices. However, corporate communications must feel authentic, especially concerning sustainability actions (Watson, 2011). The so-called “green consumer” prefers green products and services (Oates et al., 2008), and therefore values truthful information from companies about their sustainable practices.
While business understands the sustainable imperative, research (Stafford & Hartman, 2013) indicates only about 5% of consumer purchasing is truly environmentally conscious. Thus corporations need to address how they can appeal to consumers, and impact consumer choice behaviors. By providing transparent information to consumers, perhaps in easily and frequently accessed information sources, i.e. the corporate webpage, more consumers can be convinced of the importance of sustainability. Approximately one-fifth of US adults believe a majority of businesses are committed to improving the environment by implementing sustainable business practices and/or offering environmentally-friendly products and services (Loch & Buhay, 2012). This percentage of concerned US consumers has increased from 16 and 17 percent in 2010 and 2011, respectively. While consumers may not believe corporations are committed to becoming sustainable, the majority (71%) are interested in learning what companies are doing regarding sustainable actions.
A series of annual Harris Interactive surveys report changing trends in consumer attitudes and actions. In 2008, ("SCA Survey Conducted by Harris Interactive(R) Shows That Despite a Weakened Economy, U.S. Consumers Willing to Spend Green to Go Green," 2008) consumers indicated that they were willing to pay more for environmentally-friendly products such as: hybrid cars, organic, fair trade or locally sourced food, green/organic cleaning supplies, and products made from recycled materials. On the average, consumers indicated they were willing to spend 17-19% more on green products. Additional findings indicate that consumers are better informed about what makes products and services environmentally-friendly, indicating use of product ingredients, third-party seal of approval, and an environmental statement on the product package. The 2011 (Steinberg, 2011) poll found that fewer US adults were likely to engage in “green actions, ” less likely to express green attitudes, as well as to have adopted typical environmental activities such as purchasing Energy Start appliances, recycling electronics, switching from bottled to tap water or purchasing a hybrid or more fuel-efficient car. Despite these lower numbers, a small
Page 6
Academy of Strategic Management Journal, Volume 13, Number 1, 2014
group of committed US adults are more likely to describe themselves as conservationists, “green,” and environmentalists, than they were the previous year.
The 2012 poll (Steinberg, 2012) found a continued decrease in the likelihood of consumers to incorporate sustainable actions in their daily lives, as well as fewer of them likely to describe themselves as environmentally-conscious. Only about 1 in 3 Americans say they are concerned about the planet, and what will be left for future generations. However, as with the 2011 poll, a higher percentage of a minority of Americans continue to describe themselves as conservationists, “green” or environmentalists. Pollsters surmise that over the past several years, the economic environment has had a significant impact on consumer attitudes and actions. Unfortunately, some of these failures may be costing consumers more of their dollars, as actions such as buying in bulk and recycling, could in fact save them money, as well as leaving a cleaner/sustainable planet for future generations.
Another 2012 survey ("SCA Survey Finds Two-Thirds of American Adults Purchase Green Products," 2012) seems to contradict the negative findings of the Harris polls. This survey found that more than two-thirds (69%) of Americans purchase green products, and almost half of those who do, make these purchases because they believe it is better for the environment. Forty-two percent of those surveyed believe the green movement is just getting started. Perhaps even more important to corporate executives, more than 80% of these consumers consider themselves to be knowledgeable about which companies and brands have a strong history of sustainability, and consider the history of a company’s sustainable actions when making a purchase.
ONLINE INFORMATION
The corporate website is the most frequently used medium to engage CSR communication (Morhardt, Baird, & Freeman, 2002). Eighty percent of Fortune 500 companies mentioned their involvement in corporate socially responsibility actions. Furthermore, brand web sites are the best means of influencing attitudes and perceptions. Rowbottom and Lymer (2009) also suggest the need to use the corporate web site to communicate and legitimize sustainable activities. These authors indicate the UK companies have the highest level of reporting in the world. Sustainability practices and strategies are also being reported on thousands of global organization corporate websites (Sobhani, Amran, & Zainuddin, 2012). Posting sustainability reports online provides easy access for consumers, and is cost-effective for corporations (Morhardt, 2010). Furthermore, KLD Research Analytics, Inc. has developed social responsibility indexing based upon environmental communication and reporting of corporate best practices, to assist investors desirous of investing in socially responsible companies.
KLD Research Analytics, Inc. created a methodology, which includes companies in its social responsibility indices that have been researched and screened to assist investors who are socially responsible in selecting companies also included in that category (Delmas & Blass, 2010). The analysis of reporting and transparency indicators was based on information available on the
Page 7
Academy of Strategic Management Journal, Volume 13, Number 1, 2014
firm’s website and environmental/social responsibility reports. Toyota for example includes their sustainability report on their web pages for anyone to view (Ketola, 2010). Since 2001 BP has disclosed sustainability and operation information in their Health, Safety, and Environment (HSE) charting tool and in annual reports posted on their website. Shell created a separate link on their website that included additional information that was not included in their sustainability report (Dragomir, 2012). Also, Intel has created a specific website called ExploreIntel.com, which provides year-round real-time reporting of CSR activities (Kruschwitz, 2012c). Constant and repeated communication of environmental and social importance of sustainability must be emphasized to reach and change the culture throughout an organization (Epstein, Buhovac, & Yuthas, 2010).
PURPOSE
The purpose of this paper is to examine what the Fortune 500 companies are reporting on their websites regarding their environmental sustainability activities. After determining the current state of sustainability reporting, we will develop a proposal for future, more detailed research. Several research studies that analyzed annual reports as well as sustainability reports vary by industry, and could be correlated to the industry in which the company engages. Oil and gas, chemical and non-chemical manufacturing companies were more likely to adopt environmental policies than service industries (Ramus & Montiel, 2005). However, oil and gas companies were not likely to implement a policy reducing use of fossil fuels. Another study, (Roca & Searcy, 2012) determined the number of indicators reported differed by industry, with engineering, construction, chemical, banks, as well as oil and gas sectors reported a high number of indicators. Conversely, finance, retail and the food industry reported few indicators in their annual reports and/or accountability reports. Hubbard (2011) also indicates the U.S. food industry is far behind in what they include in sustainability reports. In fact, Hubbard states that overall, the US is far behind Europe in sustainability reporting. He concluded that most US companies are more concerned with presenting a positive image, that sustainability reports are more marketing documents rather than true sustainability reports, and determined a great deal of the information would be classified as greenwash. In addition to the impact of industry, Morehardt, Baird and Freeman, (2002) found the adoption of an environmental policy is associated with firm size, and that large, well-financed firms are more likely to adopt an environmental policy.
Based upon these findings, this research is an exploratory study designed to examine what types of sustainable activities companies report on their website. We established eight categories of sustainable actions companies might report: adapting methods of producing their products (product) to be a sustainable product; changing methods and operations of production (production) to be more sustainable and environmentally responsible; implementing facility design and operations changes to be more environmentally sustainable (plant); being innovative and proactive with members of the supply chain and logistics operations to increase sustainable practices (supply
Page 8
Academy of Strategic Management Journal, Volume 13, Number 1, 2014
chain); facilitating recycling actions across the organization (recycle); providing the means and opportunity for their customers and consumers to recycle or otherwise act in a more environmentally sustainable way (consumer); using social and community engagement to encourage consumers to be more environmentally responsible (social); and finally, if the website material was deemed to be more promotional and image building, rather than providing actual procedures that are sustainable the site was labeled as greenwashing (greenwash). Since both the size of the corporation and the relevant industry appear to be influential in sustainability reporting, the companies were placed in quintiles, based upon Fortune 500 ranking, and categorized by industry. The companies are classified by Fortune into 65 different industries, many with only five or fewer companies. For the purpose of this analysis, published industry categories were collapsed into twelve more generalized categories. Finally, the number of different types of sustainable activities reported by the individual corporations was summed into a new variable (Green), with a range of 1-7. Research Questions
The research questions this study attempts to answer are:
1. What sustainable actions are Fortune 500 companies reporting? a. (product, production, plant, supply chain, recycle, consumer, social, greenwash)
2. How many of the Fortune 500 companies report one or more of these sustainable actions? 3. Does the industry in which the company operates influence what sustainable actions they report? 4. Does size of the firm (Fortune 500 ranking) influence what sustainable actions the companies report?
PRELIMINARY METHODOLOGY
The corporate websites for each company listed on the 2011 Fortune 500 list were
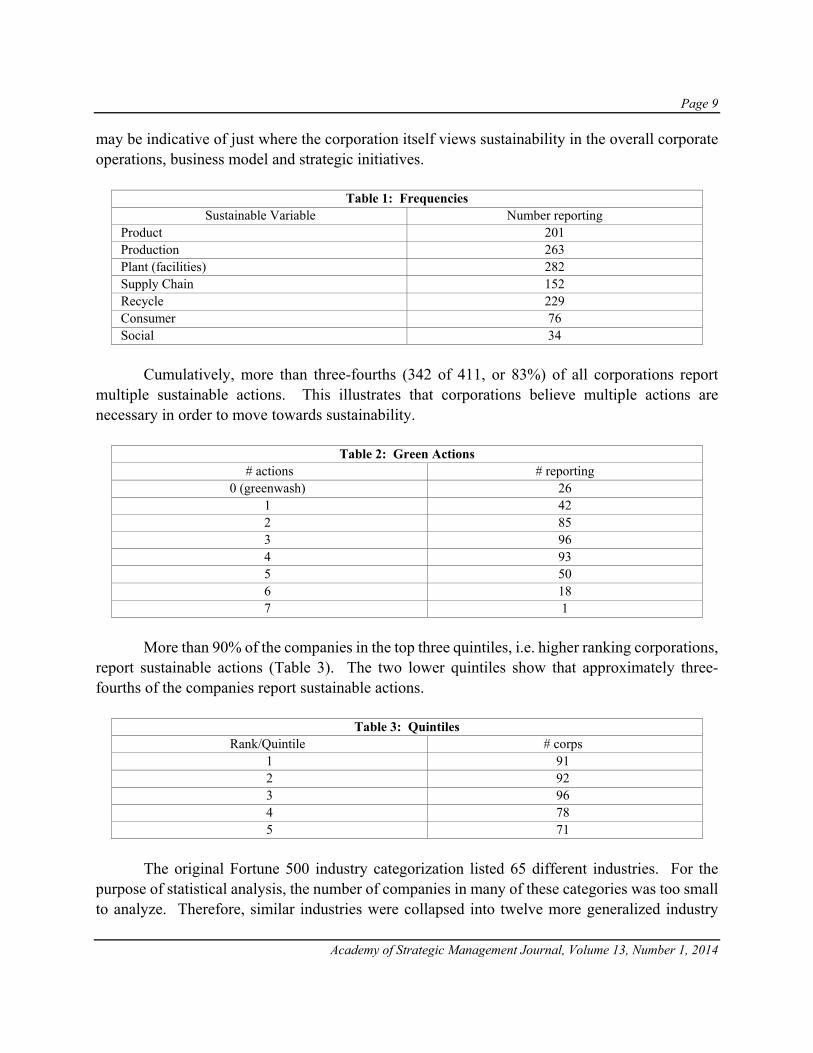
reviewed by three trained data collectors. Each data collector analyzed the corporate website for publicly posted information regarding sustainable activities. This was usually posted under corporate information, and in some cases termed sustainability policy, or was found in social responsibility. After all data were collected individually, a fourth researcher compared the responses and determined a point of agreement. If the three data collectors’ reviews were consistent, then this was deemed correct; if however there were difference, these sites were re-analyzed by the fourth researcher, in consultation with the data collector and reconciled. A total of 411 companies had information posted about their sustainable actions. As noted in Table 1, very few corporations included actions that provided consumers an opportunity to be sustainable, as well as using social means to encourage sustainable actions. However, when it came to the plant or facilities, or actual production operations, over one half of corporations’ efforts were found to be in these initiatives closely followed by recycling efforts and the product itself. These results
Page 9
Academy of Strategic Management Journal, Volume 13, Number 1, 2014
may be indicative of just where the corporation itself views sustainability in the overall corporate operations, business model and strategic initiatives.
Table 1: Frequencies Sustainable Variable Number reporting
Product 201 Production 263 Plant (facilities) 282 Supply Chain 152 Recycle 229 Consumer 76 Social 34
Cumulatively, more than three-fourths (342 of 411, or 83%) of all corporations report
multiple sustainable actions. This illustrates that corporations believe multiple actions are necessary in order to move towards sustainability.
More than 90% of the companies in the top three quintiles, i.e. higher ranking corporations,
report sustainable actions (Table 3). The two lower quintiles show that approximately three-fourths of the companies report sustainable actions.
Table 3: Quintiles Rank/Quintile # corps
1 91 2 92 3 96 4 78 5 71
The original Fortune 500 industry categorization listed 65 different industries. For the
purpose of statistical analysis, the number of companies in many of these categories was too small to analyze. Therefore, similar industries were collapsed into twelve more generalized industry
Page 10
Academy of Strategic Management Journal, Volume 13, Number 1, 2014
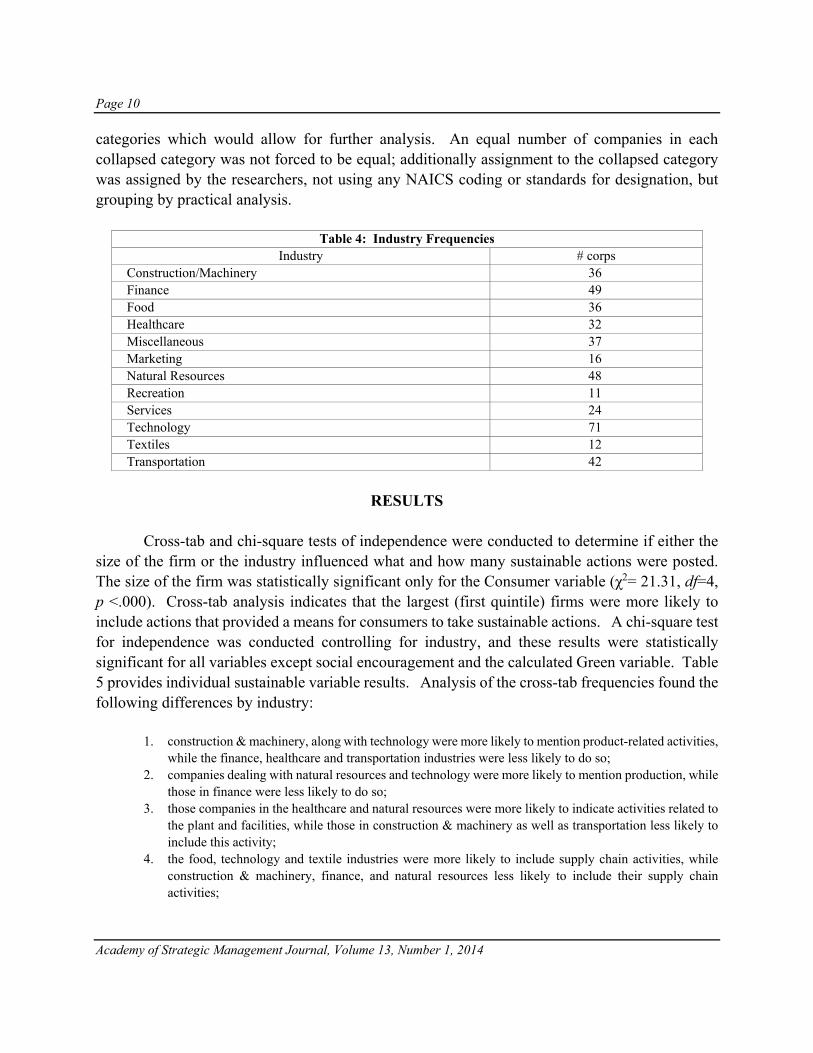
categories which would allow for further analysis. An equal number of companies in each collapsed category was not forced to be equal; additionally assignment to the collapsed category was assigned by the researchers, not using any NAICS coding or standards for designation, but grouping by practical analysis.
Cross-tab and chi-square tests of independence were conducted to determine if either the
size of the firm or the industry influenced what and how many sustainable actions were posted. The size of the firm was statistically significant only for the Consumer variable (χ2= 21.31, df=4, p <.000). Cross-tab analysis indicates that the largest (first quintile) firms were more likely to include actions that provided a means for consumers to take sustainable actions. A chi-square test for independence was conducted controlling for industry, and these results were statistically significant for all variables except social encouragement and the calculated Green variable. Table 5 provides individual sustainable variable results. Analysis of the cross-tab frequencies found the following differences by industry:
1. construction & machinery, along with technology were more likely to mention product-related activities, while the finance, healthcare and transportation industries were less likely to do so;
2. companies dealing with natural resources and technology were more likely to mention production, while those in finance were less likely to do so;
3. those companies in the healthcare and natural resources were more likely to indicate activities related to the plant and facilities, while those in construction & machinery as well as transportation less likely to include this activity;
4. the food, technology and textile industries were more likely to include supply chain activities, while construction & machinery, finance, and natural resources less likely to include their supply chain activities;
Page 11
Academy of Strategic Management Journal, Volume 13, Number 1, 2014
5. the finance, services and textile industries were more likely to recycle, while the construction & machinery, natural resources, technology and transportation industries were less likely to recycle;
6. the technology industry was more likely to provide means to allow consumers to be sustainable, while the construction & machinery, healthcare, marketing, services and transportation industries less likely to provide means for consumers to be sustainable.
Recent reports indicate sustainability is on the corporate agenda (Epstein et al., 2010;
Heffes, 2010), with more than one quarter (28%) of corporate executives planning to increase focus on green initiatives, and upper management realizes the advantage of sustainability initiatives. Furthermore, environmental sustainability can be a source of competitive advantage (Matthews & Rusinko, 2010; Nidumolu, Prahalad, & Rangaswami, 2009; Ross, 2010). In addition, Nidumolu, Prahalad and Rangaswami (2009) purport that sustainability is rooted in organizational and technological innovation, as sustainable practices and activities lower costs because companies reduce the inputs they need as well as generating additional revenues from better products. Additionally, Ladd (2010) posits that companies generally make more money when they “do the right thing.” Pollution is waste, and therefore inefficient. It’s simply not profitable to be inefficient. There seems to be a sense among Americans that suggests the public wants changes that are green but tend to be less demanding, referred to as “lighter greens” and others who are more demanding about green initiatives are called “true greeners” (Oates et al., 2008).
FUTURE RESEARCH Reporting Indexes and Databases
There are several reporting agencies/groups which provide guidelines and statistics for sustainability reports. For example, CRD Analytics maintains the Global Sustainability 50 Index (Ladd, 2010). The Roberts Environmental Center publishes the Pacific Sustainability Index (Lee & Pati, 2012), which analyzes the effect of environmental and social performance of a form on the firm’s overall performance measures, as well as providing “scoring” of various industries. Within
Page 12
Academy of Strategic Management Journal, Volume 13, Number 1, 2014
the environmental area of assessment the center reports on accountability, management, vision and policy, along with resource utilization and emissions data by industry sector. Lee & Pati (2012) focused on the triple bottom line, financial, environmental and societal performance, and reported that information from the REC data indicates enhancement of corporate sustainability efforts helps explain firm performance, because there was a strong evidence of a direct relationship between environmental and social sustainability factors in the Pacific Sustainability Index and market performance. The most dominant reporting regulations are those of the Global Reporting Initiative (GRI) (Ballou et al., 2006), which was launched in 1997, with the goal of enhancing the quality, rigor and utility of sustainability reporting. There were nearly 1000 international companies from more than 60 countries that had registered with the GRI by 2006. The GRI is an independent global organization that has established the de facto standards for sustainability reporting (D'Aquila, 2012). Dilling (2010) recently examined the characteristics of corporations that provide high quality sustainability reports, using the GRI 2007 G3 report list. The G3 is the third and latest version of the GRI Sustainability Reporting guidelines and framework for voluntary corporate sustainability reports. Findings indicate that corporations which publish a G3 report have certain characteristics, related to location, sector or industry, profitability and growth. D ’Aquila (2012) also reported that KPMG’s International Survey of Corporate Responsibility Reporting found that in 2001 95% of Fortune Global 250 corporations incorporated their social responsibility information in the corporate annual report. By 2008, KPMG reported that 80% of Global Fortune 250 corporations issued standalone documents for CSR reports in addition to the annual report (Bell & Lundblad, 2011). By 2011, KPMG reported that the number of multinational corporations providing CSR reports has continued to increase since its last survey in 2008 and goes on to say that what once was considered to be a nice activity has become almost mandatory for most multinational companies regardless of where they operate around the world. Thus, the KPMG International Corporate Responsibility Reporting Survey 2011 is recognized as the world’s largest and most comprehensive survey of Corporate Responsibility (CR) reporting trends ever published ("KPMG International Survey of Corporate Responsibility Reporting 2011," 2011). The CorporateRegister.com is the largest global repository of sustainability report (Burnett et al., 2011; Hubbard, 2011), with more than 21,000 corporate reports on file. In addition to all of these reporting agencies, and to illustrate the increasing importance of sustainability, in 1999, The Dow Jones Sustainability Group Indexes (DJSGI) was the first global index created to track the financial performance of leading sustainability driven companies worldwide (Shih-Fang & Her-Jiun, 2007).
The fact that several reporting agencies maintain either a repository of corporate sustainability reports, or index of such companies, leads to a possible research venture which could investigate which index or report listing include corporations appearing on the Fortune 500 list. The specific research questions posed to answer are:
1) Which Fortune 500 companies appear in the GRI Sustainability Disclosure Database
(http://database.globalreporting.org)?
Page 13
Academy of Strategic Management Journal, Volume 13, Number 1, 2014
2) Which Fortune 500 companies appear in the CorporateRegister.com database? 3) Which Fortune 500 companies have been rated on the Pacific Sustainability Index on the Roberts
Environmental Center website? 4) Is there consistency in the individual reports of corporations which appear on one or more of these
databases?
Level of “Greenness” or Sustainability
Corporate sustainability may be addressed from the perspective of “stages of development” (Kashmanian, Wells, & Keenan, 2011; Nidumolu et al., 2009). The early stage of sustainable action at the corporate level is implemented based upon compliance with regulations. As time progresses, the corporation focuses on reduction of consumption, in particular non-renewable resources. Consumption is considered a prominent aspect of sustainability (Oates et al., 2008). As sustainability becomes more integrated within the organization and operations, manufacturing processes, value chain/supply chain are revised to integrate sustainable practices. The concept spreads across the organization, designing sustainable products and services, and becomes integrated across all business functions, becoming part of the business model. The integration of sustainability across the organization leads to engaging consumers and suppliers to do the same. As a result, in the short-term, the focus is on improving efficiency expands and results in increased revenues, as well as the establishment of a publicly available sustainability policy. This provides a direction or sustainability path for the company, as well as identifying where the company has made a commitment to improve performance, in the long run with consideration given to future product offering; which could result in the goal of achieving a competitive advantage over other companies. The importance of the life-cycle stage of products takes into consideration all stages of the environmental impact the product creates.
A similar, but somewhat different approach to the stages of corporate sustainability commitment is presented by Lubin and Esty (2010), based loosely on the four principles of value creation. These authors propose that the path to riding the sustainability wave is comprised of four stage of value creation. The first stage is to do old things in new ways by outperforming competitors on regulatory compliance and environmental-related costs and risk management. The second stage is to do new things in new ways, which means firms engage in widespread redesign of products, processes as well as optimizing natural resources efficiencies and risk management across their value chain. The third stage transforms the core business, as sustainable innovations provide new revenues and growth. Finally, the fourth stage created a new business model as well as differentiation. In this highest stage of sustainable development, firms can exploit the trend as a source of differentiation in the business model, brand, employee engagements, which fundamentally repositions the company and redefines its strategy for competitive advantage. A more sophisticated matrix describing the level of economic sustainability has been developed by Baumgartner and Ebner (2010). Again, the overall schema is developed upon a four-tier level of sustainability, beginning, elementary, satisfying, and sophisticated. However, the authors also
Page 14
Academy of Strategic Management Journal, Volume 13, Number 1, 2014
then develop a matrix which addresses actions across the organization, from innovation and technology, sustainability reporting, to product and process actions, to waste and emissions.
Future research might examine the sustainability actions and classify the corporations by level of “greenness” based upon one or more of these “classification systems.” After reviewing the above literature, it would seem logical to develop a four-stage system, from a basic, legal and regulatory perspective, to a fully integrated, corporate-wide strategy which provides competitive advantage and a new corporate perspective. This review should answer this proposed research question: 5) Is the stage of sustainable adoption influenced by industry, and/or size of the corporation (based upon rank), on the Fortune 500 list?
Any future research should further refine the industry classification used for analysis. While the individual industry classifications are the most useful, they are also too individualized for statistical analysis. While the industry classifications used in the preliminary study were useful for initial data analysis, perhaps aligning categories with those used in the Pacific Sustainability Index would be a place to start, but additional categorization may be needed. As with all research which addresses a changing environment, developing a longitudinal study could provide insights how corporations continue to respond to sustainable initiatives. Accessibility of Website Information
Wheeler and Elkington (2001) predict that the future of corporate environmental reporting will be interactive and online, given the “wired” environment in which we live. Using online communication with stakeholders, including investors, consumers and employees provides flexibility across the corporation as well as large complex business entities. Morhardt (2010) analyzed and scored the environmental and social performance reports on corporate internet sites. While the content of the information presented is important, how easily accessible the information is to the website visitor impacts both access and perception of corporate intentions. Future research might examine how easily the information can be found. Specific questions to answer are:
6) How many clicks (pages deep) from the home page? 7) What title/subject is used to identify the sustainability information 8) Is there a section on the website for sustainability?
a. or is the information contained inside an annual corporate report, such as a Corporate Sustainability Report?
CONCLUSION
MIT Sloan Management Review and Boston Consulting Group have jointly conducted annual surveys of managers and top executives from world-wide corporations asking them about their sustainable business practices (Berns et al., 2009a, 2009b; Dawar & Stornelli, 2013; Haanaes et al., 2011; Hopkins, Haanaes, et al., 2011; Hopkins, Kruschwitz, et al., 2011; Hopkins et al.,
Page 15
Academy of Strategic Management Journal, Volume 13, Number 1, 2014
2009; Kiron, Kruschwitz, Haanaes, & von Streng Velken, 2012; Kiron et al., 2013; Kruschwitz & Velken, 2011). The first survey in 2009, (Berns et al., 2009a, 2009b) found that the large majority (92%) of the executives reported their companies were addressing sustainability, and continuing to do so, despite the economic downturn; less than 25% of the respondents indicated their company had decreased commitment to sustainability. In fact, some sectors such as the automotive industry had actually increased efforts. The majority of actions reported were addressing what was necessary to meet regulatory requirements, and more than 70% of the companies had not developed a clear business case for sustainability. The second survey in 2010 (Haanaes et al., 2011; Hopkins, Haanaes, et al., 2011; Hopkins, Kruschwitz, et al., 2011), found that again, sustainability efforts had survived the economic climate with 59% of the respondents indicated they were increasing their commitment to sustainability. While the study divided the corporations into Embracers and Cautious Adopters, all were seeing the benefits of a sustainable strategy as improving resource efficiency and waste management. In fact, the study noted that members of the C-suite were not embracing the movement based upon environmental concerns, but rather because they perceive sustainability to be essential to being competitive. The report found substantial difference between the two groups, Embracers and Cautious Adopters. The Embracers corporations see great potential in sustainable strategies: deliver new customers, increase market share, and profit margins. Embracers tend to be large global or regional companies, with only nine percent of small companies categorized as Embracers. The companies that fall within this category also tend to resource-intensive industries. This group of companies are also growing and in growth markets, where investment in sustainability come easily. This second study, also found a larger number of those Cautious Adopters, as almost two-thirds (63%) indicated they would be increasing investments in sustainability in 2011. Thus, sustainability continued to have an increased importance corporate strategy and practice. One finding in this annual survey found significant variance across industries. The automotive, chemical, commodities, conglomerate/multi-industry, consumer products, industrial good/machinery retail, and technology/telecommunications industries report indicated their company’s commitment to sustainability had increased over the last year, and would increase in the next year. For some industries, such as chemical and resource-based operations, sustainability is a matured concept. Others, such as the automotive and consumer goods companies, will indicate competitive advantage as the basis for sustainability, while they in fact are no more likely to actually present a business case that supports such actions. The conclusion of the second survey identified specific differences between the embracers, or top performers from the lower-performing, cautious adopters. Top performers innovate more, and achieve competitive differentiation, while placing an emphasis on the long-term. These corporations and their respective leadership are far more convinced that sustainable actions lead to profitability, and they quantify sustainability-related benefits across the board. Embracers assign managers dedicated to sustainability, and rely on leaders as well as non-leadership employees to drive sustainability within and across the corporation. They consider risks,
Page 16
Academy of Strategic Management Journal, Volume 13, Number 1, 2014
intangibles and qualitative factors more formally, and are more confident about the business case for sustainability.
In addition to analyzing what role sustainability played in business actions, this second study also cited several instances of the influence consumers have in the role of corporate sustainability. This second study found that both large and small companies have built sustainability into the brand. Examples of large corporations include General Electric, Walmart and Toyota. Smaller companies include Patagonia and Interface Global. Regardless of which corporate label from the study was applied, across the study, executives cited improved brand reputation, and brand equity as a continued importance for sustainable actions. Beth Spring, executive vice president at Clorox, believe consumer megatrends provided big growth opportunities which reinvigorated Brita water pitchers and filters, and the launch of Green Works, an all-natural clearing product line, as well as the acquisition of Burt’s Bees, an all-natural personal care line (Hopkins, Kruschwitz, et al., 2011).
The third annual survey (Kiron et al., 2012; Kruschwitz & Velken, 2011) reported sustainability has neared a tipping point. More than two-thirds (70%) of the companies surveyed have placed sustainability permanently on their agenda, and many have done so in the past six years. This year, two-thirds of the respondents indicated sustainability was necessary to be competitive in today’s marketplace. Even with this positive perspective of sustainability, it only ranks in eighth place on the corporate agenda. A third category, or group of corporations, was identified in this third survey: Harvesters. Harvesters are profiting from sustainability, and in front others. In these organizations, sustainability relies on the longevity and robustness of the company’s agenda, and ultimately depends upon how well sustainability is embedded in the business processes. Harvesters differ on four points: organizations support, operations, collaborations, and willingness to change the company’s business model, in response to sustainable considerations. There are managerial differences for Harvesters as well: they are 50% more likely to have a CEO committed to sustainability, twice as likely to have a separate sustainability reporting process as well as a separate function for sustainability. They are also more likely to have a Chief Sustainability Officer, as well as having a person in each business unit who is responsible for sustainability. Harvesters accounted for 31% of the respondents, and exist in every industry covered by the survey. Again, this third survey found the role customers play in the corporate sustainability agenda. In fact, 41% of all respondents indicated that customer preferences for sustainable products and services as a reason for changing business models. However, customers are not always willing to pay more for these products, possibly as a result of the recent economic conditions.
Clearly, sustainability has become a part of corporate operations and strategy, and emphasis is expected to increase. In addition, it appears consumers continue to express concern for the environment, as well as the role their consumption plays in growing sustainable efforts. Therefore, continued observation and review of corporate actions, the reporting of these actions and research associated with these actions will remain important to corporate success.
Page 17
Academy of Strategic Management Journal, Volume 13, Number 1, 2014
Establishing corporate sustainability fosters the corporation’s influence on the public perception of the corporate commitment to sustainability (Kashmanian, Wells, & Keenan, 2011). By informing the public and business community of their corporate actions and commitment to sustainbility, companies are encouraging individul and corporate responsibility. Engaging society provides the opportunity to ensure a sound environment and prospersou future (Casimir & Dutilj, 2003).
REFERENCES Ballou, B., Heitger, D. L., Landes, C. E., & Adams, M. (2006). The future of corporate sustainability reporting. Journal
of Accountancy, 202(6), 65-67,70-74. Baumgartner, R. J., & Ebner, D. (2010). Corporate sustainability strategies: Sustainability profiles and maturity levels.
Sustainable Development, 18(2), 76. Bell, J., & Lundblad, H. (2011). A comparison of ExxonMobil's sustainability reporting to outcomes. The Journal of
Applied Business and Economics, 12(1), 17-29. Berns, M., Townsend, A., Khayat, Z., Balagopal, B., Reeves, M., Hopkins, M., & Kruschwitz, N. (2009a). The
business of sustainability: Findings and insights from the first annual business of sustainability survey and the global thought leaders' research project (pp. 1-84). North Holywood, CA: Massachusetts Institute of Technology.
Berns, M., Townsend, A., Khayat, Z., Balagopal, B., Reeves, M., Hopkins, M., & Kruschwitz, N. (2009b). The business of sustainability: Imperatives, advantages, and actions (pp. 1-35). Boston, MA: Boston Consulting Group, Inc.
Borkowski, S. C., Welsh, M. J., & Wentzel, K. (2010). Johnson & Johnson: A model for sustainability reporting. Strategic Finance, 92(3), 29-37.
Burnett, R. D., Skousen, C. J., & Wright, C. J. (2011). Eco-effective management: An empirical link between firm value and corporate sustainability. Accounting & the Public Interest, 11, 1-15.
Casimir, G., & Dutilh, C. (2003). Sustainability: A gender studies perspective*. International Journal of Consumer Studies, 27(4), 316-325.
D'Aquila, J. (2012). Integrating sustainability into the reporting process and elsewhere. The CPA Journal, 82(4), 16-21,24.
Dawar, N., & Stornelli, J. (2013). Rebuilding the relationship between manufacturers and retailers. MIT Sloan Management Review, 54(2), 83-90.
Delmas, M., & Blass, V. D. (2010). Measuring corporate environmental performance: the trade-offs of sustainability ratings. Business Strategy and the Environment, 19(4), 245.
Dilling, P. F. A. (2010). Sustainability reporting in a global context: What are the characteristics of corporations that provide high quality sustainability reports - an empirical analysis. The International Business & Economics Research Journal, 9(1), 19-30.
Dragomir, V. D. (2012). The disclosure of industrial greenhouse gas emissions: A critical assessment of corporate sustainability reports. Journal of Cleaner Production, 29-30, 222-237.
Epstein, M. J., Buhovac, A. R., & Yuthas, K. (2010). Implementing Sustainability: The Role of leadership and organizational culture. Strategic Finance, 91(10), 41-47.
Fromartz, S. (2009). The mini-cases: 5 companies, 5 strategies, 5 transformations. MIT Sloan Management Review, 51(1), 41-45.
Haanaes, K., Arthur, D., Balagopal, B., Kong, M. T., Velken, I., & Hopkins, M. S. (2011). First look: The second annual sustainability & innovation survey. MIT Sloan Management Review, 52(2), 77-83.
Page 18
Academy of Strategic Management Journal, Volume 13, Number 1, 2014
Heffes, E. M. (2010). Sustainability's place on corporate 'to-do' lists. Financial Executive, 26(2), 9-9. Holden, G. (2012). The state of sustainability. Research Technology Management, 55(6), 7-9. Hopkins, M. S., Haanaes, K., Balagopal, B., Velken, I., Kruschwitz, N., & Arthur, D. (2011). New sustainability study:
The embracers seize advantage. MIT Sloan Management Review, 52(3), 23-35. Hopkins, M. S., Kruschwitz, N., Haanaes, K., Kong, M. T., Arthur, D., & Reeves, M. (2011). Sustainability: The
'embracers' seize advantage. MIT Sloan Management Review, 52(3), 3-27. Hopkins, M. S., Townend, A., Khayat, Z., Balagopal, B., Reeves, M., & Berns, M. (2009). The business of
sustainability: What it means to managers now. MIT Sloan Management Review, 51(1), 20-26. Hubbard, G. (2011). The quality of the sustainability reports of large international companies: An analysis.
International Journal of Management, 28(3), 824-848. Huppes, G., & Ishikawa, M. (2005). Why eco-efficiency? Journal of Industrial Ecology, 9(4), 2-5. Kashmanian, R. M., Wells, R. P., & Keenan, C. (2011). Corporate environmental sustainability strategy: Key
elements. Journal of Corporate Citizenship(44), 107-130. Katrinli, A., Gunay, G., & Biresselioglu, M. E. (2011). The convergence of corporate social responsibility and
corporate sustainability: Starbucks corporation's practises. The Business Review, Cambridge, 17(1), 164-171. Ketola, T. (2010). Five leaps to corporate sustainability through a corporate responsibility portfolio matrix. Corporate
Social - Responsibility and Environmental Management, 17(6), 320. Kiron, D., Kruschwitz, N., Haanaes, K., & von Streng Velken, I. (2012). Sustainability nears a tipping point. MIT
Sloan Management Review, 53(2), 69-74. Kiron, D., Kruschwitz, N., Reeves, M., & Goh, E. (2013). The benefits of sustainability-driven innovation. MIT Sloan
Management Review, 54(2), 69-73. Kleine, A., & von Hauff, M. (2009). Sustainability-driven implementation of corporate social responsibility:
Application of the integrative sustainability triangle. Journal of Business Ethics, 85, 517-533. KPMG International Survey of Corporate Responsibility Reporting 2011. (2011). In KPMG.com (Ed.): KPMG
International Cooperative. Kruschwitz, N. (2012a). How an abundance mentality and a CEOs fierce resolve kickstarted CSR at campbell soup.
MIT Sloan Management Review, 54(1), 1-3. Kruschwitz, N. (2012b). How Dell turned bamboo and mushrooms into environmental-friendly packaging. MIT Sloan
Management Review, 54(1), 1-5. Kruschwitz, N. (2012c). Integrating sustainability into strategy, governance and employee engagement. MIT Sloan
Management Review, 53(4), 1-3. Kruschwitz, N. (2012d). Why Kraft Foods cares about fair trade chocolate. MIT Sloan Management Review, 54(1), 1-
4. Kruschwitz, N. (2013). New ways to engage employees, suppliers and competitors in CSR. MIT Sloan Management
Review, 54(2), 1-3. Kruschwitz, N., & Velken, I. (2011). First look: highlights from the third annual sustainability global executive survey.
MIT Sloan Management Review, 53(1), 87-89. Ladd, S. (2010). Corporate "greening". Financial Executive, 26(2), 36-41. Lee, J., & Pati, N. (2012). New insights on the operational links between corporate sustainability and firm performance
in service industries. International Journal of Business Insights & Transformation, 4, 80-93. Loch, R., & Buhay, M. C. (2012). 2012 Gibbs & Soell sense & sustainability study: Perspectives on corporate
sustainability among consumers and executives. In I. Gibbs & Soell (Ed.). Lozano, R. (2012). Orchestrating organisational changes for corporate sustainability. Greener Management
International(57), 43-64. Lubin, D. A., & Esty, D. C. (2010). The sustainability imperative. Harvard Business Review, 88(5), 42-50. Matthews, J. O., & Rusinko, C. A. (2010). Linking sustainability and financial valuation: Six necessary conditions.
Journal of Investing, 19(3), 128-135,126,128.
Page 19
Academy of Strategic Management Journal, Volume 13, Number 1, 2014
Merchant, B. (2009). Walmart's sustainability index: The greenest thing ever to happen to retail? Retrieved January 29, 2013, from http://www.treehugger.com/corporate-responsibility/walmarts-sustainability-index-the-greenest-thing-ever-to-happen-to-retail.html
Montiel, I. (2008). Corporate social responsibility and corporate sustainability separate pasts, common futures. Organization & Environment, 21(3), 245-269.
Morhardt, J. E. (2010). Corporate social responsibility and sustainability reporting on the internet. Business Strategy & the Environment (John Wiley & Sons, Inc), 19(7), 436-452.
Morhardt, J. E., Baird, S., & Freeman, K. (2002). Scoring corporate environmental and sustainability reports using GRI 2000, ISO 14031 and other criteria. Corporate Social - Responsibility and Environmental Management, 9(4), 215-215.
Nidumolu, R., Prahalad, C. K., & Rangaswami, M. R. (2009). Why sutainability is now the key driver of innovation. Harvard Business Review, 87(9), 56-64.
Oates, C., McDonald, S., Alevizou, P., Kumju, H., Young, W., & McMorland, L.-A. (2008). Marketing sustainability: Use of information sources and degrees of voluntary simplicity. Journal of Marketing Communications, 14(5), 351-365.
. Overview of the UN Global Compact. (2011, December 1) Retrieved February 5, 2013, from http://www.unglobalcompact.org/AboutTheGC/index.html
Ramus, C. A., & Montiel, I. (2005). When are corporate environmental policies a form of greenwashing? Business and Society, 44(4), 377-414.
Reilly, A. H. (2009). Communicating sustainability initiatives in corporate reports: Linking implications to organizational change. S.A.M. Advanced Management Journal, 74(3), 33-43,32.
Roca, L. C., & Searcy, C. (2012). An analysis of indicators disclosed in corporate sustainability reports. Journal of Cleaner Production, 20(1), 103-118.
Ross, L. (2010). Accounting For Sustainability. Financial Management, 31-32. Rowbottom, N., & Lymer, A. (2009). Exploring the use of online corporate sustainability information. Accounting
Forum, 33(2), 176-186. SCA survey conducted by Harris Interactive® shows that despite a weakened economy, U.S. consumers willing to
spend green to go green. (2008, April 21) Retrieved January 28, 2012, from http://www.prnewswire.com/news-releases/sca-survey-conducted-by-harris-interactiver-shows-that-despite-a-weakened-economy-us-consumers-willing-to-spend-green-to-go-green-57470917.html
SCA survey finds two-thirds of American adults purchase green products. (2012). Tork News. Retrieved from http://betterbusiness.torkusa.com/green-business-survey-tork-bbc/
Shih-Fang, L., & Her-Jiun, S. (2007). Is corporate sustainability a value-increasing strategy for business? Corporate Governance: An International Review, 15(2), 345-358.
Sobhani, F. A., Amran, A., & Zainuddin, Y. (2012). Sustainability disclosure in annual reports and websites: a study of the banking industry in Bangladesh. Journal of Cleaner Production, 23(1), 75-85.
Stafford, E. R., & Hartman, C. L. (2013). Promoting the value of sustainably minded purchase behaviors. Marketing News, 47, 28-33.
Steinberg, K. (2011, January 10). Fewer Americans "going green" Retrieved January 28, 2012, from http://www.harrisinteractive.com/NewsRoom/HarrisPolls/tabid/447/mid/1508/articleId/667/ctl/ReadCustom%20Default/Default.aspx
Steinberg, K. (2012, April 18). Fewer Americans "thinking green" Retrieved January 28, 2012, from www.harrisinteractive.com/NewsRoom/HarrisPolls/tabid/447/ctl/ReadCustom Default/mid/1508/ArticleId/1009/Default.aspx
. Sustainability Incex. (2012) Retrieved February 1, 2013, from http://corporate.walmart.com/global-responsibility/environment-sustainability/sustainability-index
Page 20
Academy of Strategic Management Journal, Volume 13, Number 1, 2014
Walsh, H., & Dowding, T. J. (2012). Sustainability and the coca-cola company: The global water crisis and coca-cola's business case for water stewardship. International Journal of Business Insights & Transformation, 4, 106-118.
Watson, M. (2011). Doing well by doing good: Ray C. Anderson as evangelist for corporate sustainability. Business Communication Quarterly, 74(1), 63-67.
Wheeler, D., & Elkington, J. (2001). The end of the corporate environmental report? Or the advent of cybernetic sustainability reporting and communication. Business Strategy and the Environment, 10(1), 1-14.
Young, W., & Tilley, F. (2006). Can businesses move beyond efficiency? The shift toward effectiveness and equity in the corporate sustainability debate. Business Strategy and the Environment, 15(2), 402-415.
Page 21
Academy of Strategic Management Journal, Volume 13, Number 1, 2014
DOES COMPANY SIZE AFFECT MISSION STATEMENT CONTENT?
Darwin L. King, St. Bonaventure University
Carl J. Case, St. Bonaventure University Kathleen M. Premo, St. Bonaventure University
ABSTRACT
Mission statements are probably the most important communication issued by a firm to all
of its many stakeholders. Missions provide the reason why the firm is in existence. This paper is a continuation of the mission statement research that the authors have conducted over the last twelve years. Previous studies have reviewed mission statements from the largest corporations in countries including Canada, United Kingdom, France, Germany, Australia, Japan, China, Brazil, and India. This study considers United States’ businesses only. The intent of the authors is to determine if the size of the company affects the content of the mission statement.
The authors have conducted research on mission statements in 2001, 2008, 2010, 2011, and 2012 that has been published in various Allied Academies’ journals. The majority of the articles have appeared in the Academy of Strategic Management Journal (ASMJ). The mission statement comparisons have emphasized two distinct areas, namely, the stakeholders mentioned in the mission statements and the named goals and objectives of the company. The stakeholders and goals/objectives emphasis is continued in this paper.
The authors again used the Fortune 500 list to determine the largest firms in the United States. In this study, the largest 100 firms are compared with the last 100 companies in the Fortune 500 list (numbers 401-500). The authors hope to determine if size does affect the stakeholders and goals/objectives mentioned in the firm’s mission statement. Stakeholders identified included communities, customers, employees, stockholders/stakeholders, and suppliers/partners. Identified goals and objectives included affordability of products or services, following core values, striving for diversity, maintaining efficient operations, concern for the environment, maintaining ethical operations, striving for global operations, maintaining innovation, maintaining a leadership position, an emphasis on profitability/profits, desire to produce a quality product or service that provided value to customers, producing a safe product, an emphasis on teamwork, and the desire to gain the trust of stakeholders. Significant differences were identified in the mission statement content of these two groups of firms and are discussed in this paper.
INTRODUCTION For at least the last 40 years, the company’s mission statement has served as the primary
communication tool to explain to all stakeholders what the firm is all about. It states the reason for the firm’s existence. Peter Drucker, who is often considered the “father of management,” wrote extensively about mission statements. He felt that missions are the “foundation for priorities,
Page 22
Academy of Strategic Management Journal, Volume 13, Number 1, 2014
strategies, plans, and work assignments” (Drucker, 1974). Drucker felt that mission statements differentiated firms and gave them their own personality. Drucker felt that the mission statement should serve as the foundation for the creation of company strategies and policies. If the emphasis in the mission statement was on customers, it was only logical that the firm’s policies and strategies should emphasize that stakeholder’s importance.
Drucker established the Leader to Leader Institute that emphasized the importance of the mission statement. Drucker felt that mission statements should be short and to the point. He suggested that the mission statement should be only 3 or 4 sentences in length. He believed that these few sentences should address four aspects about the firm including who are we, what do we do, what do we stand for, and why do we do what we do. This is a lot to expect from a single paragraph of only 3 or 4 sentences. Drucker felt that a good mission statement should specifically name the firm’s most important stakeholders.
Fred David believes that mission statements should include the firm’s basic purpose, its unique qualities or strengths, its values, its core stakeholders, and its major goals or objectives (David, 2005). Although they are known by many names including creed statements, statements of belief, and statements of business purpose, these critical communications must inform all stakeholders about the nature and character of the company. David also believes that mission statements must explain the organization’s “reason for being” (David, 2009). In this process, he feels that mission statements should clearly state who the firm seeks to serve, so the naming of stakeholders is especially important. Many authors feel that the goals and objectives of the firm must mirror the content of the mission statement (Robbins & Coulter, 2012). Robbins & Coulter feel that the mission statements must disclose the organization’s purpose or reason for being. This serves as a guidebook to all employees of the company in the process of establishing corporate policies and strategies. Other authors including Annie McKee feel that the mission statement provides the focus for the firm (McKee, 2012). Without a well written mission statement, the organization, in effect, has lost its compass. McKee emphasizes that the mission statement should describe what the firm considers important, what it does, and what it stands for. She, along with many other authors, feels that mission statements should be used by managers in the process of establishing and following short and long term objectives. Another author on mission statements, Jeffery Abrahams, has researched over 300 of the largest U.S. firms’ statements (Abrahams, 1999). Following this analysis, he felt that a good mission statement reflects the values of the firm and provides stakeholders with a statement of purpose. Others, including Samuel and S. Trevis Certo, believe that the mission statement is a critical part of the strategic management process (S. & S.T. Certo, 2012).
Many authors feel that the strategic management process requires a carefully constructed mission statement to provide direction to all employees and managers. Hitt, Black, and Porter support this belief and stress that an effective mission statement must describe the central purpose of the company (M.A. Hitt, J.S. Black & L.W. Porter, 2012). Rarick and Vitton feel that mission statements should include important aspects of the company including company core philosophy, customer markets served, major products or services produced, and concern for the environment and the communities in which the firm operates (Rarick and Vitton, 1995).
Page 23
Academy of Strategic Management Journal, Volume 13, Number 1, 2014
Other authors including Thompson, et.al. emphasize that mission statements should clearly describe the current business and purpose of the firm (Thompson, et.al. 2012). These authors feel that a well written mission statement gives the company its unique identity. Another group of authors, Schermerhorn, et. al., feel that well written mission statements describe who the firm seeks to serve and what is the overall organizational purpose (Schermerhorn, et.al.). Finally, Wheelen and Hunger argue that an efficient and effective mission statement describes the fundamental or unique purpose of the organization (Wheelen and Hunger, 2010). They feel that this provides the unique personality of the firm that sets the company apart from all others.
Following a brief summary of previous mission statement research, the authors summarize the similarities and differences among the top 100 Fortune firms and those that are listed on the Fortune 500 list in positions from 401 to 500. There are many significant differences from the largest companies and those that are significantly smaller in size. Finally, the appendix contains a listing of the 200 firms used in this study.
PREVIOUS MISSION STATEMENT RESEARCH The authors began their mission statement research twelve years ago. Five of the authors’ mission statement articles have been published in the Academy of Managerial Communications Journal (King, 2001) and the Academy of Strategic Management Journal (King, Case & Premo, 2010), (King, Case & Premo, 2011), (King, Case & Premo, 2012) and (King, Case & Premo, 2013). This mission statement research has increased in size over the years with the most current study involving a review of ten countries’ mission statements. These five research projects are briefly summarized in the following paragraphs.
The authors’ first study in 2001 involved a review of the Fortune 100 firms in the United States for that year. The authors reviewed the stakeholders specifically named in the mission statement as well as identified goals and objectives of the firm. This will be compared with the 2012 mission statements from the Fortune 100 companies. Table 1 shows that the most commonly identified stakeholder in 2001 was the customer with 61% of the firms identifying the importance of the marketing concept. As far as goals and objectives mentioned, providing a quality product or service and following established core values were most common. Notice that the goal of conducting ethical operations only appeared in 3% of the missions. Possibly the reason for this is that the Sarbanes-Oxley Act was not enacted until 2002.
Table 1: 2001 Fortune 100 - Mission Statements That Included Stakeholders Percent Goal/Objective Percent
Academy of Strategic Management Journal, Volume 13, Number 1, 2014
The authors’ second mission statement study reviewed the top 50 Fortune listed companies in 2008. Table 2 is converted into percentages rather than the actual number of firms including each item. Again, the most commonly mentioned stakeholder is customers followed by employees and communities. Notice that the number of firms listing community or communities increased from 6% in 2001 to 30% in 2008. The most common goals and objectives in 2008 were providing a quality product or service (52%) and conducting global operations (34%). These goals were closely followed by the importance of ethics and ethical operations (30%). The increase emphasis on ethical behavior (3% in 2001 to 30% in 2008 is likely the result, at least in part, to the passage of the Sarbanes-Oxley Act in 2002.
Table 2: 2008 Fortune Top 50 - Mission Statements That Included Stakeholders Percent Goal/Objective Percent
Table 3 directly compares the results from 2001 and 2008 in a format where it is easier to observe major differences. Firms continue to emphasize the “marketing concept” and realize that the premier stakeholder is definitely the customer. Any firm that fails to meet the needs and wants of the customer will soon find itself out of business. As mentioned above, communities and ethics were included significantly more in the 2008 mission statements.
Table 3: Percentages of U.S. Mission Statements Containing the Following Words Stakeholders 2001 Study 2008 Study
The authors also reviewed the mission statements of the 25 largest firms in the U.S. in
2010 and 2011. The 2010 study included a comparison with the largest corporations in Australia,
Page 25
Academy of Strategic Management Journal, Volume 13, Number 1, 2014
Canada, and Great Britain (King, Case & Premo, 2010). The authors compared the mission statements of these four English speaking countries in an effort to discover similarities and differences. The 2011 study summarized the 2011 missions of the biggest 25 firms in the United States with those of the largest firms in France, Germany, Japan, and China (King, Case & Premo, 2011). The 2012 study included mission statements from the United States as well as nine other countries. Table 4 summarizes the mission statements of the largest U.S. firms in 2001, 2008, 2010, 2011, and 2012.
Table 4: Percentages of U.S. Mission Statements Containing the Following Words
This table shows that the most commonly included stakeholders over this twelve year
period are customers, communities, stockholders, and employees. Customers, not surprisingly, are mentioned in the mission statements far more than any other stakeholder (over 60% in each year). Community or communities is still a commonly included stakeholder; however, it has dropped from its 2010 level of 40% to 28% in 2011 and 2012. Employees are mentioned less often in recent years dropping from a high of 34% in 2008 to 16% in 2011 and 2012. Stockholders/shareholders are also included less frequently slipping from the high of 34% in 2001 to 20% in 2012. A review of the goals and objectives mentioned in these mission statements reveals that the goal of providing a quality product or service that represents value to customers is the most commonly stated goal along with achieving or maintaining a leadership position (both 32% in the 2012 study). Being ethical and maintaining ethical practices has been consistent at 28% for the years 2010, 2011, and 2012. Interestingly, technology was mentioned in 14% of missions in 2001 and not included in any statements reviewed in 2010, 2011, and 2012. The following section of this paper summarizes the mission statements that were available on the Fortune 500 companys’ websites in February 2013. The authors will refer to these as 2013 mission statements, although in many cases, the webpage listed them as still of 2012 vintage. In any event, the following summarizes the mission statements of Fortune 1-100 and Fortune 401-500 firms as of February 2013.
Page 26
Academy of Strategic Management Journal, Volume 13, Number 1, 2014
2013 FORTUNE 500 FIRMS: COMPARING 1-100 AND 401-500 LISTED FIRMS
The authors’ goal for this study was to compare and contrast the very largest U.S. firms who were listed on the 2012 Fortune 500 website in positions from 1 to 100. The result of this analysis is then compared to the smaller 100 firms on the Fortune 500 list ranking in positions from 401 to 500. The following table summarizes the number of firms that identified the stakeholders and goals/objectives discussed above with a few additional items. For the 2013 mission statement analysis, the stakeholder groups included communities, customers, employees, stockholders/shareholders, and suppliers/vendors/partners. The goal and objective classes included affordability, core values, diversity, efficiency/effectiveness, environmental or earth friendly, global operations, growth/expansion, innovation, leader/leadership, profits/profitability, quality/value/service, safety/safe products, teamwork, and trust. Table 5 includes a summary of these 200 mission statements.
Table 5: Percentages of 2013 Mission Statements Including the Following Terms
A few comments are in order concerning the stakeholders named in the missions of these two groups of firms. First, the largest firms, that include Fortune #1-100 companies, most commonly include customers and employees. This is also true for the smaller size firms, numbers 401-500, but the percentages for these smaller firms are significantly higher. For example, customers were identified in 75% of the smaller firms’ missions but only in 64% of the largest
Page 27
Academy of Strategic Management Journal, Volume 13, Number 1, 2014
firms. This is a fairly significant difference with the smaller firms naming customers in 75% of their mission statements. This is certainly reasonable given the fact that large corporations must constantly realize that to stay successful, they must identify and meet the needs and wants of their target market customers.
Employees are included in 34% of the largest firms’ mission statements while 42% of the smaller companies incorporated this stakeholder. This shows that a significant percentage of these corporations realize the importance of competent employees. A review of the stakeholder section of Table 5 shows that smaller firms (401-500) identified each class of stakeholder more often than the largest organizations. Except for suppliers and community, there is a material difference between these two groups of companies. It appears that the smaller firms chose to identify stakeholders more often than that of their “big brothers.” In many cases, these smaller firms published a longer and more detailed mission statement. A review of the goal and objective section of Table 5 shows a number of significant differences between the largest and smaller companies. For example, the goal of providing a quality product or service that provides value to customers is mentioned in 49% of the smaller firms’ missions but in only 30% of the largest organizations. The desire to conduct global operations was included in 40% of the smaller firms’ missions but was only included in 34% of the largest companies’ statements. The largest percentage difference between the two groups of firms concerned the goal of growth or expansion of operations. This was an identified goal in 24% of the smaller firms’ statements but was only mentioned in 12% of the largest companies’ missions. This is probably logical that the smaller firms have the desire to grow in size and approach the scale of the top 100 firms. Another significant difference pertains to the goal of maintaining teamwork within the organization and when working with suppliers and vendors. The largest firms mentioned teamwork in only 10% of their missions while the smaller firms included this goal in 17% of their statements. The goal of efficient or effective operations was included in only 5% of the largest firms’ missions while it appeared in 12% of the smaller firms. Trust was included in many more of the smaller firms compared to the largest organizations (12% smaller to 5% for largest). Innovation was included in 18% of the firms’ missions in both groups of companies. This is the only goal that was equally represented in both groups of firms. The majority of other goals including core values, diversity, environment or earth friendly, and ethical operations were very comparable in percentage. The authors were a bit surprised by the fact that only 9% of the largest firms and 12% of the smaller companies identified a concern for the environment and the desire to conduct earth friendly operations as an identified goal. One goal identified in this study that has recently begun to appear in mission statements concerns diversity. Firms realize that hiring a diverse workforce often provides a wealth of benefits. Finally, two other goals that have only been identified in the last few years are teamwork and trust. Table 6 below shows the order of stakeholder ranking for both the largest of firms and the smaller companies. Notice that the ranking of these stakeholders is exactly the same for both groups of companies. Both the largest and smaller firms realize the importance of considering their customers and employees.
Page 28
Academy of Strategic Management Journal, Volume 13, Number 1, 2014
Table 6: Stakeholder Rankings by Frequency
Stakeholder Fortune 1-100 Fortune 401-500 First Customers Customers Second Employees Employees Third Stockholders/Stakeholders Stockholders/Stakeholders Fourth Community/ Communities Community/Communities Fifth Suppliers Suppliers
Table 7 lists the most commonly identified goal or objective for both classes of firms. There are some differences between the two groups of firms as far as the frequency of listing the companies’ goals and objectives. For example, the most included goal or objective for the largest firms was the desire to conduct business operations on a global scale. The smaller firms most often included the goal of providing a quality product or service that provides value to their customers. The third and fourth most frequently listed goal or objective was to have a leadership position (#3) and conduct ethical business operations (#4) for both groups of firms. The fifth and sixth positions were reversed for the two size groups with the largest companies listing innovation ahead of growth/expansion plans. The smaller firms reversed these two goals. This is logical as the smaller firms had a stronger desire to grow and expand their business.
First Global/Global Operations Quality/Value/Service Second Quality/Value/Service Global/Global Operations Third Leader/Leadership Position Leader/Leadership Position Fourth Ethics/Ethical Operations Ethics/Ethical Operations Fifth Innovation Growth/Expansion Sixth Growth/Expansion Innovation
In summary, there are many similarities and a few significant differences between the mission statements of the largest Fortune 500 firms and those on the bottom of that list. The smaller firms (#401-500) tend to write longer more detailed mission statements than those of the largest companies (#1-100). This is evident in the fact that every stakeholder class is mentioned in more of the smaller firms’ mission statements than those of the largest companies. Customers, for example, were included in 11% more mission statements by the smaller firms (75% to 64%). Further, employees were included in 8% more missions by the smaller companies (42% to 34%). In addition, the largest firms only mentioned a specific goal or objective more often than the smaller companies in three cases. It was only affordability, profits or profitability, and safety or safe products goals that were more often included in the largest firms’ mission statements. All of the other identified goals or objectives were more frequently included by the smaller firms and often significantly more so. For example, providing a quality product was included in 49% of the smaller company missions while the largest firms included this goal in only 30% of their statements. The goal of growth and expansion was included in twice as many of the mission statements of the smaller companies verses the largest ones (24% to 12%). In addition, goals such
Page 29
Academy of Strategic Management Journal, Volume 13, Number 1, 2014
as trust, teamwork, and efficient operations percentage wise were much more common in the statements of the smaller organizations.
MISSION STATEMENT EXAMPLES
As a conclusion to this paper, the authors felt that it was appropriate to provide a few examples of mission statements from both the largest firms (1-100) and the smaller companies (401-500). Notice the identification of stakeholders and goals and objectives in the following mission statements. It is interesting to note that a number of firms in both size classes published a very short mission that listed very few stakeholders and goals. The following examples are from firms who issued a more comprehensive statement. From the largest corporations, the authors selected PepsiCo (#41), FedEx (#70), and Deere (#97) as good examples of comprehensive mission statements. Pepsi mentions a number of stakeholders including investors, employees, business partners, investors, and communities. In addition, the goals of global leadership and ethical behavior are apparent. The FedEx mission includes customers, shareholders, employees, and suppliers/partners. The goals of providing high quality services, producing superior profits, maintaining safe operations, and conducting operations based on the highest ethical and professional standards are described in its mission. Finally, the Deere mission describes core values that include innovation, integrity, and quality. It also identifies stakeholders including employees, customers, communities, suppliers, and the environment. Maintaining safe operations and the production of a quality product are additional goals listed in the Deere mission statement.
PepsiCo - Our mission is to be the world's premier consumer products company focused on convenient foods and beverages. We seek to produce financial rewards to investors as we provide opportunities for growth and enrichment to our employees, our business partners and the communities in which we operate. And in everything we do, we strive for honesty, fairness and integrity. FedEx – Mission - FedEx Corporation will produce superior financial returns for its shareowners by providing high value-added logistics, transportation and related information services through focused operating companies. Customer requirements will be met in the highest quality manner appropriate to each market segment served. FedEx Corporation will strive to develop mutually rewarding relationships with its employees, partners and suppliers. Safety will be the first consideration in all operations. Corporate activities will be conducted to the highest ethical and professional standards. Deere - Mission Statement - “Guided by our company’s four core values – commitment, innovation, integrity and quality – we conduct our business in a manner that protects our employees, customers, communities, suppliers and the environment. This requires that, wherever we do business, we will comply with the spirit and intent of all applicable environmental, health and safety laws and regulations. A company-wide focus on quality extends to our EHS programs, which emphasize continuous improvement. We believe that this commitment to the
Page 30
Academy of Strategic Management Journal, Volume 13, Number 1, 2014
responsible management of human and natural resources contributes to the sustainable growth of our company.” From the smaller firms (401-500), the authors selected Eastman Kodak (#408), NCR
(#447), and Meritor (#481). Notice that the Eastman Kodak mission lists the following stakeholders: shareholders, customers, employees, and community. Its goals include increasing shareholder wealth, supporting the community, and respect for the environment. NCR’s mission lists such stakeholders as customers, employees, and communities. Identified goals for NCR are maintaining global operations, conducting operations on an environmentally sound manner, and concern for the safety and health of all employees. Finally, Meritor’s mission statement identifies shareholders, customers, and employees as stakeholders and the goals of developing innovative and efficient products.
Eastman Kodak - At Kodak, we believe that by doing well by shareholders also means doing right by customers, employees, neighbors, and suppliers. With that in mind, Kodak operates its facilities, and designs and markets its products and services, not only to increase shareholder value, but also to promote development of the individual, the well being of the community, and respect for the environment. NCR – Mission -NCR has a proud tradition of responsible corporate citizenship dating back to the company's founding in 1884. As a member of the global business community, we are committed to conducting all aspects of business in an environmentally sound manner, with care for the safety and health of our employees, as well as for the needs of our customers and the general public in the communities we serve around the world. Meritor - We anticipate our customers’ needs by developing innovative products that provide superior performance, energy efficiency and reliability. We provide a leading portfolio of differentiated services supporting our customers’ products throughout their lifecycle. We distinguish ourselves through our ability to consistently deliver on our commitments while maximizing value for our shareholders, customers, and employees.
These are a few of the examples of comprehensive mission statements found on the websites of the firms on the Fortune 500 list. Much is expected from these short three or four sentence statements. The firm must thoughtfully develop a description of it is and its reason for existence. A well constructed mission statement should provide the reader with some insight into the unique character of the company. These mission statements should then be the basis for strategic management practices and policies. The firm’s actions should be guided by these critically important statements of existence or purpose typically called missions.
Page 31
Academy of Strategic Management Journal, Volume 13, Number 1, 2014
SIGNIFICANCE OF FINDINGS The authors believe that a number of significant results can be identified through the review of the information contained in Table 5. Those individuals interested in mission statements can appreciate significant differences between the statements of the Fortune 500 largest firms (#1-100) and those of the smaller sized companies (#401-500). A review of this information can enhance the understanding of similarities and differences in mission statement content between these two groups of major corporations. This applies to both the stakeholders mentioned as well as any identified goals and objectives. The first significant finding is that the smaller firms (#401-500) create and publish a mission statement that is more detailed and comprehensive compared to their larger counterparts. Table 5 shows that every identified stakeholder is mentioned more frequently by the smaller firms compared to the largest of companies. For example, customers were included in 75% of the smaller firms’ missions while being included in only 64% of the largest companies’ missions. Customers were the most identified stakeholder by both groups, reinforcing the importance of the marketing concept. These firms realized that their long-run success depends on meeting the needs and wants of their target market customers. This important difference continues when the second portion of Table 5 is reviewed. Again, the smaller firms’ missions identify the listed goals and objectives more often than those of the largest companies. The only exception is the goal of producing an affordable product which was included in 10% of the largest firms’ missions compared to 7% of the smaller companies. A goal shared equally by both groups was innovation being reported in 18% of all firms. Other identified goals including efficient operations, concern for the environment, growth and expansion, and maintaining a leadership position were included in a larger percentage of the smaller firms’ missions compared to the largest organizations. The largest firms’ most mentioned goal was that of conducting global operations (34% of firms). The smaller companies’ most frequently identified goal was that of producing a quality product that provides value to customers (49% of smaller companies). Another major difference between these two groups pertains to the desire to grow and expand operations. This goal was included in twice as many smaller firms’ missions compared to those in the larger businesses (24% to 12%). Likewise, providing a quality product that provides value to customers was included in 49% of the smaller firms’ statements compared to only 30% of the missions of the largest companies. The above mentioned differences help any interested party in understanding how the size of the firm affects mission statement content. It is evident that the smaller firms strive to produce a mission statement that is more comprehensive and inclusive than those in the larger group. Anyone reviewing mission statements is likely to better understand who is important to the company (stakeholders) as well as the identified goals and objectives of the firm.
Page 32
Academy of Strategic Management Journal, Volume 13, Number 1, 2014
A final interesting point is the fact that the goals of conducting earth-friendly operations (or being concerned for the environment) and the desire to maintain ethical operations are included in a surprisingly few number of mission statements in both groups. For example, only 9% of the largest firms included a concern for the environment in their missions while that number was only a bit higher (12%) in the smaller companies’ statements. This is another important point for anyone interested in mission statements. Without a study such as this, most interested parties would have no idea that the number of firms identifying the goals of concern for the environment and desire to operate in an ethical manner would be reported in so few mission statements of these largest corporations. As stated earlier, the mission statement describes what the company is really about. It reports the character of the firm and identifies who and what is important to the firm. Table 5 summarizes a detailed study of 200 of the largest U.S. firms. The findings from this project should provide insight for any interested party to better understand the character of these firms and which stakeholders and goals are most important to the firms.
SUMMARY OBSERVATIONS The authors compared the mission statements of the 100 largest firms on the Fortune 500 (#1-100) list with those of the bottom 100 firms on this ranking (#401-500). Table 5 provides a summary of the findings from the analysis of these 200 firms’ mission statements. It summarizes the most commonly mentioned stakeholders and goals/objectives in those missions. Since mission statements are a dynamic publication, the firms must constantly update these important communications. This process of mission statement revision insures that the company will constantly project its up-to- date “reason for existence” and “unique personality.” The authors’ objective is to better educate interested parties on similarities and differences in the mission statements of the largest Fortune 500 corporations and those of smaller firms.
The list of the 200 companies used in this study is available upon request from the lead author who can be contacted at [email protected].
REFERENCES
Abrahams, J. (1999). The Mission Statement Book: 301 Corporate Mission Statements from America’s Top
Companies. Berkeley, CA: Ten Speed Press. Certo, S.C. and S.T. (2012). Modern Management: Concepts and Skills (Twelfth Edition). Upper Saddle River, NJ:
Pearson Prentice Hall. David, F.R. (2005). Strategic Management: Concepts and Cases (Tenth Edition). Upper Saddle River, NJ: Pearson
Prentice Hall. David, F.R. (2009). Strategic Management: Concepts and Cases (Twelfth Edition). Upper Saddle River, NJ: Pearson
Prentice Hall. Drucker, P. (1974). Management: Tasks, Responsibilities, and Practices. New York, NY: Harper & Roe. Drucker, P. (1978). The Drucker Self-Assessment Tool: Content-How to Develop a Mission Statement. Leader
Books.
Page 33
Academy of Strategic Management Journal, Volume 13, Number 1, 2014
King, D.L. (2001). “Mission Statement Content Analysis.” Academy of Managerial Communications Journal, 5(1,2), 75-100.
King, D.L., Case, C.J. & Premo, K.M. (2010). “Current Mission Statement Emphasis: Be Ethical and Go Global.” Academy of Strategic Management Journal, 9(2), 2010, 73-89.
King, D.L., Case, C.J. & Premo, K.M. (2011). “A Mission Statement Analysis Comparing the United States and Three Other English Speaking Countries.” Academy of Strategic Management Journal, 10, Special Issue, 2011, 21-46.
King, D.L., Case, C.J. & Premo, K.M. (2012). “An International Mission Statement Comparison: United States, France, Germany, Japan, and China.” Academy of Strategic Management Journal, 11( 2), 2012, 93-119.
King, D.L,, Case, C.J. & Premo, K.M. (2013), “2012 Mission Statements: A Ten Country Global Analysis,” Academy of Strategic Management Journal, 2012 Forthcoming.
McKee, A. (2012). Management: A Focus on Leaders. Upper Saddle River, NJ: Pearson Prentice Hall. Pearce, J. and David, F. (1989). “The Bottom Line on Corporate Mission Statements,” Academy of Management
Executive 1, 2 (May 1987): 109. Rarick, C. and Vitton, J. (1995). “Mission Statements Make Sense.” Journal of Business Strategy, 1, 11-12. Robbins, S. and Coulter, M. (2012). Management (Eleventh Edition). Upper Saddle River, NJ: Pearson Prentice
Hall. Schermerhorn, J., Osborn, R., Uhl-Bien, M., Hunt, J. (2012). Organizational Behavior. Danvers, MA; John Wiley &
Sons. Thompson, A., Peteraf, M., Gamble, J., and Strickland, A. (2012). Crafting & Executing Strategy (Eighteenth
Edition). New York, NY; McGraw-Hill Irwin. Wheelen, T. and Hunger, J. (2010). Strategic Management and Business Policy (Twelfth Edition). Upper Saddle
River, NJ: Pearson Prentice Hall.
Page 34
Academy of Strategic Management Journal, Volume 13, Number 1, 2014
Page 35
Academy of Strategic Management Journal, Volume 13, Number 1, 2014
SIX SIGMA IMPLEMENTATION BY INDIAN MANUFACTURING SMES - AN EMPIRICAL STUDY
A. Raghunath, Centre For Research, Anna University, Chennai R.V. Jayathirtha, Bullseye Consulting Group, Bangalore
ABSTRACT
Six Sigma as a business improvement strategy is applicable to companies of any size. But,
since its inception Six Sigma has been restricted to the domain of only big companies having higher financial and manpower resources. Though the small and medium size enterprises also could equally adopt this approach for improving their overall effectiveness there is a big gap between the two sectors in this aspect. In this study an attempt has been made to determine the factors concerned with the deployment of Six Sigma in small and medium scale manufacturing industries and as an outcome a simple Six Sigma implementation model has been developed to encourage this sector. Keywords: Six Sigma, Small and Medium Enterprises (SME), Component Manufacturing, Lean manufacturing, Implementation Model
INTRODUCTION
Six Sigma is a business strategy that helps organizations to improve their operations, enhance quality, eliminate defects and thus increase profits. Many of the well-known companies all over the world doing business in different sectors have benefited enormously by adopting Six Sigma business approach. Six Sigma identifies and resolves chronic problems that directly impact the bottom line of an organization. Embarking on a Six Sigma program means delivering top-quality products and service while virtually eliminating all internal deficiencies (Thawani S, 2004).
Six Sigma is not just about statistics but rather based on the scientific method, utilizing statistical thinking (Snee, R D and R W Hoerl, 2003). It is an overall business improvement initiative rather than just a quality initiative. The main theme of Six Sigma is identifying defects and eliminating them to less than 3.4 defects per million opportunities (DPMO). It defines, measures, analyses, improves and controls the vital few processes linking the improvement of quality directly to the bottom-line results. Up till now, Six Sigma approach has been usually associated with large OEM companies because of their financial strength and manpower resources, because of which, there is a perception that Six Sigma is applicable only for large companies possessing better resources.
Page 36
Academy of Strategic Management Journal, Volume 13, Number 1, 2014
The component suppliers should respond to the market-driven issues quickly and effectively and also be cost effective. A supplier with poor quality becomes a weak link. Large companies should help their suppliers to improve the quality of the supplied parts, materials, assemblies or services so that they could in turn supply superior products or services to their customers. Thus, suppliers are really strategic partners in Six Sigma implementation endeavours of the companies. But, the literature says that, still a large chunk of the small and medium enterprises have some misconceptions or myths about Six Sigma approach like:
1. Six Sigma is applicable to only to large companies 2. Six Sigma is a complicated, statistical methodology that is difficult to understand 3. An outside consultant must be hired 4. Experts are needed to make it work 5. Six Sigma is repackaged Total Quality Management 6. Six Sigma is only statistics without real savings 7. Six Sigma is just training the people 8. Six Sigma is a “magic pill” to fix problems with little effort
In the course of our long industrial association with some of the small scale manufacturing
companies, we also have experienced that the SMEs feel intimidated by the idea of adopting the methodologies like Six Sigma and it was mainly due to the lack of clear understanding or general misconception about these methodologies. The managements had apathy towards them and hence were not keen on knowing even the benefits of these methodologies. At the same time we used to hear about success stories of Six Sigma implementation by SMEs in some parts of the world. Through the literature review we tried to understand the global situation with regard to implementation of Six Sigma by SMEs in manufacturing and service sectors. Most of these articles articulate that achieving success in Six Sigma implementation by SMEs is possible, but the first thing needed is changing the mind-set of the companies.
UNDERLYING CONCEPTS AND OBJECTIVES OF THE STUDY
As far as government, industrial associations and other formal bodies are concerned the
support for the SMEs would be at a higher level i.e. in the area of finance, infrastructure, power, taxing, administrative regulations, etc. As far as accreditation to quality management systems like ISO 9000, ISO/TS 16949, AS9100, etc. is concerned, all the required help and support are readily available through a number of consulting firms and the agencies. Since these certifications are almost mandatory requirements for the companies to do business in national and international level most of the companies big or small would go for them voluntarily. It would also be very easy to get a list of these accredited companies region wise, sector wise, businesswise, etc. But, for implementation of the methodologies like TQM, Lean Manufacturing and Six Sigma there will not be any compulsion from anybody for the companies. These are left to the choice of the
Page 37
Academy of Strategic Management Journal, Volume 13, Number 1, 2014
individual companies as these methodologies are not just concerned only with the quality but mainly concerned with increasing the productivity and effectiveness, increasing the profits, improving the overall bottom-line of the companies, etc. As far as Six Sigma is concerned, right now in India, the general perception is that it is about training and certifying some of the staff members as MBB, BB, GB, etc. and these certified staff members are supposed to take up some six sigma projects with certain financial targets like cost reduction, revenue enhancement, etc. The staff members selected for this purpose, in general, is supposed to be adequately qualified and earmarked for the specific Six Sigma projects only. The cost involved in training these people is quite exorbitant and also they are considered as special resources. So, though the companies are reporting the financial and other gains by the Six Sigma projects the cost incurred by the companies for the Six Sigma implementation is also substantial.
Our view was that the situation prevalent in bigger companies should not be a deterrent factor for SMEs for the implementation of Six Sigma. The basic theory for application of Six Sigma by SMEs was that the core methodology of Six Sigma is scalable and SMEs could benefit significantly even relatively small scale and simple Six Sigma projects are carried out. Implementation of Six Sigma is dependent upon characteristics inherent in any business. So, even if there are some difficulties in implementing Six Sigma in a small company rather than a large business, it should be applicable for companies of any size. Our supposition is that the breakthrough improvements in bottom-line profitability come from the quality and the intelligence with which the resources are employed and not the quantity. The extension of our supposition is that smaller organizations can change and adapt more quickly than the large organizations and building a culture congenial towards embarking upon on sustainable Six Sigma development should be relatively easy for the small and medium companies. Hence, smaller organizations should be able to establish Six Sigma effectively and faster than large businesses if deployment is properly managed. Smaller organizations may have constraints on resources and expertise, but they have some advantages like shorter decision-making chain. Within the available resources if a small but committed force of the right people with proper training and authority is built for moving the things in a systematic way breakthrough could be accomplished equally well even in a small organization.
The ongoing industrial changes signal that SMEs also have gradually started showing interest in Lean and Six Sigma approaches for improving bottom-line of their businesses. But, the picture was not clear regarding certain of the questions like: Do our SMEs also still have the general misconceptions about the Six Sigma methodology? Have at least few of them implemented or tried to implement Six Sigma? How many have succeeded in implementation and to what extent they have got benefitted? If some of them had failed what were their problems? Etc.We wanted to do a reality check regarding this ground situation in SMEs. We selected the auto component manufacturing small and medium companies (SME) sector in Karnataka state of India, as this is a vibrant and fast growing SME sector in this region, for thoroughly studying their status of implementation of Six Sigma.
Page 38
Academy of Strategic Management Journal, Volume 13, Number 1, 2014
An empirical study was taken up by us with the following objectives: 1. To find out the present state of affairs of the Six Sigma implementation by auto component
manufacturing industries 2. To study the impact of Six Sigma implementation in auto component manufacturing industries and their
effectiveness in comparison to the global situation 3. To study the inter-relationships of the factors that are very essential for proper implementation and
management of Six Sigma by SMEs 4. Bring out the difference between successful and not so successful managements in auto component
manufacturing sector of Karnataka in their Six Sigma implementation drive.
5. To arrive at proper six sigma implementation Model for SME’s in Auto component Manufacturing industries
LITERATURE REVIEW
Opinions of some of the experts regarding the applicability of Six Sigma for SMEs are: Six Sigma is very appropriate for smaller companies too. The Six Sigma strategy works well in billion dollar corporations as well as $50 million privately held companies. In fact, it has been our experience that the results are usually quicker and more visible in smaller companies (Dr Matthew Hu, Vice President of Technology and Innovation, ASI, USA). It does not matter what type or size of business Six Sigma methodology is applied to – no matter whether it is a 300 employee company or a 10 employee family business, Six Sigma will work as long as you follow the process effectively (Brue2006).
We have reviewed the available literature on studies undertaken regarding the Six Sigma
implementation efforts by the SMEs in different parts of the world. But, for the acceptability of Six Sigma by SMEs, we should provide them enough proof of successful implementations by this sector elsewhere. For this purpose we have attempted to collect information regarding the empirical case studies at global level and thus tried to make our study to stand on a good practical pedestal.
Jiju Antony (2004) has presented the results of a pilot survey of the service organizations based in the UK to understand status of Six Sigma. The paper reports the essential ingredients required for the successful deployment of Six Sigma in the service sector. Pulakanam & Voges (2010) have reviewed seventeen studies, which the authors believed constitute most of the published empirical studies on implementing Six Sigma in different parts of the world. The review includes the extent of Six Sigma adoption in industry, and the benefits and major hurdles in implementing the programme. Prof. Dr. Armin Töpfer (2010) in his paper “Six Sigma – Project management for zero defect quality in the automobile industry” states that Six Sigma is a perfect solution if introduced in its entirety and applied consistently, if the company managers and
Page 39
Academy of Strategic Management Journal, Volume 13, Number 1, 2014
directors provide their full commitment and if there is a company culture which encourages transparency of errors, stringent project control and a desire for quantitative results.
Mr. Joseph De Feo, CEO of Juran Institute, USA states that the success of a Six Sigma implementation effort cannot be taken for granted. Many a times the failures in Six Sigma implementation by companies are due to improper approach without proper groundwork and planning. All companies large and small, share many common features and problems. Large companies, because of scale, may reap higher financial gains as a result of a given breakthrough, but this should not be taken to suggest that small companies would not benefit from its use.
Xingxing Zu et al. (2006) have studied the effect of organizational culture on Six Sigma by empirically investigating the relationship between culture and quality practices associated with Six Sigma implementation in US manufacturing companies. According to them Six Sigma is multidimensional consisting of multiple quality management practices which are driven by and reflect multiple dimensions of organizational culture.
Edgeman and Bigio (2004) have listed the following points as the answer to why many industries are apathetic about Six Sigma:
they believe that their existing culture and system, such as ISO 9000 and continuous improvement are
sufficient to meet their needs they do not believe the managerial benefit to the organisation of adopting Six Sigma justifies its cost they do not understand Six Sigma or have the internal capability to assess its potential value to their
organisation they regard the cost of hiring, training and retaining Six Sigma talents as prohibitive in view of what they
believe the returns will be.
G.V. Prabhushankar et al. (2009), Jiju Antony & Darshak A. Desai (2009), Rajeshkumar U. Sambhe et al. (2011), Desai D. A. (2006) have published papers on implementation of Six Sigma in India. Lee Revere, et al. (2006), USA have published a research paper on pilot research exploring the critical success factors of Six Sigma. Paulo A. Cauchick Miguel and João Marcos Andrietta have published a paper on “An Exploratory-descriptive Survey on Six Sigma Utilisation in Brazil”. King-Jang Yang et al. (2008) have published a paper on the analysis of the implementation of Six Sigma: an empirical study in Taiwan.
Darshak A. Desai. (2006), Deshmukh, S.V. (2008) and Prabhakar Kaushik, Dinesh Khanduja, Kapil Mittal, Pawan Jaglan, (2012) have published case studies of Six Sigma implementation by Indian SMEs. Maneesh Kumar, Jiju Antony and Alex Douglas (2009) and Kumar, M. and Antony, J. (2008) have published case studies of UK. Timans, W, Antony J, Ahaus, K. and van Solingen, R. (2012) have published a case study on implementation of Lean Six Sigma by SMEs in the Netherlands. Mehmet Taner. (2012) has published a feasibility study for Six Sigma Implementation in Turkish textile SMEs. Anna Errore, Stefano Barone, Alberto Lombardo, Therese Doverholt (2012), has published a case study on implementation of Six Sigmaby SMEs in Swedish Industry. Yang, K-J., Yeh, T-M., Pai, F-Y. and Yang, C-C. (2008) have published a
Page 40
Academy of Strategic Management Journal, Volume 13, Number 1, 2014
paper on an empirical study of the implementation status of Six Sigma in Taiwan. Grudowski P., Waszczur P. (2011) has published a paper on characterization of small and medium enterprises of Pomeranian region in Six Sigma methodology application.
For the adoption of Six Sigma by the manufacturing SMEs in large number, the success stories also should be from the sphere of the local SMEs. But, our literature review reveals that at the moment there are hardly any such examples in the Karnataka region.
HYPOTHESES OF THE STUDY
Two main propositions regarding the implementation of Six Sigma by auto component
manufacturing industries were adopted for the study. Each of these propositions was translated in to five hypotheses to test the effectiveness of implementation. The details of the propositions and the hypotheses are given below:
Proposition 1: The auto component sector in Karnataka is using Six Sigma as quality and business process improvement tool very effectively. Proposition 2: The auto component sector in Karnataka needs support for imbibing the Six Sigma methodology and for effective implementation.
These propositions were translated into the following hypothesis: H1a The auto component manufacturing industries in Karnataka are well versed with Six Sigma
methodology H1b Significant number of companies has implemented Six Sigma H1c Top managements of the companies are pushing the implementation of Six Sigma for improving
their bottom-line H1d There are many important similarities among the companies who have successfully implemented
Six Sigma H1e The benefits ensued to the companies after Six Sigma implementation are substantial.
H2a Six Sigma as a break through methodology needs to be properly propagated among the auto
component manufacturing industries in Karnataka H2b The auto component manufacturing industries in Karnataka have many practical issues for
implementation of Six Sigma H2c There are many important similarities among the companies who were unsuccessful in
implementing Six Sigma
Page 41
Academy of Strategic Management Journal, Volume 13, Number 1, 2014
H2d The managements of the companies are apprehensive of or not interested in implementation of Six
Sigma H2e Companies need a good implementation model to get started with Six Sigma methodology, maintain
the momentum over time and eventually institutionalize it.
RESEARCH METHODOLOGY
Collecting both the quantitative and descriptive data through survey method was used to
test the hypotheses. A list of the companies to be contacted for the survey was prepared based on their size, turnover, products, quality system certification, membership to professional bodies, etc. Since Six Sigma approach is normally adopted by the industries at an advanced stage of quality enhancement rather than as the first time quality system establishment, it was decided to include the auto component industries that have some kind of quality management system in place like ISO 9000, TS16149, etc. The other criterion used, though not as a mandatory requirement, was the membership of the industries to ACMA (Auto component manufacturing association) with the premise that the auto industries in a position to go for Six Sigma implementation would also be part of big professional groups in their field. Manufacturers of all types of auto components like mechanical parts, electrical parts, rubber parts, etc. were included. The final list of the companies to be contacted for the survey contained 75 companies.
The questions to be included in the survey questionnaire and the relation of the questions with the objectives of the study were scrutinized after many discussions. The questions were both of rating types and descriptive answer types. The key idea of using descriptive questions was to get the specific views of the individuals and the contexts in which they hold those views. For the rating type of questions three/four/five level Likert items were used. Attempt was made to include all the applicable and feasible factors so that the respondents could select the appropriate choice according to the conditions prevalent in his organization. The survey questionnaire ran into a total of nine A4 pages. Some of the issues pertaining to which the data was collected from the companies are:
1. Six Sigma tools used by the companies 2. Critical Success Factor for Six Sigma implementation 3. Common hindrances for Six Sigma implementation 4. If not implemented, reasons for not applying Six Sigma 5. Reasons/motivations for applying Six Sigma 6. Criteria for selection of six sigma projects 7. Financial gain after Six Sigma implementation 8. Participation of the Top Management in Six Sigma implementation 9. Number of employees working on Six Sigma projects 10. Six Sigma performance metrics used 11. Training provided to employees working on Six Sigma
Page 42
Academy of Strategic Management Journal, Volume 13, Number 1, 2014
Survey questionnaire was prepared in two forms. Web form for the companies that would
prefer to send their reply online while hard copy computer printout form for the companies preferring to send reply through courier or post. The web survey questionnaire was sent to all the companies in the list through email and later a hard copy of the questionnaire was also sent to them through post. The data collection process was quite a Herculean task. The replies to the questionnaire were not easily forthcoming. We had to meet most of the managers personally through the help of the known common contacts and provide them the hard copy questionnaire again for filling the answers through direct discussion with us.
While planning our survey one of the main considerations we had was that the data should be collected from the managers in SMEs who are responsible for six sigma implementation and also, to the maximum extent possible, from the senior level managers. The premise was that, if the management is genuinely interested in Six Sigma implementation, senior managers shall have the knowledge of the concepts and benefits of Six Sigma so that they can encourage and infuse confidence in the other people to venture this path. Also it is the responsibility of the senior leadership to provide the needed manpower, money and other resources for implementation. We first contacted the quality manager of the companies, because in most of the companies the Six Sigma initiative is taken from the department or people concerned with the quality management. Since our target companies were SMEs, the total number of people in the company varied from around 50 to 200 only, with the number of managerial level people being not that big. The hierarchy of the people from the top management to the lower level was short and in most of the cases these managers were reporting directly to the very senior level executive of the company. These managers were responsible for ISO 9000 or TS16949 certification related activities of the company. This helped us to collect the fairly reliable and realistic information regarding Six Sigma activities that were going on in the company. In majority of the cases the initial discussions were carried out with the quality managers and later on the senior management executive was met along with these managers to get the final version of the company. Thus enough care was taken to collect the fairly accurate data from the people who really mattered for Six Sigma implementation by the companies. Through persistent effort a total of 25 usable replies were received from the companies with a reply rate of 33%.
DATA RELIABILITY AND VALIDITY
One approach to analyse subjective perceptions and to gain insights from survey responses is through factor analysis (Kim and Mueller, 1978). A scree plot graphically groups factors making it easy to separate the retainable constructs from those that are not useful. Since more than one break can occur in the plot, eigenvalues were used to reinforce the decisions.
Page 43
Academy of Strategic Management Journal, Volume 13, Number 1, 2014
Table 1 FACTOR ANALYSIS - REASONS FOR NOT APPLYING SIX SIGMA
Q. 10 Criteria for selection of six sigma projects
11 0.959 0.7034 .192
Q. 11 Six sigma tools used within the company
31 0.946 0.5098 .414
Q. 15 Six sigma performance metrics used by the company
10 0. 931 0.5875 .300
Q. 16 Critical success factors (CSF) for implementation of Six Sigma
25 0. 992 0.8432 .192
Q. 31 Common hindrances in implementation of six sigma
19 0. 981 0.7357 .217
Page 44
Academy of Strategic Management Journal, Volume 13, Number 1, 2014
The extent to which all questions contribute positively towards measuring the same concept is known as internal consistency. Cronbach’s alpha is one of the most widely used measures of internal consistency of a survey questionnaire generally known as reliability coefficient. The statistical package SPSS was used for conducting the factor analysis and the computation of Cronbach’s alpha coefficient.
Factor analysis was done using principal component analysis extraction method and varimax rotation with Kaiser Normalization. Eigen value more than 1 was considered for the extraction of the components. Tables containing the details like the communalities, rotated component matrix, the scree plot, initial eigenvalues, the extraction sums of squared loadings and the rotation sums of squared loadings were generated. Table 1 gives the details of the values for the question: Reasons for not applying Six Sigma. From the output of the analysis we observed that the initial extraction values of the variables in all the constructs are quite high (more than 0.9) and the requirement of minimum three variables loading per factor for good interpretability is met in all the cases. The results confirm that all the constructs are unidirectional and the items of the constructs are loaded on to a single factor.
The commonly used rule of thumb for describing the internal consistency using Cronbach’s alpha is: alpha value above 0.7 is satisfactory, 0.8 – 0.9 is good and above 0.9 is excellent. In our case, the Table 2 indicates that except for ‘Reasons for not implementing Six Sigma’ where the alpha value is 0.881, in all other constructs the alpha value is well above 0.9 indicating that the reliability of the data is very good. Since the reliability coefficient also depends on the correlation between the variables, the Person correlation coefficients were computed. The tables indicate good correlation among the variables with the significance level of 0.01 and 0.05.
FINDINGS AND HYPOTHESIS TESTING
The data collected from the survey were further analysed using SPSS Statistical software
package for testing of the ten hypotheses recognized for the study. The responses given by the survey respondents for some of the questions are shown in bar chart form in figures 1-4.
These values in terms of the percentage and the other output data of the analysis like mean ratings, Chi square test values and the correlation coefficients are used to test the stated hypotheses for determining the status of Six Sigma implementation by SMEs in Karnataka state.
Kendall's W, also known as Kendall's coefficient of concordance, a non-parametric statistic was calculated for assessing agreement among the respondents. Calculated values of Kendall's W given in table 2 indicate that there is statistically significant difference in the opinions expressed by the respondents.
Analysis of the results indicates that the present status of affairs in auto component manufacturing companies regarding the Six Sigma implementation in Karnataka state is not appreciable. Many of them are aware of the Six Sigma methodologies in general, but very few
Page 45
Academy of Strategic Management Journal, Volume 13, Number 1, 2014
Figure 1: Reasons for not implementing Six Sigma
Figure 2: Reasons/Motivations that lead to full implementation of Six Sigma
0% 10% 20% 30% 40% 50% 60% 70% 80% 90% 100%
Presently organization is functioning smoothly
Lack of external assistance in implementation
Lack of internal assistance in implementation
Ours is a small scale industry
Didn’t see any perceived benefits
We do not know anything about it
Feel not suitable for our type of industry
Other quality/productivity improvement drive in…
No reason
Very strong reason Moderately strong reason Not so strong reason
0% 10% 20% 30% 40% 50% 60% 70% 80% 90% 100%
To enhance operational excellence
To improve customer satisfaction
To become world-class organization
To improve company bottom-line
To solve chronic problems
To remain competitive in the global market
To create better image of product/service
Company Strategy
Insistence from Customers
Decision from head quarters
For benchmarking purposes
For publicity of the company
Very strong reason Moderately strong reason Not so strong reason
Page 46
Academy of Strategic Management Journal, Volume 13, Number 1, 2014
Figure 3: Six Sigma tools presently used by companies
companies are really involved in this domain to an appreciable level. Even the companies which say that they have implemented are not practicing it wholly. There seems to be a big gap between the general global situation and this manufacturing sector with regard to implementation of Six Sigma.
0% 10% 20% 30% 40% 50% 60% 70% 80% 90% 100%
Histogram
Scatter diagram
Run charts
SPC control charts
Process capability analysis
Measurement system analysis
DOE
Taguchi methods
ANOVA
Hypothesis testing
Regression analysis
Non-parametric test e.g. Mann-Whitney Test
Team problem solving tools
Process flowchart/mapping
Brainstorming
Cause and effect analysis
Affinity diagrams
Pareto analysis
5S Practice
Matrix analysis
Force field analysis
Balanced scorecard
Project charter
Quality function deployment
FMEA
Kaizen
SIPOC
PDCA (Plan, Do, Check, Act)
Poka-Yoke
Benchmarking
Quality Csting
Extensively used Moderately used Rarely used Not used
Page 47
Academy of Strategic Management Journal, Volume 13, Number 1, 2014
Figure 4: The critical success factors (CSF) for implementation of Six Sigma
From the analysed data the hypothesis H1a: The auto component manufacturing industries in Karnataka are well versed with Six Sigma methodology is supported. 80% of the respondents have said that they know what Six Sigma is. The companies use Kaizen, FMEA, SPC control charts, Run charts, PDCA (Plan, Do, Check, Act), Poka-Yoke, 5S Practice, Process capability analysis, Brainstorming, Process flowchart/mapping, Pareto analysis, Cause and effect analysis
0% 10% 20% 30% 40% 50% 60% 70% 80% 90% 100%
Management commitment and participation
Organizational infrastructure
Employee training & education on Six Sigma…
Linking six sigma to customers(Customer focus)
Linking six sigma to business strategy
Linking six sigma to employees
Linking six sigma to suppliers
Understanding of six sigma methodology
Project management skills
Project prioritization and selection
Leadership of Six Sigma projects
Top Management Leadership
Culture of collaboration and cooperation
A well-implemented customer management…
Linking Six Sigma for rewards/ recognition to…
Effective communication on Six Sigma Program
Empowerment and authority at all levels
Team selection for Six Sigma project
Role of Information Technology
A well-developed strategic planning system
Management of cultural change
Integration of Six Sigma with financial…
Effective tracking of projects and reviews
Incentive programs
Company-wide commitment
Most Critical Moderately Critical Least Critical
Page 48
Academy of Strategic Management Journal, Volume 13, Number 1, 2014
and Measurement system analysis extensively. Values of (Spearman's rank correlation coefficient) for these tools are between .750 and .968 at a significance level of 0.01.
The hypothesis H1b: Significant number of companies has implemented Six Sigma is not supported. What we have found is that none of the small and medium enterprises in the auto component manufacturing sector in Karnataka state has implemented Six Sigma fully in their companies. Some of the companies claim that they are using Six Sigma partially because they use some of the Six Sigma tools and techniques for analysing and monitoring their processes. None of the companies use Taguchi methods, ANOVA, Hypothesis testing, Regression analysis, Non-parametric tests, Affinity diagrams, Force field analysis, DOE (Design of experiments), Matrix analysis and QFD (Quality function deployment) tools. Kendall's Coefficient of Concordance, W varies from .192 to .417 indicating significant difference in the responses.
The respondents feel that Management commitment and participation and Employee training & education on Six Sigma methodology and utilization of quality tools are the most critical factors for successful implementation of Six Sigma. Linking Six Sigma to business strategy and Top Management Leadership are the other important factors. Fact of the matter is that none of the SMEs has implemented Six Sigma and nonexistence of these factors in SMEs is endorsed by the survey respondents. Thus the hypothesis H1c: Top managements of the companies are pushing the implementation of Six Sigma for improving their bottom-line is not supported.
This study was taken up with the assumption that there may be some SMEs who have implemented Six Sigma. The question of success or failure of implementation of Six Sigma would have been there if, as per our assumption, there were attempts by at least few of the SMEs for implementation of Six Sigma. But, as of now, no SME has attempted to implement Six Sigma fully using DMAIC methodology. So, the verification of the hypothesis H1d: There are many important similarities among the companies who have successfully implemented Six Sigma was not feasible and hence it is not supported.
The hypothesis H1e - The benefits ensued to the companies after Six Sigma implementation are substantial was considered for the study, as stated earlier, with the assumption that there may be some SMEs who have implemented six sigma. But this hypothesis is not supported as none of the SMEs in auto component manufacturing area has implemented Six Sigma and hence did not accrue any benefit.
Though most of the SMEs are aware of the six sigma methodology none of them has implemented it because of lack of education about the benefits they are going to get if they implement Six Sigma fully. Almost all the respondents are interested in implementing it in future if they are convinced that it is beneficial to them. The reasons or motivations stated by the respondents for implementing Six Sigma in future are: to enhance operational excellence, to improve company bottom-line, to solve chronic problems, to create better image of product/service and to become world-class organization. This makes clear that there is a need for convincing the companies about the benefits of Six Sigma and removal of the misconceptions about Six Sigma.
Page 49
Academy of Strategic Management Journal, Volume 13, Number 1, 2014
So, the hypothesis H2a: Six Sigma as a break through methodology needs to be properly propagated among the auto component manufacturing industries in Karnataka is supported.
Regarding the common hindrances for implementation of six sigma, most of the respondents feel that lack of resources (financial resources, human resources, time, etc.), no full-time black belts, lack of qualified man power, lack of leadership from the top executives, insufficient time for training and cost of implementation are the most common hindrances. Apart from these problems the SMEs also have the hindrances of poor training and coaching, having full time black belts, difficulty in collecting data, problem in project selection, etc. So, the hypothesis H2b: The auto component manufacturing industries in Karnataka have many practical issues is supported.
But the output of the study is that none of the SMEs in auto component manufacturing area has implemented Six Sigma. So, there was no possibility of verification of the hypothesis H2c: There are many important similarities among the companies who were unsuccessful in implementing Six Sigma. The main reasons given by the companies for not implementing Six Sigma fully are ‘ours is a small scale industry’ and ‘lack of internal assistance in implementation’. The next two main reasons are ‘presently organization is functioning smoothly’ and ‘other quality/productivity improvement drive is in force’ etc.
Prominent view of the respondents is that the major hindrance for not implementing six sigma is cost of implementation and lack of resources (financial resources, human resources, time, etc.). This mainly reflects on the interest and involvement of the management in knowing the facts about benefits of Six Sigma implementation. The managements of SMEs need to understand that the cost of implementation of Six Sigma is very highly compensated by the benefits accrued after the implementation. It is clearly evident that a large gap exists in this aspect and hence the top management of the SMEs are not pushing six sigma methodology. So, the hypothesis H2d - The managements of the companies are apprehensive of or not interested in implementation of Six Sigma is supported.
The hypothesis H2e - Companies need a good implementation model to get started with Six Sigma methodology, maintain the momentum over time and eventually institutionalize it is well supported. Companies are not averse to the idea of using Six Sigma methodology, but there seems to be not enough motivation, encouragement and education for them regarding the Six Sigma implementation. They need some sort of initial push for getting started with the implementation. For this purpose a simple way of understanding Six Sigma in the practical sense and climbing the height step by step with confidence would be essential. A good implementation model would provide them this support.
Page 50
Academy of Strategic Management Journal, Volume 13, Number 1, 2014
A SIX SIGMA IMPLEMENTATION MODEL FOR MANUFACTURING SMES
One of the major reasons why the companies are not succeeding to the expected level in Six Sigma implementation is the way the Six Sigma consultants are offering it to the companies. What we feel is that Six Sigma should not be restricted to training the people and handling some improvement projects only. This methodology should be used to achieve break through changes in the organization culture, leadership and the overall business and process management activities. In a nutshell it should bring out the best from the existing resources and the system with a change in the mindset of the companies and their way of functioning. This can be better achieved by smaller companies rather than the bigger companies and in fact the smaller companies can show the way for the bigger companies for proper deployment of Six Sigma. What we have observed is that the smaller organizations may not do R&D in a recognized formal way like bigger companies, but they are innovative in reengineering their products or services and developing new techniques for improving the sales. They would not oppose any new methodology if it is presented in a cost effective and feasible way for them. So, our effort has been to study the present status of the Six Sigma implementation by the manufacturing SMEs, mainly in the auto component sector, and come out with a very simple Six Sigma implementation guide so that the SMEs can deploy Six Sigma without much cost implications. We have to start with some of the open and progressive minded small and medium companies by encouraging them for adopting methodologies like Six Sigma by providing the necessary guidance and support.
A simple implementation model of Six Sigma for manufacturing SMEs has been produced as an output of this study. This model acts as a simple guide for SMEs to follow the Six Sigma implementation process effectively. The main aim of this model is to drive out many apprehensions of SMEs regarding Six Sigma and emphasize the overall benefits. It lists all the necessary and sequential steps and care to be taken for implementation of Six Sigma. The model will also answer questions like should SMES go for Lean and Six Sigma simultaneously, whether to go for Lean first and Six Sigma next, etc. If an organization does not have the necessary resources and infrastructure or it does not want organization-wide Six Sigma deployment at the first stage itself, then the model explains how to start with a pilot program.
The six phases of the implementation process which will finally lead to a Six Sigma SME are very briefly introduced here. Figure 5 shows a simple framework of the model for implementation of Six Sigma by SMEs. Analysis of the Present Level
This phase deals with the realistic assessment of the present level of performance in two steps. The first step involves the identification of the specific and important performance measures to be set by the SMEs for assessment of the current performance of the products, processes and the measurement system at the organization level. The second step involves the establishment of
Page 51
Academy of Strategic Management Journal, Volume 13, Number 1, 2014
the methods to quantify each performance measure. The output of this phase is measured values for each performance measure.
Figure 5
PHASE 1
SIX SIGMA IMPLEMENTATION FOR SMEs
PHASE 2
PHASE 3
PHASE 4
PHASE 5
PHASE 6
Analysis of the Present Level
Target for the Higher Level
Development of Strategy
Performance improvement
Validation of the improvements
Sustaining the improvements
PL
AN
NIN
G
CO
NT
RO
LL
ING
B
RE
AK
TH
RO
UG
H
Page 52
Academy of Strategic Management Journal, Volume 13, Number 1, 2014
Target for the Higher Level
The first step of this phase deals with the process of understanding the expectations of the customers. The next step deals with the establishment of the proper improvement priorities and setting the targets and specifications for each of the current performance measures to meet the expectations of the customers. In the final step the current performance level is compared with the set targets and the specifications to identify the gaps that must be filled. The output of this phase is a clear definition of the targets and the specifications for each performance measure. Development of strategy
This phase involves the development of a strategic performance improvement plan for the manufacturing projects. This plan consists of identification of the key process characteristics, detection of the likely sources of errors and devising improvement strategies for them such that the targeted performance metric, say zero defects, would be achieved. The output of this phase is a strategic performance improvement plan that defines how the performance gaps between the existing and the expected levels are bridged. Performance improvement
This phase involves the development of action plans to implement the strategic performance improvement plans. To make the process stable, the action plan may involve implementing an appropriate control chart, identifying causes of shifts in the process and taking corrective actions to prevent recurrence of such shifts. To reduce variability, the action plan will require determination of the causes of variability and the ways in which the impact of these causes can be reduced or eliminated. In new product development projects, this phase also involves generation of the design alternatives and the product optimization. The output of this phase is a specific action plan to bring about cost-effective and timely improvements in the performance. Sustaining the improvements
Benefits of the improvement should be realized permanently, not on short term basis. This phase consists of the steps involved to materialize the improvements on a continuous basis. After completing the first five phases, the major problem is that of maintaining the momentum over time and persisting with the implementation till it is eventually completely established. So, the output of this phase is action plan for troubleshooting and controlling the processes regularly.
Page 53
Academy of Strategic Management Journal, Volume 13, Number 1, 2014
CONCLUSION
Rapid changes are taking place in the auto component industry globally. The need of the hour is to make companies think about adopting the Six Sigma approach such that they can improve their effectiveness. The ongoing industrial changes indicate that more SMEs are becoming serious about Lean and Six Sigma approaches for improving bottom-line of their businesses. Six Sigma is designed for all-inclusive deployment across the organization of any size. The main realization the companies need to have is that Six Sigma is not about statistics, but about statistical thinking. Six Sigma as a strategy helps companies to identify and eliminate defects in business processes drastically by focusing on performance characteristics. Unlike other quality management systems, Six Sigma brings financial element into the picture and if implemented properly it helps the companies to improve their return on investments considerably. In the longer term, it will be necessary to integrate Six-Sigma as one component of an overall quality management or improvement system (Roger Hoerl, 2004). However, smaller organizations do have some constraints that limit their ability to initiate a large scale Six Sigma implementation.
It calls for a lot of expertise on the part of Six Sigma practitioners to run projects effectively and extensive training is necessary to produce any noteworthy results. As a result, though the substantial benefits could be attained by firms of any size, only large firms could cope with Six Sigma endeavors reaping the rich gains. But, in reality, if large companies are able to gain the benefits of Lean and Six Sigma, SMEs also can do the same. The ongoing industrial changes signal that SMEs also have started showing interest in Lean and Six Sigma approaches for improving bottom-line of their businesses. We wanted to do a reality check regarding the ground situation in implementation of Six Sigma by SMEs by selecting the auto component manufacturing small and medium companies sector in Karnataka state of India.
An attempt has been made to change the common misperception of the SMEs about Six Sigma and encourage them to employ these methodologies by providing a simple implementation model. This model acts as a simple guide for SMEs to follow the Six Sigma implementation process effectively. The main aim of this model is to drive out many apprehensions of SMEs regarding Six Sigma and emphasize the overall benefits. Our wish is that SMEs in our country and region also should benefit from methodologies like Six Sigma with the proper guidance and support.
REFERENCES Andrew Thomas, Richard Barton, Chiamaka Chuke-Okafor (2009). Applying lean Six Sigma in a small engineering
company – a model for change. Journal of Manufacturing Technology Management, 20(1), 113-129 Anna Errore, Stefano Barone, Alberto Lombardo, Therese Doverholt (2012), Implementation of Six Sigma in SMEs.
A Case Study in Swedish Industry, ENBIS (European Network for Business and Industrial Statistics) -12 Brue, G (2006). Six Sigma for Small Business. CWL Publishing Enterprises, Inc., Madison, Wisconsin
Page 54
Academy of Strategic Management Journal, Volume 13, Number 1, 2014
Darshak A. Desai. (2006) Improving customer delivery commitments the Six Sigma way: case study of an Indian small scale industry, Int. J. Six Sigma and Competitive Advantage, Vol. 2, No. 1
Deshmukh, S.V. (2008), Six Sigma - an innovative approach for waste reduction: A case study of an Indian SME, Industrial Engineering and Engineering Management, 2008. IEEM 2008, pp.1553 – 1556
Edgeman, RL; Bigio (2004). DL: Six Sigma in Metaphor: heresy or holy writ? Quality Progess, January, 25-30 Grudowski P., Waszczur P. (2011) Characterization of small and medium enterprises of Pomeranian region in Six
Sigma methodology application, LogForum, Vol. 7, Iss:4, No Hsiang-Chin Hung and Ming-Hsien Sung. (2011) Applying six sigma to manufacturing processes in the food industry
to reduce quality cost, Scientific Research and Essays, Vol. 6(3), pp. 580-591 Jayathirtha R V (2001). Combating Environmental Repercussions through ‘TQEM’ and ISO 14000, Bus. Strat. Env.
10, 245-250 Jiju Antony (2004). Six Sigma in the UK service organisations: results from a pilot survey, Managerial Auditing
Journal, 19 (8) 1006-1013 Jiju Antony, Darshak A Desai (2009). Assessing the status of six sigma implementation in the Indian industry, Results
from an exploratory empirical study, Management Research News, 32 (5), 413-423 Kim, J.O. & Muller, C.W. (1978). Factor Analysis: Statistical methods and practical issues, Beverly Hills, CA: Sage
publications Kaushik P. (2011) Relevance of Six Sigma Line of Attack in SMEs: A Case Study of a Die Casting Manufacturing
Unit, Journal of Engineering and Technology, Vol. 1, ISS:2, 107-112 Kumar, M. and Antony, J. (2008) Comparing the Quality Management Practices in UK SMEs, Industrial Management
and Data System, 108, 9, 1153-1166 Lee Revere, Sukran, N, Kadipasaoglu, Faiza Zalila (2006). An empirical investigation into Six Sigma critical success
factors, Int. J. of Productivity and Quality Management, 1(3), 224-252 Lynne B. Hare (2005). Linking statistical thinking to Six Sigma. International Journal of Six Sigma and Competitive
Advantage, 1(4), 389 - 402 Maneesh Kumar, Jiju Antony, Alex Douglas, (2009) Does size matter for Six Sigma implementation?: Findings from
the survey in UK SMEs, The TQM Journal, Vol. 21 Iss: 6, pp.623 – 635 Mehmet Taner. (2012) A Feasibility Study for Six Sigma Implementation in Turkish Textile SMEs, South East
European Journal of Economics and Business, Volume 7, Issue 1, Pages 63–71 Paulo A Cauchick Miguel, João Marcos Andrietta. An Exploratory-descriptive Survey on Six Sigma Utilisation in
Brazil, UNIMEP, Brazil Prabhakar Kaushik, Dinesh Khanduja, Kapil Mittal, Pawan Jaglan, (2012) A case study: Application of Six Sigma
methodology in a small and medium-sized manufacturing enterprise, The TQM Journal, Vol. 24 Iss: 1, pp.4 – 16
Prabhushankar, GV, Devadasan, SR, Shalij, PR (2009). Journey of Indian automobile components sector: from Quality Management System certification to innovation via Six Sigma, International Journal of Indian Culture and Business Management, 2 (2), 185-210
Raghunath A, Jayathirtha R V (2013). Lean Six Sigma approach for auto component manufacturing SMEs, Proceedings of International Simulation Conference of India, 2013, IITM Research Park, Indian Institute of Technology Madras
Roger Hoerl (2004). One perspective on the future of Six-Sigma. Int. J. Six Sigma and Competitive Advantage, 1 (1) Rajeshkumar U Sambhe, Dr. Rajendra S Dalu (2011). Evaluation of Critical Success Factors For Successful Six
Sigma Implementation in Indian Medium Scale Automotive Enterprises, International Journal of Engineering Science and Technology (IJEST), 3 (3)
Snee, R. D. and R. W. Hoerl (2003). Leading Six Sigma - A Step by Step Guide Based on Experience With General Electric and Other Six Sigma Companies. FT Prentice Hall, New York, NY
Thawani, S (2004). Six Sigma – strategy for organizational excellence. Total Quality Management, 15 (5–6), 655–
Page 55
Academy of Strategic Management Journal, Volume 13, Number 1, 2014
Timans, W. and Antony, J. and Ahaus, K. and van Solingen, R. (2012) Implementation of Lean Six Sigma in Small- and Medium-Sized Manufacturing Enterprises in the Netherlands), Journal of the Operational Research Society, Vol. 63, Issue 3, pp. 339-353, 2012
Töpfer Armin (2010). Six Sigma – Project management for zero defect quality in the automobile industry, www.slideshare.net/Sixsigmacentral/six-sigma-project-m... - United States
Venkateswarlu Pulakanam, Kevin E Voges (2010). Adoption of Six Sigma: Review of Empirical Research, International Review of Business Research Papers, 6(5), 149 – 163
Xingxing Zu, Lawrence D Fredendall (2006). Tina L Robbins: Organizational Culture and Quality Practices in Six Sigma, The 2006 Annual Meeting of the Academy of Management
Yang, K-J., Yeh, T-M., Pai, F-Y. and Yang, C-C. (2008) The analysis of the implementation status of Six Sigma: an empirical study in Taiwan, Int. J. Six Sigma and Competitive Advantage, Vol. 4, No. 1, pp. 60-80
Page 56
Academy of Strategic Management Journal, Volume 13, Number 1, 2014
Page 57
Academy of Strategic Management Journal, Volume 13, Number 1, 2014
CEO’S SHARE OF TOP-MANAGEMENT COMPENSATION, CHARACTERISTICS OF THE
BOARD OF DIRECTORS AND FIRM-VALUE CREATION
Sébastien Deschênes, University of Moncton Mohamed Zaher Bouaziz, University of Moncton
Tania Morris, University of Moncton Miguel Rojas, University of Moncton
Hamadou Boubacar, University of Moncton
ABSTRACT
The study examines if certain board of directors characteristics influence the CEO’s Pay Slice (CPS), i.e. the CEO’s share of the combined compensation received by the five top-paid executives of the firm. The results show that the CPS is positively affected by the percentage of independent directors and negatively linked to director stock ownership. We also examine if CPS increases company valuation by investors, as predicted by the tournament theory. Our results upheld this view, showing that there is a positive link between CPS and company market value as predicted by the tournament theory. Although the effect is significant at a threshold of 95%, CPS only explains a small percentage of the variance in company market value.
INTRODUCTION
The media attention concerning the compensation received by Chief Executive Officers (CEOs) has increased in the past two decades due to the growing gap vis-à-vis the middle class income (Abma, 2012; Anderson el al., 2004), the financial scandals in the wake of the recent global crisis, and the “Occupy Wall Street” movement (Sharma & Huang, 2010). In terms of corporate governance, CEO compensation is ultimately the board’s responsibility. The board of directors, by determining CEO compensation, contributes to establish the company’s compensation structure, especially by setting the gap between CEO compensation and that of the other company executives. Therefore, we pose ourselves the first research question, which is formulated as follows: Can board characteristics partially explain the CEO pay slice (CPS), i.e. the CEO’s share of the combined remuneration of the five top-paid executives. The board characteristics which are studied in our article are independence, size, total director compensation, stock-based director compensation, director stock ownership, directors’ average number of tenure years on the board and the CEO’s dual position as Chairman of the Board.
Page 58
Academy of Strategic Management Journal, Volume 13, Number 1, 2014
Another research question is connected with the impact that a greater CPS may have on firm market-valuation. Two theoretical views have been proposed to address this question. The tournament theory, which was initially formulated by Lazear and Rosen (1981), sustains that the compensation gap between the CEO and other executives, could be a source of motivation for the latter. This enhanced motivation could create company value. The fair-wage view, on the contrary, claims that the increased competition among the members of the executive team could be detrimental to cooperation, which in turn would be harmful for the company (Pfeffer, 1995; Deusch, 1985; Levine, 1991). If a greater CPS is a source of value creation, our study will support the tournament theory, whereas a negative link between CPS and firm value will upheld the fair-wage theory.
This study makes a unique contribution to the academic literature. To the best of the authors’ knowledge, it is the first to examine if board characteristics are determinants of CPS and if the latter can be a driver of the company’s market value. The study addresses this question in the context of Canadian capital markets. Specifically, it examines the research questions using as a sample the constituent firms of the S&P/TSX 60 index, which are the largest public Canadian companies.
The results indicate that CPS is positively related to the independence of the board of directors and negatively linked to director stock ownership. The largest CPS, where the greatest proportion of the board is independent, could be explained by the larger dependence to the CEO as a link to the company. The negative relationship observed for director stock ownership could be explained by tighter controls on CEO compensation by the directors having more common interests with shareholders. Results also that PRPDG has a positive effect on company market value, which agrees with tournament theory.
The following sections will successively present the literature review and the formulation of hypotheses, the methodology and sample, and the results and the conclusion.
II. LITERATURE REVIEW AND STATEMENT OF HYPOTHESES 2.1. The Tournament Theory
The compensation-performance relationship has been the object of several studies that attempted to analyze the legitimacy of awarded salaries and its links with performance. The effects on firm performance of actions advanced by executives were frequently correlated with their compensation.
In particular, wage dispersion seems to have an impact on the effort made by the worker, and therefore the performance of the company. The "Tournament Theory", put forward by Lazear and Rosen (1981), refers to the idea that wage dispersion enhances worker motivation. The central idea of this theoretical approach is that the effort of a worker not only depends on the level but also the wage gap within the firm, which consequently affects organizational performance. Firms
Page 59
Academy of Strategic Management Journal, Volume 13, Number 1, 2014
should therefore adopt performance-based compensation systems and assign the highest reward to the most productive worker. Wage inequality is thus understood as a source of competition between workers. Therefore the relationship between pay dispersion and performance is positive.
In other words, according to the Tournament Theory, companies perform better when their wage structure is more dispersed. Wage dispersion thus stimulates the performance of a firm, by helping firms to avoid agency costs (Lee et al., 2008). Empirical examinations of this theory show mixed results. Hibbs and Locking (2000), working on a sample of Swedish firms between 1964 and 1993, confirm the hypothesis of a higher productivity of a firm in the presence of a dispersed wage structure. Lee et al. (2008) also found results supporting the tournament theory using a sample of U.S. firms for the years 1992-2003. Their results indicate that the financial performance of firms is positively associated with the dispersion of earnings within the management team and that this relationship would be even stronger in firms where agency costs associated with executive discretionary power may be higher. According to Sharma and Huang (2010) this relationship only prevails in firms whose CEO receives the highest compensation among the members of the management team. Other studies tend to infirm the tournament theory. Winter-Ebmer and Zweimüller (1999) analyzed the impact of wage dispersion on the performance of Austrian companies during the period 1975-1991. They find that wage structure that is too dispersed weakens the performance of a firm by creating problems with perceptions of lack of fairness and diminished cohesion among workers. The results of Bebchuk et al. (2011) support the fair-wage theory by establishing that the value of firms (measured by industry-adjusted Tobin's Q) is negatively related to the CEO pay slice (CPS). Their results also show that an increased CPS is associated with lower accounting profitability, the granting of options to the CEO on favorable terms, greater disconnection between CEO retention and the performance of the firm, and negative stock market reactions when information on compensation of the management teams in circulars arrives is made public. These results support the fair-wage theory. 2.2. The fair-Wage Theory
According to Hicks (1963), a prerequisite for organizational efficiency is to ensure that there are no intense feelings of unfairness among employees operating within a team. This would likely reduce their effectiveness. In this sense, some authors (Pfeffer, 1995; Deusch, 1985; Levine, 1991) argue that a large wage gap would lead to divisions within the same team. Indeed, for some employees, the spirit of competition can lead them to develop a desire to harm their rivals, while for others, these wage differentials can lead to a strong sense of dissatisfaction that will encourage them to divest from their work (Cowherd & Levine, 1992). In both cases, this will have the effect of reducing the performance of the company, especially for businesses where teamwork is essential.
Page 60
Academy of Strategic Management Journal, Volume 13, Number 1, 2014
We argue that the previous discussion allows us to apply the theory of "fair wages" to the context of executive compensation. This view calls for a salary proportionate to the effort and low wage differentials between employees operating within a team. According to the approach, employees of the company will emphasize team spirit and will set common goals.
Some empirical tests support fair-wage theory. Some authors report a positive relationship between fair wage differentials and various performance measures, including product quality (Cowherd & Levine, 1992), productivity (Pfeffer & Langton, 1993) and performance employees (Bloom 1999). Likewise, Drago & Garvey (1998) show a negative relationship between monetary incentives and cooperation within teams. In addition, Carpenter & Sanders (2002) found a positive relationship between “fair-wage” differentials and financial performance measured by Tobin's Q. Furthermore, Bebchuk, Cremers & Peyer (2010) report as well a negative relationship between CPS and Tobin's Q, giving credence to the “fair-wages" view. Nonetheless, Lee, Lev and Yeo (2008) found an inverse relationship between the two notions. Our research intends to provide an answer to two interrelated questions. Firstly, we asked ourselves if board characteristics are related to the decision on the CEO’s share of total top-management compensation. Boards receive important powers from shareholders who appoint them. In fact, Fama and Jensen (1983) argued that they constitute the main mechanism of internal corporate governance. Thus, boards can hire and fire company top officials (including the CEO) and also they set the level and other aspects of compensation (Farrell & Whidbee, 2000; Yermack, 2004). We therefore reason that traits of the boards connected in previous literature as potential value drivers could have an impact in the determination of CEO’s share in total top-management compensation. Those traits are connected with: board independence, its size, total compensation of directors, percentage of option-based remuneration of directors, firm ownership of directors, directors’ tenure and the dual role of the CEO as a president of the board. Those aspects are the object of hypotheses 1 to 7. Secondly, does a larger CPS create firm value? In other words, we examine if the available data support the “tournament theory” or the “fair wage” views. This is the last of our hypotheses. The setting of our hypotheses is the object of next section of the study. 2.3. Research Hypotheses
Agency theory states that the role of the board is to ensure that decisions made by the leaders are in the interests of shareholders. One of the most important decisions that falls within the scope of the board is to set the compensation of the CEO. Thus, on the basis of this theory and according to authors like Dalton et al. (1998), Westphal and Zajac (1994), the effectiveness of the disciplinary function exercised by the board of directors is likely to be enhanced if the directors who compose it are deemed independent. Arguably, a high proportion of independent directors on the board, strengthens the power of the latter. According to Core et al. (1999), independent directors evaluate the performance of managers and determine their compensation. In the same vein, Mehran (1995) finds that companies that have a significant number of independent directors
Page 61
Academy of Strategic Management Journal, Volume 13, Number 1, 2014
prefer a stock-based compensation so that executive salaries are more aligned with their performance.
However, if non-independent (insider) directors are numerous within the board, there will be little control over CEO compensation, which shall be higher, especially when the CEO also holds the position of Chairman of the Board of Directors (Core et al., 1999). Non-independent directors have little interest in opposing the leader by challenging the level of compensation, even if it seems excessive (Malette et al., 1995; Bebchuk & Fried, 2006). Because the CEO commands the highest authority of the firm, non-independent directors are aware of his power, and could be afraid of being punished if they act against the interests of the CEO, contrary to independent directors. In Canada, St-Onge et al. (2001) conclude that the proportion of insider directors on the board positively influences both short-term compensation and total compensation of company CEO’s. H1 CPS is negatively linked to the proportion of independent directors within the board.
Several researchers, such as Li (1994), and Upneja and Ozdemir (2012) argue that the size of the board is an important indicator of its ability to control the compensation of the management team. In fact, the larger the board of directors, the more complicated a critical decision will be (for instance, setting the CEO’s salary). A higher number of directors makes more difficult to build a consensus among themselves concerning the remuneration of the CEO. This argument is supported by Core et al. (1999) who mention that larger boards reduce the level of control and that one can observe a higher CEO compensation in such companies. The results of Ozkan (2007) point in the same direction, by showing a higher CEO compensation for firms with a greater number of directors on their board. Nonetheless, Yermack (1996) finds that executive pay is higher in firms with a board of directors composed of a small number of directors. Our hypothesis is formulated on the premise that good governance diminishes with the size of boards and therefore the share of the pay of the management team going to the CEO is increasing with the size of boards. H2 CPS is positively related to the size of the board of directors.
Several arguments have been put forward by researchers concerning the issue of total director-compensation. A first line of reasoning claims that directors seeking to maximize their wealth must attempt to convey to the market that they perform their duties diligently (Weisbach, 1988). Thus, they can increase their chances of being invited to sit in other boards or in boards of more prestigious (Fama & Jensen, 1983). Thus, directors have an interest in controlling CEO compensation to avoid excesses, because this can be perceived as a signal of good governance. Another argument, going along the same lines, associates the quality of the directors with their remuneration level. The higher pay would attract better directors that would help to contain CEO compensation. If these arguments are right, CPS should be lower.
Page 62
Academy of Strategic Management Journal, Volume 13, Number 1, 2014
Contrary to previous arguments, some empirical studies show that CEOs may hold an
influence over the board of directors (Byrd, Cooperman & Wolfe, 2010), instead of being controlled by it. In this case, the directors might be complacent with the CEO to increase their chances of re-election or occupy better positions on the board. According to Bebchuck et al. (2010), CEOs who dominate their boards appropriate a larger share of total compensation received by the management team.
Our hypothesis will be based on the argument that well-paid directors engage in better quality work and are more likely to worry about their reputation in the market for corporate directors. Therefore, they attempt to limit CEO compensation, which in turn reduces CPS. H3 CPS is negatively related to director compensation.
The survey of Magnan et al. (2010) on the remuneration of directors suggests that stock-based compensation encourages the board to enhance control activities, resulting in value creation. Along the same lines, Perry (1998) establishes a link between stock-based compensation of directors and the likelihood that the CEO of a poorly performing firm be replaced. It is then possible to hypothesize that boards on which a greater ratio of their compensation is stock-based may be more effective at limiting CEO compensation. In such a situation, the ratio of CEO share of total remuneration perceived by top management should have a negative relationship with the ratio of stock-based remuneration of directors.
H4 CPS is negatively related to directors’ stock-based compensation.
The agency theory asserts that higher ratios of equity ownership by managers ensure a better alignment of their interests with those of shareholders, because this limits some agency costs, including those related to the determination of executive compensation. More specifically, if the directors hold a significant stake in the company, the risk of improper compensation policy to the detriment of shareholders would be hold in check. These predictions were verified by Ozkan (2007), who found that CEO compensation is lower when directors have a higher stake in the company, corroborating the findings of Lambert et al. (1993) and Core et al. (1999). Furthermore, Broye and Moulin (2010) argued that a CEO who is a block-holder will accept that a high ratio of his remuneration be flexible and therefore, dependent on the performance of the firm. Mendez et al. (2011) find that the volume of stock held by the firm-insider directors negatively affects executive compensation. This result could be interpreted as evidence of alignment with shareholders' interests. Therefore, equity ownership of directors increases the likelihood of a better control of CEO pay and in turn, of a lower CPS.
Page 63
Academy of Strategic Management Journal, Volume 13, Number 1, 2014
H5 CPS is negatively linked to director stock ownership.
Corporate governance could be enhanced by the average number of years of directors’ tenure. An experienced board would have a better understanding of the company and thus, it could exercise better governance (Anderson et al., 2004). In addition, newly-appointed directors may be less critical of the work of CEOs, especially if they are partly indebted to them for their appointment (Westphal & Zajac, 1995) and (Bebchuk et al., 2002). The empirical results do not support the view of longer director tenures enhancing monitoring. Instead, those results support the hypothesis of a degradation of the independence of directors as their tenure increases. Anderson et al. (2004) found that the cost of the debt increased by 2.5 basis points when the tenure of directors went from seven to eight years. Byrd et al. (2010) reported a positive relationship between CEO compensation and the average number of tenure years of directors, when CEOs had been in office during six years or more. This means that the CEOs would acquire a certain influence on the board as their own tenure increases, which is compounded by the fact that board’s incumbents usually retain their position. Therefore, according to this view CEOs receive higher compensation in companies in which the directors have been serving on the board for a longer period. The consequence of this higher compensation is that the CPS should be higher in the presence of an experienced board of directors. H6 CPS is positively related to the average number of years of directors’ tenure.
Duality means that the same person occupies the position of CEO and chairman of the board of directors during a timeframe. The chairman of the board of directors has the task of conducting meetings and setting the agendas. He is also an influential figure in matters concerning the enrollment, motivation, evaluation and compensation of the CEO, and in the nomination of directors (Patton & Baker, 1987). Given the extent of the authority reserved to the chairman, the duality can impair the functioning of the board.
The agency theory, particularly Jensen and Meckling (1976) and Jensen (1993), suggests the separation of the functions of the chairman of the board and the chief executive officer (CEO) in order to heighten the effectiveness of the board. Indeed, agency theory considers the presence of the CEO-chairman duality in a company as a hindrance to the effectiveness of the monitoring capacity of the board.
According to Sarkar et al. (2009) duality results in jeopardizing the proper functioning of the board, because it renders the directors dependent of the CEO, thus creating a faulty control system, encouraging opportunism of the latter. Tuggle et al. (2008) concluded that the sharing of power between the CEO and the board is a factor that can determine the ability of the CEO to carry out his functions. The study by Forker (1992) supports the view of the lack of effectiveness of the board when the same person holds both positions. The author finds that there is a lower quality of
Page 64
Academy of Strategic Management Journal, Volume 13, Number 1, 2014
voluntary disclosure of information about stock options when the CEO is also chairman of the board.
In agreement with this statement, the theory of managerial hegemony (Malette, Middlemist Hopkins, 1995; Vance, 1983; cited by St-Onge et al., 2001) argues that CEOs exerting greater influence over the board tend to receive higher pay (Hill & Phan, 1991; Core et al., 1999), which is not sensitive to the company performance (Ryan & Wiggins, 2004), and a larger CPS (Bebchuk et al., 2010). The results of Lee et al. (2008), supporting the tournament theory, show a positive relationship between the CPS and the firm performance. However, according to the same authors this relationship is weaker when the CEO also chairs the board.
We hypothesize that a CEO exercising influence over its board by means of a dual position as chairman benefit from a larger CPS. H7 CPS is positively related to the appointment of the same person as CEO and chairman of the board.
The model with our seven first hypotheses includes six control variables. The Total Assets variable was introduced to account for the size of the company, which is likely to indicate the number of hierarchical levels and the number of vice-president positions. Companies with several hierarchical levels would be more likely to give larger compensation to the CEO, the ultimate winner of all tournaments (Siegel & Hambrick, 2005). In companies where there are several vice-presidents, the wage gap between them and the CEO would be higher (Bebchuk et al., 2001). Studies on CPS generally incorporate a variable that takes into account the size of the company. For example Sharma and Huang (2010) used the log of total assets, Siegel and Hambrick (2005) the number of employees, Bebchuk et al. (2011) and Lee et al. (2008) used sales.
The model dealing with our first seven hypotheses also takes into account a dummy variable, intended to isolate the effect of family ownership of firms, because family-controlled firms face different situations in terms of agency conflicts between managers and shareholders (Sharma & Huang, 2010). According to Li et al. (2011) the incentives related to the tournament theory would be less important in this type of companies. The model also includes three dummy variables to highlight the effect of sectors on CPS. Thus, we isolate materials, energy and financial sectors, which together represent more than 75% of the Canadian market capitalization. In addition, as Sharma and Huang (2010) and Bebchuk et al. (2011) suggest, a variable to take into account the leverage ratio is included in the model.
A compensation structure that markedly differentiates CEO compensation with respect to the other members of the management team should motivate executives to excel, in order to display a performance that could make them reach the top of the hierarchical pyramid and with it, receive all the benefits associated with such a position. This competition, if it is works well, would create value for firms. Instead, fair-wage theory argues that a large gap between CEO compensation and that of other executives reduces cooperation. The subordinate members of the management team
Page 65
Academy of Strategic Management Journal, Volume 13, Number 1, 2014
compete to win the tournament, which can lead to the CEO position. This opportunistic behavior would be likely to limit the creation of value at the company level. Hypothesis 8 proposes that CPS is a source of value creation.
The results of the study by Lee et al. (2008) support the tournament theory, on the basis of data ranging from 1992 to 2003. They report that firm performance, measured by Tobin's Q and the stock market return are positively associated with the disparity among the remuneration of members of the management team. According to the same authors, this relationship is more pronounced in companies likely to have higher agency costs and those with higher ratios of independent directors. Sherman and Huang (2010) concluded that in companies where the salary structure ensures that this is not the CEO who receives the higher pay, there is no value creation associated with compensation gaps. However, in companies where the CEO receives the highest compensation, the wage gap vis-à-vis the subordinates would lead to value creation.
The results of Bebchuk et al. (2011) do not support the tournament theory and confirm fair-wage theory. Indeed, with data from 1993 to 2004, they found a negative relationship between CPS and the value of the business as measured by the industry-adjusted Tobin's Q. According to the same authors, CPS would be associated with lower accounting profitability, lower stock market returns at the announcement of an acquisition, allocations of call options to the CEO at times that are more favorable for him, and less frequent dismissal of CEOs in poorly performing firms. Taken together, these findings support the existence of agency costs associated with a relatively high CEO compensation, thus contradicting the tournament theory.
H8 There is a positive relationship between market value and CPS.
Hypothesis 8 is formulated on the basis of the tournament theory. Assuming that the hypothesis is rejected by a negative and significant coefficient, this result will support fair-wage theory.
III. MODEL, METHODOLOGY AND SAMPLE 3.1. Boards characteristics
The first model seeks to determine whether certain characteristics of the board of directors may explain CPS. Total assets, leverage, industry, and the dummy for family ownership variables are used as control variables. The variables associated to the research hypotheses are then added to the model.
, , , , , , ,
, (1)
Page 66
Academy of Strategic Management Journal, Volume 13, Number 1, 2014
, , , , , , ,
, , , , , ,
, , (2) Where:
CPS i,t CEO compensation divided by the compensation of five top-paid executives of firm i six months after year-end t;
Assets i,t Total assets of firm i at year-end t; LEV i,t Total liabilities divided by total assets of firm i at year-end t; SECM i,t Dummy variable set to one if firm i is in the mining and metals sector at year-end t, and set to zero
otherwise; SECE i,t Dummy variable set to one if firm i is in the energy at year-end t; and set to zero otherwise; SECF i,t Dummy variable set to one if firm i is in the financial sector at year-end t; and set to zero otherwise; FAM i,t Dummy variable set to one if firm i is controlled by a family at year-end t; and set to zero otherwise; IND i,t The percentage of independent directors serving in the board during fiscal period t for company i; SIZE i,t The number of directors serving on the board during fiscal period t for company i; REMA i,tTotal director compensation during fiscal period t for company i; REMAA i,t Directors’ stock-based compensation as a percentage of their total remuneration during fiscal year
t and firm i; OWN i,t The percentage of common shares outstanding held by directors in fiscal period t for company i; TEN i,t The directors’ average number of years of tenure on the board in fiscal period t for company i. DUA i,t Dummy variable set to one if different individuals serve as chairman of the board and CEO in fiscal
period t for company i, and set to zero otherwise. ε i,t Error term.
3.2. Larger CPS and firm value creation
The second model examines if a larger CPS may be linked to higher firm market values. The control variables are those of Ohlson’s (1995) model, i.e. total book value of the equity and net earnings. The variables associated to the hypothesis are then added to the equation.
, , , , (3)
, , , , , (4) Where:
MVi,t Market value of firm i six months after year-end t; BVi,t Total book value of equity of firm i at year-end t ;
Page 67
Academy of Strategic Management Journal, Volume 13, Number 1, 2014
EARi,t Earnings of firm i at year-end t ; CPSi,t CEO compensation divided by compensation of the five top-paid executives in firm i six months
after year-end t.
3.3. The sample The sample comprises the constituent companies of the S & P/TSX 60 index as of July 1st, 2011. This index includes the largest public Canadian companies. The period under study covers the six fiscal years from 2005 to 2010. The maximum number of observations is thus 360. Of these, 59 observations were withdrawn due to missing data.
Share prices were obtained from the Thomson Reuters database. Total assets, earnings and the number of common shares outstanding were compiled from financial statements available on the SEDAR website. Total director compensation, the ratio of directors’ stock-based compensation, the percentage of independent directors, the number of directors on the board, the percentage of shares owned by directors, the number of years of directors’ tenure and the dual role of CEO and chairman were compiled from the information circulars.
IV. EMPIRICAL RESULTS AND DISCUSSION 4.1. Descriptive Analysis
Academy of Strategic Management Journal, Volume 13, Number 1, 2014
CEOs receive an average of 41.37% of the top-management compensation, with the
standard deviation being 14.82%. The minimum value for this variable is 8.74% and the maximum is 91.8%. The value of total assets of a company ranges from 842 million to 726 billion, with average total assets of $68 billion and a standard deviation of $137 billion. Leverage varies from 0.1254 to 0.9617 with an average of 0.58202 and a standard deviation of 0.2268. Firm-market values range from a minimum of 773 million to a maximum of $79 billion with an average value of $18 billion and a standard deviation of $16 billion. The average book value is $9 billion with a standard deviation of $8 billion. The book value ranges from 618 million to 42 billion. Earnings ranges from a $4.5 billion loss to a profit of $7.2 billion, with an average of $1.2 billion.
Boards have on average 82% of independent directors, and 12 directors. The average board compensation is 2.2 million and 50.77% of the compensation is based on shares. That equity-based compensation varies from 0% to 95.19% of total remuneration, with a standard deviation of 26.08%. The average proportion of shares held by directors is 4.01%. Tenure of a director on the board is on average 6.9 years. 4.2. CPS hypotheses regarding the board of directors characteristics
Table 2 Ratio of CEO’s to Top-Management Compensation
SIZE -0.006 -1.196 REMA -2.57E -9 -0.739 REMAA -0.028 -0.824 OWN -0.003 -3.349*** TEN -0.004 -1.036 INDPDGVP 0.041 1.450 N 301 301 R² 0.060 0.188 Adjusted R² 0.041 0.151 Increase in Adjusted R2 0.110***
Page 69
Academy of Strategic Management Journal, Volume 13, Number 1, 2014
The regression including the control variables, but not those associated to the research hypotheses (equation 1) is significant at a threshold of 99%. However, it only explains 4.1% of the dependent variable variability. The control variables associated with the dummies for mining and energy sectors are positive and significant at the respective thresholds of 99% and 90%. This indicates that for these sectors, CPS is significantly higher.
Adding to the regression the variables associated to our hypotheses (equation 2) increases the adjusted R2 from 4.1% to 15.1%. This increase is significant at a 99% level of confidence. The ensemble of board characteristics is thus very important in explaining CPS.
More specifically, the variable associated with the research hypothesis concerning the percentage of independent directors is positive and significant at a 90% of confidence. This means that there is a positive relationship between the percentage of independent directors and the CEO pay slice. This result contradicts the hypothesized ability of independent-dominated boards to control CEO compensation (Core et al., 1999). The result rather suggests that boards with a higher proportion of independent directors would favor a compensation structure based on the tournament theory. Their status as independent directors could encourage them to do so, given the difficulty for them to measure the performance of leaders. The wage gap between the CEO and the other members of the management team serves as a source of motivation for everyone to give the best of himself. It may also be that the CEO is in a dominant position on the board when he is the only intermediary between the board and the company.
The estimated coefficient for the variable associated with director stock ownership is negative and significant at 99%. That is to say that the larger is a director’s stake on of the company, the less likely he will be to grant a high CPS. This relationship can be explained by better control of CEO compensation by directors whose interests are better aligned with those of shareholders, due to the significant interest held by them collectively in the company (Ozkan, 2007; Core et al., 1999; Lambert et al. 1995). The lower CEO compensation would then ensure that the CPS would also be lower. 4.3. Hypothesis on the effect of CPS on firm value
Table 3 Statistical Analysis of the Model on Company Market Value
Independent Variables5 Equation 3 Equation 4 Coefficient t Coefficient t
Constant4 3,644 M 4.347*** -73 M -0,042 BV 1.142 12.401*** 1,145 12,525***
EAR 3.897 6.806*** 3,910 6,884***
CPS5 8 896M 2,397**
N 301 301 R² 0.650 0.657 Adjusted R2 0.648 0.653 Increase in adjusted R2 0.005**
Page 70
Academy of Strategic Management Journal, Volume 13, Number 1, 2014
The estimation of the coefficients for equation 3 is presented in Table 3. Results show that
64.8% of the market value of the company is explained by the book value of equity and net earnings. This regression is significant at 99%. The two control variables in the model of Ohlson (1995), book value of equity and earnings, are as expected, positive and significant at 99%.
The contribution of the CPS variable, added in Equation 4 increases the adjusted R2 to 65.3%. This increment of 0.005 in the adjusted R2 of is significant at 95%. The coefficient associated to the CPS is is positive and significant at 95%, giving support to the tournament theory, claiming that CPS is a driver s of firm-value. We have to take this result with a grain of salt, though. Firstly, our sample included only one company in the technology sector. It has been argued (Siegel & Hambrick, 2005) that successful operation of firms in the technology sector requires more cooperation. This makes those firms less likely to establish a compensation structure derived from the tournament theory. Secondly, our sample includes the largest public Canadian companies. Siegel and Hambrick ( 2005) have argued as well that large firms tend to create compensation structures based on the tournament theory, because they are more suitable to control for the agency costs arising from the high number of hierarchical levels. Finally, it is also important to mention that although the estimated coefficient for CPS is significant and positive, the introduction of this variable in the regression leads to a limited increment in the R2.
V. CONCLUSION
CEO compensation modalities, including it “excessive” nature in the view of many ordinary citizens hit the news with great frequency. Many empirical studies have examined the issue and some have discussed it in terms of effectiveness of the board of directors (Lee et al., 2007). What distinguishes the present study is that it relies on the tournament and the fair-wage approaches to understand the importance of CPS. Tournament theory, which can be traced back to Lazear and Rosen (1981), argues that the gap in compensation is a source of motivation, and ultimately, of market value, thus favoring higher levels of CPS. Contrary to it, the fair-wage theory sustains that lower wage differentials enhance collaboration within the managerial team (Pfeffer, 1995; Deusch, 1985; Levine, 1991).
Our article examined in the context of large public Canadian companies, if the characteristics of the board, such as independence, size, remuneration of directors, stock-based compensation of directors, director firm-ownership, the average number of tenure years of directors and the dual role of the CEO, influenced the choice of a compensation structure for the top management more akin to the tournament theory or the fair-wage theory. It appears that boards with a larger percentage of independent directors favor a salary-structure predicted by the tournament theory, whereas those with high director stock ownership appear willing to contain CPS, thus conforming to the explanations of fair-wage theory. The results also indicate that CPS is associated with a higher market valuation, after considering the control variables of the model
Page 71
Academy of Strategic Management Journal, Volume 13, Number 1, 2014
by Ohlson (1996). That is to say, our results give credence to the predictions of the tournament theory, because CPS shows a positive association with the market value of the company.
We acknowledge that research in the Canadian context ensures that the companies in mining and metals, energy and financial sectors are overrepresented. This was partly addressed by means of the inclusion of three dummy variables used to isolate the effect of each of these sectors. It appears that the CPS is higher in the mining and metals industry. This study opens the door to a new area of research which can see the responsibility of boards not only in terms of supervision, evaluation and remuneration of the CEO, but also in terms of its effective and fair nature compared to the entire management team.
ENDNOTES 1 Variables Assets, REMA, MV, BV and EARN are stated expressed in millions of Canadian dollars. 2 CPS = CEO compensation divided by compensation of 5 top-paid executives of firm i six months after year-
end t; total assets of firm i at year-end t; LEVi,t = total assets divided by total liabilities of firm i at year-end t; SECMi,t = dummy variable set to one if the firm i is in the mining and metals sector at year-end t, and set to zero otherwise; SECEi,t = dummy variable set to one if firm i is in the energy sector at year-end t, and set to zero otherwise; total assets divided by total liabilities of firm i at year-end t; SECIFi,t = dummy variable set to one if firm i is in the financial industry at year-end t, and set to zero otherwise; FAMi,t = dummy variable set to one if firm i is controlled by a family at year-end t,, and set to zero otherwise; IND i,t = The percentage of independent directors in fiscal period t for company; SIZE i,t = the number of directors on the board during fiscal period t for company i; REMA i,t = total director compensation; REMAA i,t = Ratio of director compensation that is stock-based; OWN i,t = The percentage of common shares outstanding held by directors in fiscal period t for company i; TEN i,t = The directors’ average number of years of tenure on the board in fiscal period t for company i.
3 Assetsi,t = total assets of firm i at year-end t; EARi,t = earnings of firm i at year-end t ; IND i,t = The percentage
of independent directors in fiscal period t for company i; SIZE i,t = The number of directors on the board during fiscal period t for company i; REMA i,t = Total director compensation; REMAA i,t = Percentage of directors’ compensation that is stock-based; OWN i,t = The percentage of common shares outstanding held by directors in fiscal period t for company I; TEN i,t = The directors’ average-number years of tenure on the board in fiscal period t for company i.
4 Coefficients associated to the constant and the CPS variable are stated in millions of Canadian dollars. 5 BVi,t = Market value of firm i six months after year-end t; EARi,t = earnings of firm i at year-end t ; CPS i,t
= CEO compensation divided by the combined compensation of 5 top-paid executives of firm i six months after year-end t.
Page 72
Academy of Strategic Management Journal, Volume 13, Number 1, 2014
REFERENCES Abma, D. (2012). Canadian CEOs make average worker’s salary in three hours of first working day of year. The
Financial Post. Retrieved January 3, 2012 from http://business.financialpost.com/2012/01/03/top-canadian-ceos-make-average-workers-salary-in-three-hours/
Anderson, R.; Sattar, M. & Reeb, D. (2004). Board characteristics, accounting report integrity, and cost of debt. Journal of Accounting and Economics, 37(3), 315-342. Bebchuk L. A. & Fried J. M. (2006). Pay without Performance: Overview of The Issues. Academy of Management
Perspectives, 20(1), 5-24. Bebchuk, L.A., Cremers, K. J.M. & Peyer, U.C. (2011). The CEO pay slice. Journal of financial Economics, 102(1),
199-221. Bebchuk, L., Fried, J. M., & Walker, D. I. (2002). Managerial power and rent extraction in the design of executive
compensation, Economics and Business Discussion Paper Series, ISSN 1045-6333, Harvard Law School, Retrieved October 10, 2012 from http://lsr.nellco.org/cgi/viewcontent.cgi?article=1154&context= harvard_olin
Broye, G. & Moulin, Y. (2010). Rémunération des dirigeants et gouvernance des entreprises : le cas des entreprises françaises cotées. Finance, Contrôle, Stratégie, 13(1), 67-98.
Byrd, J., Cooperman, E.S., & Wolfe, G. (2010). Director tenure and the compensation of bank CEOs. Managerial Finance, 36(2), 86-102.
Conyon, M.J., & Peck, S.I. (1998). Board control, remuneration committees, and top management compensation, 41(2), 146-157.
Core J., Holthausen R. & Larcker D. (1999). Corporate governance, chief executive officer compensation, and firm performance. Journal of Financial Economics, 51(3), 371-406.
Dalton, D. R., Daily, C. M., Ellstrand, A. E.,& Johnson, J. L. (1998). Meta-analytic reviews of board composition, leadership structure, and financial performance. Strategic Management Journal, 19(3), 269-290.
Dechow, P.R. Saloan, & Sweeny, A. 91996). Causes and Consequences of Earnings Manipulation. Contemporary Accounting Research, 13(1), 1-36.
Fama, E. F. & Jensen M. C. (1983). The separation of ownership and control, Journal of Law and Economics. 26(2), 301-325.
Forker, J.J. (1992). Corporate Governance and Disclosure Quality. Accounting and Business Research, 22(86), 111-125.
Hibbs, D. & Locking, H. (2000). Wage Dispersion and Productive Efficiency: Evidence for Sweden. Journal of Labor Economics, 18, 755-782.
Hill, C. W. L., & Phan, P. (1991). CEO tenure as determinant of CEO pay. Academy of Management Journal, 34(3), 707-717.
Jensen, M.C. & Meckling, W.H. (1976). Theory of the firm: managerial behavior, agency costs and ownership structure. Journal of Financial Economics 3(4), 305-360.
Jensen, M.C. (1993). Organization Theory and Methodology. The Accounting Review, 58(2), 319-339. Lambert R. A., Larcker D. F. & Weigelt K. (1993). The Structure of Organizational Incentives. Administrative Science
Quarterly, 38(3), 438-461. Lazear, E. & Rosen, S. (1981). Rank-order Tournaments as Optimum Labor Contracts. Journal of Political Economy,
89(5), 841-864. Lee, K.W., Lev, B. & Yeo, G.H.H. (2008). Executive pay dispersion, corporate governance, and firm performance.
Reviewof quantitative finance and accounting, 30(3), 315-338. Li, J. (1994). Ownership structure and board composition: A multi-country test of agency theory predictions.
Managerial and Decision Economics, 15(4), 359-368.
Page 73
Academy of Strategic Management Journal, Volume 13, Number 1, 2014
Li, Z., Ryan, H.E. & Wang, L. (2011). The economics of executive compensation in family firms. Working paper. Magnan, M., St-Onge, S., & Gélinas, P. (2010). Director compensation and firm value: A research synthesis.
International Journal of Disclosure and Governance, 7(1), 28-41. Malette P., Middlemist R. D. & Hopkins (1995). Social, Political and Economic Determinants of Chief Executive
Compensation. Journal of Managerial Issues,7(3), 253-276. Mehran, H. (1995). Executive compensation structure, ownership, and firm performance. Journal of Financial
Economics, 38(2), 163- 184. Méndez, C. F., García, R. A. & Rodríguez, E. F. (2011). Corporate governance and executive pay in the Spanish
market. The Spanish Review of Financial Economics, 9(2), 55-68. Ozdemir, O., & Upneja, A. (2012). Board structure and CEO compensation: Evidence from U.S. lodging industry.
International Journal of Hospitality Management, 31(3), 856-863. Ozkan, N. (2007). Do corporate mechanisms influence CEO compensation? An empirical investigation of UK
companies. Journal of Multinational Financial Management, 17(5), 349-364. Patton, A. & Baker, B.J. (1987). Why Won’t Directors Rock the Boa. Harvard Business Review, 65(6), 10-18. Perry, T. (1998). Incentive compensation for outside directors and CEO turnover. Arizona State Working Paper. Rechner, P.L & Dalton, D.R. (1991). CEO Duality and Organizational Performance: A Longitudinal Analysis.
Strategic Management Journal, 12(2), 155- 161. Ryan, H. & Wiggins, R. (2004). Who is in whose pocket? Director compensation, board independence, and barriers
to effective monitoring. Journal of Financial Economics, 73(3), 497-524. Sarkar, J. & Sarkar, S. (2009). Multiple board appointments and firm performance in emerging economies: Evidence
from India. Pacific-Basin Finance Journal, 17(2), 271- 293. Sharma, Z. & Huang, W. (2010). When do pay spreads influence firm performance ? Working paper. Siegel, P.A. & Hambrick, D.C. (2005). Pay disparities within top management groups: Evidence of harmful effects
on performance of high-technology firms. Organization science, 16 (3), 59-274. St-Onge, S., Magnan, M. & Calloc’h, Y. (2001). Conseils d’administration et rémunération des dirigeants d’entreprise
au Canada : Une perspective politique. Revue canadienne des sciences de l’administration, 18 (2), 57-16. Tuggle, C.R., Reutzel, C.R. & Bierman, L. (2008). CEO duality and board attention to monitoring and control.
Academy of Management Proceedings, August 1, 1-6. Weir, C. & Laing, D. (2002). Internal and external governance mechanisms: Their impact on the performance of large
UK public companies. Journal of Business Finance and Accounting, 29(5-6), 579-611. Weisbach, M. (1988). Outside directors and CEO turnover. Journal of Financial Economics, 20, 431-460. Westphal, J. D. & Zajac, E. J. (1994). Substance and symbolism in CEOs' long-term incentive plan. Administrative
Science Quarterly, 39(3), 367-390. Winter-Ebmer, R. & Zweimuller, J. (1999). Intra-firm Wage Dispersion and Firm Performance. Kyklos, Wiley
Blackwell, 52(4), 555-572. Yermack, D. (1996). Higher Market Valuation of Companies with a Small Board of Directors. Journal of Financial
Economics, 40(2), 185-211.
Page 74
Academy of Strategic Management Journal, Volume 13, Number 1, 2014
Page 75
Academy of Strategic Management Journal, Volume 13, Number 1, 2014
RESOURCE VALUE AS A SOURCE OF NEGOTIATING POWER: DETERMINANTS OF ALLIANCE FUNDING
AMOUNTS IN THE US BIOTECH INDUSTRY.
Paul Forshey, High Point University
ABSTRACT
I examine sources of bargaining power in the form of complementary resource possession. I postulate that relative value of the resources held by the firms involved an alliance predicts the level of payments promised by funding firms (firms which provide money to develop prospective products) to the early stage technology ventures (young firms which uncover the new technology to be developed into a commercializable product). On the one hand, innovative ideas are potentially valuable resources for an early stage technology venture. Thus, a more valuable innovative idea should generate larger promised remuneration for early stage technology firms upon signing an alliance agreement. However, established firms hold valuable resources of its own and one would expect established firms to leverage those resouces in such a way as to minimize the amount of money it is willing to payout as part of the alliance contract. I examine the effects these two countervailing forces have on money promised to the early stage technology venture by the funding firm. Specifically, I believe the funding firm's various complementary resources negatively moderate the relationship between the value of the early stage venture's innovative idea and the remuneration promised the early stage venture in a collaborative agreement. I use a sample of biotech firms forming alliances with established pharmaceutical companies to test our hypotheses, and I find, as predicted, the value of the new venture's innovative ideas tends to increase the amount of money in the alliance contract. I also find support for my contention that the strength of the funding firm's complementary resources negatively moderates this relationship such that less money is offered the early stage venture when the funding firm holds more valuable complementary resources.
1. INTRODUCTION This research focuses on the competition for benefits among alliances partners during the
alliance formation process. Collaborating can create inherent tensions as partners balance the urge to appropriate the benefits an alliance creates against the desire to achieve collaborative goals (Coombs Mudambi and Deeds, 2006, Kogut, 1988; Patzelt, Shepherd, Deeds, and Bradley, 2008; Zeng and Chen, 2003). Competition among partners during the alliance formation process, no
Page 76
Academy of Strategic Management Journal, Volume 13, Number 1, 2014
doubt, increases opportunistic behaviors in knowledge-intensive collaborations as firm position themselves to maximize their own returns on investments (Deeds and Hill, 1998; Gans & Stern, 2003).
There are two somewhat different opinions as to which partner is most likely to benefit more from alliance in the existing literature. Teece (1986) contends early stage firms developing innovative products often find it difficult to profit from the innovative product when the alliance partner controls specialized complementary assets. The apposing position contends early stage ventures developing innovative products should be able to profit from their innovative product because the early stage venture controls a valuable resource: the innovation (Das, Sen, & Sengupta 1998).
Teece observed in 1986 that it does not seem possible for one firm to keep up with every aspect of markets driven by ongoing technical advancements. Since 1986, several industries developed a relatively stable structure that includes smaller, usually younger, innovative firms collaborating on an ongoing basis with incumbent firms that appear to hold specialized/co-specialized complementary resources. For instance, pharmaceutical companies provide funding along with specialized and co-specialized complementary assets while the biotech firms tend to provide new early stage innovative products, in the biotech-pharmaceutical industry. Similarly the computer industry is characterized by firms specialize in chip, memory, or software development while the name brand companies assemble the components. If incumbent firms controlling specialized complementary assets consistently made it excessively difficult for early stage to profit from the innovations they develop, it would be difficult to explain why entrepreneurs would continue creating new startups in industries lacking a potential for making money and yet, entrepreneurs continue to start new companies in these industries. Thus, it appears as though Teece’s (1986) seminal work does not fully explain some industries where highly technical and specialized firms continue to develop innovative products while established firms focus on specialized and co-specialized complementary assets.
In this work, I offer and test new theory to explain how the resource endowments of the firms involved in the alliance will predict remuneration offered the early stage technology venture when an alliance contract is signed. I combine concepts from resource dependence theory (Pfeffer, & Salancik, 2003), and the resource based view of the firm (Barney, 1986 & 1991) with Hamel’s (1991 p. 99) observation that who benefits from an alliance is a function of who needs whom the most to propose: the relative value of the resource endowment of collaborating firms predicts the remuneration the funding firm is willing to offer an early stage technology venture in an alliance contract. This work addresses the need for more research on the benefits small entrepreneurial firms receive from the alliances they form (Alvarez et al., 2005; Coombs et al, 2006) and the need for more research on the alliance formation process (Ahuja, 2000) by examining initial negotiation position during the alliance formation process.
I use patent citation rates to operationalize the resource value the early stage venture brings to the alliance and variety of measures to operationalize the resource value the funding firm brings to the alliance. I test my hypothesis using alliances involving US-based biotechnology firms and pharmaceutical companies. My empirical results provide support for our theory.
Page 77
Academy of Strategic Management Journal, Volume 13, Number 1, 2014
2 THEORY AND HYPOTHESES I assert that the biotech/pharmaceutical industry has developed the stable structure
described above because this industry tends to create synergistic resource combinations among partnering firms that benefit all the firms involved in the collaboration in recent decades (Rothaermael & Boeker, 2008). In synergistic combinations, the partnering firms retain core competencies, or areas of expertise, and seek out firms with complementary areas of expertise in an effort to gain competitive advantages by combine resources in collaborative efforts. When multiple firms focus on similar areas of expertise and seek out partners for complementary resources, the funding firms do not have a monopoly position in the market. The early stage technology venture firms still have some choice of partners; and therefore, a state of “unilateral dependence” (Teece, 1986: p 289) at the industry level does not have the anticipated effects on individual alliances that Teece’s theory would predict.
I contend the current focus on synergistic alliances creates varying degrees of interdependence among the firms involved in the alliance as they combine unique resources in a collaborative effort. The relative value of the resource endowments a firm controls (Barney, 1986 & 1991) predicts the level of and direction of the resource dependence (Pfeffer, & Salancik, 2003) among the firms engage in the alliance. The resource dependence in turn predicts the firm most likely to benefit the most in the economic transactions among alliance partners.
I differ from Teece by focusing on the relative value of complementary resources controlled by the firms in the alliance as apposed to the type of complementary resource controlled by a firm (i.e. generic, co-specialized, specialized). I propose valuable resources would be rare, inimitable, or lack substitutes (Barney 1991), and the control of valuable resources provides power in the market place (Pfeffer, & Salancik, 2003). I do concede that some types of resources are inherently more valuable than others, but ultimately, I contend that it is the value of a firm’s resource endowment relative to its partner’s resource endowment that predicts the remuneration an early stage technology venture can extract from an alliance.
Evidence supports Williamson’s (1979, 1991) theoretical position that firms make a strategic choice among an open market exchange, an alliance, and an outright acquisition when seeking out resources (e.g. Hennart & Reddy, 1997). Evidence from the mergers and acquisitions literature suggests experienced firms working in their own area of expertise are, in aggregate, good at pricing other firm’s resources for the purpose of buying another firm (Capron, & Shen, 2007), and I assume experienced firms operating in its own area of expertise will also be reasonably good at valuing the resources of potential alliance partners. Thus, I begin with a straightforward economic exchange and propose the value of the innovative idea has a direct effect on the remuneration the early stage venture is likely to receive. From this starting point, I develop theory to show how the resource endowment of the funding firm will moderate the relationship between the value the early stage technology venture brings to the alliance and the remuneration promised by the funding firm.
Page 78
Academy of Strategic Management Journal, Volume 13, Number 1, 2014
2.1 The value of the innovative idea
I assume the economic transaction associated with the collaborative effort will resemble an open market transaction where the baseline value for the remuneration offered the early stage technology venture is initially determined by the value of the early stage technology venture’s product (the target resource for the alliance partner). Simply, more valuable products should garner larger monetary offers from funding firms.
The early stage technology venture’s patent portfolio can be useful indication of resource value during the alliance formation process. Patent statistics provide effective measures of important intellectual property strength in the biotech-pharmaceutical industry (Sorenson & Stuart, 2000). Patents are a tangible and tradable resource (Levin et al., 1987). Important patents are often critical to biopharmaceutical firm’s success and offer relatively strong legal protection for such technologies (Levin et al., 1987). Specifically, patents demonstrate the control of valuable resources, or, in a legal sense, the right to exclude others from use of these resources (Lerner & Merges, 1998). Exclusivity should act as rarity in an economic transaction. Firms wishing to purchase access have few options other than dealing with the patent holder. Thus, patents represent control of a rare, or limited, resource.
In addition, when more than one biotech firm is advancing similar technologies, the accumulation of patents over time serves as a public display of progress that helps differentiate high-performing early stage technology firms from lower performing competitors (Silverman & Baum, 2000). These patent races have leaders and followers. There is an incentive to form an alliance early both to gain access to an innovation while the growth potential is still high and to block other competitors’ access to that innovation (Vassolo, Anand, & Folta, 2004). The first and early entry firms into a chosen market tend to produce higher than normal revenue and profit compared to later entry firms (Schoonhoven, Eisenhardt, & Lyman, 1990; Schumpeter, 1927). Thus, the accumulation of patents also indicates if the target firm has the potential to be a high earning early entry firm or is more likely to be a lower earning substitute product that will follow.
In sum, I expect patent citations to provide a relative value to the resource bases among the early stage technology firms. Furthermore, I expect higher citation rates to indicate more value and a stronger resource position. A stronger resource position should predict higher remuneration. Thus, I expect higher citation rates to predict higher remuneration for the early stage technology venture.
Generally, the funding firm offers two types of monetary rewards in the alliance contract: up-front cash which is cash paid at alliance commencement, and milestone amounts which are future cash payments by the funding firm when and if certain goals are met by the early stage technology venture during the product development process. One can reasonably assume upfront amounts primarily reflect the amount of money funding firms are willing to offer the early stage venture based on its resource endowment at the time the alliance is formed. In contrast contingent monies establish compensation rates for future contributions as the collaboration progresses. Contingent monies protect the funding firm if the early stage technology does not progress as hoped among other things. Research Alliance contracts may also stipulate royalty provisions that delineate the percentage of sales (if and when they exist) to be received by either partner. I consider royalties contingent money. Negotiating the trade-off associated the different types of payments is
Page 79
Academy of Strategic Management Journal, Volume 13, Number 1, 2014
beyond the scope of this research. I will, however, control for contingent amounts in the alliance contract.
Hypothesis 1: There is a positive relationship between the value of the early stage technology venture's patent portfolio and money it is promised at the time of alliance agreement. 2.2 Who needs Whom the Most
Mutually dependent firms are not necessarily equally reliant on each other, and controlling
resources may enable one firm to reap a greater share of the benefits an alliance creates (Hamel, 1991; Pfeffer, & Salancik, 2003; Rothaermel & Hill, 2005; Teece, 1986). Long-established firms (the funding firms in this study) often lack the ability or willingness to develop and utilize new technologies (Tushman & Anderson, 1986) and, therefore, seek out and partner with firms specializing in new technology development (Rothaermel, 2001; Rothaermel, 2008). Typically, an early stage technology venture in the biotech industry lacks sufficient cash to continue product development, technical expertise with the clinical trials process, manufacturing capabilities and commercialization experience; and therefore, seeks partners that can provide these resources (Pisano, 1990; Rothaermel & Boeker, 2008). Thus, the funding firm is most likely putting complementary resources and money into the alliance while the early stage technology venture supplies a partially developed product and highly specific expertise with new technologies.
An alliance is an agreement to combine resources in an effort to bring a new product to market that includes sharing risks resources and the rewards associated with that endeavor (Hitt, Dacin, Levitas, Arregle, & Borza, 2000; Ireland, Hitt, & Vaidyanath, 2002). One can assume partners have some expectation about the total amount of money or in-kind resources they are willing to put into an alliance based on the perceived risks and rewards associated with the collaborative effort (Colombo, Grilli & Piva, 2006; Rothaermel, & Boeker, 2008; Zajac & Olsen, 1993). Thus, given some maximum contribution the funding firm is willing to put into the collaborative effort, one would expect the funding firm’s offer to be some balance of monetary and complementary resource. Simply, given some fixed contribution amount on the part of the funding firm, one would expect the amount of money offered the early stage venture to decrease as in-kind contributions in the form of complementary resource goes up. Thus, in a reasonably efficient alliance market, I expect a direct and negative relationship between the value of the funding firms resources and the monies promised in the alliance contract.
In addition, firms controlling more valuable resources also have an advantageous position that can be used to extract greater benefits from the alliance than open market transactions would predict (Pfeffer, & Salancik, 2003). In the biotech-pharmaceutical industry moving a drug from the discovery stage to market release often takes several decades depending on the nature of the drug and will cost around $500 million (Rothaermel, & Deeds, 2004). Once a drug is approved, the funding firm often uses its marketing and distribution channels to get the product to the end user. Thus, complementary resources needed to commercialize a product in the biotech/pharmaceutical industry represent intense investments in both time and money. Resources requiring intense investments in time and money are likely to somewhat inimitable (Dierickx &
Page 80
Academy of Strategic Management Journal, Volume 13, Number 1, 2014
Cool, 1989). I expect expensive and inimitable resource will provide a powerful resource position. The powerful resource position held by the funding firm should shift the economic transaction in favor of the funding firm beyond what one would expect in reasonably efficient markets (Pfeffer, & Salancik, 2003). There are two ways to extract greater profits from a product. Increase price or decrease costs. I expect funding firms to decrease their contribution (their cost) to the collaborative effort beyond a fair market exchange when they control more valuable resources. Therefore, I expect the funding firms resources to have a negative moderating affect on the value established in Hypothesis1. 2.2.1 The funding firm’s product pipeline
A strong product pipeline generally signals the ability to gain early access into chosen
markets in the foreseeable future (Schoonhoven et al., 1990). Advancing potential drugs through the US Food and Drug Administration (FDA) clinical trial process is a public measure of a funding firm’s product pipeline. This rigorous approval process has considerable hurdles and has lead to high failure rate among potential drugs (Rothaermel & Deeds, 2004). Often, navigating through the clinical trials process is a function not only of a potential treatment's therapeutic efficacy and safety, but also other competencies such as managing administrative demands of clinical trials, the ability to manufacture enough product to supply clinical trials, and the ability to fund clinical trials (e.g. Rothaermel & Hill, 2005). Managing the administrative process is a knowledge/skill endowment built up over time, and therefore, to some degree inimitable (Dierickx & Cool, 1989). Thus, the funding firm success in getting products through the clinical trail process should provide a strong resource position (Barney, 1986; Barney, 1991; Pfeffer, & Salancik, 2003). I expect higher success rates to indicate a stronger resource position and result in less money going to the early stage technology venture. Hypothesis 2: The funding firm’s success rate in the clinical trials process will negatively moderate the relationship suggested in Hypothesis 1. Specifically, higher levels of new product introduction by the funding firm will lessens the positive effect the early stage technology venture's patent portfolio has on money promised at the time of the alliance agreement.
2.2.2 The funding Firms Marketing & RD resources
Controlling market access to the end user is an inherently valuable resource (Norman,
1986; Teece, 1986). The end user is the entity that ultimately provides the revenue stream that the alliance partners will need to generate any profit. The degree of market access controlled by a given firm can often mean greater or lesser access to revenue.
Commercializing and marketing of new drugs requires a brand awareness of customers for over-the-counter drugs, brand awareness of physicians for prescription drugs, and sales market access physicians for prescription drugs in addition to expertise in the clinical trials process. Product knowledge, market knowledge and knowing the people with whom a company must work requires time to develop (Stinchcombe, 1965), develops uniquely within the organization, and to
Page 81
Academy of Strategic Management Journal, Volume 13, Number 1, 2014
some degree is hard to imitate (Dierickx & Cool, 1989). Funding firms with more years of experience will have spent more time developing the expertise necessary to get products through clinical trials, spent more time developing specialized manufacturing techniques, and spent more time establishing the necessary contacts to implement a successful marketing campaign and distribute products. I expect funding firms with more market experience, regardless of whether the efforts lead to recent approvals or failures during the clinical trial process, to be sought after by early stage technology ventures. I expect this to be especially true if the funding firm has developed this experience in the same therapeutic area as the drug being developed in the focal alliance.
Experience in in the same drug class as the early stage technology venture’s product is an indication of past success and implies the target firm has an understanding of the nuances associated with commercializing a specific type of drugs, nuances of the clinical trial process unique to a class of drugs, a brand awareness by physicians who specialize in those treating diseases in the same class of therapies, and access to those same physicians.
Hypothesis 3: The funding firm’s focal product market experience will negatively moderate the relationship suggested in Hypothesis 1. Specifically, more market experience in focal market lessens the positive effect the early stage technology venture's patent portfolio has on money promised to it at the time of the alliance agreement. 2.2.3 The impact of intangible assets
A fundamental principle of the resource-based view of the firm is the idea that competitive
advantage is a function of how firms uniquely configure both tangible and intangible assets to generate a competitive advantage (Barney, 1986 & 1991). This unique configuration of tangible and intangible assets is to some degree inimitable (Barney, 1991). The funding firm’s Tobin’s Q provides a means to value intangible assets. Researchers use Tobin’s Q as a proxy for the value of intangible assets (Anand & Khanna, 2000; Lerner et al., 2003), or firm performance in general (Arend, 2004; Montgomery & Wernerfelt, 1988). Tobin’s Q is a market to book value ratio. Market value includes outstanding stock, and the book value is the value of tangible assets the firm owns. Thus, as Tobin’s Q rises above 1, more of a firm’s value is attributed to intangible assets (or returns expertise).
In addition, Tobin’s Q represents an aggregate opinion of the investors holding stock in a firm as to the future earning potential of that firm. Investors in the capital markets drive up stock prices when they believe a firm will have more value in the future. Therefore, Tobin’s Q also potentially represents a forward looking measure of a firm’s ability to apply both tangible and intangible assets in such a way as to create an ongoing competitive advantage. Consistent with previous hypotheses, I expect higher Tobin’s Q values to reduce the amount of money going to the early stage technology venture.
Hypothesis 4: The funding firm’s Tobin’s Q will negatively moderate the relationship suggested in Hypothesis 1. Specifically, higher levels of a funding firm's Tobin's Q's lessens the positive
Page 82
Academy of Strategic Management Journal, Volume 13, Number 1, 2014
effect the early stage technology venture's patent portfolio has on money promised at the time of the alliance agreement.
3. METHODS 3.1 Industry Setting
The biotechnology industry is the setting for this research. Ahuja (2000) noted that success
in the biotech-pharmaceutical industry is partly a function of successful partnering. The innovative nature of the industry and tendency of biotech firms to specialize exclusively in the development of new products while established pharmaceutical companies have concentrated on developing specialized complementary assets makes this industry an ideal setting for this research. In addition, early stage technology ventures need money and other complementary resources for an extended period of time in the biotech industry. The development time required to bring a new drug to market generally takes about 15 years, with costs that exceed 500 million dollars (Rothaermel & Deeds, 2004). These conditions potentially leave biotech firms in need of funding sources for years simply to survive (Coombs et al., 2006). Thus, the ability to find finding funding through alliances should be a critical factor in the success early ventures in this industry.
3.2 Data and Sample
The sample for this research consist of US-based biotech companies (specifically, those
operating in standard industrial classification codes 2834, 2835, and 2836) focusing on the development of new technologies and pharmaceutical firms traded on US stock exchanges that enter research and development alliances between 1989 and 2003. I used Deloitte and Touche's RDNA database to identify alliances between these types of firms.
The S1, SB2, or 10K filings with the Securities and Exchange Commission (SEC) found on the SEC’s EDGAR database, or focal company’s web pages, provide private-public status, and age of the firm. I use the RDNA database to identify the alliances of these early stage venture firms, the overall value of those alliances, the disease/research category of the early stage venture’s products, and the developmental stage of the products at the time of the alliances. The IMS Life Cycle database provides product pipeline and other product data. The National Bureau of Economic Research (NBER) patent citation database is the source for patent data, and I use the Wharton School Research Data Services’ (WRDS) Compustat and CRSP databases provide financial and IPO data.
3.3 Variables 3.3.1 Dependent Variable
The variable Total Value includes any upfront money, and milestone amounts promised to
the early stage technology venture. The dependent variable is adjusted to 2009 dollars (in millions). I found this variable to be positively skewed, so I transformed the variable by taking the natural
Page 83
Academy of Strategic Management Journal, Volume 13, Number 1, 2014
log of total value (Cohen et al., 2003). Log conversions are an important and often used tool in econometrics to transform a dependent variable's distribution into normal distribution (Wooldridge, 2003). 3.3.2 Independent Variables
Past research has linked patents to investments by foreign companies (Shan & Song, 1997)
and investments by the equity markets in innovative firms (Deeds et al., 1997). Parties in competitive markets can glean valuable information from patent data (Hall, Trajtenberg & Jaffe, 2005; Levitas & McFadyen, 2009). Funding firms tend to be highly knowledgeable investors in other companies (Lerner et al., 2003; Rothaermel & Hill, 2005) and thus, I expect funding firms to be able recognize and place greater value on more important patents filed by innovating firms when making investment decisions pertaining to collaborative ventures.
Consistent with recent research (Hall et al, 2005; Kelly & Rice, 2002), I use patent citations to capture the value of funding firm’s patent portfolio. Similar to journal articles, patents must cite prior patents on which the focal patent is based. The number of citations a patent receives over time is indication of the importance, the inherent value of those patents, and provides more information compared to simple patent counts (Podolny & Stuart, 1995; Trajtenberg, 1990). The NBER data set includes an adjustment to account for the tendency of older patents to acquire more citations and certain technical categories to be more valuable than others (Hall et al., 2001). Thus, I adjust patent citations with NBER adjustment factors to account for differences in technology class and patent age. I then sum all of the early stage technology venture's patent weightings for the life of a patent (up to 20 years) preceding the focal alliance and scale the variable ESTV Patent Portfolio to hundreds of citations (ESTV stands for early stage technology venture).
I use a number of variables to operationalize the Funding Firm's specialized complementary assets. FF Clinical Trial Success is the number of products released to the product market in the previous year by the funding firm. The number of products reaching the consumer markets is an indication of a firm’s ability to advance products successfully through the clinical trial process. The variable FF Market Experience is measured as the funding firm’s years of experience in the same product area as the focal alliance, and FF Tobin's Q is the funding firm’s market value divided by the book value of its assets (Chung & Pruitt, 1994).
3.3.3 Control Variables
Past research on alliances suggests the need to include several control variables in our
empirical models. I account for both partners' age at the time of the alliance. Age accounts for the acquisition of internal resources, access to critical connections with external markets (Stinchcombe, 1965), and has served as a proxy for financial stability and ongoing firm success (Lerner et al., 2003). I use FF Age for the age of the funding firm and ESTV Age for the age of the early stage technology venture. Lerner, Shane & Tsai (2003) found the availability of funding in the capital markets affects alliance formation. As the ability to extract funding from the capital markets decreases, firms turn more frequently to alliances for funding (Lerner et al., 2003). I use
Page 84
Academy of Strategic Management Journal, Volume 13, Number 1, 2014
the variable IPO Market to account for "hotter" or "cooler" IPO markets. This variable is a measure of the total number of successful biotech IPOs in the year preceding the alliance, and is a measure of the receptivity for new issues the biotech sector (Brown, 1970).
Previous research indicates that a firm's experience in forming alliances impacts partners' performance in complex ways (Kale, Prashant, Dyer, Jeffery, H., & Singh, Harbir, 2002; Rothaermel & Deeds, 2006). In some cases, the relationship between number of alliance formations and a firm performance assumes an inverted “U” shape (Kale et al., 2002) where performance initially increases with the number of formations, plateaus after more formations, and then declines. I estimated our empirical models first utilizing the number of previous alliance, and then reran the models including the linear affect as well as the squared effect. The number of alliances squared is not significant in any of the models nor did its inclusion alter our results. Thus, I only used the linear effect ESTV Prior Alliance to account for prior alliances by the early stage technology venture.
I also control for the number of competitors in a product area on which the alliance is based. Competitor density (Baum & Singh, 1994) may affect alliance success, the vitality of the early stage technology venture, and thus the amount of money it is promised in the alliance. I define competitors as firms patenting in the same HJT technical classifications and subclasses (HJT class and subclass are NBER data set fields created by Hall, Jaffe, & Trajtenberg, 2001) as the early stage technology venture in the same year. I constructed the variable ESTV Competitors by the summing all competitors in each current classification and HJT subclass for each year. Then, I matched the current classification and HJT subclass to the early stage technology venture's firm’s patents by year. Finally, I divided by the number of technical subclasses for each early stage venture. The result is an average number of competitors filing patents in the same technical subclasses for each early stage technology venture.
Table 1: Firm Locations
Boston Freq. Percent NY Tri State Area 16 18.18 Philadelphia 3 3.41 San Diego 4 4.55 San Francisco 19 21.59 Seattle 14 15.91 Other 7 7.95 Total 25 28.41
n < 3 for any location categorized as other
I use the variable ESTV Public Status to differentiate between alliances that occur while
the firms are still privately owned and alliances that occur after the early stage technology venture is a publicly traded company. ESTV Public Status is a dummy variable coded 0 when the firm is a private entity and 1 after the firms IPO. Products in the pipeline in conjunction with patent activity are a well-accepted measure of performance and serve as a proxy for successful innovative activity in the biotech/pharmaceutical industry (Baum, Calabrese, & Silverman, 2000; Kortum & Lerner;
Page 85
Academy of Strategic Management Journal, Volume 13, Number 1, 2014
2000; Roberts, 1999; Stuart, 2000). I created the variable ESTV Product Pipeline by summing all the products in preclinical through phase 3 clinical trials as reported by the IMS life cycle database for each early stage technology venture.
There are several dummy variables to account for the location of the firm. Local clusters of similar firms may provide a competitive advantage to an early stage venture (Porter, 2000) and geographic location is linked to the value of an IPO (Deeds et al., 1997). Consistent with Deeds, DeCarolis & Coombs, (1997) I use areas where there is a known concentration of biotech firms (see Table 1 for number of firms in each area). The dummy variables Location: Boston, Location: NY TriState, Location: Philadelphia, and so on account for the location of the early stage venture. I code each dummy variable 1 when the firms operating address is in the target location and 0 when it is not.
I control for the developmental stage of the focal product using the variable Stage Code. The Food and Drug Administration (FDA) requires drugs go through a detailed screening process. I used 10 categories (detailed in Appendix A) where lower numbers identify earlier stages of development of the focal product at the time of the alliance. Similar to Lerner, Shane, and Tsai’s (2003) coding scheme, I used Recombinant Data Coding. See Appendix A for a complete description of the classification system. The difference between my coding scheme and Lerner, Shane, and Tsai’s (2003) is that I completely separated clinical trial groups into those that require the rigorous 3-stage human testing and products that may go through a less rigorous field testing process.
Different therapeutic classes tend to have different values to potential partners (Folta, 1998). There are 10 different therapeutic classes in this study in this study. The dummy variables Therapeutic Class: 3, Therapeutic Class: 4, Therapeutic Class: 5 and so on account for each therapeutic class in this study (See Appendix B for the definitions corresponding to each therapeutic class). I coded each of these dummy variables 1 when the product in the target therapeutic class and 0 when it is not. Finally, I control for money that is contingent on the future performance of the early stage venture. This money is different from upfront money as it is contractually tied to the future performance of the early stage technology venture, and thus it is likely these monies are only partially dependent on the current value of the innovative product. Specifically, Milestone Amount is the sum of all monies tied to the future performance of the firm in the alliance contract in 2009 dollars (in millions).
3.4 Model
I used an ordinary least squared (OLS) model in this study. As noted, the dependent
variable is the log of the total alliance value in 2009 dollars. The general model applied to these data is:
Because several firms form multiple alliances in this data set, the results used here are clustered by the early stage technology venture to account for correlated error among those firms. I also ran a separate analysis clustered by the funding firm. Those results are virtually identical and are available upon request.
Page 86
Academy of Strategic Management Journal, Volume 13, Number 1, 2014
4 RESULTS
Table 2: Mean and Standard Deviation
Mean Std. Dev.
Total Value a 0.5750 1.0231
FF Age 46.9659 52.7105
IPO Market 16.3864 4.4758
ESTV Age 7.9205 5.0995
ESTV Prior Alliance 0.4432 0.7559
ESTV Competitors 488.2753 369.8467
ESTV Product Pipeline 0.2614 0.9999
Stage Code 4.6477 3.1222
Milestone Amount 5.4100 21.0776
ESTV Patent Portfolio 6.9323 14.5224
FF Clinical Trials Success 27.1477 74.8027
FF Market Experience 7.9545 8.6462
FF Tobin's Q 17.6548 23.1085
ESTV Pat X FF Clinical Trial 313.0328 1990.8120
ESTV Pats X FF Experience 65.6520 196.9989
ESTV Pats X FF Tobin's Q 431.2228 1188.2590 a = Log Adjusted
Dummy Variables omitted
Tables 2 and 3 contain the descriptive statistics and the correlation matrix. There are 88 dyads in this study. The sample is split with 43% of the alliances formed while the early stage technology venture is still a private firm and 57% of the alliances formed after the early stage technology venture is trading on public markets. The highest variance inflation factor (VIF) among the variables is 5.79. Thus, the VIF scores are sufficiently low and do not indicate any serious multicollinearity among the variables. Complete VIF scores are available upon request.
Page 87
Academy of Strategic Management Journal, Volume 13, Number 1, 2014
15 ESTV Pat X FF Clinical Trial 0.0788 0.0049 0.4865* 0.4472* 0.2292* 0.008 1
16 ESTV Pats X FF Experience 0.1102 0.2257* 0.4641* 0.3164* 0.4474* 0.067 0.7997* 1
17 ESTV Pats X FF Tobin's Q 0.1197 0.0528 0.0435 0.0136 0.1806 0.2217* 0.0018 0.0449 1 a = Log Adjusted b = Dummy Variables n = 88
Location and Therapeutic Class dummy variables omitted * p < .05
Table 4 shows the results of our regression analysis. I use 6 models to test my hypotheses.
Model 1 tests the control variables. Model 2 test the direct effects of the early stage technology venture’s patent portfolio. Models 3 test the direct effects of interaction variables, and models 4, 5 and 6 test the interactions. All of the models reach a significant level of p<.0001. The change in R2 for models 2-6 are all significant at p<. 05.
Model 2 tests hypothesis 1, there is a positive relationship among the overall contract values and the value of the early stage technology venture's patent portfolio. The independent variable ESTV Patent Portfolio is significant, p<.05. Thus, hypothesis 1 is supported. Model 3 does not test any hypotheses. Model 4 tests hypothesis 2, the funding firm’s success rate in the
Page 88
Academy of Strategic Management Journal, Volume 13, Number 1, 2014
n = 88 * p<0.05, ** p<0.01, *** p<0.001 clinical trials process will negatively moderate the relationship suggested in Hypothesis 1. The interaction variable for the early stage venture’s patent portfolio and the funding firm’s success at getting products through the clinical trials process (ESTV Pats X FF Clinical Trial) is significant,
Page 89
Academy of Strategic Management Journal, Volume 13, Number 1, 2014
p<.05. The coefficient is negative. Thus, hypothesis 2 is supported. Model 5 tests hypothesis 3, the funding firm’s focal product market experience will negatively moderate the relationship suggested in Hypothesis 1. The interaction variable for the early stage venture’s patent portfolio and the funding firm’s experience (ESTV Pats X FF Experience) is significant, p<.05. The coefficient is negative. Thus, Hypothesis 3 is supported. Model 6 tests hypothesis 4, the funding firm’s Tobin’s Q will negatively moderate the relationship suggested in Hypothesis 1. The interaction variable for the early stage venture’s patent portfolio and the funding firm’s Tobin’s (Q ESTV Pats X FF Tobin’s Q) is significant, p<.05. The coefficient is negative. Thus, Hypothesis 4 is supported. In sum, I find support for all of my hypotheses.
The location dummies and a therapeutic class dummies are omitted from Table 4. At least one therapeutic class dummy and 1 location dummy reach a significance level of p<.05 in all the models. Thus, therapeutic class and location do make a difference. I also found a relationship between the money available in the biotech IPO market and monies promised the early stage technology venture in alliance the contract in several models. I will refer to those finding in the discussion section. Refer to table 4 for other control variables that reached a significant level.
5 DISCUSSION There are two related streams of theory and research that would predict the amount of
money an early stage technology venture could expect to receive from alliance partners. The first stream of research postulates that the control of a valuable innovative technology provides a strong resource position, tends to increase the bargaining power of early stage technology ventures vis-a-vis potential collaborators, and gives the early stage technology venture a meaningful negotiating position during the alliance formation process (Das et al., 1998; Sarkar, Echambadi, & Harrison, 2001). A meaningful negotiating position should provide the early stage technology ventures with the means to negotiate more money for themselves in the alliance contract. The second stream of research postulates: the control of valuable complementary assets should allow the funding firm to negotiate a favorable contract (Rothaermel & Hill, 2005; Teece, 1986). The second perspective predicts the control of complementary assets will, in many cases, prevent early stage technology ventures from profiting from the innovations they create (Teece, 1986).
The intent of this research is to combine these two streams of research in an effort to better understand the flow of money among alliance partners. I combined these two streams of research by proposing that the relative resource position of the firms involved in a collaborative effort establishes the initial bargaining position of the firms (Pfeffer, & Salancik, 2003), and the bargaining position will in turn predict the flow of revenue among the firms.
Specifically, I initially treat an alliance as basic economic transaction where the early stage technology venture is selling access to an innovative product. The value of resource held by the early stage technology venture will predict the initial remuneration the early stage technology venture can expect to negotiate in the alliance contract. Simply, the value of the innovation offered for sale sets the base price of the alliance contract. However, alliances are not a simple economic transaction. In an alliance both firms involved in the alliance will, in most cases, provide resources to advance a product to market. The funding firm is providing both money and resources to the
Page 90
Academy of Strategic Management Journal, Volume 13, Number 1, 2014
alliance. One would expect the amount of money offered to the early stage technology venture to decrease as contributions to the alliance in the form of complementary resources provided by the funding firm increase assuming the funding firm is doing a cost/benefit analysis and intends to make money from the alliance. Thus, I expect complementary resources provided by the funding firm to act as a moderator to the basic economic transaction and reduce the overall offer amount.
I tested the theory on the effects of these two countervailing forces using alliances among biotech firm (early stage technology ventures) and established pharmaceutical firms (firms with specialized complementary assets), and found support for my proposed theory. The relative resource position of the firms involved in the alliance tends to predict the economic exchange negotiated in the alliance contract. First, early stage technology ventures with more valuable resource endowments tended to receive promises for more remuneration in the alliance contract (Hypothesis 1). Second, funding firms tended to minimize that amount of money going to the early stage technology venture as the value of their resource endowments increased. I tested complementary resources using three measures: the funding firm’s ability to advance products through clinical trials, the funding firm’s experience in the same product area as the early stage technology venture’s product, and the funding firm’s Tobin’s Q. All three measures tended to negatively moderate the value of the simple economic transaction established with hypothesis 1. These findings support the proposition that the relative resource endowment of the firms involved in alliance establishes the initial bargaining position as firms negotiate an alliance contract and predict the flow of money among firms in collaborative efforts.
Equally important, a couple of control variables provide interesting insights that a practitioner could use in the strategic decision making process. First, consistent with Deeds, DeCarolis & Coombs, (1997) firm location does matter and the competitive market segment by therapeutic class matters. Therefore, where a firm chooses to set up operations and what product area the firm intends to enter influences the amount of money available to that firm in the alliance market. Second, I found mostly positive results for a relationship between the strength of the biotech IPO market and monies promised the early stage technology venture in the alliance contract. My findings would seem to indicate pharmaceutical companies (funding firms) were promising more money to biotech firms (early stage technology ventures) when the IPO markets are also more receptive to biotech firms and promising less money when the IPO markets were less receptive (see Brown, 1970 for a complete discussion on capital market receptivity). These results were as expected based on Lerner, Shane and Tsai’s (2003) findings that imply while the alliance market is an alternative funding source to the capital markets, early stage ventures are, in most cases, going to receive less money from funding firms when the capital markets constrict. The data collected for this research did not allow a full exploration of these variable, so I will continue the discussion on location and product selection in the limitations and future directions section.
Third, assuming an early stage technology venture intends to remain focused on the development of new products and sell off any rights to that product in the future, these results would indicate the search for partners and partner selection should consider a counter intuitive search process. Funding firms with less experience, less success getting products through the clinical trials process and weaker Tobin’s Qs tend to offer early stage technology ventures with similar patent portfolios more money in alliance contracts and thus, should be sought out during
Page 91
Academy of Strategic Management Journal, Volume 13, Number 1, 2014
the search process as partners. Simply, weaker partners offer larger remuneration to the early stage technology venture at the time of the alliance. This decision is, of course, different if the early stage technology venture will stay involved with the funding firm through product development and the release of the product on the consumer market. But, for firms planning stay focused on the development of new products, a weaker partner could be a better choice than stronger partner if immediate financial gain is the primary consideration for the alliance.
6 LIMITATIONS AND FUTURE DIRECTION
I used several control variables from past research on alliances and initial public offering.
I then, applied them to a different type of question: alliances as a funding source. Consequently, a couple of variables could use additional research in the context of early stage technology ventures using alliances as a funding source. While this data does indicate the location and the market the early stage technology venture chooses to enter is a meaningful consideration for the owners of early stage technology ventures, the data here does not allow for the full exploration of the impact of either of these variables on the early stage technology venture. Similarly, the data in this study does not allow us to fully explore possible explanations for the money available to early stage biotech ventures in both the IPO market and the alliance market rising and falling together, or all of the considerations associated with determining when, or if, one source of funding is superior to the other. Further research on capital markets and alliance markets as alternative sources of funding for early stage ventures is warranted.
This study did not explore negotiating per say. I did not have the appropriate data to explore the negotiating ability of people in individual firms, and again, future research is warranted to determine just how much impact negotiating ability affects outcomes beyond the initial bargaining position.
7 CONCLUSIONS
I began this research with the hope of adding to the existing literature by exploring the
effects of two countervailing forces, focusing on the alliance formation process, and focusing the financial benefits to the early stage technology venture. Specifically I add to the existing literature by showing the relative value of the resources endowments of the firms involved in an alliance predicts the flow of money among firms involved in alliances.
Page 92
Academy of Strategic Management Journal, Volume 13, Number 1, 2014
REFERENCES Ahuja, G. (2000). The duality of collaboration: Inducements and opportunities in the formation of interfirm linkages.
Strategic Management Journal, 21: 317-342. Alvarez, S.A., Ireland, R.D, Reuer, J.J. (2005). Entrepreneurship and strategic alliances. Journal of Business
Venturing, 21: 401-404. Anand, B.N., Khanna T. (2000). Do firms learn to create value? The case of alliances. Strategic Management Journal,
Special Issue 21(3): 295-315. Arend, R. J. (2004). Volatility-based effects on shareholder value: Alliance activity in the computing industry. Journal
of Management, 30(4): 487-508. Barney, J.B. (1986). Strategic factor markets: Expectations, luck, and business strategy. Management Science, 32:
1231-1241. Barney, J. (1991). Firm resources and sustained competitive advantage. Journal of Management, 17 (1): 99-120. Baum, J.A., Calabrese, T., & Silverman, B. (2000). Don’t go it alone: Alliance network composition and startups’
performance in Canadian biotechnology firms. Strategic Management Journal, 21: 267-294. Baum, J.A., Singh, J.V. (1994). Organizational niches and the dynamics of organizational mortality. The American
Journal of Sociology, 100(2): 346-380. Brown, J.M. (1970). Post-offering experience of companies going public. The Journal of Business, 43(1): 10-18. Capron, L. & Shen, J.C. (2007). Acquisitions of private vs. public firms: private information, target selection, and
acquirer returns. Strategic Management Journal, 28: 891-911. Chung, K.H., Pruitt, S.W. (1994). A simple approximation of Tobin’s Q. Financial Management, 23(3): 70-74. Cohen, J., Cohen, P., West, S.G., Aiken, L.S. (2003). Applied Multiple Regressing/Correlation Analysis for the
Behavioral Sciences, 3rd Ed. Mahwah, New Jersey: Lawrence Erlbaum Associates. Colombo, M.G., Grilli, L, Piva, E. (2006). In search of complementary assets: The determinants of alliance formation
of high-tech start-ups. Research Policy, 35: 1166-1199. Coombs, J.E. Mudambi, R., Deeds, D.L. (2006). An examination of the investments in U.S. biotechnology firms by
foreign and domestic corporate partners. Journal of Business Venturing¸ 21: 405-428. Das, S., Sen, P.K., Sengupta, S. (1998). Impact of strategic alliances on firm valuation. Academy of Management
Journal, 41: 27-41. Deeds, D.L., DeCarolis, D., Coombs, J.E. (1997). The impact of firm-specific capabilities on the amount of capital
raised in an initial public offering: evidence from the biotechnology industry. Journal of Business Venturing, 12: 31– 46.
Deeds, D.L., Hill, C.W.L. (1998). An examination of opportunistic action within research alliances: evidence from the biotechnology industry. Journal of Business Venturing,14 (2), 141–163.
Dierickx, I. & Cool, K. (1989). Asset stock accumulation and sustainability of competitive advantage. Management Science, 35: 1504-1513.
Folta, T.B., (1998). Governance and uncertainty: The trade-off between administrative control and commitment. Strategic Management Journal, 19: 1007-1028.
Gans, J.S., Stern, S. (2003). The product market and the market for “ideas”: commercialization strategies for technology entrepreneurs. Research Policy, 32: 333-350.
Hall, B.H., Jaffe, A.B., Trajtenberg, M. (2001). The NBER patent citations data file: Lessons, insights and methodological tools. Working Paper. 8498. National Bureau of Economic Research.
Hamel, G. (1991). Competition for competence and inter-partner learning with international strategic alliances. Strategic Management Journal, Summer Special Issue, 12: 83-103.
Hitt, M.A., Dacin, M.T., Levitas, E., Arregle, J.L., & Borza, A. (2000). Partner selection in emerging and developed market contexts: Resource-based view and organizational learning perspective. Strategic Management Journal, 43: 449-467.
Kale, P., Dyer, J. H., & Singh, H. (2002). Alliance capability, stock market response, and long-term alliance success: The role of the alliance function. Strategic Management Journal, 23(8): 747-767.
Kelly, D.J., Rice M.P. (2002). Advantage beyond founding: The strategic use of technologies. Journal of Business Venturing, 17: 41-57.
Page 93
Academy of Strategic Management Journal, Volume 13, Number 1, 2014
Kogut, B., (1988). Joint ventures: Theoretical and empirical perspectives. Strategic Management Journal, 9: 319-332. Kortum, S., Lerner, J. (2000). Assessing the contribution of venture capital in innovation. The Rand Journal of
Economics, 31(4), 674-692. Lerner, J. Merges, R.P. (1998). The control of technology alliances: An empirical analysis of the biotechnology
industry. The Journal of Industrial Economics, 46(2): 125-156. Lerner, J., Shane, H., Tsai, A. (2003). Do equity financing cycles matter? Evidence from biotechnology alliances.
Journal of Financial Economics, 67: 411-446. Levin, R.C., Klevorick, A.K. Nelson, R.R., Winter, S. G. (1987). Appropriating the returns from industrial research
and development. Brookings Papers on Economic Activity, 3: 783-831. Levitas, E., McFadyen M.A. (2009). Managing Liquidity in Research-Intensive Firms: Signaling and Cash Flow
Effects of Patents and Alliance Activities. Strategic Management Journal, 30: 659-678. Montgomery, C.A. Wernerfelt, B. (1988). Diversification, Ricardian rents, and Tobin's Q. Rand Journal of Economics,
19: 623-632. Norman, David A. (1986). Impact of Entrepreneurship and Innovations on the Distribution of Personal Computers,
in: The Positive Sum, R. Landau and N. Rosenberg (eds.). Washington. DC: National Academy Press. Patzelt, H., Shepherd, D. A., Deeds, D., Bradley, S. W. (2008). Financial slack and venture managers' decisions to
seek a new alliance, Journal of Business Venturing, 23(4), 465- 481. Pfeffer, J., Salancik, G.R. (2003). The External Control of Organizations. Stanford, CA: Stanford University Press. Pisano, G.P. (1990). The R D boundaries of the firm: An empirical analysis. Administrative Science Quarterly, 35(1):
153-176. Podolny, J.M. & Stuart, T. E. (1995). A role-based ecology of technological change. The Journal of Sociology, 100(5):
1224-1260. Porter, M.E. (2000). Location, competition, and economic development: Local clusters in a global economy.
Economic Development Quarterly, 14(1): 15-34. Roberts, P.W. (1999). Product innovation, product-market competition and persistent profitability in the U.S.
pharmaceutical industry. Strategic Management Journal, 20: 687-699. Rothaermel, F.T. (2001). Complementary assets, strategic alliances, and the incumbent’s advantage: An empirical
study of industry and firm effects in the biopharmaceutical industry. Research Policy, 30: 1235-1251. Rothaermel, F.T., Boeker, W. (2008). Old technology meets new technology: Complementarities, similarities, and
technology ventures. Journal of Business Venturing, 21: 249-460. Rothaermel, F.T., Deeds, D.L. (2004). Exploration and exploitation alliances in biotechnology: A system of new
product development. Strategic Management Journal, 25(3): 201-221. Rothaermel, F.T., Hill, C.W.L. (2005). Technological discontinuities and complementary assets: A longitudinal study
of industry and firm performance. Organizational Science, 16(1): 52-70. Sarkar, M.B., Echambadi, R., Harrison, J.S., (2001). Alliance entrepreneurship and firm market performance.
Strategic Management Journal, 22(6/7): 701-711. Schoonhoven, C.B., Eisenhardt, K.M., & Lyman, K. (1990). Speeding products to market: Waiting time to first
product introduction in new firms. Administrative Science Quarterly, 35: 177-207. Schumpeter, Joseph. (1927). The explanation of the business cycle. Economica, 21, 286-311. Shan, W., Song, J. (1997). Foreign direct investment and the sourcing of technological advantage: evidence from the
biotechnology industry. Journal of International Business Studies, 28, 267– 284. Silverman, B.S., Baum, J.A. C. (2002). Alliance-based competitive dynamics. Academy of Management Journal,
45(4): 791-808. Stinchcombe, A.L. (1965). Social structure and organizations. In The Handbook of Organizations: Chicago Rand
McNally: 142-193 Stuart, T.E. (2000). Interorganizational alliances and the performance of firms: A study of growth an innovation rates
in a high-technology industry. Strategic Management Journal, 21: 791-811. Stuart, T.E., Hoang, H., Hybels, R.E. (1999). Interorganizational endorsements and the performance of entrepreneurial
Academy of Strategic Management Journal, Volume 13, Number 1, 2014
Sorenson J.B., Stuart T.E. (2000) Aging, obsolescence and organizational innovation. Administrative Science Quarterly, 45(1): 81-112.
Teece, D.J. (1986). Profiting from technological innovation: Implications for integration, collaboration, licensing and public policy. Research Policy, 15: 285-305.
Trajtenberg, M. (1990). A penny for your quotes: Patent citations and the value of innovations. The Rand Journal of Economics, 21(1): 172-187.
Tushman, M. L. & Anderson, P. (1986). Technological discontinuities. Administrative Science Quarterly, 31: 439-465
Vassolo, R.S., Anand, J. & Folta, T.B. (2004). Non-additivity in portfolios of exploration activities: A real options-based analysis of equity alliances in biotechnology. Strategic Management Journal, 25: 1045-1061.
Wernerfelt, B. (1984). A resource-based view of the firm. Strategic Management Journal, 5(2): 171-180. Williamson, O.E. (1979). Transaction-cost economics: The governance of contractual relations. Journal of Law and
Economics, 22(2): 233-261. Williamson O. E. (1991). Comparative economic organization: the analysis of discrete structural alternatives.
Administrative Science Quarterly, 36: 269-296. Wooldridge, J.M. (2003). Introductory Econometrics: A Modern Approach (2nd Ed.). Mason Ohio: South Western. Zajac, Edward, J. & Olsen, Cyrus, P. (1993). From transaction cost to transactional value analysis: implications for
the study of interorganizational strategies. Journal of Management Studies, 30(1): 131-145. Zeng, M., Chen, X. (2003). Achieving cooperation in multiparty alliances: A social dilemma approach to partnership
management. Academy of Management Review, 28(4): 587-605.
Page 95
Academy of Strategic Management Journal, Volume 13, Number 1, 2014
APPENDIX A: DEFINITIONS OF THE STAGES OF DEVELOPMENT
The Recombinant Data RDNA database uses discovery, lead molecule, preclinical, phase
I, phase II, phase III, BLA/NDA filed, approved, and formulation categories. Discovery (#1) is prior to the identification of a lead product. Lead molecule (#2) is the point in product development when a lead molecule is identified. Preclinical (#3) occurs after initial animal testing results, but prior to any human testing. Phase I (#4) marks the beginning of human safety testing for therapeutic drugs. Phase II (#5) marks the beginning of small-scale human efficacy trials. Formulation (#6) is an alliance involving drug formulation or therapeutic treatment for improved delivery. Drug formulation is the process of combining the active ingredient with other compounds to create the final form of the drug—a liquid, a capsule, a pill, etc. Formulation generally occurs after stage I clinical trials and before stage II clinical trials. Phase III (#7) is the beginning of large-scale human efficacy trials. The RDNA database leaves the phase field blank when the clinical process does not involve the three-phase process. I put these products in a separate category (#8). The biological license application (BLA) or new drug application (NDA) (#9) marks the end of clinical trials when the manufacturer files the appropriate documents with the Food and Drug Administration (FDA), and approval (#10) marks the FDA’s approval of those documents. Agricultural products do not go through the same rigorous clinical review process as drugs intended for human beings. Finally, it is possible for a drug to be in two stages of clinical trials simultaneously. For example, under some circumstances stage I and stage II clinical trials can both be in progress when the alliance is formed. The most advanced stage is entered in the data set when two stages are underway simultaneously.
APPENDIX B: DEFINITIONS OF THE THERAPEUTIC CLASSES
3 Blood And Blood Forming Organs 4 Sensory Organs 5 Diagnostic Agents 6 Low Osmolar Angio-Urography 7 Cardiovascular System 8 Respiratory System 9 Genitourinary System And Sex Hormones 10 Musculoskeletal System 11 Alimentary Tract And Metabolism 12 Systemic Anti-Infectives
Page 96
Academy of Strategic Management Journal, Volume 13, Number 1, 2014
Page 97
Academy of Strategic Management Journal, Volume 13, Number 1, 2014
SERVANT LEADERSHIP, HUMANE ORIENTATION, AND CONFUCIAN DOCTRINE OF JEN
Mary Jo Hirschy, Taylor University
Doris Gomez, Regent University Kathleen Patterson, Regent University Bruce E. Winston, Regent University
ABSTRACT
The purpose of this paper is to extend the work of Han, Y., Kakabadse, N. K., & Kakabadse, A. (2009) who examined the role of servant leadership in China's public administration. This current study explored the Confucian concept of Jen in more detail and developed an instrument to measure Jen in the Chinese culture. The new instrument was compared to the GLOBE Study's concept of Humane Orientation (HO), as well as a new single dimension instrument, Essential Servant Leadership Behaviors (ESLB), developed in the USA culture. The design followed DeVellis' (2003) scale development method. Concurrent validity was measured by correlation with both the Humane Orientation and the Essential Servant Leadership Behaviors scale. Two scales for the concept of Jen emerged explaining 66.24% of the variation: (a) a 12-item scale with Cronbach alpha of .963 referred to as Jen Professional (JProf) and (b) a six item scale with Cronbach alpha of .927 referred to as Jen Personal (JPers). Pearson r correlation showed significant correlations between both JPro and JPers with ESLB. No significant correlation existed between HO and the other three variables.
Keywords: Servant Leadership, Humane Orientation, Confucian, Jen
INTRODUCTION An emerging body of literature suggests servant leadership is a global style of leadership positioned to meet the unique challenges facing leaders in diverse cross-cultural communities (Irving, 2010; Winston & Ryan, 2008). In their seminal work, House, Hanges, Javidan, Dorfman, and Gupta (2004), found correlations between cultural values, cultural practices, and leadership preferences that led to the development of Cultural-Endorsed Implicit Leadership Theory (CLT). Of the six archetypes presented as a part of CLT, Winston and Ryan (2008) posit servant leadership closely ties to humane-oriented leadership as defined by House et al. (2004) who also found humane-oriented leadership to be valued in Confucian Asian culture. Yuan (2002) maintains that the concept of jen undergirds the teachings of Confucius, which according to Winston and Ryan (2008) closely parallels the constructs of servant leadership.
Page 98
Academy of Strategic Management Journal, Volume 13, Number 1, 2014
A growing body of research has explored servant leadership within Asian culture (Chen, 2002; Chung, 2004; Han, 2006; Han, Kakabadse, & Kakabadse, 2009; Hean & Tin, 2007; Jeong, 2005; Moon, 1999); however, Irving (2010) suggests additional research into the relationship between servant leadership and culturally endorsed leadership theory dimensions is needed in order to advance our understanding of servant leadership in a global context. Therefore, this study empirically investigates whether or not a relationship exists between servant leadership, humane-oriented leadership, and the Confucian doctrine of jen. Servant Leadership The term servant leadership was first coined by Greenleaf (1970) when he put forth the revolutionary idea that leaders assume the position of servant in their relationship with followers. Since then, there has been an increasing amount of literature emphasizing the leader as servant (Barbuto & Wheeler, 2006; Farling, Stone, & Winston, 1999; Laub, 1999; Linden, Wayne, Zhao, and Henderson, 2008; Page & Wong, 2000; Patterson, 2003; Russell & Stone, 2002; Sendjaya, 2003; Sendjaya & Sarros, 2002; Sendjaya, Sarros, and Santora, 2008; Spears, 1995; Winston, 2003, Wong & Page, 2003). Winston and Ryan (2008) suggest servant leadership as described by Greenleaf (1970), Page and Wong (2000), Farling et al. (1999), Sendjaya (2003), Sendjaya and Sarros (2002), Russell and Stone (2002), Patterson (2003) and Winston (2003) focuses “more on humility and less on self” and “more on the needs of others and the higher-order values of duty and social responsibility” (p. 216). Additionally, Patterson (2003) suggests servant leaders develop humility in working with others and demonstrate altruism by putting the interests of others over self. Finally, Winston and Ryan (2008) suggest Patterson’s (2003) and Winston’s (2003) model of servant leadership ties to humane-oriented leadership based on its foundation of benevolence, kindness, and generosity. Humane Orientation Humane orientation is defined as “the degree to which an organization or society encourages and rewards individuals for being fair, altruistic, friendly, generous, caring, and kind to others” (Kabasakal & Bodur, 2004, p. 569).The GLOBE study (House et al., 2004) suggests this construct is manifested in how people treat one another and varies by culture. Based on a review of cross-cultural literature, the authors defined nine cultural constructs that describe societal characteristics of nations including (a) performance orientation, (b) assertiveness, (c) future orientation, (d) humane orientation, (e) institutional collectivism, (f) gender egalitarianism, (g) power distance, (h) in-group collectivism, and (i) uncertainty avoidance. The GLOBE study is unique in that it differentiates and measures both societal practices (as is) and values (should be). Results from the GLOBE study revealed significant empirical evidence that the aforementioned cultural constructs are related to leadership preferences of followers in specific nations (Dorfman et al., 2004).
Page 99
Academy of Strategic Management Journal, Volume 13, Number 1, 2014
The notion of humane orientation dates back to ancient times and can be found in the writings of Aristotle as noted by Kabasakal and Bodur (2004) who referenced Aristotle’s ideal of friendship and love in support of their definition of humane orientation when they stated “a person becomes a friend when he is loved and returns that love, and this is recognized by both people in question” (p. 565). Furthermore, Kabasakal and Bodur, cited Socrates’ idea that “winning a friend is above all else a fulfilment of a fundamental humane need and desire” as descriptive of the ideals and values of humane orientation (p. 565). Winston and Ryan (2008) suggest Aristotle and Socrates’ notions of friendship and love align with Patterson’s (2003) and Winston’s (2003) circular model of servant leadership. Additionally, Winston (2002) notes agapao is to “love in a social or moral sense, embracing the judgment and the deliberate assent of the will as a matter of principle, duty, and propriety” (p. 5). According to Winston (2003), at the forefront of the servant leader is “considering others with a sense of value and humaneness” as “demonstrated by the concept of agapao” (p. 2); thus, further supporting alignment of servant leadership theory, as presented by Patterson and Winston, and a historical perspective of humane orientation. Fu, Wu, Yang, and Ye (2008) note “being humane is consistent with Confucian principles of moderation and human heartedness” (p. 892). Interestingly, findings from the GLOBE study (House et al., 2004) show China’s score of 4.36 was among the higher ranking countries (17) on the practice (“as is”) of humane orientation; however, their relative score (5.32) and rank (39) dropped significantly for the value (“should be”) of humane orientation. These results suggest participants in China valued, or desired, more humane orientation than they were experiencing in practice. Confucian Virtue Jen Chan (1955) suggests the concept of Jen is one of the most important - and most complex - in Chinese thought. According to Chan, jen is “the backbone of Confucianism;” however, it also “ranks high in the Buddhist and Taoist scales of value” (p. 295). Buddhists have long used the word jen as an “honorific for the Buddha, a worthy person, a temple, or a pagoda” and Taoists view jen as a “cardinal virtue” of their ethical system (p. 295); however, it was Confucius who was the first to consider jen as a general virtue, elevating it to a place of significance in Chinese culture.
HISTORICAL OVERVIEW OF JEN In the Chinese pre-Confucian Classics, the word jen is rarely found; in the oracle bones, it does not appear at all; in the twenty-eight chapters of the Book of Documents, it appears only once; and in the 300 versus of the Book of Odes, it appears only twice (Chan, 1955). Furthermore, when it does appear in ancient texts, Chinese scholars agree that jen denotes a particular virtue, namely, the kindness of a ruler shown to his followers. However, all of this changed with Confucius. According to Chan (1963), Confucius made jen the main theme of his ethical doctrine and
Page 100
Academy of Strategic Management Journal, Volume 13, Number 1, 2014
developed his theory of jen to include not only the particular virtue, as noted in pre-Confucian Classics, but also a general virtue from which all other virtues ensued. As a result, jen has become a household word in China in the approximately 2500 years since the time of Confucius.
JEN DEFINED Jen is a complex notion that has been translated into scores of English terms including “benevolence, love, altruism, kindness, charity, compassion, magnanimity, perfect virtue, goodness, true manhood, manhood at its best, human-heartedness, humaneness, humanity, hominity, and man-to-manness” (Chan, 1955, p. 295). Chan suggests the numerous translations demonstrate just how difficult it is to define the true meaning of jen and there is no perfect English equivalent. Fu et al. (2008) state of “all the ideologies that have influenced the thinking and life of traditional and agricultural China, Confucianism should account for the most” (p. 878). Confucianism was founded by Kong Fuzi (551-479 B.C.), who was later called Confucius by Jesuit missionaries. Confucius’ ideology was based on ceremonies and rituals developed during the Zhou Dynasty (111 – 249 B.C.) and recorded by his disciples in The Analects. Since that time, Li (1994) suggests Confucius ideology has had such a significant impact on Chinese history that Confucianism is nearly synonymous with Chinese culture. Confucius was the first to conceive of jen in a new light, elevating the virtue to a position of significance among Chinese philosophers, Confucian or not (Chan, 1955, 1963, 1975). According to Chan (1975), the word jen appears 105 times in The Analects and 58 of the 499 chapters are devoted to its meaning, function or practice, more than any other subject discussed by the Master and his disciples. Furthermore, Chan (1975) notes Confucius was the first to consider jen the general virtue of all moral behavior and foundation of a comprehensive ethical doctrine. As a result, Confucianism is often defined as the school of jen and one of its greatest teachings is to seek jen. According to Chan (1963), in The Analects, Confucian speaks of jen as a “particular virtue, benevolence, and also the general virtue, the basis of all goodness” (p. 788). Chan (1975) notes there are a few instances in which Confucius followed the ancient understanding of jen and discussed it as a particular virtue, or desirable quality, meaning benevolence, kindness, love, or humanity. This is evidenced by the fact that in The Analects, Confucius lists jen as one desirable quality, among others. In Chan’s analysis of jen (1975) he highlights Confucius’ statement regarding wisdom: “The man of jen is naturally at ease with jen. The man of wisdom cultivates jen for its advantage” (Analects, 4:2). Regarding courage, Confucius suggests, “A man of jen necessarily possess courage but a man of courage does not necessarily have jen” (14:5). Furthermore, Confucius presents jen as one of the three great virtues when he states, “The man of wisdom has no perplexity; the man of jen has no worry; the man of courage has no fear (9:28, 14:30) and also discusses it as one of the six virtues and six obscurations when he states “one who loves humanity but not learning will be obscured by ignorance. One who loves wisdom but not
Page 101
Academy of Strategic Management Journal, Volume 13, Number 1, 2014
learning will be obscured by lack of principle. One who loves faithfulness but not learning will be obscured by heartlessness. One who loves uprightness but not learning will be obscured by violence. One who loves strength of character but not learning will be obscured by recklessness” (17:8). Chan (1955, 1963, 1975) notes the vast majority of Confucius teachings present jen as a universal, all-encompassing ethical ideal. According to Chan (1955), Confucius compared the man of jen to the perfect man. As a part of his analysis of jen, Chan (1975) suggests, in The Analects, Confucius speaks of jen in terms of numerous moral qualities: “a man who is strong, resolute, simple and slow to speak is near to jen” (13:27), “one who can practice five things wherever he may be is a man of jen—earnestness, liberality, truthfulness, diligence, and generosity” (17:6) and “to study extensively, to be steadfast in one’s purpose, to inquire earnestly, and to reflect on what is at hand—jen consists in these” (19:6). However, Chan (1975) suggests Confucius’ most important sayings regarding jen involve the perfection of others as well as self. When Confucius was asked about jen, he stated, “Do not do to others what you do not want them to do to you” (golden rule) (12:2) and “To master oneself and to return to propriety is jen” (12:1). For a man of jen is a man of the golden mean and the golden rule, for in “wishing to establish his own character, also establishes the character of others, and wishing to be prominent himself, also helps others to be prominent” (6:28). To achieve balance and harmony of self and society is the essence of jen and Confucius ethical philosophy. While Confucius discussed this general, all-encompassing virtue at great length with his disciples, he never presented a concrete definition or comprehensive description of jen. Yet, with the exception of a few passages, Confucius understood jen as a broad principle of conduct meaning the “general virtue which is basic, universal, and the source of all specific virtues” (Chan, 1975, p. 109). Research Method and Design This exploratory study collected data from Chinese leaders to see if a relationship exists between servant leadership, humane orientation, and jen. The sample was drawn from junior, middle, and senior level Chinese leaders. Participants in this cross-sectional research were asked to complete questions pertaining to the aforementioned constructs using a web-based, self-administered, on-line survey. The survey consisted of (a) Winston and Fields' (2011) measure Essential Servant Leadership Behaviors (10 items), (b) House’s et al. (2004) measure of humane orientation (8 items), and (c) a newly constructed two-factor measure of jen (12 items measured Jen-Professional and six items measured Jen-Personal). The survey was administered by e-mailing members of the sample a brief explanation of the study and a URL containing the web-based, self-administered survey. The survey was prefaced with a brief explanation of the research and request for informed consent. Respondents were also assured of anonymity and confidentiality regarding any information provided to facilitate more candid responses. The instrument was available to the sample September-October 2011.
Page 102
Academy of Strategic Management Journal, Volume 13, Number 1, 2014
Winston and Field’s Measure of Essential Servant Leadership Behaviors Winston and Fields’ (2011) new parsimonious 10-item scale was used to measure Essential Servant Leadership Behaviors distinct to servant leadership. Based on a review of extant literature and a panel of 23 experts, Winston and Fields identified 22 behaviors unique to servant leadership. The researchers then conducted an exploratory factor analysis on the items, along with behaviors included in past instruments to test for concurrent validity, resulting in a single 10-item factor that accounted for 75% of the variance and achieved an alpha of .96. While a relatively new instrument, Winston and Fields’ measure suggests strong scale reliability, construct validity in its measure of servant leadership, convergent validity with existing multi-dimensional measures of servant leadership, and explanation of the variance in leadership effectiveness beyond that which is explained by assessing multiple dimensions of servant leadership; thus, providing an appropriate instrument for measuring of those behaviors unique to servant leadership in the current study. GLOBE Study’s Measure of Humane Orientation The current study included questionnaire items utilized in the GLOBE (House et al., 2004) research to assess societal humane orientation by measuring both cultural practices (as things are) and values (as things should be). According to Hanges and Dickson (2004), development and validation of the GLOBE culture and leadership scales included a multistage process in which qualitative evaluation (e.g. item review, Q-sorting, translation, back translation) was followed by quantitative assessment (e.g. multilevel confirmatory factor analysis, correlation analysis). Furthermore, Hanges and Dickson state “as we collected preliminary data and tested our theories, we refined and sharpened our construct definitions, and consequently modified our scales” (p. 122). Statistical analysis of data pertaining to the GLOBE cultural dimension humane orientation data revealed societal practice (as is) earned an Intraclass correlation coefficient [ICC(1)] of .21, internal consistency of .88, and Interrater reliability [ICC (2)] of .91, while societal values (should be) earned an ICC(1) of .10, internal consistency of .70, and ICC(2) of .84. Furthermore, the first-order leadership attribute scale for humane orientation earned an ICC(1) of .16, internal consistency of .66, and ICC(2) of .90, while the scale for modest earned an ICC(1) of .17, internal consistency of .61, and an ICC(2) of .90. Finally, further analysis of the data revealed the CLT leadership dimension of humane-orientated leadership earned a country level mean range of 3.8-5.6 on a seven-point scale ranging from 1 (greatly inhibits) to 7 (contributes greatly) to outstanding leadership, internal consistency of .76, and an ICC(2) of .93 (House et al., 2004); thus, providing an appropriate instrument for measuring the construct of humane orientation in the current study. New Measure of the Confucian Doctrine of Jen No reliable scale for measuring the Confucian construct jen existed; therefore, the current study developed an instrument to measure jen. The scale was created using DeVellis (2003) eight steps for scale development including “(a) determine clearly what it is you want to measure, (b)
Page 103
Academy of Strategic Management Journal, Volume 13, Number 1, 2014
generate an item pool, (c) determine the format for measurement, (d) have the initial item pool reviewed by experts, (e) consider inclusion of validation items, (f) administer items to development sample, (g) evaluate the items, and (h) optimize scale length” (p. 60). While a reliable scale does not currently exist for measuring jen, a group of items emerged from the literature that allowed for assessment of the construct. Therefore, scale development was empirically driven in order to measure jen. According to DeVellis (2003), the second step in scale development requires the generation of an item pool. Chan (1975) suggests jen, as a general virtue, is best translated as humanity or humaneness; thus, the scale contained 21 items to determine if the leader recognized behaviors pertaining to humanity or humaneness. Data Collection and Profile of Participants The sampling frame for this study consisted of junior, middle, and senior level Chinese leaders who were either associated with Leadership Development International, colleagues of the researcher, or referrals generated by individuals in the first two groups. The survey was administered by e-mailing members of the sample a brief explanation of the study and a URL containing a web-based, self-administered questionnaire. The survey was prefaced with a brief explanation of the research and request for informed consent. Furthermore, to facilitate a more candid response, the respondent was assured of anonymity and confidentiality regarding any information provided. The web-based format allowed for electronically-mediated collection of the data; thus, providing members of the sample frame increased participant convenience and anonymity. The instrument was available to the sample frame September-October 2011. Given the nature of this study, prospective participants were asked to confirm their citizenship (i.e. either Chinese or non-Chinese). The responses of respondents who indicated that they were “non-Chinese” were discarded. Furthermore, prospective participants were asked to confirm the highest level management position held (i.e. either junior management, middle management, senior management, or never been a manager). The responses of respondents who indicated they had “never been a manager” were also discarded. If respondents indicated they were either non-Chinese or had never been a manager, the web site was programmed to automatically deny the prospective participant access to the body of the questionnaire. Rather, these respondents were directed to a message apologizing for the inconvenience and indicating that the research was limited to junior, middle, and senior level Chinese leaders only. The message also included a follow-up e-mail address if individuals still believed they were entitled to complete the questionnaire; however, no follow-up enquiries were received. A total of 170 web-based questionnaires were received in the data collection process. During the subsequent process of data cleansing, respondents who submitted surveys that were incomplete were discarded, resulting in 163 usable questionnaires. Based on Boggs (2002) and Kerlinger and Lee’s (2000) sample size recommendations, this research sample achieved a .05 level of significance with a level of power of .80. Furthermore, based on DeVellis (2003) and
Page 104
Academy of Strategic Management Journal, Volume 13, Number 1, 2014
Kerlinger and Lee’s (2000) recommendations for scale development, this sample size surpassed the 105 respondents necessary for the development of a new parsimonious measure of jen. Given the nature of this study, the collection of demographic data was limited to citizenship and management experience. Of the 163 participants, 163 of the participants indicated they were Chinese (100%). Furthermore, the highest management position held by participants was overwhelmingly middle management (95 or 58%), while 46 (28%) had held senior management positions and, finally, 22 (13%) had held junior positions of management. Table 1 depicts a profile of participants in the current study.
Table 1: Profile of Participants
Demographics (N = 163) Number Percentage
Nationality
Chinese 163 100%
Non-Chinese 0 0%
Highest management position held
Junior management 22 13%
Middle management 95 58%
Senior management 46 28%
Never been a manager 0 0%
Evaluation and Optimization of Jen Scale According to DeVellis’ (2003), item evaluation, the seventh step in scale development, is “second perhaps only to item development in its importance” (p. 90) and is followed by optimizing the scale length, the eighth step in scale development. Mertler and Vannatta (2005) suggest principle component analysis is the “preferred method of factor extraction, especially when the focus on an analysis searching for underlying structure is truly exploratory” (p. 250). Therefore, a principle component analysis, using oblique rotation (direct oblimin), was performed on the 21 original items in order to analyze all sources of variability and optimize the number of items included in the scale. The initial analysis extracted three components with Eigenvalues greater than 1.0. The findings as noted in Table 3 indicate the three components explained 71.89% of the variance, with the first component accounting for 56.68% of the variance, the second component accounting for 9.56% of the variance, and the third component accounting for 5.56% of the variance. As noted in Table 2, a pattern matrix suggested the third component included only one item (J19); thus, the third item was discarded. The SPSS output, depicting the initial factors that resulted from the principle component analysis of the 21 items and the amount of variance for which they account for, is presented in Tables 2 and 3 respectively.
Page 105
Academy of Strategic Management Journal, Volume 13, Number 1, 2014
A scale reliability analysis was conducted on the first component using the Cronbach coefficient alpha. The researcher simultaneously tested each item based on the “alpha if deleted” score to determine if the scale’s reliability would increase if one or more items were deleted. The coefficient alpha score for Component One was remarkably high, suggesting, with a coefficient alpha score of .961, that the scale has a very high degree of reliability.
Page 106
Academy of Strategic Management Journal, Volume 13, Number 1, 2014
Twelve of the 13 items were retained in order to create an efficient and parsimonious scale of the first component. The Cronbach alpha reliability of the scale consisting of the 12 retained items was .963. Item J17 was removed from the analysis. The retained items for component one are noted in Table 4.
Table 4: Retained Items for Component One Item number Item J8 As a leader, I am straightforward. J9 As a leader, I am respectful. J10 As a leader, I am kind. J11 As a leader, I am truthful. J12 As a leader, I am diligent. J13 As a leader, I am generous. J14 As a leader, I am reflective.
J15 As a leader, I live by the golden rule: Do unto others as you would have them do unto you.
J16 As a leader, I have learned to observe the cultural courtesy expected by those with whom I have contact.
J18 As a leader, I extend love to all people.
J20 As a leader I support individuals within the organization and culture at large through active engagement.
J21 As a leader, I exhibit morality that is rooted in the basis for all goodness.
The same procedure was used to determine the Cronbach coefficient alpha score for the second component. The coefficient alpha score for the second component was also remarkably high, suggesting, with a coefficient alpha score of .920, that the scale has a very high degree of reliability. Six of the seven items were retained in order to create an efficient and parsimonious scale for use in future research. The Cronbach alpha reliability of the Component Two scale consisting of the six retained items was .927. Item J7 was removed from the analysis. The retained items for component two are noted in Table 5.
Table 5: Retained Items for Component Two Item number Item
J1 As a leader, I am comfortable wtih characteristics of benevolence, kindness, love, and humaneness.
J2 As a leader, I use benevolence, kindness, love, and humaneness to benefit organizations.
J3 As a leader, I am comfortable taking risks. J4 As a leader, I exhibit calm about the future of the organization. J5 As a leader, I am continually learning. J6 As a leader, I am steadfast.
Page 107
Academy of Strategic Management Journal, Volume 13, Number 1, 2014
FINDINGS The purpose of this exploratory study was to determine whether or not a relationship exists between the constructs of servant leadership, humane orientation, and Confucian doctrine of jen. Pearson r correlation was used to analyze the relationship between these variables. In light of the guidelines put forth by Guilford (1956) and Kerlinger and Lee (2000), an r value of > .20 was set for supporting the hypothesis. Conversely, an r value of < .20 was set for rejecting the hypothesis; thus, if the hypothesis was rejected, the null hypothesis was accepted. Finally, a p value of < .05 was set for determining the statistical significance of the data. The Pearson r for the relationship between servant leadership and humane orientation was -.033 and the p value for this Pearson r finding was .673, indicating a weak correlation that was not statistically significant. Next, the Pearson r for the relationship between servant leadership and jen professional was .523 and the p value for this Pearson r finding was .000, indicating a strong positive correlation that is statistically significant. The Pearson r was then calculated for the relationship between servant leadership and jen personal. The Pearson r was .599 and the p value for this Pearson r finding was .000, indicating a strong positive correlation that is statistically significant. Next, the Pearson r for the relationship between humane orientation and jen professional was .012 and the p value for this Pearson r finding was .881, indicating a weak correlation that was not statistically significant. The Pearson r for the relationship between humane orientation and jen personal was .054 and the p value for this Pearson r finding was .495, indicating a weak correlation that was not statistically significant. Finally, the Pearson r for the relationship between jen professional and jen personal was .678 and the p value for this Pearson r finding was .000, indicating a strong positive correlation that is statistically significant. Table 6 depicts the correlations between each of the research variables.
Note. SL = Servant Leadership; HO = Humane Orientation; J Prof = Jen Professional; J Pers = Jen Personal. **p < .01.
Cronbach Alpha Coefficients for Research Scales The Cronbach alpha coefficients for each of the research scales were calculated in order to confirm the internal reliability of the multi-item scales utilized in this study. This included the two newly developed measures of jen as noted above, as well as the scales used to measure servant
Page 108
Academy of Strategic Management Journal, Volume 13, Number 1, 2014
leadership and humane orientation. The following alpha coefficients were found: (a) .880 for Winston and Field’s (2011) measure of Essential Servant Leadership Behaviors, (b) .752 for House’s et al. (2004) measure of Humane Orientation, (c) .963 for the newly constructed measure of jen professional, and (d) .927 for the newly constructed measure of jen personal.
DISCUSSION
This exploratory study addressed the research gap by empirically investigating whether or not a relationship exists between the constructs of the study of servant leadership as defined by Patterson and Winston, humane orientation as defined by the GLOBE study, and newly constructed measure of jen created using guidelines put forth by DeVillis (2003). Toward that end, the following presents the (a) contributions of the findings and (c) recommendations for future research. Contributions of the Findings There are five significant contributions of this study. First, servant leadership remains in its infancy; thus, the current study contributed to the current body of literature and research on servant leadership through the use of Patterson’s (2003) and Winston’s (2003) servant leadership model. Second, current multi-dimensional instruments designed to measure characteristics or dimensions of servant leadership have failed to establish reliability and validity for all dimensions included in their respective studies, are fairly time consuming, and often involve complicated interpretation; thus, the current study tested Winston and Field’s (2011) newly developed instrument in order to further assess its use as a single-dimensional, psychometrically valid measure of servant leadership that is easy to complete and interpret. Third, Irving (2010) suggests additional research into the relationship between servant leadership and CLT dimensions within diverse, global communities is needed; thus, the current study empirically researched whether or not a relationship exists between servant leadership and the CLT dimension of humane-oriented leadership in order to further our understanding of servant leadership in the global context and determine whether or not servant leadership should be considered a viable leadership theory for use in humane-oriented cultures. Fourth, Winston and Ryan (2008) suggest servant leadership is more global than Western in nature; however, Irving (2010) notes the majority of servant leadership research has been completed in the North American or European context. Therefore, the current study empirically investigated the relationship between servant leadership and the Confucian doctrine of jen in an effort to further contribute to our understanding of servant leadership theory in the global context and, more specifically, determine whether or not servant leadership should be considered a viable leadership theory for use in Confucian Asian culture. Finally, the GLOBE study (House et al., 2004) revealed humane-oriented leadership is valued in Confucian Asia. The current study empirically investigated the relationship between humane orientation and the Confucian doctrine of jen in an effort to further contribute to our understanding
Page 109
Academy of Strategic Management Journal, Volume 13, Number 1, 2014
of CLT’s humane-oriented leadership (House et al., 2004) in the global context and, more specifically, whether or not it should be considered a viable theory of leadership in Confucian Asian culture. Recommendations for Future Research The current study provides several directions for future research. First, while this study provided an analysis of the relationship between servant leadership, humane orientation, and the Confucian doctrine of jen among Chinese leaders, the findings would benefit from confirmation in specific geographic regions within China as well as specific sectors including business, education, military, and government as a means of further understanding the implications of this research. Secondly, while reasons why a positive relationship between servant leadership and the Confucian doctrine of jen emerged are suggested, additional research is needed to explore the qualitatively-oriented question of why the relationship between servant leadership and jen is a positive relationship. Such qualitatively-oriented research could provide additional insights into the use of servant leadership theory in Confucian Asia. While these recommendations are not exhaustive, the current study provides an additional path for investigating servant leadership as a global style of leadership.
Page 110
Academy of Strategic Management Journal, Volume 13, Number 1, 2014
REFERENCES Barbuto, J. E., and Wheeler, D. W. (2006). Scale Development and construct clarification of servant leadership. Group
and Organization Management, 31(3), 300-326. Boggs, W. B. (2002). An exploratory study of the relationship between organizational culture types and a balanced
scorecard of effectiveness measures in the church. Retrieved from ProQuest Dissertations and Theses database. (AAT 3055392)
Chan, W. (1955). The evolution of the Confucian concept of jen. Philosophy East and West, 4(4), 295-319. Chan, W. (1963). A source book in Chinese philosophy. Princeton, NJ: Princeton University Press. Chan, W. (1975). Chinese and western interpretations of jen (humanity). Journal of Chinese Philosophy, 2, 107-129. Chen, K. (2002). An exploratory case study of servant leadership in Taiwan Mennonite churches. Retrieved from
ProQuest Dissertations and Theses database. (AAT 3077169) Chung, Y. (2004). The Biblical model of servant leadership: A paradigm for Seventh-Day Adventist ministers in
Korea, Unpublished Doctoral Dissertation, Andrews University, Berrien Springs, MI. DeVellis, R. F. (2003). Scale development: Theory and applications. Thousand Oaks, CA: Sage. Dorfman, P. W., Hanges, P. J., and Brodbeck, F. C. (2004). Leadership and cultural variation: The identification of
culturally endorsed leadership profiles. In R. J. House, P. J. Hanges, M. Javidan, P. W. Dorfman, and V. Gupta (Eds.), Culture, leadership, and organizations: The GLOBE study of 62 societies (pp. 669-719). Thousand Oaks, CA: Sage.
Farling, M. L., Stone, A. G., and Winston, B. E. (1999). Servant leadership: Setting the stage for empirical research. The Journal of Leadership Studies, 6(1/2), 49-72.
Fu, P. P., Wu, R., Yang, Y., and Ye, J. (2008). Chinese culture and leadership. In J. S. Chhokar, F. C. Brodbeck, and R. J. House (Eds.), Culture and leadership across the world: The GLOBE book of in-depth studies of 25 societies (pp. 877-908). Thousand Oaks, CA: Sage.
Greenleaf, R. K. (1970). The servant as leader. New York: Paulist Press. Guilford, J. P. (1956). Fundamental statistics in psychology and education. New York: McGraw-Hill. Han, J. (2006). Servant model of pastoral leadership: Toward an effective ministry in the Korean American church.
Retrieved from ProQuest Dissertations and Theses database. (AAT 3209910) Han, Y., Kakabadse, N. K., and Kakabadse, A. (2009). Servant leadership in the People’s Republic of China: A case
study of the public sector, Journal of Management Development, 29(3), 265-281. Hanges, P. J., and Dickson, M. W. (2004). The development and validation of the GLOBE culture and leadership
scales. In R. J. House, P. J. Hanges, M. Javidan, P. W. Dorfman, and V. Gupta (Eds.), Culture, leadership, and organizations: The GLOBE study of 62 societies (pp. 122-151). Thousand Oaks, CA: Sage.
Hean, L. L., and Tin, L. G. (2007) Accentuating servant-leadership in Singapore leadership mentoring, International Journal of Servant Leadership, 3(1), 177-188.
House, R. J., Hanges, P. J., Javidan, M., Dorfman, P. W., and Gupta, V. (2004). Culture, leadership, and organizations: The GLOBE study of 62 societies. Thousand Oaks, CA: Sage.
Irving, J. A. (2010). Cross-cultural perspectives on servant leadership. In D. van Dierendonck and K. Patterson (Eds.), Servant Leadership: Developments in theory and research (pp. 118-129). New York: Palgrave Macmillan.
Jeong, B. G. (2005). A study of structure, pastoral leadership and role of a community-based church in the context of social change in Korea. Retrieved from ProQuest Dissertations and Theses database. (AAT 3202621)
Kabasakal, H., and Bodur, M. (2004). Humane orientation in societies, organizations, and leader attributes. In R. J. House, P. J. Hanges, M. Javidan, P. W. Dorfman, and V. Gupta (Eds.), Culture, leadership, and organizations: The GLOBE study of 62 societies (pp. 564-601). Thousand Oaks, CA: Sage.
Kerlinger, F. N., and Lee, H. B. (2000). Foundations of behavioral research (4th ed.). New York: Thomson Learning. Laub, J. (1999). Assessing the servant organization: Development of the servant organizational leadership (SOLA)
instrument. Retrieved from ProQuest Dissertations and Theses database. (AAT 9921922)
Page 111
Academy of Strategic Management Journal, Volume 13, Number 1, 2014
Li, C. (1994). The Confucian concept of jen and feminist ethics of care: A comparative study. Hypatia, 9(1), 70-89. Liden, R.C., Wayne, S.J., Zhao, H., and Henderson, D. (2008). Servant leadership: Development of a
multidimensional measure and multi-level assessment, The Leadership Quarterly, 19(2), 161-77. Mertler, C. A. and Vannatta, R. A. (2005). Advanced and multivariate statistical methods. (3rd ed.). Glendale, CA:
Pyrczak Publishing. Moon, S. M. (1999). A study of servant leadership in Korea, MAI, 37(5), 1324. Page, D., and Wong, T.P. (2000). A conceptual framework for measuring servant-leadership, In B. S. Adjibolosoo
(Ed.), The human factor in shaping the course of history and development, (pp. 141-109). Lanham, MD: University Press of America.
Patterson, K. (2003). Servant leadership: A theoretical model. Retrieved from ProQuest Dissertations and Theses database. (AAT 3082719)
Russell, R. F., and Stone, A. G. (2002). A review of servant leadership attributes: Developing a practical model. Leadership and Organization Development Journal, 23(3), 145-157.
Sendjaya, S. (2003, August). Development and validation of servant leadership behavior scale. Paper presented at Servant Leadership Research Roundtable, Regent University, Virginia Beach, VA.
Sendjaya, S., and Sarros, J. C. (2002). Servant leadership: It's origin, development, and application in organizations. Journal of Leadership and Organizational Studies, 9(2), 57-64.
Sendjaya, S., Sarros, J.C., and Santora, J.C. (2008). Defining and measuring servant leadership behaviour in organizations, Journal of Management Studies, 45(2), 402-424.
Spears, L. C. (Ed.). (1995). Reflections on leadership: How Robert K. Greenleaf’s theory of servant leadership influenced today’s top management thinkers (pp. 1-14). New York: John Wiley and Sons.
Winston, B. (2002). Be a leader for God’s sake. Virginia Beach, VA: Regent University-School of Leadership Studies. Winston, B. (2003, August). Extending Patterson’s servant leadership model: Explaining how leaders and followers
interact in a circular model. Paper presented at Servant Leadership Research Roundtable, Regent University, Virginia Beach, VA.
Winston, B. E., and Ryan, B. (2008). Servant leadership as a humane orientation: Using the GLOBE study construct of humane orientation to show that servant leadership is more global than western. International Journal of Leadership Studies, 3(2), 212-222.
Winston, B. E. and Fields, D., (2011). Development and evaluation of a new parsimonious measure of servant leadership, Unpublished manuscript, School of Leadership and Entrepreneurship, Regent University, Virginia Beach, Virginia.
Wong, P. T. P., and Page, D. (2003, August). Servant leadership: An opponent process model and the revised servant leadership profile. Paper presented at Servant Leadership Research Roundtable, Regent University, Virginia Beach, VA.
Yuan, L. (2002). Ethics of care and concept of jen: A reply to Chenyang Li. Hypatia, 17(1), 107-129.
Page 112
Academy of Strategic Management Journal, Volume 13, Number 1, 2014
Page 113
Academy of Strategic Management Journal, Volume 13, Number 1, 2014
DETERMINANTS OF INTERFIRM RIVALRY OR COOPERATION: IMPLICATIONS FOR MANAGEMENT
William T. Jackson, University of South Florida St. Petersburg
Terry Nelson, University of Alaska, Anchorage Lei Gao, University of Memphis
Jeffrey A. Krug, Loyola University New Orleans Peter Wright, University of Memphis
ABSTRACT
Much has been written in the past few years regarding interfirm rivalry. Much of this research has focused on the consequences of collaboration (Tong and Reuer, 2010, Snowdon and Stonehouse, 2006), trust (Gulati, 1995), competitor analysis (Chen, 1996, Baum and Korn, 1996, Gundez, 2013), alliances and alliances failures (Park and Ungson, 2001, Trapido, 2013); industry structure (Tong and Reuer, 2010); opportunities (Chellappa and Saraf, 2010; Ahuja, 2000); and transaction cost (Dyer, 1997, Parkhe, 1993). Unfortunately, little emphasis has been given to the impact of managerial logic and the economic environment.
In this paper we broadly focus on managerial logic as well as the economic environment as determinants of the nature of interfirm behavior. We recognize interrelatedness as a recurring pattern of interfirm behavior which may be characterized as a competitive, cooperative, or both. We elaborate on the advantages and disadvantages of various groups of interrelated enterprises and provide what we believe are useful implications for executives.
INTRODUCTION
Question 1 – How are PepsiCo, Coca-Cola, Monsanto, and McDonald’s interrelated? Question 2 – How is IKEA interrelated with its rivals or stakeholders? Question 3 – How are Microsoft, Intel, IBM, Netscape, America Online, and Hewlett-
Packard interrelated? The answer to the first question is that these organizations primarily have opportunistic, competitive interfirm exchanges and it is via such exchanges that they are interrelated. Our response to the second question is that IKEA tends to have cooperative, nonconfrontational interactions with its stakeholders and rivals and this is how IKEA is interrelated with them. The answer we provide to the third question is that the enterprises mentioned have cooperative and competitive interfirm exchanges and it is through these exchanges that such firms are interrelated. A fundamental difference, however, may be discerned between the first group of firms and the latter two groups of firms. In the first group, the viabilities of PepsiCo, Coca-Cola, Monsanto, and McDonald’s tend to be independent of each other as each firm develops on its own. In the other
Page 114
Academy of Strategic Management Journal, Volume 13, Number 1, 2014
two groups, the viability of IKEA and its rivals/stakeholders, and on the other hand, the viability of Microsoft, Intel, IBM, Netscape, America Online, and Hewlett-Packard may be interdependent. In this paper, we recognize interrelatedness as a recurring pattern of interfirm behavior which can be characterized as predominantly competitive, cooperative, or both competitive and cooperative. Our concern is with firms which are interrelated but remain autonomous. Included in our analysis are groups of firms which contain competing enterprises as well as their stakeholder organizations. The reason we include such organization as competitors, strategic allies, suppliers and buyers in our work is that the roles played by some firms as the interact with each other may not always be clear-cut at any given point in time, For instance, on any given day, one organization may find another to be simultaneously a rival, a partner, a supplier, and/or a customer (Hamel & Prahalad, 1994). Additionally, some enterprises are increasingly involving stakeholder organizations in quality training, product design and other previously private internal processes, making interfirm boundaries ambiguous. Consequently, the inclusion of competing organizations and their stakeholder organizations in our examination of interrelated firms makes sense since interorganizational roles and boundaries in some situations have become somewhat obscured. We realize that it is difficult to characterize interactions among organizations as either strictly competitive or cooperative. That is because both cooperation and competition may occur among organizations. For instance, firms which may collaborate on specific projects tend to compete when the time comes for them to divide the pie. On the other hand, rival firms may cooperate (e.g., competing firms, such as General Motors and Toyota, cooperate on the production of small cars). Although both rivalry and collaboration may occur within a group of interacting firms, a competitive predisposition will ordinarily dominate cooperative tendencies in some groups of interrelated enterprises. Alternatively, a cooperative orientation may dominate competitive behavior in other group of firms. Yet within other groups of interrelated organizations, collaborative as well as rivalrous forces may approach balance. We recognize that rivalry may be more intense among competing organizations relative to interfirm exchanges which involve firms and their suppliers, customers, or strategic allies. However, in a group of firms predisposed to competitive behavior, we contend that adversarial forces will be more intense among rivals and their stakeholder organizations. In a group of firms with cooperative tendencies, collaborative forces will be comparatively more pronounced and, in a competitive and cooperative group, these forces may approximate parity. In this paper we broadly focus on managerial logic as well as the economic environment as determinants of the nature of interfirm behavior. Our approach provides a different perspective from the traditional examination of interfirm exchanges provided by classical industrial organization theory. Thus, our analysis of interfirm relations may serve as an alternative framework which may guide executive practice. We speculate that groups of interrelated firms are proactively located in sub-parts of the economic environment because of what senior executives perceive as the requirement for organizational viability. Moreover, our presumption is that the chosen sub-part of the economic environment may impact the nature of interfirm behavior. As a result, distinct interfirm relations may be found with varying frequencies in different sub-parts of the economic environment.
Page 115
Academy of Strategic Management Journal, Volume 13, Number 1, 2014
MANAGERIAL LOGIC IN THE CONTEXT OF THE ECONOMIC ENVIRONMENT
Top managers have the cognitive discretion to perceive a meaning that is reflective of reality (Weick, Gilfillan & Keith, 1973). The structure of a meaning, therefore, can be described as the presumption of managerial logic (Orton & Weick, 1990). Hence, senior executives may perceive interfirm relations as though they reflect reality, and then, forming a firm response as if that response is appropriate for the set of events of interactions in the process. We argue that some strategic managers may ordinarily be prone to perceive a rivalrous meaning in their firms’ interactions with other enterprises. Yet other senior executives may often be prone to perceive a cooperative meaning in their interfirm exchanges. Still others may perceive interfirm relations as at times competitive, at other times cooperative, and yet in other instances both competitive and cooperative. In this context, presumably the choice to locate firms in a sub-part of the environment may also be driven by what strategic managers perceive as the compatibility and, therefore, the adaptability of their organizations to the sub-part of the economic environment. We surmise that competitive and/or cooperative interfirm interactions will ultimately determine firm performance in the chosen external setting. Our speculation is that such interactions are driven by cognitive discretions of senior executives and are reflective of their perceived meaning of the external reality. We contend that interfirm relations which are primarily competitive or firm exchanges which are mainly cooperative may be more frequently found in low-technology economic environment. Alternatively, our conjecture is that organizational interrelationships which are based on cooperation and competition may be more frequently found in high-technology economic environment. These arguments are consistent with recent assertions of a number of economists who have broadly recognized two fundamentally different economic environments - - a low-technology, bulk-production environment and a high-technology, knowledge-based environment (Arthur, 1994, 1996). The former may entail diminishing returns while the latter will yield increasing returns. Below, we will examine how managerial logic may impact the nature of interfirm relations in the context of a low-technology economic environment. Subsequently, we will address how managerial logic may determine interorganizational exchanges in the context of a high-technology economic environment. Managerial Logic In A Low-Technology Environment As suggested earlier, groups of interrelated firms may be proactively located in a sub-part of the external environment because of what top managers perceive as the compatibility of their firms with that external sub-part. Consistent with the observations of select economists (Arthur 1994, 1996), within a low-technology economic environment, an opportunistic executive logic may influence the nature of firm interrelationships. A low-technology, bulk-production economic environment may subject firms to diminishing returns because expanding firms may ultimately face physical constraints. More specifically, as these firms attempt to grow, they may be confronted with some limitations - - in their access to resources, production efficiency, or logistics effectiveness.
Page 116
Academy of Strategic Management Journal, Volume 13, Number 1, 2014
Since a low-technology, bulk-production economic environment may be associated with diminishing returns, firms subject to this structure may become confronted with profit constraints. Thus, it is consistent for managerial logic to presume that superior firm performance may require opportunistic, competitive interfirm exchanges. In the context of a low-technology environment, a number of perceived characteristics are consistent with forming a managerial logic which promotes interfirm competition. These perceived characteristics are compatible with the presumption of diminishing returns, which may be reflective of a bulk-production economic environment.
The gain of one firm may be matched with a loss to another (e.g., one firm may gain at the expense of its rivals; a buying organization may benefit at a cost to its suppliers).
Opportunism may be expected in firm interactions, given a zero-sum-game scenario.
Lack of trust may prevail among firms. Firms may be envisioned to compete in industries with distinct parameters. In an industry, the boundaries and role identities of firms may be contemplated to
be clear-cut (e.g., buyer organizations, competing firms or supplier organizations can be clearly distinguished from each other).
Reverting to PepsiCo, Coca-Cola, McDonald’s, and Monsanto, note that the above-mentioned perceived characteristics are compatible with their situation. The gain of Coca-Cola may be a loss to McDonald’s. They intensely negotiate on the price of soft drinks which Coca-Cola supplies to McDonald’s. Since Coca-Cola and PepsiCo are adversarial rivals, the gain of one firm may also be a loss to the other. Additionally, Coca-Cola and PepsiCo can be better off at a cost to Monsanto which supplies them with aspartame, under the brand name of NutraSweet. Given that the interrelations of these firms tend to be associated with zero-sum-game outcomes, their interfirm behavior may be opportunistic. Justifiably, a lack of trust may prevail among such firms. Sometimes, opportunistic firms even revert to deception in order to gain at the expense of others. This is what PepsiCo and Coca-Cola resorts to at one time in order to receive price discounts in NutraSweet from Monsanto. These soft drink giants encouraged the Holland Sweetener Company (HSC) to build additional aspartame production facilities to foster a more competitive supplier climate. To confront the threat posed by HSC, Monsanto initiated significant price cuts on NutraSweet for future contractual relationships. In response, rather than dealing with HSC, Coke and Pepsi again signed agreements with Monsanto. “In the end, what Coke and Pepsi really wanted was to get the same old NutraSweet at a much better price” - - something that could not have accomplished without the intervention of a deceived HSC (Brandenburger & Nalebuff, 1995). Moreover, these firms may be convinced to compete in industries with distinct parameters. While Coca-Cola and PepsiCo operate in the soft drink industry, McDonald’s is in the fast-food restaurant industry and Monsanto is located in the chemical industry. Additionally, the role identities and boundaries of such firms may be unambiguous. For instance, Monsanto plays a
Page 117
Academy of Strategic Management Journal, Volume 13, Number 1, 2014
supplier role to the soft drink producers. McDonald’s is a buyer of soft drinks from Coca-Cola. PepsiCo and Coca-Cola are rivals. The boundaries of these firms may also be perceived as clear-cut since they are not mutually involved in quality training, product development or other internal processes which may result in ambiguity of interfirm boundaries. Under these circumstances, these firms may be expected to be managed and developed in dependently of each other. While managerial logic for some groups of firms in a low-technology environment may be predisposed to interfirm competition, for other groups of firms, managerial logic may alternatively be prone to cooperation. According to this logic, firm viability may be enhanced through collaborative and nonconfrontational strategies. Even though a low-technology environment may entail diminishing returns, firms may advantageously respond to this reality via noconfrontational strategies, such as reconfiguration of their businesses. Before discussing reconfiguration, we should state that a number of alternative perceived characteristics may be consistent with developing a nonconfrontational managerial logic which promotes interfirm cooperation.
The gain of one firm need not be matched with a loss to another. Further, interorganizational relations may result in mutual gains.
Collaboration may be acceptable to firms, given a nonzero-sum-game setting. Trust may prevail among firms. Firms may operate within distinct industry parameters but some firms may
conduct their businesses fundamentally differently from industry norms. The boundaries and roles of interrelated firms may not always be clear-cut.
As discussed subsequently, the preceding perceived characteristics are pertinent to IKEA
and its group of interrelated firms. We emphasize that IKEA has reconfigured the conduct of business in the furniture retailing industry. Traditionally, in this industry, retail outlets have purchased finished furniture from manufacturers or wholesalers and have displayed them in their retail stores. What the customers purchase is delivered to them. Note how IKEA has adopted a different conduct in furniture retailing. In order to provide furniture at lower prices, IKEA has linked the customers to its own operations by assisting them in becoming partners in furniture assembly and distribution (Norman & Ramirez, 1993). That is, customers purchase furniture kits that can be assembled at home and are offered in smaller packings that can be transported by the customer themselves. Moreover, this enterprise provides substantial technical and research and development assistance to the suppliers and, when necessary, leases needed equipment to them (Norman & Ramirez, 1993). The purpose of providing such supplier support to ensure that IKEA’s products will keep pace with world standards in design and efficiencies that will then ensure IKEA of a low cost structure. While these strategies benefit IKEA and its suppliers or customers, they are also nonconfrontational vis-à-vis the rivals. The rivals can sell and deliver more expensive, finished furniture to buyers who value convenience at a higher price. Reverting to the perceived characteristics mentioned above, note that they are compatible with IKEA’s group of interacting players. The gain of IKEA need not be matched with a loss to its suppliers, customers, or even rivals. Indeed, interorganizational relations in this context may be characterized as mutually beneficial. Given a nonzero-sum-game situation, cooperative interfirm
Page 118
Academy of Strategic Management Journal, Volume 13, Number 1, 2014
exchanges may prevail and trust may exist among interacting players. Further, IKEA’s different firm conduct, from the traditional industry standards, may be conceived to have obscured interfirm boundaries and roles. For instance, IKEA’s assistance to its suppliers has blurred interorganizational boundaries which may normally exist between firms and their suppliers. Also, IKEA’s customers have assumed some of the roles which would ordinarily have been played by furniture retailers, such as the assembly and transportation of products. Managerial Logic In A High-Technology Environment Presumably the choice to locate a firm in a high-technology environment is driven by what strategic managers logically conclude is the compatibility of their organization to that sub-part. Consistent with this managerial logic, groups of interrelated firms may be proactively located in a high-technology sub-part of the external environment. Diminishing returns are not associated with this sector. Indeed, a high-technology, knowledge-based economic milieu is subject to increasing returns (Arthur, 1994; Hagel, 1996). Increasing returns are possible in this setting because, unlike the low-technology, bulk-production environment, the high-technology economic structure is not primarily impacted by physical constraints (e.g., access to tangible raw materials, efficient manufacturing capacity for production of goods, effective distribution of physical products). Rather, a high-technology economic environment is mainly characterized by intangible, knowledge-based resources. In this context, once the cost of creating a new knowledge has been incurred, the know-how can be used repeatedly at no additional cost (Romer, 1990). For instance, Microsoft’s Window disks have been advanced at a high cost of developing the know-how (an R & D cost of $50 million); the cost of the physical disk, however, has remained at only $3. As argued by Arthur, “the first disk of Windows to go out the door cost Microsoft $50 million; the second and subsequent disks cost $3” (Arthur, 1996). Thus, as revenues increase, unit costs may continuously decrease in a high-technology environment. In a knowledge-based environment, the outputs of a firm ordinarily cannot stand alone (Hagel, 1996). Each firm’s outfit performance may dependent on other interrelated firms’ products and technologies. Consequently, for any one firm’s products to further develop may require that the complementary outputs of other interrelated enterprises also develop. Moreover, because complementary outputs and technologies have diverse knowledge bases require substantial up-front costs, no one firm may have the capability or resources to produce all that is required to support a knowledge-based system. This, for instance, applies to the knowledge-based system supported with the mutually interdependent outputs of Microsoft, Intel, IBM, America Online, Netscape, and Hewlett-Packard (Moo5re, 1993, 1996). Such interrelated firms in high-technology environment tend to focus on complementary activities and outputs in which they excel (Hagel, 1996). Under these circumstances, since a firm may not have the capacity to continuously produce dramatic improvements by itself (Moore, 1996), the net for ideas and resources may need to be cast wide across group members.
A group of interrelated firms in a high-technology environment tends to maintain its membership based on merit. Consistent with the arguments of a number of authorities, only those firms which have the willingness and capability to contribute to the long-term mutual development of the group will likely remain a member (Hagel, 1996). Others will probably be replaced.
Page 119
Academy of Strategic Management Journal, Volume 13, Number 1, 2014
Competency in the group may be evaluated through cooperative as well as competitive behaviors. That is because while in some dimensions group members may have complementary outputs, in other dimensions they may have competitive outputs (Moore, 1993). Moreover, in such an environment, multiple interfirm roles may be competitively and cooperatively played in organizational exchanges. For example, on any given day, AT&T finds Motorola to be simultaneously a rival, a partner, a supplier, and/or consumer (Hamel & Prahalad, 1994). Also, while some firms may play reciprocal multiple roles, other firms may proactively transform the roles of other players. Novell, for instance, has performed well by consistently converting rivals into suppliers, partners, or customers through the development and use of its “NetWare” software. Novell has recognized that its success is dependent on attracting other software applications to NetWare so it has formulated incentives for competing software developers to write for and utilize NetWare (Hagel, 1996). As suggested earlier, in this milieu, for any one organization’s outputs to further develop may require that the complementary outputs of other interrelated enterprises also develop. The viability of each organization, then, may be linked to the viability of the group members. Consequently, mutually beneficial outcomes are possible for a group of interrelated cooperative and competitive firms in which co-develop. The contention that the viability of each firm may be tied to the viability of the group members, and that for each firm to develop may require that other firms also develop through cooperation and competition, has its parallel in the animal kingdom (Moore, 1996). This co-developmental process is not always obvious. For instance, lions, hyenas, and zebras co-develop. The lion culls the weak and slow zebras, strengthening the herd of zebras over time. But with a stronger and faster herd, the lion must also become more viable to prevail over the prey. Since the hyena also competes for the zebra, this predator must also become stronger and faster over time in order to feast on the zebra. Interactions in the animal kingdom, however, also entail both competitive and cooperative behaviors. More specifically, while male zebras compete with each other for mates, their anti-predatory, cooperative behavior protects their potential mates as well as each of the males. Also, while lions (or hyenas) will cooperate in their hunt of the zebra, they will compete over the kill. Additionally, the chase by hyenas may result in the movement of the zebras towards the lions (or vice versa), demonstrating an unintentional, but in effect, realized cooperation between the lion and the hyena. While in the animal kingdom competitive or cooperative behavior is instinctively driven, interrelated firms tend to be intentionally driven to be cooperative or competitive as they mutually develop. In a high-technology environment, consistent with what we have discussed, a number of perceived characteristics are compatible with forming a managerial logic which promotes interfirm cooperation and competition.
Interorganizational exchanges may result in co-development and mutual gains. Collaboration and competition may prevail among firms with nonzero-sum-game
outcomes. Trust may exist as firm viability may be tied to a group of interrelated firms. Firms may operate across blurred industry parameters.
Page 120
Academy of Strategic Management Journal, Volume 13, Number 1, 2014
The boundaries and roles of interrelated firms may not be clear-cut. Reverting to Microsoft, Intel, IBM, Netscape, America Online, and Hewlett-Packard, note that the preceding perceived characteristics are compatible with their interactions. These software, hardware, and information vendors tend to have interrelations which may result in co-development and mutual benefits. Their cooperation or rivalry is ordinarily associated with nonzero-sum-game outcomes (Arthur, 1996, Moore, 1993, Porter, 2003, Magretta, 2012). As their viabilities may be linked, trust may exist among them. They operate across seemingly blurred industry parameters and their boundaries and roles are not always clear-cut. These firms, for instance, traverse communications, personal computers, consumer electronics, and information industries. While they cooperate, they also assume rivalrous roles in their relationships - - e.g., Microsoft, Netscape, and America Online gave competing software products. Firm boundaries are not always distinct as output developments of one firm are related to output developments in others. For example, Intel, Microsoft, and IBM may coordinate their efforts across their organizations as newer microprocessors from Intel, improved personal computers from IBM, and compatible software developed by Microsoft are brought together for the achievement of a higher value delivery system. The various groups of interrelated businesses discussed have advantages and disadvantages associated with them. Executives may find an explicit elaboration on these advantages or disadvantages helpful.
ADVANTAGES AND DISADVANTAGES OF GROUPS OF INTERRELATED FIRMS
Within a low-technology economic environment, an opportunistic managerial logic may influence the nature or organizational interrelationships. Since in this setting, diminishing returns are possible, it may be consistent for executive logic to presume that firm viability may require opportunistic, competitive interorganizational exchanges. A group of firms which are competitively interrelated entails a number of advantages for each group member. A competitive group may preserve firm autonomy, reduce organizational costs associated with interorganizational relations, promote greater firm efficiency through reduced slack, or advance productivity by drawing resources toward their most value-enhancing uses (McNulty, 1968). The gravitation of resources toward their most productive usage may occur as a firm competes with rivals, suppliers, customers, or even organizations in substitute industries. A competitive strategic orientation toward others, however, is limiting for a number of reasons. First, an adversarial strategic orientation diminishes possibilities for gaining efficiencies that may be feasible through cooperation with other organizations, such as with suppliers, customers, or rivals (Dyer, 1996). Second, competitive group interrelations limit innovations which may otherwise be possible as organizations collaborate. For example the technological improvements in small car production by General Motors and Toyota may not have been feasible without their joint venture (Dyer & Ouchi, 1993). Third, achieving competitive parity may in some situations be difficulty if an adversarial stance is adopted with various stakeholders. For instance, it has been argued that an important reason why the U.S. automakers previously lost to their Japanese rivals was due to their adversarial, competitive relationships with their suppliers (Dyer,
Page 121
Academy of Strategic Management Journal, Volume 13, Number 1, 2014
1996). The U.S. vehicle producers chose suppliers on the basis of price and did not involve them in the design of the product. Viewing suppliers as adversaries, the American firms expected them to do as they were told and not much more, resulting in higher overall costs and fewer improvements. Moreover, an emphasis on adversarial rivalry may promote destructive competition. Consider, for example, the periodic destructive price rivalry in the airline industry. One airline’s price discounting may provide a temporary increase in sales until rivals match prices in order to regain lost revenues. Worse yet, the rivals may subsequently initiate their own price discounting. The outcome of such rivalry may be to reestablish the status quo, but at a lower price level. This outcome is not only undesirable for the rivals in the airline industry but also for such interrelated firms as their suppliers. Since destructive competition lowers the profitability of the air transportation industry, it diminishes the amount of funds that may be subsequently available for needed purchases. Suppliers will consequently be negatively affected by lower sale and a heightened intensity of competition. But the airlines will further suffer because suppliers may be unable to lower their costs and offer reduced prices to these firms if they make limited purchases and thus retard the lowering of suppliers’ costs. There are also advantages and disadvantages regarding a group of firms which are cooperatively interrelated in a low-technology environment. A cooperative group may allow for mutually advantageous exchanges of resources (Carroll, 1984). Moreover, it may foster trust and lead to a long-term interfirm collaboration. Through an enduring collaboration, firms may become more innovative and efficient (Margolis, 1984). Indeed, transaction cost analysis is consistent with the premise that efficiency is an underlying driver of interfirm cooperation (Oliver, 1990, Williamson, 1985). Otherwise, transactions could be accomplished at one extreme - - in the market - - or at another extreme - - within the firm, if interfirm cooperation were inefficient. A group of firms which is cooperatively interrelated, however, is not without disadvantages. Which interorganizational interdependence, there is a loss in firm autonomy. Also, periodically, organizations which are predisposed to cooperate may be used opportunistically by other firms. Additionally, from the perspective of transaction cost theory, interfirm cooperation cannot be maintained free of costs. To the extent that such costs may be more than the expected economic benefits, a group of firms which is cooperatively interrelated is disadvantaged (Williamson, 1985). Moreover, in some situations, the adoption of interfirm cooperation may be disadvantageous because explicit cooperation among firms particularly though long-term agreements or contracts removes the discipline of the market. We emphasize that not only explicit cooperation may have disadvantages, but also implicit cooperation could be detrimental. For instance, in oligopolistic rivalry monopolistic practices and prices, temporarily benefiting all, may prevail without explicit collusion (Chamberlin, 1929; Machlup, 1952). The long-term implication of such implicit cooperation, however, may be detrimental to each firm. The reason is that implicit interfirm cooperation could lead to strategic inflexibility, bonding firms into Schumpeter’s circular flow and subjecting them to the threat of creative destruction of newly formed entrepreneurial enterprises which recombine resources (Schumpeter, 1934). That is, a limited competitive pressure, because of implicit interfirm cooperation, may lessen the incentive to become more innovative or efficient, reducing the industry’s attractiveness vis-à-vis newly formed substitute industries.
Page 122
Academy of Strategic Management Journal, Volume 13, Number 1, 2014
There are also advantages and disadvantages associated with a group of firms which are cooperatively and competitively interrelated in a high-technology sector. An advantage is that the interdependence of member firms and the requirement for mutual development may allow for synergistic outcomes which will benefit each firm. Since cooperation and competition may simultaneously exist here, member firms may be able to capitalize on the benefits of cooperation as well as competition. Other advantages are that for member firms risk may be spread, flexibility increase, and possibilities for innovation enhanced (Hagel, Bergsma & Dheer, 1996). Alternatively, a disadvantage is that managing both cooperative and competitive relationships among firms may be difficult. Moreover, with interorganizational interdependence, there is a loss in firm autonomy. Also, in such a system, as more firms become members, interrelationships may become more complex and costly. This appears to be a paradox because these systems may become further successful as an increasing number of companies join them (Bowers & Singer, 1996). Our discussion in this paper has implications for managerial practice. Next, we elaborate on these implications.
IMPLICATIONS FOR MANAGEMENT
We began this paper by asking how various firms are interrelated. Our response to this question has been that organizations have competitive and/or cooperative interfirm exchanges and it is via such exchanged that they may be interrelated. We have broadly focused on managerial logic as well as the economic environment as determinants of the nature of interfirm exchanges. We now turn to a discussion of the managerial implications of various interfirm exchanges. Competitive Exchanges
As suggested earlier, in a low-technology economic environment interfirm behavior may be characterized as primarily competitive. As argued by Porter, competition in this sense goes beyond the existing rivals to also include such players as suppliers and customers (Porter, 1985). Rivalry in this broader context may be referred to as extended rivalry within a group of interrelated firms. Customers compete with the industry rivals by negotiating for and possibly forcing down prices. Suppliers can compete with industry rivals by raising prices. As is evident, under these competitive circumstances, the gain of one firm may be matched with a loss to another. Given a zero-sum-game context, opportunism may be expected as each firm independently strives to be viable within a group of competitively interrelated organizations. In this setting, there are a number of implications for managerial practice. These implications may serve as a motive for executives to position the enterprise against the competitive forces so as to capitalize on the firm’s strengths while defending against its weakness.
First, management may need to guard against an increase in the intensity of competition by enhancing the firm’s scale economies or product differentiation; thus also contributing to the heightening of strategic group and industry entry barriers. The former may allow the firm to offer competitive prices while the latter may enable the enterprise to increase its margins through prices which are higher than the industry norm. Second, executives may advantageously focus on select customers for the firm. Since customers tend to be heterogeneous in their needs, each firm may
Page 123
Academy of Strategic Management Journal, Volume 13, Number 1, 2014
have a different capability in serving well the needs of certain buyers. Consequently, an enterprise could choose to sell primarily to buyers whose needs are better matched to what constitutes the firm’s capabilities. Third, managers of an enterprise could focus o suppliers which offer advantages, and, preferably those which have low bargaining power vis-à-vis the firm. Cooperative Exchanges
Recall that in a low-technology environment, interfirm behavior may alternatively be characterized as primarily cooperative and nonconfrontational. This is possible in situations where the gain of one firm is not matched with a loss to another. Further, interorganizational exchanges under such circumstances may be associated with mutual benefits. Given a nonzero-sum-game setting, then, nonconfrontational interfirm behavior may be acceptable to organizations. These circumstances may have certain other implications for management. First, executives may be well advised to explicitly recognize that the existence of other interrelated firms, including rivals, may be beneficial. In this context, note that the efforts of one firm to improve itself may result in the improvements of other enterprises. For instance, research and development efforts of some firms may diffuse and thereby mutually increase the knowledge base of competitors (Jaffe, 1986; Jose, Nichols & Stevens, 1986). Similarly, promotional efforts by some organizations may also increase the demand for the outputs of rivals (Leone & Schaltz, 1980). Moreover, rivals could jointly undertake R&D and promotional programs for mutual advantage. If the existence of rivals may be advantageous, then the existence of supplier and buyer organizations may especially provide mutual benefits as they may enhance the effectiveness and efficiency of an interdependent value chain in which the firm participates.
Second, even though a low-technology environment may be associated with diminishing returns, executives may be well advised to recognize that their firms may be capable of advantageously responding to this reality via nonconfrontational strategies, such as a strategy of reconfiguring their enterprises. Recall how IKEA has reconfigured the conduct of business in the furniture retailing industry. The nonconfrontational strategy of IKEA with its rivals and its cooperation with the suppliers and buyers has allowed this firm to lower its costs in a milieu where executives may be concerned with diminishing returns. Third, nonconfrontational strategies in such an environment may not be restricted to cost reduction efforts through reconfigurations. Alternatively, in a setting of diminishing returns, price increases may offset a potentially higher cost of operations due to diminishing returns. Indeed, margins may be protected through nonconfrontational strategies of setting higher product and service prices even if the point of diminishing returns has not bee reached.
In this context, Trans World Airlines exemplifies how a nonconfrontational predisposition via the implementation of higher prices may potentially benefit the firm and its interrelated organizations. TWA’s strategy has consisted of removing sufficient seats per place to provide more legroom for passengers in the coach section. Charging higher prices for more comfort has won customer acceptance as TWA has placed first in consumer satisfaction for long-haul flights (Brandenburger & Nalebuff, 1995). As i9s evident, this is a nonconfrontational strategy as TWA’s higher prices do not put competitors under price pressure. Further, if other airlines were to imitate this strategy, excess capacity could be reduced in an industry harmed by overcapacity and
Page 124
Academy of Strategic Management Journal, Volume 13, Number 1, 2014
destructive price wars. Nonconfrontational strategies not only may benefit the firm and its rivals but also the various stakeholders. As implied above, constructive strategies by the airlines may translate into higher industry profitability. Thus, suppliers to the airline industry may benefit as their volume of business may increase, perhaps improving their efficiencies. With improved efficiencies, the suppliers may be able to offer better terms and reduced costs to the airlines, which could subsequently improve their value delivery to the airline traveler, leading to mutual benefits for a variety of interrelated players.
Fourth, managers may be better off realizing that in some instances adversarial and destructive strategies may be proactively changed to nonconfrontational strategies with ensuing mutual benefits. For instance, in the early 1990’s, the American vehicle manufacturers were locked into destructive rivalry, with significant rebates and price discounts routinely offered. Buyers had begun to anticipate such rebates and discounts in their purchases, thus depressing corporate earnings. According to Brandenburger and Nalebuff, General Motors changed the rules of the game in this industry from destructive to constructive rules through the introduction of the GM credit card (Brandenburger & Nalebuff, 1995). This card allowed the customers to apply 5% of their charges toward a future discount in buying a new GM vehicle. Effectively, this resulted in a price increase of GM cars for customers lacking a GM card. Thus, Ford or Chrysler could gain these customers while simultaneously being able to increase their prices in response to GM’s strategy – a win-win outcome.
Cooperative And Competitive Exchanges
Note that in a high-technology setting, interfirm relations may be characterized as cooperative and competitive. Further, interorganizational exchanges may result in co-development of mutual gains. Trust may exist in this situation as organizational viability may be tied to a group of interrelated firms. These conditions have a number of implications for strategic managers. First, even though in the short-term, a “do it alone” firm strategy may seem feasible and appealing, such a strategy should be avoided since, in the long-run, it will not be successful (Moore, 1996). For instance, while Microsoft, Intel, IBM, Netscape, America Online, and Hewlett-Packard have been successful in their mutual development of a system of value delivery, built around the personal computer, Tandy failed in its attempt to similarly deliver value but through an independent, vertically integrated approach. Tandy’s approach got the company out front quickly through its ownership of hardware and software components (Arthur, 1996; Moore 1993). It created or purchased needed inputs ranging from the operating systems to programming and applications. Moreover, Tandy channeled sales, service, and training exclusively through its Radio Shack outlets. Tandy was not successful, however, because it neither had the capability nor the resources to exponentially develop its knowledge-based system all by itself.
Second, while in a primarily competitive interrelated group of low-technology firms it may make sense to heighten barriers to entry. In a cooperative and competitive group of high-technology enterprises the opposite may be advised. That is because a group of interrelated firms in this environment is built around a specific technology platform (Moore, 1996; Romer, 1990). The wider the use of the technology platform developed by the group, the more successful that group will be. What is interesting is that a platform with a wider use initially may continue to
Page 125
Academy of Strategic Management Journal, Volume 13, Number 1, 2014
increase its market acceptance while a platform which has limited initial use will get further behind, regardless of their merits. For instances, the initial production of more VHS videocassette recorders by more competitors encouraged video retailers to stock more prerecorded tapes in the VHS format, which in turn, encouraged the production of more titles in this format, even though the beta format has always been technically superior (Arthur, 1994).
Third, in a high-technology setting, executives may be well advised to focus their attention on intergroup competition. That is because each firm and its group of interrelated firms vies with other firms and their groups of interrelated firms – in the promotion of wider use of competing technological platforms. Thus, firm viability is linked to the viability of a group of interrelated firms. Moreover, firm growth is tied to the growth of a group of interrelated firms which attempt to widely disseminate the utilization of their chosen platform. We end our paper by briefly offering our concluding remarks.
CONCLUDING REMARKS
For the purpose of clarity, we have broadly discussed the environment in the context of
low-technology versus high-technology spheres. The two environments, however, are not completely separate. Moreover, an intangible, knowledge-based resource may not always be apart from a low-technology, physical resource. For example, an intangible esoteric know-how in the high-technology environment “is itself tied to the physical piece of paper or the physical computer disk on which it is stored” (Romer, 1990). Similarly, although we have broadly identified various perceived characteristics of distinct groups of interrelated firms which are compatible with different managerial logics, we do not exclude the possibility for some combinations of them to exist or to form under certain circumstances.
Additionally, we have contended that competitive or cooperative interfirm exchanges may more frequently be found in a low-technology environment. Also, we have suggested that competitive and collaborative interrelationships may be more frequently found in a high-technology setting. Again, we do not exclude the possibility for different interfirm behavior/environmental setting combinations to exist o to form in certain situations. Our attempt has been to broadly approach the content of this paper and deliver our presentation parsimoniously. Our elaborations in this paper may serve as an alternative reference which may guide executive practice. That practice may need to be reevaluated, contingent on whether groups of firms are interrelated competitively and/or cooperatively and whether they operative in a high-technology or a low-technology environmental sphere.
REFERENCES Arthur, W.B. (1994) Increasing Returns and Path Dependence in the Economy. Ann Arbor: The University of
Michigan Press. Arthur, W.B. (1996) Increasing returns and the new world of business. Harvard Business Review (74), 100-109. Baum, J.A., and Korn, H.J. (1996) Competitive dynamics of interfirm rivalry. Academy of Management Journal
(39:2), 255-291.
Page 126
Academy of Strategic Management Journal, Volume 13, Number 1, 2014
Bowers, T., and Singer, M. (1996) Who will capture value in on-line financial services? The McKinsey Quarterly (2), 78-83.
Brandenburger, A.M., and Nalebuff, B.J. (1995) The right game: Use game theory to shape strategy. Harvard Business Review, (73), 57-71.
Carroll, G.R. (1984) The specialist strategy, in G. Carroll and D. Vogel (Editors) Strategy and Organization: An East Coast Perspective. Boston: Pitman, 117-128.
Chamberlin, E.H. (1929) Duopoly: Value where sellers are few. Quarterly Journal of Economics (43), 63-100. Chellappa, R.K., and Saraf, N. (2010) Alliances, rivalry, and firm performance in enterprise systems software markets:
A social network approach. Information Systems Research (21:4), 849-871, 1000-1001, 1006. Chen, M. (1996) Competitor analysis and interfirm rivalry: Toward a theoretical integration. Academy of Management
Review (21:1), 100-134. Dyer, J.H. (1996) How Chrysler created an American keiretsu. Harvard Business Review (74), 42-56. Dyer, J.H., and Ouchi, W.G. (1993) Japanese-style partnerships: Giving companies a competitive edge. Sloan
Management Review, (Fall), 51-63. Dyer, J.H. (1997) Effective interfirm collaboration: How firms minimize transaction costs and maximize transaction
value. Strategic Management Journal (18:7), 535-556. Gautam, A. (2000) Inducements and opportunities in the formation of interfirm linkages. Strategic Management
Journal, suppl. Special Issue: Strategic Networks (21:3), 317-343. Gulati, R. (1995) Does familiarity breed trust? The implications of repeated ties for contractual choice in alliances.
Academy of Management Journal (38:1), 85-112. Gunduz, E. (2013) Innovation contingencies affected by competitive tension. The Journal of American Academy of
Business, Cambridge (19:1), 202-208. Hagel, J. (1996) Spider versus spider. The McKinsey Quarterly (1), 5-18. Hagel, J, Bergsma, E.E., and Dheer, S. (1996) Placing your bets on electronic networks. The McKinsey Quarterly (2),
56-67. Hamel, G. and Prahalad, C.K. (1994) Competing for the Future. Cambridge: Harvard Business School Press. Jaffe, A.B. (1986) Technological opportunity and spillovers of R and D: Evidence from firms’ patents, profits , and
market value. The American Economic Review (76), 984-1001. Jose, M., Nichols, L., and Stevens, J. (1986) Contributions of diversification, promotion, and R and D to the value of
multiproduct firms: A Tobin’s q approach. Financial Management (15), 33-42. Leone, R.P., and Schultz R.L. (1980) A study of marketing generalizations. Journal of Marketing (44), 10-18. Lubatkin, M., Florin, J., and Lane, P. (2001) Learning together and apart: A model of reciprocal interfirm learning.
Human Relations (54:10), 1353-1382. Machlup, F. (1952) The Political Economy of Monopoly. Baltimore: John Hopkins Press. Magretta, J. (2012) Understanding Michael Porter. Boston: Harvard Business Review Press. Margolis, H. (1984) Selfishness, Altruism, and Rationality. A Theory of Social Choice. Chicago: The University of
Chicago Press. Mcnulty, P.J. (1968) Economic theory and the meaning of competition. Quarterly Journal of Economics (82), 639-
656. Moore, J.F. (1993) Predators and prey: A new ecology of competition. Harvard Business Review (71), 75-86. Moore, J.F. (1996) The death of competition: Leadership and strategy in the age of business ecosystems. New York:
Harper Collins. Norman, R., and Ramirez (1993) From value chain to value constellations: Designing interactive strategy. Harvard
Business Review (71), 65-77. Oliver, C. (1990) Determinants of interorganizational relationships: Integration and future directions. Academy of
Management Review (15), 241-265.
Page 127
Academy of Strategic Management Journal, Volume 13, Number 1, 2014
Orton, J.D., and Weick, K.E. (1990) Loosely coupled systems: A reconceptualization. Academy of Management Review (15), 203-223.
Park, S.H., and Ungson, G.R. (2001) Interfirm rivalry and managerial complexity: A conceptual framework of alliance failure. Organization Science (12:1), 37-53.
Parkhe, A. (1993) A game theoretic and transaction cost examination of interfirm cooperation. Academy of Management Journal (36:4), 794-829.
Porter, M.E. (1985) Competitive Advantage. New York: The Free Press. Porter, M.E. (2003) The economic performance of regions. Regional Studies, (37), 549-578. Snowdon, B., and Stonehouse, G. ((2006) Competitiveness in a globalized world: Michael Porter on the
microeconomic foundations of the competitiveness of nations, regions, and firms. Journal of International Business Studies, 37, 163-175.
Romer, P.M. (1990) Endogenous technological change. Journal of Political Economy (98), 291-305. Schumpeter, J.A. (1934) The Theory of Economic Development. Cambridge, MA: Harvard University Press. Tong, T.W., and Reuer, J.J. (2010) Competitive consequences of interfirm collaboration: how joint ventures shape
industry profitability. Journal of International Business Studies (41), 1056-1073. Trapido, D. (2013) Dual signals: How competition makes or breaks interfirm social ties. Organization Science, (24:2),
498-512. Weick, K.E, Gilfillan, D.P., and Keith, T. (1973) The effect of composer credibility on orchestra performance.
Sociometry (36), 435-462. Williamson, O.E. (1985) The Economic Institutions of Capitalism. New York: Free Press.
Page 128
Academy of Strategic Management Journal, Volume 13, Number 1, 2014
Page 129
Academy of Strategic Management Journal, Volume 13, Number 1, 2014
BOARD HETEROGENEITY: DOUBLE-EDGED SWORD? FOCUSING ON THE MODERATING EFFECTS OF RISK
ON HETEROGENEITY-PERFORMANCE LINKAGE
Kong-Hee Kim, St. Cloud State University
ABSTRACT
Extant literature on group heterogeneity-performance link is characterized by theoretical divergence. While a board’s cognitive heterogeneity can increase the variety of information utilized in boardroom discussion, it can also result in internal process losses, decreasing efficiency at the corporate top. The findings of this study reveal that board heterogeneity is negatively related to firm performance when the firm is operating in volatile managerial context of higher firm risk. More specifically, an empirical investigation using a sample of 295 Fortune 1000 firms reveals that board heterogeneity in functional background and educational specialty is negatively related to firm performance as firm risk increases. Implications of the results are discussed for the integration of theories and future research. Key Words: Board Heterogeneity, Team Composition, Firm Risk
INTRODUCTION
Corporate leaders in today’s volatile business arena are increasingly interested in the
influence of board composition on strategic performance of firms. Thereby, greater research attention has been directed to compositional attributes that may increase a board's strategy role and, in particular, to the effects of board heterogeneity (e.g., Hillman & Dalziel, 2003; Haynes & Hillman, 2010; Tuggle, Schnatterly & Johnson, 2010). Since the board is a strategic decision-making group at the apex of the corporation, the implications of board heterogeneity for firm performance present important research questions. Board heterogeneity originally was seen as a desirable goal by many corporations, either to better reflect diversity found in the workforce and consumer groups or simply to be viewed as a socially responsible company (Robinson & Dechant, 1997).
The extant theoretical models on group composition-performance link, however, have provided competing prescriptions regarding the impact of group heterogeneity on performance. One school argues that increasing the cognitive heterogeneity in a group will increase the variety in human capital (Finkelstein & Hambrick, 1996; Mannix & Neale, 2005; Cannella, Park & Lee, 2008). Variations among group members’ cognitive backgrounds provide diversity in information, experiences, and perspectives, which in turn will increase the group's decision comprehensiveness.
Page 130
Academy of Strategic Management Journal, Volume 13, Number 1, 2014
The opposing perspective holds that increasing heterogeneity leads to behavioral disintegration among group members, resulting in decreased social capital and process efficiency in a group (Pelled, Eisenhardt & Xin, 1999; Jackson & Joshi, 2001; Li & Hambrick, 2005). Demographically dissimilar group members are more likely to be socio-culturally distant, resulting in inefficiencies in interpersonal communications and internal dynamics. Thus, it should be noted that the extant literature on group composition provides ambiguous guidance to those seeking to answer the question: “How does board of directors’ heterogeneity that embodies both positive and negative facets impact corporate performance?” Surprisingly, this important issue has been rarely explored in the research areas of board of directors and organization studies. One path to resolving these competing perspectives on board heterogeneity is to examine the implications of board heterogeneity in particular contexts. This approach enables corporate practitioners to be aware of the role of contingency contexts involved when they make choices on the continuum between board heterogeneity and homogeneity, and academic researchers to develop mid-range theories that can help reduce the ambiguity associated with board heterogeneity. To this end, this study empirically investigates how board heterogeneity impacts firm performance in the managerial context of firm risk. Firm risk, defined as volatility in business outcome variables, has been a central research topic across disciplines such as strategic management and financial economics (Ruefli, Collins & Lacugna, 1999; Gomez-Mejia, Haynes, Núñez-Nickel, Jacobson & Moyano-Fuentes, 2007). The context of higher firm risk provides top management including the board of directors with a greater demand for process efficiency in adapting to volatile firm-environment relationship. Managerial choices in environmental adaptations, for example, include R&D investments, changes in diversification posture, acquisitions and divestitures, adaptations in competitive strategy, and structural changes in resource allocation (Palmer & Wiseman, 1999). Such strategic decisions and their subsequent implementation are highly consequential board-level matters that have substantial impact on firm performance. In this respect, the managerial context of firm risk is an ideal research setting for studying possible divergent influences of board heterogeneity on firm performance. Moreover, as the corporate world becomes more dynamic with the emergence of global competition, it would be of benefit for academics and practitioners to consider how board heterogeneity impacts firm performance in increasingly volatile corporate environment. The findings of this study using a sample of 295 Fortune 1000 firms suggest that board heterogeneity in a functional background and educational specialty is negatively associated with firm performance when the firm has higher levels of firm risk. The results imply that managerial context of higher firm risk increases the demand for process efficiency at the corporate top, and in such a situation process inefficiencies stemming from board heterogeneity become more salient, having a negative impact on firm performance. This study demonstrates how board heterogeneity, containing intrinsically ambivalent components with respect to performance, plays a role in different managerial contexts. In the following section, a set of hypotheses are developed based on
Page 131
Academy of Strategic Management Journal, Volume 13, Number 1, 2014
the review of theoretical frameworks addressing the role of board heterogeneity in managerial context of firm risk.
BOARD HETEROGENEITY EMBEDDED IN MANAGERIAL CONTEXT
The board of directors is a bundle of directors or human capital at the apex of a corporation and its effectiveness in board’s functioning would be a collective outcome of board members. Board heterogeneity in terms of functional background, educational specialty, and organizational tenure should have substantial effects on the board’s cognitive decision-making behaviors. The upper echelons perspective in strategic management suggests that these knowledge structures affect top managers’ cognitive behaviors on choices, preferences, and interpersonal interactions, and thereby influence group-level outcomes when they are working as members of a team (e.g., Finkelstein & Hambrick, 1996). For instance, similarity in demographic backgrounds among group members contributes to the development of common schemata, providing a common premise for strategic decision-making (Gupta & Govindarajan, 1984). Some researchers focus on internal group dynamics, highlighting the dysfunctional effect of group diversity on performance (e.g., Watson, Kumar & Michaelson, 1993). Others emphasize the positive effects of membership heterogeneity on constructive group debate (Priem, Harrison & Muir, 1995). A more recent study on group composition has shed light on curvilinear relationships between group diversity and performance (Richard, Barnett, Dwyer & Chadwick, 2004). Over time, the theoretical pluralism and empirical inconclusiveness on team heterogeneity–performance relationship (e.g., Pelled et al., 1999; Cannella et al., 2008) have made the implications of board heterogeneity more ambiguous. Previous board researchers have related board’s demographic diversity to firm value and performance (e.g., Carter, Simkins & Simpson, 2003; Walt & Ingley, 2003). Researchers on board composition found that board diversity has a positive effect on firm performance. Carter et al (2003), for example, found that increased representation of women and minority members on the board to be positively related to firm value measured as Tobin’s Q. Additionally, Kosnik (1990) suggested that board demographic diversity is an important component for effectiveness in a board’s control and service functions. Although there has been an increasing number of research studies focusing on board’s strategy role in recent years (e.g., Hillman & Dalziel, 2003; Haynes & Hillman, 2010), little is known to academic researchers and industry practitioners on how board heterogeneity that has both functional and dysfunctional facets impacts firm performance in strategic management contexts. An underlying reason for the ambiguity centering on the performance implications of board heterogeneity is that, while demographic heterogeneity increases the span in knowledge structures, it also increases coordination costs associated with interactions among socio-culturally different individuals. That is, dissimilarity among group members’ backgrounds enhances variety in attitudes, perspectives, and knowledge, which is conducive to decision comprehensiveness
Page 132
Academy of Strategic Management Journal, Volume 13, Number 1, 2014
(Milliken & Martins, 1996). These same demographically dissimilar group members, however, are more likely to be distant in their interpersonal behaviors. This lack of social integration can cause inefficiencies in group communication and internal processes (Jehn, 1995; Li & Hambrick, 2005). Given the competing perspectives on the consequences of group heterogeneity, it would be of benefit for board researchers to examine the role of board heterogeneity in a contingency context in which the demands for a board’s knowledge variety versus internal process efficiency vary. Consequently, a managerial context of firm risk is chosen to evaluate these issues. Firm risk has crucial implications for strategic managers, shareholders, employees, and other stakeholders such as suppliers and customers (Bromiley, 1991; Sanders & Hambrick, 2007). In general, as risk is associated with uncertainty, the higher the uncertainty in strategic management environment, the greater the firm risk would be. Increased firm risk means increased variability in performance outcomes (e.g., volatility in internal income streams and firm's stock value) and thus a less stable managerial environment. Moreover, corporate strategic management by nature is a dynamic and complex process, most of the time involving uncertainty and risk. That is, highly complex environments increase firm risk, involving extensive competitive heterogeneity within an industry (Palmer & Wiseman, 1999). Unpredictability of rivals and strategic variety of firms in the industry all increase environmental risk (Greve, 2003; Winfrey & Budd, 1997).
Higher firm risk is likely with these environmental characteristics, and top management teams including the board of directors are required to be efficient in strategic information processing and devising strategic actions in firm adaptation. Many risk-related corporate decisions involve the board’s assessment and approval such as vertical integration, R&D, M&A, internationalization, lending and borrowing among others. It should be noted that board of directors at the apex of the corporation is in a position to assess and approve these initiatives in environmental adaptation. Risk-related changes in market domains and technologies, for example, are all agenda for boardroom discussion. To retain superior firm performance in these highly volatile business environments, corporations are required to be efficient in their adaptive responses in maintaining compatible firm-environment relationships (Miles & Snow, 1978). Given the contextual demands for process efficiency in a volatile managerial environment, inefficiency in board process would have a dysfunctional impact on firm performance. In particular, the dysfunctional aspects become more salient in the managerial context of higher firm risk where efficiency in information processing and group decision-making in a board would be a critical factor for firm performance.
Board diversity in human capital could be the source for a variety of information and knowledge utilized in group decision-making. At the same time, it is also noted that the heterogeneity composition in a group not always leads to the breadth of knowledge and information leveraged in a board and subsequent group performance due to the problems in group dynamics. In firms with higher firm risk (e.g., fluctuations in corporate income flows and stock prices), the managerial imminence in maintaining and/or improving the firm performance is efficient firm adaptation to the changes in business and managerial environments, which requires
Page 133
Academy of Strategic Management Journal, Volume 13, Number 1, 2014
process efficiency in group decision-making processes. That is, if there are gridlocks at the corporate top and senior management members including the board of directors rely on formal systems and procedures in group decision-making processes, heterogeneity of human capital may not be utilized in enhancing the decision comprehensiveness. Moreover, process inefficiencies derived from heterogeneity composition are often not well managed in various organizational settings, which is detrimental when the external environment requires fast responses and adaptation.
Diversity attributes employed in this study include the cognitive attributes that comprise directors’ task-related cognitive diversity (e.g., functional experience, educational specialty, organizational tenure) (Jackson et al., 1995). Cognitive diversity in group membership would be conducive to creativity and informational diversity in group decision-making processes (e.g., Jackson & Joshi, 2002). Prior studies on group demography have also suggested that groups composed of members from different backgrounds fail to realize the potential benefits of informational and knowledge variety because of problems with group processes such as communication, collaboration, and social interaction (e.g., Milliken & Martins, 1996; Chatman, Polzer, Barsade & Neale, 1998). Demographically similar individuals are more likely to interact with members who are perceived as members of in-groups, thus facilitating interpersonal interactions and communication and further reducing conflict (Li & Hambrick, 2005). For instance, it has been found that dissimilar experiences in functional experience lead to difficulties in communication and decreased group integration (Tsui & OReilly, 1989). Team members with diverse educational backgrounds often fail to exchange key information and experience poor coordination of activities compared to groups in which members have similar educational backgrounds (Jehn, Chadwick & Thatcher, 1997). Tenure homogeneity is also positively related to increases in interaction, communication, and collective effort (Smith, Smith, Olian, Sims, O’Bannon & Scully, 1994). Furthermore, demographic differences could engender emotional conflict as group members personalize their differences (Jackson & Joshi, 2002). Li and Hambrick (2005) found empirical evidence that factional groups in international joint venture management groups are positively related to emotional conflict, which in turn leads to behavioral disintegration within the group.
These ideas are echoed in board research as well. Board members tend to favor demographically similar board candidates in board selection processes because they regard demographically similar candidates to be socio-politically more compatible, which will facilitate interaction and communication in board processes (Westphal & Zajac, 1995). Board heterogeneity in tenure, functional and educational backgrounds may cause interpersonal distance and behavioral inefficiency. When boards are heterogeneous, members may be less willing to share their ideas. Heterogeneity in board members’ backgrounds creates an atmosphere that discourages interpersonal interaction and communication in boards’ decision-making process; thus, the collaborative outcomes or total shared knowledge in a board is diminished. That is, board heterogeneity in board members’ backgrounds often hampers the formation of cohesion and
Page 134
Academy of Strategic Management Journal, Volume 13, Number 1, 2014
conformity in a board thereby hindering efficient exchange of key strategic information and delaying board’s decision-making. Board researchers argue that the board’s functioning in monitoring and advising the management should be understood in terms of relational dynamics between the CEO and board (e.g., Deutsch, Keil & Laamanen, 2007). Process inefficiency on the part of the board may result in greater information imbalances between the CEO and the board, which could further undermine the efficient firm adaptation to environmental changes. It would be less likely for CEOs to obtain board’s consensus and approval in an efficient manner if the board has problems in internal processes. Delays in strategic decision-making and gridlock at the corporate top would have detrimental impact on the firm’s efficient and effective adaptations to volatile managerial environment leading to decreased firm performance.
These conditions in a board’s internal processes would have negative impacts on firm performance, especially when the corporation is experiencing higher firm risk. The bottom line for this argument is that higher firm risk is basically derived from the changes in the firm-environment relationship. In other words, higher volatility in firm performance arises from changes in the congruency in the firm-environment relationship (Miles & Snow, 1978). From a congruency perspective, efficient firm adaptation to changing environment is an indicator of firm capability that is necessary for securing superior firm performance. Ineffective resolution of the problems in environmental adaptation results in decreased firm performance. Decisions not to take action should also negatively affect firm performance for firms operating in a volatile business environment. Thus, contextual imminence in corporations with higher firm risk would be the process efficiency in information processing and decision-making at the apex of the corporation. Consequently, the board’s process losses derived from heterogeneous composition would negatively affect firm capability in maintaining the congruency in its product-market environment and efficient implementation of superior strategies. Furthermore, the negative facet of a board’s internal process losses should be more salient in the managerial posture of higher firm risk. This line of argument posits that:
H1: The relationship between board heterogeneity and firm performance is moderated
by firm risk, such that: H 1a: Board functional heterogeneity is negatively associated with firm performance
when the firm has higher levels of firm risk. H 1b: Board educational heterogeneity is negatively associated with firm performance
when the firm has higher levels of firm risk. H 1c: Board tenure heterogeneity is negatively associated with firm performance when
the firm has higher levels of firm risk.
Page 135
Academy of Strategic Management Journal, Volume 13, Number 1, 2014
METHODOLOGY
A sample of 300 firms for this study was randomly drawn from the Fortune 1000 list for the base year of 2003. A majority of these firms encompass a variety of industry structures, firm sizes, competitive strategies, and board composition structures, which potentially increases the research validity. Thus, Fortune 1000 firms provide an appropriate data setting for examining the impact of board heterogeneity on firm performance in the contingency context of firm risk. Data from 295 firms were entered in the statistical analysis since firm risk data on five firms were not publically available. Measures Board heterogeneity. Prior empirical studies on group demography have primarily relied on the homogeneity-heterogeneity dimension for measuring demographic heterogeneity at group levels (e.g., Polzer, Milton & Swann, 2002; Jehn, Northcraft & Neale, 1999). The homogeneity-heterogeneity measure captures the compositional effects on group performance. For the categorical variables of board heterogeneity in functional background and educational specialty, this study uses an entropy-based index of heterogeneity (Blau, 1977). It is calculated as follows:
N
iiP
1
2)(1 where iP is the proportion of a group’s individual in the ith category. This index ranges from 0 =
absolute homogeneity to 1 = absolute heterogeneity. Educational specialization, represented by the highest obtained university degree, is divided into five specializations: arts, sciences, engineering, business and economics, and law (Wiersema & Bantel, 1992). This study employs a trichotomous functional background measure of output, throughput, and peripheral functions, in which output functions include marketing and sales; throughput functions include operations, R&D, and engineering; and peripheral functions include law, finance, and accounting (Michel & Hambrick, 1992). The continuous variable of board tenure heterogeneity was measured using the coefficient of variation defined as the standard deviation divided by the mean (Pelled et al., 1999). Board tenure was measured by the length of time each board member had served in the current position. Larger coefficients imply greater heterogeneity. The logarithm of the heterogeneity measure is used to reflect the decreasing rate of the effect of dissimilarity (Wiersema & Bantel, 1992). Information on individual directors’ demographic characteristics was obtained from companies’ proxy statements filed with the Securities Exchange Commission (SEC). Where necessary, the data was cross-validated against demographic information provided by Standard & Poor’s Register of Corporations, Directors, and Executives. Demographic proxies of 3215 directors in total were examined and coded to capture the degree of board heterogeneity.
Page 136
Academy of Strategic Management Journal, Volume 13, Number 1, 2014
Firm risk and firm performance. Firm risk, conceptualized as unpredictability of organizational outcome variables, has been predominately measured as variance in corporate income flows (Internal accounting risk) and variance in firm value (External market risk) (see Ruefli et al., 1999 ; Devers, McNamara, Wiseman & Arrfelt, 2008 for a complete review). Internal accounting risk was calculated as the standard deviation of return on assets for the period from 1999 to 2003 based on yearly data. External market risk, conceptualized as the relative volatility of a given stock versus the market, was measured using beta coefficient (systematic market risk) for 2003. Data on ROA and beta were obtained from Compustat database. The dependent variable of firm performance was captured by the return on invested capital (ROIC: net profit divided by invested capital) for 2003 using data from Standard & Poor’s Compustat.
Control variables. Several control variables were included in the empirical model to isolate the effects of the hypothesized variables on firm performance. Firm size, measured as the logarithm of total annual revenue, was included to control for the potential impact of scale economies on firm performance. Past firm performance was controlled since prior firm performance could influence the firm behavior affecting firm performance (Kahneman & Tversky, 1979), and measured as the average ROA during 1999-2001. Since business diversification involves a substantial resource commitment and typically has a great impact on firm performance, the degree of corporate diversification was controlled. The entropy measure of diversification (Jacquemin & Berry, 1979) was used, in which diversification indices were computed using the line-of-business sales data obtained from Compustat. Because firm performance may vary across industries due to industry-specific situations, both the industry type and industry profitability were controlled. This study included a dummy variable of industry category that corresponds to the two-digit SIC code of the firm, and industry profitability was calculated as the average percentage change in profit during the period for all firms included in the sample. The following variables on board structure are also controlled. Board independence was included since independent board from the CEO is in better socio-political condition for objectively evaluating management proposals. This study employed the independence-interdependence measure (Boeker, 1992), in which independent directors as outside board members who are appointed prior to the current CEO. Board size was used to control the potential impact of board size on firm performance and was measured as the logarithm of the number of directors on the board. Board composition data were available from corporate annual proxy statements. Board equity ownership was included to reflect the impact of equity ownership on firm performance and measured as the percentage of total common equity owned by directors and log transformation was applied to reduce heteroscedasticity in the ownership data. Analytic methods
Hierarchical regression analysis was used to test the moderating effects of firm risk on the relationship between board heterogeneity and firm performance. Control variables included in this
Page 137
Academy of Strategic Management Journal, Volume 13, Number 1, 2014
study were entered in the first hierarchical step. After entering the control variables, the independent variables of board heterogeneity in tenure, functional background, and educational specialization were entered. The two-way interaction terms were then entered in the final regression model. Coefficient and incremental variances explained by the two-way interaction terms were tested for significance (Cohen, Cohen, West & Aiken, 2003).
RESULTS
Table 1 presents the mean, standard deviation, and correlation for the variables used in the analysis. Sample firms have, on average, 10.3 directors on their boards and about 47 percent of the directors are independent from the CEO based on the measure employed in this study. Correlation matrix shows that board heterogeneity in demographic backgrounds is not significantly correlated with firm performance. Variance of returns is negatively correlated with firm performance (p<0.01). In the regression analysis, checks for possible violations of normality assumptions in the data revealed skewness in the distribution of data; therefore, log transformation was applied on the variables of board equity ownership and corporate diversification. Studentized residuals and Cook’s D values were examined to check for outliers. However, no reason was found to remove any cases from the sample. Multicollinearity was not a significant problem in the regression analyses since all of the variance inflation factors within the regression models were below ten (Cohen et al., 2003). The results of the hierarchical regression analyses are presented in Table 2 and 3. Hypothesis 1a predicted a negative moderating effect of firm risk in the relationship between board functional heterogeneity and firm performance. The results of the analyses provide evidence that board functional heterogeneity is negatively related with firm performance when the firm’s contextual circumstance is characterized by higher firm risk. The results were indicated by the significant R-square change and significant regression coefficient of the interaction terms for both internal accounting risk (β= -3.23; p<0.01; ∆R2= 0.02; Interaction model 1, Table 2) and external market risk (β= -21.36; p<0.01; ∆R2= 0.04; Interaction model 1, Table 3). Thus, hypothesis 1a received strong support.
Page 138
Academy of Strategic Management Journal, Volume 13, Number 1, 2014
Table 1Descriptive statistics and correlation coefficients
Hypotheses 1b focuses on the moderating effect of firm risk in the relationship
between board educational heterogeneity and firm performance. The results also support Hypothesis 1b which suggested a negative moderating impact of firm risk in the relationship between board heterogeneity in educational specialty and firm performance. The results indicate
Page 139
Academy of Strategic Management Journal, Volume 13, Number 1, 2014
a significant negative effect of internal accounting risk (β= -2.38; p<0.05; ∆R2= 0.02; Interaction model 2, Table 2) and external market risk (β= -16.35; p<0.01; ∆R2= 0.03; Interaction model 2, Table 3) in the relationship between board educational heterogeneity and firm performance. The findings suggest that heterogeneity in board members’ educational specialty has a negative impact on firm performance as the firm risk increases.
Table 2
Moderating effect of internal accounting risk in the relationship between board heterogeneity and firm performance
Hypothesis 1c suggested a negative moderating impact of firm risk in the relationship
between board tenure heterogeneity and firm performance. However, there was no significant moderating effect of firm risk for both internal accounting risk and external market risk on the relationship between board tenure heterogeneity and firm performance. The results of testing
Page 140
Academy of Strategic Management Journal, Volume 13, Number 1, 2014
hypothesis 1c show that firm risk has little moderating effect in the relationship between board tenure heterogeneity and firm performance. The results imply that board heterogeneity in organizational tenure has little impact on the board’s internal group dynamics and firm performance in the context of higher firm risk. The control variables of past firm performance and industry profitability had a positive effect on firm performance (p<0.05). Other control variables did not have a significant impact on firm performance.
Table 3
Moderating effect of external market risk in the relationship between board heterogeneity and firm performance
Academy of Strategic Management Journal, Volume 13, Number 1, 2014
DISCUSSIONS AND FUTURE RESEARCH
Despite the growing recognition of the importance of board composition, there has been no clear consensus about the impact of board heterogeneity on firm performance. To reduce the ambiguity associated with board heterogeneity, this study empirically examined the performance implications of board heterogeneity by focusing on a managerial context of firm risk in which a firm’s adaptive capability to volatile managerial environment matters substantially for firm performance. The results of this study suggest that the performance implications of board heterogeneity may be contingent upon the strategic/managerial context of the firm.
Empirical examination of 295 Fortune 1000 firms provides evidence that heterogeneity in board membership in terms of functional background and educational specialty is negatively associated with firm performance when the firm’s managerial context is characterized by higher firm risk. Board cognitive heterogeneity, although beneficial with regard to informational variety in a board, has dysfunctional consequences for firm performance in firms with higher firm risk—less stable managerial environment inside and outside of the organization. In other words, the costs of internal process inefficiencies associated with board heterogeneity can exceed the benefits of informational diversity when the firm's strategic context emphasizes efficiency in firm adaptation.
The mechanism for the internal process inefficiency would be that board members in different demographic groups tend to be less attracted to each other, reducing interpersonal interactions and hampering efficient communication. This group condition causes the board to be less cohesive and integrative in their interactions, thus reducing board efficiency in utilizing the human and social capital of the board as well as its level of collaboration. The process losses with the board could also negatively affect the collaborations between the CEO and the board, often delaying strategic initiatives proposed by management. These group dynamics potentially inhibit information exchange among the directors and decrease efficiency in information processing at the corporate top, thus negatively affecting the successful formulation and execution of the firm strategies involved in environmental adaptation. Thus, the results imply that the role of board heterogeneity is contingent on the task environment of the firm; dysfunctional consequences of board heterogeneity can be more salient when the firm’s strategic context requires process efficiency at the apex of the corporation.
As the earlier literature review showed, existing theories on group demographics provides inconclusive and somewhat conflicting suggestions regarding the implications of board heterogeneity for firm performance. This is because while cognitive heterogeneity can have beneficial implications for performance, it can also have dysfunctional consequences in terms of process inefficiency. Jackson and Joshi (2002: pp. 218) state that “as a consequence of the great variation in effects found across studies, researchers cannot be certain that they understand phenomena well enough to justify making prescriptive statements about how to effectively manage diversity.” Board heterogeneity is no exception in this regard. The study argues that the performance consequences of board heterogeneity can be better understood when the firm's
Page 142
Academy of Strategic Management Journal, Volume 13, Number 1, 2014
managerial context is taken into consideration because the demands for informational variety versus efficiency in group processes may vary depending on the environmental contexts. For example, board heterogeneity in occupational background (which arguably is a proxy for heterogeneity in directors’ experiences in different functional areas) would be beneficial for firms in a stable, but complex managerial environment because heterogeneity in knowledge structures increases the breadth of information and knowledge utilized in a board. However, the task environment of higher firm risk requires a higher level of process efficiency in the board's information processing and interaction with the CEO. Subsequently, the negative performance consequences of board heterogeneity are more pronounced in the case of higher firm risk. Therefore, it should be argued that performance implication of board heterogeneity is not unilateral, rather a contingency concept that should consider the strategic environment of the firm.
The results of this study have some important practical implications as well. Governance practitioners, especially in profit pursuing organizations, tend to believe that board heterogeneity brings confusion, uncertainty, and discomfort (Bryson, 2004). In recent years, corporations have tended to pursue board demographic diversity (e.g., gender, ethnicity, occupations) on the assumption that diversity is good in all contexts. However, exhortations to increase board heterogeneity have been made without paying attention to the firm context. A clearer understanding of the processes through which heterogeneity contributes to firm performance can clearly help in decisions about the composition of boards of directors. As the results show, board heterogeneity must fit the firms’ managerial/strategic context. Given the fact that boards of directors are the ultimate decision-makers of corporations, the process losses derived from heterogeneous board composition could have significant negative impacts on firm performance when the corporation's strategic environment requires efficient firm adaptation. Thus, practicing managers need to fully assess the tradeoffs of board heterogeneity in conjunction with managerial context of their firms.
While interpreting the results, it is important to bear in mind some of its limitations. Previous research focusing on the moderating effect of time in the group heterogeneity-performance relationship has suggested that as group members undergo interactions and shared experiences, demographic distinctions blur and dysfunctional effects of dissimilarity are neutralized (e.g., Harrison, Price, Gavin & Florey, 2002). Therefore, future research focusing on group developmental processes that occur over time would extend the knowledge about whether board heterogeneity has a constant or tenure-variant impact on board effectiveness. Second, as globalization gathers momentum, the boards of many large corporations now have members from different nationalities and ethnic groups. There is a greater need to study the impact of national culture on individual group member’s cognition as well as its impact on board processes and outcomes. Although the current research focuses on task-related demographic attributes such as functional experience, educational specialty, and organizational tenure, future research on board heterogeneity can benefit by paying greater attention to cultural heterogeneity in board composition. Finally, the current study is restricted to only one managerial context of firm risk.
Page 143
Academy of Strategic Management Journal, Volume 13, Number 1, 2014
Future research focusing on other strategic decision contexts such as corporate diversification posture should extend the understanding of the context specificity of the relationship between board heterogeneity and firm performance.
REFERENCES
Blau, P.M. (1977). Inequality and heterogeneity: A primitive theory of social structure. New York, NY: Free Press. Boeker, W. (1992). Power and managerial dismissal: Scapegoating at the top. Administrative Science Quarterly, 37(3):
400-421. Bromiley, P. (1991). Testing a causal model of corporate risk taking and performance. Academy of Management
Journal, 34(1): 37-59. Bryson, E. (2004). Building board diversity. Foundation News & Commentary, Nov/Dec: 44-45. Cannella Jr., A.A., J-H. Park & H-U. Lee. (2008). Top management team functional background diversity and firm
performance: Examining the roles of team member colocation and environmental uncertainty. Academy of Management Journal, 51(4): 768-784.
Chatman, J.A., J.T. Polzer, S.G. Barsade & M.A. Neale. (1998). Being different yet feeling similar: The influence of demographic composition and organizational culture on work processes and outcomes. Administrative Science Quarterly, 43(4): 749-780.
Cohen, J., P. Cohen, S. West & L. Aiken. (2003). Applied multiple regression/correlation analysis for the behavioral sciences 3rd edition. Mahwah, NJ: Lawrence Erlbaum.
Deutsch, Y., T. Keil & T. Laamanen. (2007). Decision making in acquisitions: The effect of outside directors' compensation on acquisition patterns. Journal of Management, 33(1): 30-56.
Devers, C.E., G. McNamara, R.M. Wiseman & M. Arrfelt. (2008). Moving closer to the action: Examining compensation design effects on firm risk. Organization Science, 19(4): 548-566.
Finkelstein, S. & D. Hambrick. (1996). Strategic leadership: Top executives and their effects on organizations. Minneapolis/St.Paul, MN: West.
Gómez-Mejía, L.R., K.T. Haynes, M. Núñez-Nickel, K.J.L. Jacobson & J. Moyano-Fuentes. (2007). Socioemotional wealth and business risks in family-controlled firms: Evidence from Spanish Olive Oil Mills. Administrative Science Quarterly, 52(1): 106-137.
Greve, H.R. (2003). A behavioral theory of R&D expenditures and innovations: Evidence from shipbuilding. Academy of Management Journal, 46(6): 685-702.
Gupta, A.K. & V. Govindarajan. (1984). Business unit strategy, managerial characteristics, and business unit effectiveness at strategy implementation. Academy of Management Journal, 27(1): 25-41.
Harrison, D.A., K.H. Price, J.H. Gavin & A.T. Florey. (2002). Time, teams, and task performance changing effects of surface and deep-level diversity on group functioning. Academy of Management Journal, 45(5): 1029-1045.
Haynes, K.T. & A. Hillman. (2010). The effect of board capital and CEO power on strategic change. Strategic Management Journal, 31(11): 1145-1163.
Hillman, A.J. & T.H. Dalziel. (2003). Boards of directors and firm performance: Integrating agency and resource dependence perspectives. Academy of Management Review, 28(3): 383-396.
Jackson, S.E. & A. Joshi. (2002). Research on domestic and international diversity in organizations: A merger that work? In N. Anderson, D.S. Ones, H.K. Sinangil & C. Viswesvavan (Eds.) Handbook of Industrial, Work & Organizational Psychology(pp. 206-231). Thousand Oaks, CA: Sage.
Page 144
Academy of Strategic Management Journal, Volume 13, Number 1, 2014
Jackson, S.E., May, K.E. & Whitney, K. (1995). Understanding the dynamics of diversity in decision making teams. In Guzzo, R.A. & Salas, E.(Eds.), Team effectiveness and decision-making in organizations(pp. 204-261). San Francisco, CA: Jossey-Bass.
Jacquemin, A.P. & C.H. Berry. (1979). Entropy measure of diversification and corporate growth. Journal of Industrial Economics, 27(4): 359-369.
Jehn, K. (1995). A multimethod examination of the benefits and detriments of intragroup conflict. Administrative Science Quarterly, 40(2): 256-282.
Jehn, K., C. Chadwick & S. Thatcher. (1997). To agree or not to agree: Diversity, conflict, and group outcomes. International Journal of Conflict Management, 8: 287-306.
Jehn, K.A., G.B. Northcraft & M.A. Neale. (1999). Why differences make a difference: A field study of diversity, conflict, and performance in workgroups. Administrative Science Quarterly, 44(4): 741-763.
Kahneman, D. & A. Tversky. (1979). Prospect theory: An analysis of decision under risk. Econometrica, 47(2): 263-291.
Kosnik, R.D. (1990). Effects of board demography and directors’ incentives on corporate greenmail decisions. Academy of Management Journal, 33(1): 129-150.
Li, J. & D.C. Hambrick. (2005). Factional groups: A new vantage on demographic faultlines, conflict, and disintegration in work teams. Academy of Management Journal, 48(5): 794-813.
Mannix, E. & M.A. Neale. (2005). What differences make a difference? The promise and reality of diverse teams in organizations. Psychological Science in the Public Interest, 6: 31-55.
Michel, J.G. & D.C. Hambrick. (1992). Diversification posture and top management team characteristics. Academy of Management Journal, 35(1): 9-37.
Miles, R.E. & C.C. Snow. (1978). Organizational strategy, structure, and process. New York, NY: McGraw Hill. Milliken, F.J. & L.L. Martins. (1996). Searching for common threads: Understanding the multiple effects of diversity
in organizational groups. Academy of Management Review, 21(2): 402-433. Palmer, T.B. & R.M. Wiseman. (1999). Decoupling risk taking from income stream uncertainty: A holistic model of
risk. Strategic Management Journal, 20(11): 1037-1062. Pelled, L.H., K.M. Eisenhardt & K.R. Xin. (1999). Exploring the black box: An analysis of work group diversity,
conflict, and performance. Administrative Science Quarterly, 44(1): 1-28. Polzer, J.T., L.P. Milton & W.B. Swann. (2002). Capitalizing on diversity: Interpersonal congruence in small work
groups. Administrative Science Quarterly, 47(2): 296-324. Priem, R.L., D.A. Harrison & N.K. Muir. (1995). Structured conflict and consensus outcomes in group decision
making. Journal of Management, 21(4): 691-710. Richard, O.C., T. Barnett, S. Dwyer & K. Chadwick. (2004). Cultural diversity in management, firm performance,
and the moderating role of entrepreneurial orientation dimensions. Academy of Management Journal, 47(2): 255-266.
Robinson, G. & K. Dechant. (1997). Building a business case for diversity. Academy of Management Executive, 11(3): 21-31.
Sanders, W.M. & D.C. Hambrick. (2007). Swinging for the fences: The effects of CEO stock options on company risk taking and performance. Academy of Management Journal, 50(5): 1055-1078.
Smith, K.G., K.A. Smith, J.D. Olian, H.P. Sims, D.P. O’Bannon & J.A. Scully. (1994). Top management team demography and process: The role of social integration and communication. Administrative Science Quarterly, 39(3): 412-438.
Tsui, A.S. & C.A. O’Reilly. (1989). Beyond simple demographic effects: The importance of relational demography in superior-subordinate dyads. Academy of Management Journal, 32(2): 402-423.
Page 145
Academy of Strategic Management Journal, Volume 13, Number 1, 2014
Tuggle, C.S., K. Schnatterly & R.A. Johnson. (2010). Attention patterns in the boardroom: How board composition and processes affect discussion of entrepreneurial issues. Academy of Management Journal, 53(3): 550-571.
Walt, N. & C. Ingley. (2003). Board dynamics and the influence of professional background, gender and ethnic diversity of directors. Corporate Governance: An International Review, 11(3): 218-234.
Watson, W.E., K. Kumar & L.K. Michaelson. (1993). Cultural diversity’s impact on interaction process and performance: Comparing homogeneous and diverse task groups. Academy of Management Journal, 36(3): 590-602.
Westphal, J.D. & E.J. Zajac. (1995). Who shall govern? CEO/board power, demographic similarity, and new director selection. Administrative Science Quarterly, 40(1): 60-83.
Wiersema, M.F. & K. A. Bantel. (1992). Top management team demography and corporate strategic change. Academy of Management Journal, 35(1): 91-121.