11
ACCBO 2013 SURVEY (n=501) ERIC MARTIN, MAC, CADC III, CRM, CPS MICHAEL RAZAVI, MPH, CADC I, CRM, CPS VANNA BURNHAM, B.S.

ACCBO 2013 SURVEY (n=501)
ERIC MARTIN, MAC, CADC III, CRM, CPSMICHAEL RAZAVI, MPH, CADC I, CRM, CPS
VANNA BURNHAM, B.S.
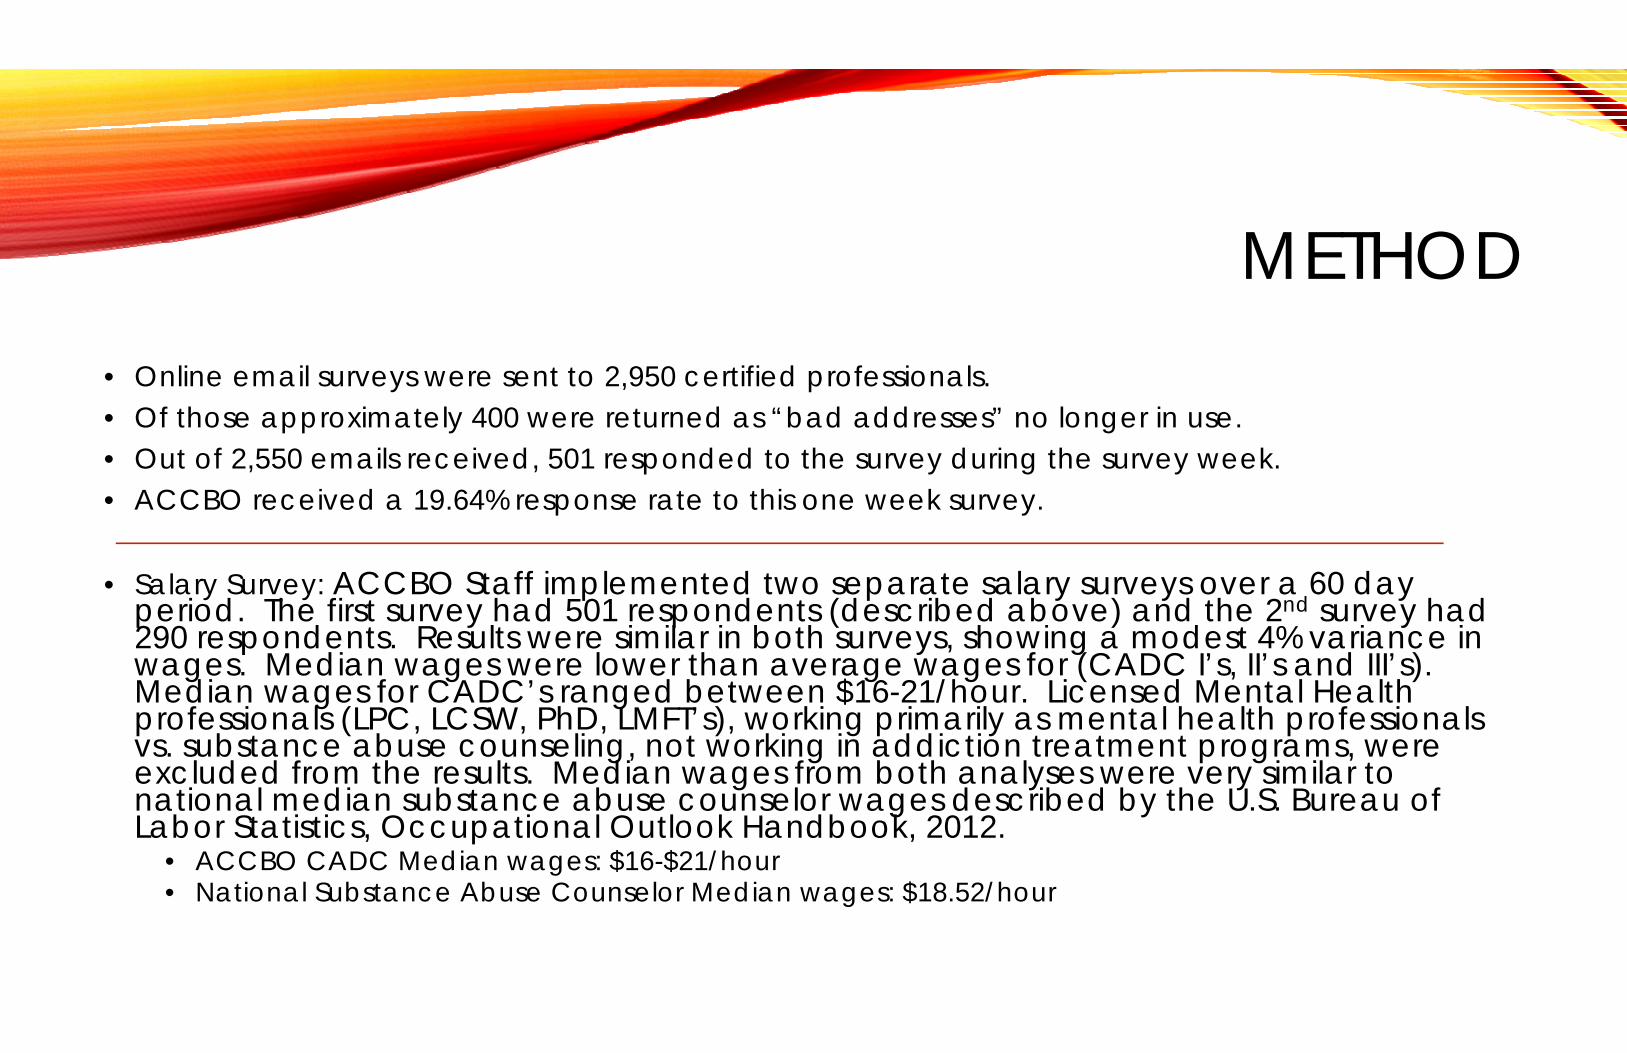
METHOD• Online email surveys were sent to 2,950 certified professionals.• Of those approximately 400 were returned as “bad addresses” no longer in use.• Out of 2,550 emails received, 501 responded to the survey during the survey week.• ACCBO received a 19.64% response rate to this one week survey.
• Salary Survey: ACCBO Staff implemented two separate salary surveys over a 60 day period. The first survey had 501 respondents (described above) and the 2nd survey had 290 respondents. Results were similar in both surveys, showing a modest 4% variance in wages. Median wages were lower than average wages for (CADC I’s, II’s and III’s). Median wages for CADC’s ranged between $16-21/hour. Licensed Mental Health professionals (LPC, LCSW, PhD, LMFT’s), working primarily as mental health professionals vs. substance abuse counseling, not working in addiction treatment programs, were excluded from the results. Median wages from both analyses were very similar to national median substance abuse counselor wages described by the U.S. Bureau of Labor Statistics, Occupational Outlook Handbook, 2012.
• ACCBO CADC Median wages: $16-$21/hour• National Substance Abuse Counselor Median wages: $18.52/hour

DISTRIBUTION OF CREDENTIALSWITHIN THE SURVEY GROUP OF 501 RESPONDENTS
CADC I…….. 50.5%CADC II……. 28.1%CADC III…….12.6%CRM…………6.0%CPS…………. 6.0%CGAC I……. 1.4%CGAC II……. 2.4%CGRM……… 0.2%
(Some individuals have morethan one certification)

AVERAGE HOURLY WAGES
13.6616.57
19.49
25.07 24.2
0
5
10
15
20
25
30
CRM CADC I CADC II CADC III CPS
Average Hourly Wages
This is not a scientific survey. ACCBO Staff implemented two separate salary surveys over a 60 day period. The first survey had 501 respondents (described above) and the 2nd survey had 290 respondents. Results were similar in both surveys, showing a modest 4% variance in wages. Median wages were lower than average wages for (CADC I’s, II’s and III’s). Median wages for CADC’s ranged between $16-21/hour. Licensed Mental Health professionals (LPC, LCSW, PhD, LMFT’s), working primarily as mental health professionals vs. substance abuse counseling, not working in addiction treatment programs, were excluded from the results. Median wages from both analyses were very similar to national median substance abuse counselor wages described by the U.S. Bureau of Labor Statistics, Occupational Outlook Handbook, 2012.
Median wages for CADC’s ranged between $16-$21/hour,consistent with national median wages.

U.S. BUREAU OF LABOR STATISTICSOCCUPATIONAL OUTLOOK HANDBOOK
2012

YEARS IN THE FIELD
less than 1 year…………. 10.4%1 year…………………….. 7.8%2 years……………………. 9.7%3 years……………………. 8.0%4 years……………………. 6.3%5 years…………………..... 6.6%6 years……………………. 5.1%7 years……………………. 4.0%8 years……………………. 3.4%9 years……………………. 2.5%10 or more years……….. 36.2%

LEVEL OF EDUCATION• CADC I: 68% possess a
baccalaureate or greater degree
• CADC II: 80% possess a baccalaureate or greater degree
• CADC III: 100% possess a masters or greater degree
Approximately 1/3rd of CADC’s possess less than a baccalaureate degree or possess a degree that is state licensed but not regionally accredited. (e.g.; Process Work Institute, BreiningInstitute, various Christian/Bible colleges, etc.)
5% of certified professionals possess a licensed degree that is not regionally accredited (Process Work Institute, Breining Institute, foreign university, Bible/Christian College, etc.)

HOURS & BENEFITS• Certified
professionals work an average of 29.6 hours/week.
• 64.9% have employer offered health insurance, some of whom contribute to their health insurance plan

GENDER
• 65.7% of certified professionals are female
• 34.3% are male
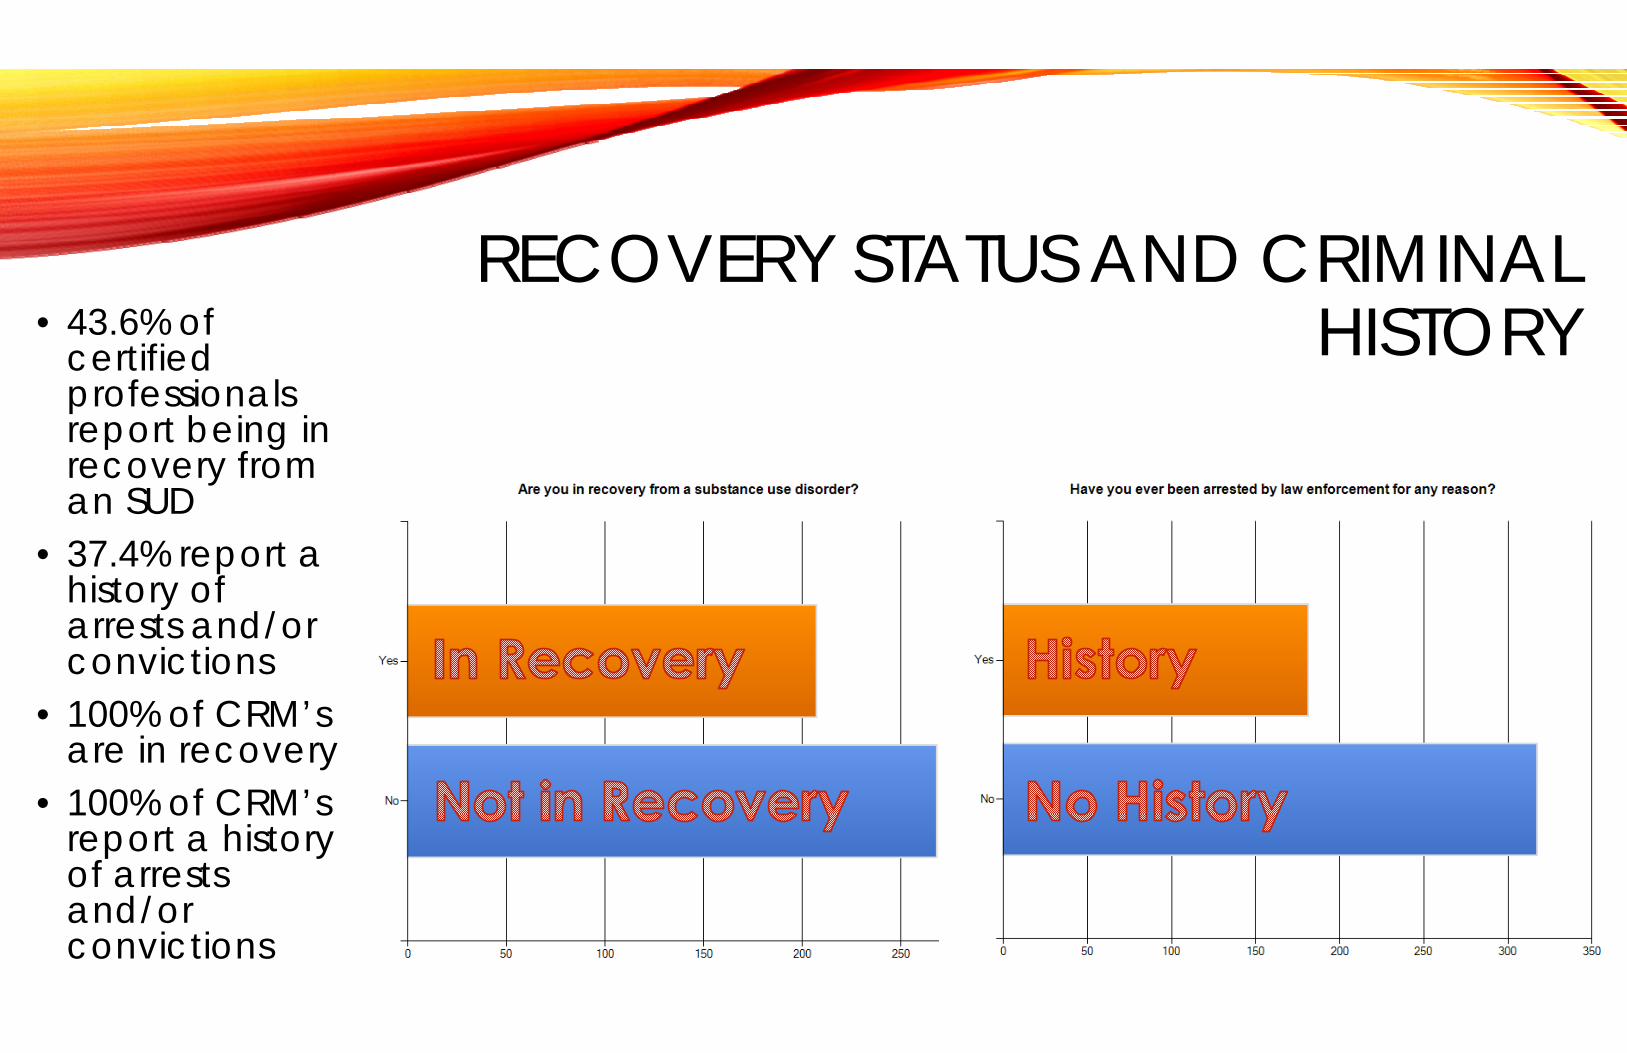
RECOVERY STATUS AND CRIMINAL HISTORY• 43.6% of
certified professionals report being in recovery from an SUD
• 37.4% report a history of arrests and/or convictions
• 100% of CRM’s are in recovery
• 100% of CRM’s report a history of arrests and/or convictions

ETHNICITY• Hispanic/Latino Certified
addiction professionals are the most under-represented ethnic group.
Certified Professionals Oregon’s 2011 Tx Population(TEDS: Oregon 2011)
83.8% Caucasian 78% Caucasian
4.6% Af. American 4.0% Af. American
2.4% Asian/Pac Island 1.5% Asian/Pac Island
5.2% Hispanic/Latino 9.0% Hispanic/Latino
7.2% Native American 5.4% Native American


![18-4masglp.olemiss.edu/Water Log PDF/18-4.pdfcob-qoza_T ZApg1J cg1crqgg1JB cps cps aorupgw glgccgq co nag g rg4 cps cps g aorupgw co pgbgug]lxgq upla ÀggL' cps cowbg1JÀ pgcaug cps](https://static.documents.pub/doc/80x56/5e2f59f63318b957b5481e92/18-log-pdf18-4pdf-cob-qozat-zapg1j-cg1crqgg1jb-cps-cps-aorupgw-glgccgq-co-nag.jpg)


