. INTRODUCTIONtimulated Brillouin scattering (SBS) is one of the mostrominent nonlinear effects in optical fibers because of itsow excitation threshold with a narrowband pump. Therillouin scattered light arises from the scattering of aump wave off the copropagating acoustic wave in theedium. Using continuous wave (CW) excitation, a fewilliwatts of pump power is sufficient to excite SBS, lead-
ng to a counterpropagating Stokes wave. Due to its fun-amental interest [1–5] as well as its practical implica-ions [6], this three wave interaction—optical pump,tokes, and acoustic waves—has been investigated inreat depth. Although SBS can be a negative or detrimen-al effect for the transmission of optical signals throughbers [7–9], it nevertheless is of special interest for fun-amental studies of light–matter interaction and alsoorms the basis for very useful applications such as nar-owband lasers [10,11], optical modulation, and, as dis-overed relatively recently, slow light [12–15] in opticalelay lines, which has been reviewed by Boyd andauthier [16].The latter application has been made possible by the
ecent discovery of the SBS-induced slowing down of op-ical signals in fibers. As with other resonant interactionsBS exhibits dispersion within the bandwidth of the reso-ance [16]. In the low-gain limit the group index (in thepectral region of the SBS resonance) increases withump power (or equivalently with gain), causing a slow-ng down of the Stokes wave (slow light). As demonstratedn [12–14] the group velocity of a signal pulse propagatingn a fiber SBS amplifier can be delayed by several nano-econds, depending on gain, fiber type, and length. How-ver, in the studies cited above, slow light has beenchieved in the low-gain limit in an amplifier configura-ion. Various authors have noted that, as the gain in-reases, the slow-light effect saturates and pulse advance-
ent rather than pulse slowing down occurs. However,one have investigated in detail the evolution of this ef-ect in the high-gain regime of a Brillouin laser, and inarticular the effect of pump depletion on dispersion.In the present paper we report a numerical and experi-ental study of the effect of pump depletion on the propa-
ation characteristics of Stokes pulses and on their spec-rum in a Brillouin fiber laser. In this laser the Stokesulses are generated from the spontaneously (Brillouin)cattered light and evolve into a coherent emission whenhe pump power exceeds the SBS threshold [4]. Simula-ion and experimental results show that, in the limit ofigh-gain above the SBS threshold, Stokes pulses arere)accelerated and that, as a consequence, the resonantavity modes shift towards higher frequencies. In the fol-owing, we first briefly review the theory of slow light as its applicable in a low-gain medium such as a Brillouinmplifier [12–14]. We then present experimental resultsn the high-gain limit of a Brillouin laser. Finally, we out-ine our numerical model, present the simulation results,nd compare them with the experimental ones.
. NORMAL DISPERSION ASSOCIATEDITH A BRILLOUIN RESONANCEND SLOW LIGHThen the external feedback from Fresnel reflections at
he fiber ends is included in the SBS dynamics the fiberorms a laser cavity and, if the pump intensity is above aertain threshold, the Brillouin scattered light evolvesnto coherent laserlike radiation [10,17,18]. The spectrumf this Brillouin laser exhibits modes at regular frequencyntervals equal to the cavity free spectral range (FSR)10,11]. The SBS process can be described by one-imensional coupled wave equations. Using the slowlyarying amplitude approximation in the small gain (un-
008 Optical Society of America
dc
w−sic
wi
wstspcgotglnt
rgF
wPErgpBtict(sfis
3Ta
atscbsoStotoesaeTis(tti2p
eitfitwic2tfis
pmpcptft5c5
F5T5
1594 J. Opt. Soc. Am. B/Vol. 25, No. 10 /October 2008 R. K. Pattnaik and J. Toulouse
epleted pump) limit, the effective refractive index, in-luding the nonlinear contribution, is given by [14]
neff = n��� + gc
�
��
�BIL, �1�
here n��� is the normal refractive index; ��=�− ��L�B� is the detuning with �B=qVB, VB being the acousticpeed; IL is the pump intensity (assumed undepleted); �Bs the damping of the acoustic wave; and the Brillouinoefficient is given by [6]
g = gB
��B/2�2
��B/2�2 + ����2 , �2�
here gB is the line-center Brillouin gain. The groupndex, defined by ng=neff+�dneff /d� is given by [14]
ng = ng0��� +gBcIL�B
4
��B/2�2 − ����2
���B/2�2 + ����2�2 � ng0��� +gBcIL
�B,
�3�
here ng0���=n���+�dn /d�, is the group index in the ab-ence of SBS coupling. From Eqs. (1) and (3) it is evidenthat the effective refractive index exhibits normal disper-ion. For ����B the group index increases with theump intensity, IL, and the group velocity, vg=c /ng, de-reases accordingly, leading to slow light. The change inroup index due to SBS has been estimated [13,14] to bef the order of 10−3. However, this estimate is only valid inhe small gain limit, i.e., when pump depletion is ne-lected. In the high-gain limit, pump depletion can noonger be neglected and the dispersion is modified in aew and interesting way, leading to a reacceleration ofhe Stokes wave.
This modified dispersion at high Brillouin gain iseadily observed in the spectrum of a Brillouin laser. Theroup velocity (or group index), which determines theSR [19,20] of the laser cavity, is given by
�� =c
2ngL=
vg
2L, �4�
here ng is the group index, L is the length of the Fabry–érot fiber cavity, and vg is the group velocity. Fromq. (4), it is clear that the FSR will increase or decrease inesponse to changes in group velocity with pump power orain. In this paper we first investigate experimentally theump power dependence of the lasing modes in arillouin fiber laser and then provide a model to explain
he observation. Thus, the object of this study is to exam-ne the propagation of a Stokes wave in a Brillouin laseronfiguration, i.e., in the presence of pump depletion, ando discuss the ensuing effects on the spectrum of theBrillouin) laser. We first present the experimental re-ults, then describe the numerical simulation model, andnally discuss the experimental results in light of theimulation results.
. EXPERIMENT AND RESULTShe experimental setup is shown in Fig. 1. The output ofn external cavity laser (ECL) at 1550 nm was amplified
nd butt-coupled into a 500 m long fiber that had an at-enuation of about 0.5 dB/km. Care was taken to leave amall but nonzero gap between the test fiber and the cir-ulator in order to form a cavity. Both ends of the test fi-er were flat cleaved to form the laser resonator. As ishown later, when the pump power exceeded the thresh-ld the SBS emission evolved into a coherent train oftokes pulses. This emission, propagating (backward)hrough the circulator, was first recorded on a digitizingscilloscope to measure the transit time of the pulseshrough the fiber resonant cavity. Due to the narrownessf the FSR (about 200 kHz) of the fiber resonator, a het-rodyne technique was used to record the spectrum withufficient resolution. The modes were first shifted down tolower frequency by injecting the backscattered Stokes
mission into a 55 MHz acousto-optic modulator (AOM).he first-order output from the AOM was then mixed with
ts unshifted (zeroth-order) output and the resulting beatignal was recorded on a rf electrical spectrum analyzerESA). This technique enabled displaying the beat spec-rum with the central lasing mode at 55 MHz. Thehreshold pump power for lasing, determined by monitor-ng the spectrum of the reflected light, was found to be3 dBm. The measurements reported here are mostly forump powers above this threshold.In Fig. 2 we present the time-domain traces of the laser
mission recorded on a digitizing oscilloscope. The outputs seen to consist of periodic pulses, characteristic of theransmission through a Fabry–Pérot cavity (here the SBSber laser cavity). The significant point to note in theseime-domain traces is the decreasing Stokes pulse periodith pump power. In Fig. 2(a) the period is 4.74 �s for an
nput pump power of 23.2 dBm ��209 mW�, but it de-reases to 4.6 �s [Fig. 2(b)] as the pump power is raised to4 dBm ��251 mW�. According to Eq. (4) this correspondso a 3% decrease in the group velocity of the Stokes pulseor an increase of 0.8 dB or 17% in pump power. Also vis-ble in both traces, the leading edge rises slightly moreharply or faster than the trailing edge.
The dependence of the Stokes pulse period on pumpower implies that the frequency of the lasing (or cavity)odes or the associated FSR also depends on pump
ower. This can be seen experimentally by displaying theavity modes on the ESA and is shown in Fig. 3(a) for twoump powers. The spectrum consists of many orders, buthe figure includes modes only up to the third harmonicor clarity. Due to the choice of heterodyning frequencyhe fundamental mode (with mode index m0) appears at5 MHz and the other higher-order modes are symmetri-ally spaced on either side, according to the FSR of the00 m long fiber cavity.
ig. 1. Schematic of the experimental setup. The test fiber was00 m long and was butt-coupled to the output of the circulator.he AOM was used to shift the frequencies of the modes by5 MHz.
FftspdAhsmwh2pclM
mwtesw=sh
lRaptfiosl
wiss�tfiuatitcd
ccl
Fi
Fh(w
R. K. Pattnaik and J. Toulouse Vol. 25, No. 10 /October 2008 /J. Opt. Soc. Am. B 1595
Figure 3(a) clearly shows the mode separation or theSR increasing with pump power. It is about 212.5 kHz
or an input power of 23.8 dBm (solid curve) and increaseso 217 kHz for 24.8 dBm (dotted curve), which corre-ponds to a shift of nearly 2.4% for a 1 dB increase inump power. The shift of each mode (relative to the fun-amental mode) is also found to increase with its order.s seen more clearly in Fig. 3(b), the shift of the thirdarmonic is about 5.7 kHz whereas the second harmonichifts by about about 3.2 kHz. The inset in Fig. 3(b) sum-arizes the frequency shifts of the first three harmonicsith increasing pump power. (In this inset each harmonicas been normalized to its corresponding value at00 mW.) This increase of the FSR indicates that theulse propagation or group velocity is accelerated with in-reasing pump power in the lasing regime of SBS. A simi-ar observation has been reported by Dämmig and
itschke [20] with fibers with different reflectivities.In Fig. 4, we display similar measurements, this timeade on two photonic crystal fibers (PCF). The first oneas made on 500 m of an RB61 fiber [Optical Fiber Solu-
ions (OFS), Murray Hill, New Jersey, US] with param-ters: dc=8 �m, dH=1.85 �m, and pitch �=4.9 �m. Theecond one was made on 500 m of an RB65 (OFS) fiberith parameters: dc=3.55 �m, dH=1.15 �m, and pitch �2.35 �m. The RB61 fiber had a large core, nearly theame as that of a single-mode fiber (SMF), whereas RB65ad a much smaller core. The RB65 fiber also had a much
ig. 2. Oscilloscope traces of Stokes pulses at the output end anput power. The period in (a) is 4.74 �s while in (b) it is 4.6 �s.
ig. 3. (a) Spectrum of the lasing modes (to the third harmonarmonic (labeled by the integer m0) is at 55 MHz. Note that the
b) Expanded view of the second and third harmonics for two pumith the order of the harmonic mode. Inset: increase of frequenc
arger attenuation (about 20 dB/km at 1550 nm) than theB61 fiber (about 2 dB/km). Nonetheless, even with highttenuation, SBS and the cavity modes were observed forump powers exceeding the SBS threshold. Because ofheir high intrinsic losses the measurements on these twobers were made without an AOM but taking advantagef the fact that the Stokes signal heterodyned with amall backreflected fraction of the incident light, still al-owing detection using the ESA.
In Fig. 4 the intensity of the modes is seen to decreaseith increasing order, and their frequency separation to
ncrease with increasing pump power. The shifts of theecond harmonics are displayed more clearly in the in-ets. For nearly the same increase in pump power�1 dB�, the shift is found to be significantly greater forhe smaller core RB65 fiber than for the larger core RB61ber (12 versus 5.6 kHz). This difference can be attrib-ted to the combination of a smaller effective group indexnd a shorter effective length due to the higher attenua-ion in RB65. Recent simulations of these two fibers havendeed shown that the optical mode becomes more sensi-ive to the fiber structure, and in particular to the holeyladding, as the core diameter or equivalently d /�ecreases [21].The results presented above for three different fibers
learly illustrate the dependence of the frequency of theavity modes or FSR on pump power in a Brillouin fiberaser. From Eq. (4) we see that the only parameter that is
ction of time. (a) is the result of 23.2 dBm and (b) of 24 dBm oferiod decreases by about 0.1 �s as the input power is increased.
500 m long fiber Brillouin laser. The fundamental or the firstnics shift to higher frequencies as the pump power is increased.rs. As the pump power is increased, the frequency shift increasesercent) of the three harmonics with pump power.
s a funThe p
ic) in aharmo
p powey (in p
slfihfitwcagloptwtppg
4Wcne�wasc
wts
tdncrtpico[wi
wgatawhSdtto
Fh
1596 J. Opt. Soc. Am. B/Vol. 25, No. 10 /October 2008 R. K. Pattnaik and J. Toulouse
usceptible to change with pump power is the group ve-ocity (there is no conceivable reason for the length of theber to decrease). We can therefore conclude that, in theigh-gain regime of a Brillouin laser, this upward shift in
requency of the cavity modes, or of the FSR, is due to anncrease in group velocity with pump power, in contrast tohe results obtained in the undepleted pump regime inhich the group velocity was found to decrease with in-
reasing pump power. Two previous authors, Dämmig etl. [22] and Picholle et al. [23], did notice the increase inroup velocity with gain but did not elaborate on it. In aater communication Dämmig and Mitschke [20] reportedbservations similar to ours. They used an analytic ap-roach (in Brillouin amplifier configuration) to show thathe propagation velocity increases with pump power. Heree use a numerical approach to study the three wave in-
eraction in a resonator configuration. Moreover, our ap-roach provides insight into the evolution of the Stokesulse with time and space along with the variation of theroup index in the pump depletion regime.
. THEORYe consider a fiber of length L in which a pump beam
ounterpropagates relative to the Stokes beam. The dy-amics can be described by one-dimensional coupled wavequations [14,17,24,25] involving a backward pump wave1/2��EL�z , t�exp�−i��Lt+kLz��+c.c.�, a forward Stokesave �1/2��ES�z , t�exp�−i��t−kz��+c.c.� and a backwardcoustic wave �1/2���z , t�exp�−i��t+qz��+c.c.�. Using thelowly varying amplitude approximation, the threeoupled wave equations can be written as [4,6,14]
−�EL
�z+
ng0
c
�EL
�t+
2EL = i
�L�e
4cn0ES, �5�
�ES
�z+
ng0
c
�ES
�t+
2ES = i
�L�e
4cn0*EL, �6�
�
�t+ ��B
2+ i��� = i
�0�B�e
4Va2 ELES
* , �7�
here, as before, ��=�− ��L−�B� is the detuning, n ishe phase (modal) index [14], �B /2 is the FWHM of thepontaneous Brillouin gain spectrum, � is the electros-
ig. 4. Pump power dependence of the resonant modes in PCF.igher frequencies. Expanded view is provided in the inset.
e
rictive coefficient, is the attenuation, and 0 is the un-isturbed density. Zhu et al. [14] have studied in detail aumerical solution of Eqs. (5)–(7) in a Brillouin amplifieronfiguration while the present study involves a fiberesonator or a Brillouin laser. In the adiabatic approxima-ion [17,18], according to which the amplitude of theump and Stokes waves do not change significantly dur-ng a phonon lifetime, the inertial term, � /�t in Eq. (7)an be neglected. Furthermore, expressing the complexptical field amplitudes in the modulus-phase formEL�z , t�=ALei�L, ES�z , t�=Aei�] and making use of Eq. (2),e can rewrite the coupled wave equations in the follow-
ng form:
−�AL
�z+
ng0
c
�AL
�t+
2AL = −
�B
4
gB�B/2
��B/2�2 + ��2 � −1
2gBIAL,
�8�
�A
�z+
ng0
c
�A
�t+
2A =
�B
4
gB�B/2
��B/2�2 + ��2 �1
2gBILA, �9�
−��L
�z+
ng0
c
��L
�t= −
�B
4
gB��
��B/2�2 + ��2I �gB��
�BI,
�10�
��
�z+
ng0
c
��
�t=
�B
4
gB��
��B/2�2 + ��2IL �gB��
�BIL,
�11�
here we have assumed that ��2���B2 /4� can be ne-
lected; gB is the line-center Brillouin gain; and I and ILre the intensities of the Stokes and pump beams, respec-ively. Several authors [23,26–31] have studied Eqs. (8)nd (11) revealing many interesting features associatedith the SBS dynamics. Our investigation here is to studyow the pump depletion influences the velocity of thetokes pulses in a narrow range of pump powers (about aecibel) above the SBS threshold. To this effect, we recallhat the group delay, Td, is given by d� /d�, which is alsohe difference in transit time in the presence and absencef SBS interaction. Thus we note that
pump power is increased, the gain increases and modes shift to
As the
wtscgd
wm
sgpepdeagt
wttailtct�ifb
weRci
atslIau
Tpttraos
tordl
5Tipp=lo(hstgqFttaAt
Fpfltof
5
R. K. Pattnaik and J. Toulouse Vol. 25, No. 10 /October 2008 /J. Opt. Soc. Am. B 1597
Td =d�
d�=
L
vg−
L
vg0=
L
c�ng, �12�
here L is the length of the fiber; vg and vg0 are, respec-ively, the group velocity in the presence and in the ab-ence of the SBS interaction; and �ng=ng−ng0 is thehange in group index due to SBS. The delay or change inroup index as a function of pump power can then beirectly obtained from Eq. (11) [using Eq. (12)] as
�Td
�z+
ng0
c
�Td
�t=
gB�B
4
��B/2�2 − ��2
��B/2�2 + ��22IL �gB
�BIL, �13�
hich, in the steady state and undepleted pump approxi-ation, readily gives
Td =gBL
�BIL =
G
�B, �14�
howing that that the delay is proportional to the SBSain, G=gBILL [14]. However, as pointed out in Section 1,ump depletion cannot be ignored in a Brillouin laser op-rating in the high SBS gain limit. Therefore, in order toredict the behavior of the group velocity and its depen-ence on pump power, it is necessary to solve the coupledquations (8), (9), and (13) without making the commonpproximation of an undepleted pump. To do this, we be-in by rewriting the equations in a dimensionless form inerms of normalized amplitudes,
−�aL
��+
�aL
��+
L
2aL = −
1
2Ga2aL, �15�
�a
��+
�a
��+
L
2a =
1
2GaL
2a, �16�
��ng
��+
��ng
��=
Gc
L�BaL
2 , �17�
here aL=AL /AL0 and a=A /AL0 represent, respectively,he normalized pump and Stokes amplitudes, AL0 beinghe amplitude of the pump injected at z=L. The lengthnd time in Eqs. (8), (9), and (13) have also been normal-zed according to �=z /L and �= t /T, with L being theength of the fiber and T=nL /c being the one-way-tripransit time (n is the normal unmodified group index andis the speed of light). In writing Eq. (17) we have used
he right-hand side of Eq. (12) to express Td in terms ofng. We have solved these equations numerically, follow-
ng the method of characteristics and using a standardourth-order Runge–Kutta algorithm with the followingoundary conditions [18] (see Fig. 5):
a�0,�� = f�0,�� + �R1R2e−L/2�a�L,� − 1�,
aL�L,�� = 1 + �R1R2e−L/2�aL�0,� − 1�, �18�
here R1 and R2 represent the amplitude reflectivity co-fficients at the end faces of the fiber. We assumed R1 and2 to be equal and renamed their product as the reflection
oefficient squared, R2. f�0,�� is a (normalized) seed signalnitiating the SBS process, which may be interpreted [4]
s the amplitude of the spontaneous Brillouin signal dueo the pump beam close to z=0. The strength of this seedignal has been taken to be of the order of a nanowatt orower in the numerical results reported by others [4,32].n our simulations, the fiber under test was assumed to be
standard SMF-28 fiber and the relevant parameterssed in the simulation are given in Table 1.Before discussing the simulation results, following
ang [2] we may point out that the strong damping ap-roximation [neglecting � /�t in Eq. (7)] is valid as long ashe pulse duration of the pump or Stokes wave is greaterhan the phonon lifetime (of the order [1–3] of 10 ns atoom temperature). In our simulations the pump is a CWnd (as will be shown later) the Stokes pulse duration isf the order of a few microseconds. We can thereforeafely neglect the inertial term, � /�t, in Eq. (7).
The simulation results presented in Section 5 showhat, in a Brillouin laser configuration, the group velocityf a Stokes pulse is enhanced—or, equivalently,eaccelerated—as the gain is increased. In the frequencyomain this results in an increase of the FSR of the fiberaser.
. NUMERICAL RESULTSo understand the numerical results presented here it ismportant to stress that our simulations assumed a CWump injected at z=L (far end of the fiber) and counter-ropagating relative to Stokes pulses originating from z0 (near end of the fiber). In a first simulation, we calcu-
ated the transmitted and reflected powers as a functionf input pump power by solving the set of equations15)–(17). This was important for two reasons; first, itelped establish the consistency of our simulations and,econd, it allowed us to determine the SBS threshold,hus providing a metric of what represented low and high-ain. Moreover, it also provided a reference for the subse-uent simulations in the depleted pump regime. Inig. 6(a) we present the results of these first simulations,ransmitted and reflected powers being defined here ashe average power of the Stokes emission at z=L and theverage pump power at z=0 as a function of input power.s the input power exceeds the SBS threshold of 30 mW,
he Stokes power is seen to rapidly increase and the out-
ig. 5. Schematics of the Fabry–Pérot Brillouin fiber laser. Theump is injected from the right. R1 and R2 are the amplitude re-ectivities of the end faces. The initial CW Stokes emission (dot-ed arrows) evolving from the noise near the left end face devel-ps into resonant modes upon Fresnel reflection from the endaces.
Table 1. Fiber Parameters for Simulation
L(m)
�m−1�
gB
(m/W)Aeff
��m2� R�B /2 (Hz) f�0.��
00 0.115�10−3 2.5�10−11 55 0.04 20�106 1�10−6
popbiatgSpmtrp
aatprtFcc
cb
tFtcbraap=nupcSlpswee
FSnw
Ftt
1598 J. Opt. Soc. Am. B/Vol. 25, No. 10 /October 2008 R. K. Pattnaik and J. Toulouse
ut pump power to decrease correspondingly. The thresh-ld, Gth=6.82 �30 mW�, is consistent with the value ex-ected from the expression, Gth=2�ln�R��+2L, as giveny Gaeta and Boyd [10]. In Fig. 6(b) we show the normal-zed Stokes amplitude at z=L as a function of time afterbout 5500 round trips through the fiber. We note thathere is barely any noticeable increase in amplitude orain below the threshold and, more importantly, that thetokes signal remains continuous (CW). As the pumpower or gain increases, the Stokes signal first develops aodulation, the period of which is equal to the round-trip
ime in the fiber. Eventually, above the threshold, thisegular oscillatory behavior gives way to a train of Stokesulses shown next in Fig. 7.In Fig. 7 we present the normalized Stokes amplitude
t z=L, as in Fig. 6(b) but for two different input powersbove the threshold. The train of pulses shown is charac-eristic of a Fabry–Perot cavity. In Fig. 7(a) the pumpower is just above the SBS threshold, the pulses are nar-ow, and their period is still nearly equal to the round-tripransit time in the fiber cavity, 2ng0L /c. But, as shown inig. 7(b), the transmission characteristics change signifi-antly for higher pump powers. As the pump power is in-reased from 30 to 50 mW, the period between pulses de-
ig. 6. (a) Simulation results for the average reflected power (sMF fiber. The SBS threshold is near 30 mW of pump power. (b)ear threshold. When the gain is low �29.7 mW�, the output is conith a period equal to the round-trip transit time.
ig. 7. Simulation results for the Stokes amplitude at the outpuhreshold the pulse repetition rate is nearly equal to the round-ransit time decreases suggesting faster light.
reases by about 4%, from TR to 0.96 TR, and the pulsesecome broader and asymmetric.To make more explicit the effect of pump depletion on
he shape and period of the Stokes pulses, we present inig. 8 the evolution of both the Stokes and pump ampli-
udes with time at an arbitrary test location (z=0.8L, i.e.,loser to the input end of the pump). We start with theoundary conditions given in Eq. (18) and after 5500ound trips and investigate the evolution of the CW pumpnd Stokes pulse amplitudes as they overlap and interactt the test location. Again, we contrast the results forump powers near and well above the threshold (PIN30 and 50 mW). At early times, the Stokes pulse havingot yet arrived, the pump sweeps past the test locationndepleted. At later times, when the pump and Stokesulse overlap at the test location, the pump undergoesontinuous depletion, first to the leading edge of thetokes pulse and then to its trailing edge at a reduced
evel. Several features are worth noting in Fig. 8. At lowump powers [Fig. 8(a)], the pump amplitude exhibits aharp but small drop of about 2% of its initial value,hich corresponds to the depletion of the pump by thequally sharp leading edge of the Stokes pulse. It is inter-sting to note that the inflection point of this sharp drop
rcles) and the transmitted power (open circles) for a 500 m longamplitude at z=L as a function of time when the input power isin time. As the gain is increased, the output exhibits oscillations
s a function of time. (a) When the pump power is just above theansit time of the passive cavity. (b) At higher pump powers, the
olid ciStokesstant
t end atrip tr
c(ssttwaStAtbspipplpnwtceaatg
S
itcit
ilaItt0fipzt
dipf�aTtmStpa
Fm the d
Ft
R. K. Pattnaik and J. Toulouse Vol. 25, No. 10 /October 2008 /J. Opt. Soc. Am. B 1599
oincides precisely with the maximum of the Stokes pulsealong the time axis). Thereafter, the continued butlower decrease in the amplitude of the pump (as itweeps past the test location) is the result of the interac-ion of the pump with the Stokes pulse at points beyondhe test location at z=0.8L as it continues to propagate to-ards the far end of the fiber at z=L. The final rise in themplitude of the pump reflects the arrival of the singletokes pulse at the end of the fiber. The final rise time ofhe pump in fact matches the width of the Stokes pulse.t higher pump powers, as shown in Fig. 8(b), the deple-
ion of the pump becomes significant (about 70%) andoth the pump depletion and the Stokes pulse aretretched over a longer time. This stretching is due to theump being significantly more depleted first by the lead-ng edge and then even further by the trailing edge of theulse. The leading edge of the pulse sees less depletedump, and is therefore slowed down as would happen atow-gain, while the trailing edge sees a more depletedump and is therefore reaccelerated. It is important toote that the trailing edge of the Stokes pulse interactith the counterpropagating pump for longer times than
he leading edge, thus receiving additional gain beforerossing the test location. For this reason, the trailingdge of the Stokes pulse appears to be stretched. Thissymmetry is weak in Fig. 7(a) because of marginal gaint low pump powers. It is important to note that the dis-ortion of the pulse shape is entirely due to the unevenain across the Stokes pulse.
The essential aspect of the results presented is that thetokes pulse experiences a continuously changing group
ig. 8. Amplitudes of the pump and Stokes light at z=0.8L as aere 6% of the incident pump power. (b) At higher pump powers
ig. 9. Variation of group index across the Stokes pulse. (a) Evohe leading edge to the trailing edge. (b) Evolution along the dep
ndex as it intersects the pump at the test point, becausehe pump power is being continuously depleted during therossover. As a consequence, the delay (or change in groupndex) decreases continuously from the leading edge tohe trailing edge of the Stokes pulse.
In Fig. 9 we present the corresponding change in groupndex, �ng, across the Stokes pulse at (a) the same testocation as before �z=0.8L� as a function of time and (b) atgiven time as a function of axial position along the fiber.
n Fig. 9(a), at early times (left side of the figure) whenhe Stokes pulse has not yet arrived at the test location,he pump is undepleted and �ng is at its maximum (about.055). As the leading edge of the Stokes pulse (left in thegure) overlaps with the pump at the test location, �ngrogressively drops from its high value plateau to nearero, when the far end of the trailing edge finally crosseshe test location (at later times).
The effect of pump depletion is thus to significantly re-uce �ng from its undepleted value, thereby reducing thenitial slowing down or equivalently reaccelarating theulse. In Fig. 9(b) we show the change of group index as aunction of position along the fiber at a given test time�=0.8� and for the same gain. The curves in this figurere in a sense the mirror image of the curves in Fig. 9(a).he pump is now undepleted at longer distances closer to
he end of the fiber, where the group index assumes itsaximum value. At intermediate distances, where thetokes pulse is found interacting with the pump at theest time, the group index first drops due to increasingump depletion and finally recovers at shorter distanceslready passed by the Stokes pulse, where the pump re-
on of time. (a) Just above the threshold, the pump depletion is aepletion exceeds 80%.
with time at a fixed z=0.8L, it decreases from 0.05 to 0.02 fromhe fiber cavity at a given instant of time, �=0.8.
functi
lutionth of t
cti
aaiapcptptfitwtfpTnSa
ti
rltpghlfdtTaSl
Sogffftsr7imccwt
6WtcSthB
Ftg
FSat
1600 J. Opt. Soc. Am. B/Vol. 25, No. 10 /October 2008 R. K. Pattnaik and J. Toulouse
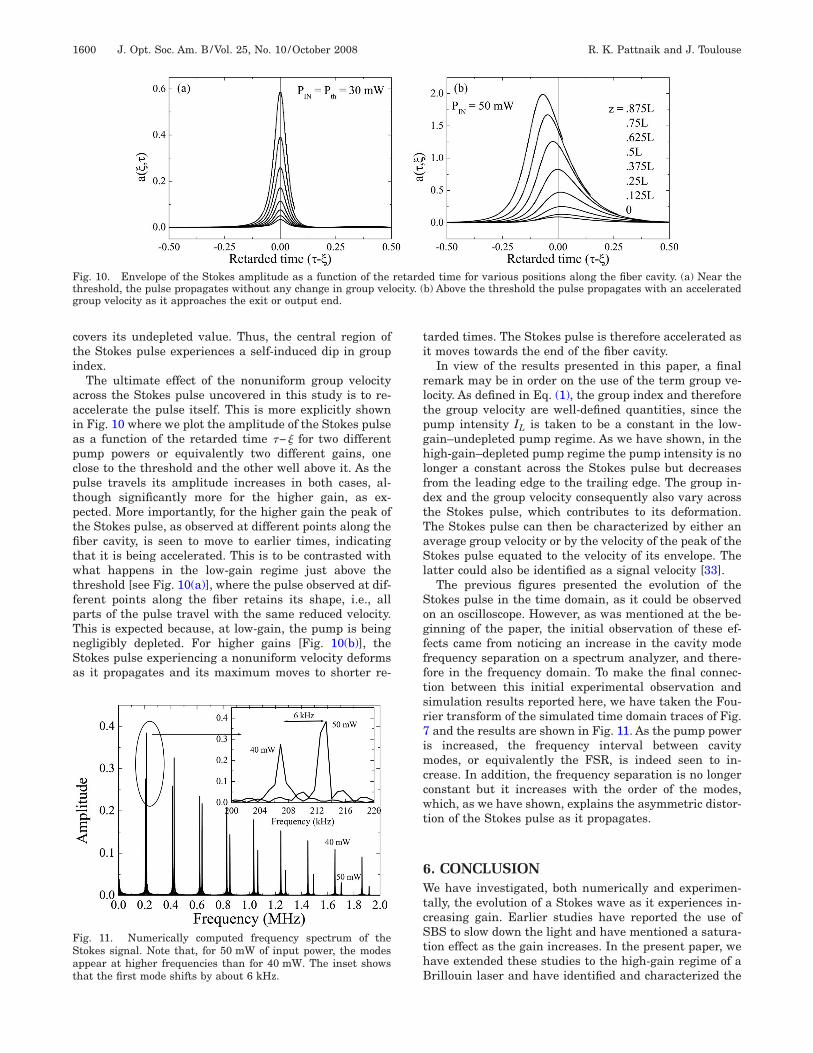
overs its undepleted value. Thus, the central region ofhe Stokes pulse experiences a self-induced dip in groupndex.
The ultimate effect of the nonuniform group velocitycross the Stokes pulse uncovered in this study is to re-ccelerate the pulse itself. This is more explicitly shownn Fig. 10 where we plot the amplitude of the Stokes pulses a function of the retarded time �−� for two differentump powers or equivalently two different gains, onelose to the threshold and the other well above it. As theulse travels its amplitude increases in both cases, al-hough significantly more for the higher gain, as ex-ected. More importantly, for the higher gain the peak ofhe Stokes pulse, as observed at different points along theber cavity, is seen to move to earlier times, indicatinghat it is being accelerated. This is to be contrasted withhat happens in the low-gain regime just above the
hreshold [see Fig. 10(a)], where the pulse observed at dif-erent points along the fiber retains its shape, i.e., allarts of the pulse travel with the same reduced velocity.his is expected because, at low-gain, the pump is beingegligibly depleted. For higher gains [Fig. 10(b)], thetokes pulse experiencing a nonuniform velocity deformss it propagates and its maximum moves to shorter re-
ig. 10. Envelope of the Stokes amplitude as a function of thehreshold, the pulse propagates without any change in group velroup velocity as it approaches the exit or output end.
ig. 11. Numerically computed frequency spectrum of thetokes signal. Note that, for 50 mW of input power, the modesppear at higher frequencies than for 40 mW. The inset showshat the first mode shifts by about 6 kHz.
arded times. The Stokes pulse is therefore accelerated ast moves towards the end of the fiber cavity.
In view of the results presented in this paper, a finalemark may be in order on the use of the term group ve-ocity. As defined in Eq. (1), the group index and thereforehe group velocity are well-defined quantities, since theump intensity IL is taken to be a constant in the low-ain–undepleted pump regime. As we have shown, in theigh-gain–depleted pump regime the pump intensity is no
onger a constant across the Stokes pulse but decreasesrom the leading edge to the trailing edge. The group in-ex and the group velocity consequently also vary acrosshe Stokes pulse, which contributes to its deformation.he Stokes pulse can then be characterized by either anverage group velocity or by the velocity of the peak of thetokes pulse equated to the velocity of its envelope. The
atter could also be identified as a signal velocity [33].The previous figures presented the evolution of the
tokes pulse in the time domain, as it could be observedn an oscilloscope. However, as was mentioned at the be-inning of the paper, the initial observation of these ef-ects came from noticing an increase in the cavity moderequency separation on a spectrum analyzer, and there-ore in the frequency domain. To make the final connec-ion between this initial experimental observation andimulation results reported here, we have taken the Fou-ier transform of the simulated time domain traces of Fig.and the results are shown in Fig. 11. As the pump power
s increased, the frequency interval between cavityodes, or equivalently the FSR, is indeed seen to in-
rease. In addition, the frequency separation is no longeronstant but it increases with the order of the modes,hich, as we have shown, explains the asymmetric distor-
ion of the Stokes pulse as it propagates.
. CONCLUSIONe have investigated, both numerically and experimen-
ally, the evolution of a Stokes wave as it experiences in-reasing gain. Earlier studies have reported the use ofBS to slow down the light and have mentioned a satura-ion effect as the gain increases. In the present paper, weave extended these studies to the high-gain regime of arillouin laser and have identified and characterized the
ed time for various positions along the fiber cavity. (a) Near theb) Above the threshold the pulse propagates with an accelerated
retardocity. (
cgsdihmStwpipewd
AStioNwpCC
R
1
1
1
1
1
1
1
1
1
1
2
2
2
2
2
2
2
2
2
2
3
3
3
3
R. K. Pattnaik and J. Toulouse Vol. 25, No. 10 /October 2008 /J. Opt. Soc. Am. B 1601
onsequences of pump depletion on the shape and propa-ation of the Stokes signal. We have shown that the tran-it time of the Stokes pulse through the fiber laser cavityecreases as the pump power is increased, an effect thats also seen as a shift of the resonant cavity modes toigher frequencies. This upward shift of the resonantodes reflects an increase in the group velocity of thetokes pulse. Numerical simulations reveal that, due tohe effect of pump depletion, the Stokes pulse propagatesith a nonuniform delay or group index. The group indexrogressively decreases from the leading edge to the trail-ng edge of the Stokes pulse as it counterpropagates to theump, leading to its asymmetric deformation and accel-ration. Otherwise stated, the Stokes pulse interactingith the pump through SBS experiences an asymmetricip in the group index.
CKNOWLEDGMENTSpecial thanks go to Optical Fiber Solutions (OFS Inc.) forwo of the photonic crystal fibers (RB 61 and RB 65) usedn this study and to Crystal Fibre of Denmark for a thirdne (crystal fiber). We are particularly grateful to theational Science Foundation (NSF) for its support of thisork under grant ECS-0401269. We also acknowledgeartial support from the Pennsylvania Department ofommunity and Economic Development through theenter for Optical Technologies.
EFERENCES1. N. M. Kroll, “Excitation of hypersonic vibrations by means
of photoelastic coupling of high-intensity light waves toelastic waves,” J. Appl. Phys. 36, 34–43 (1965).
2. C. L. Tang, “Saturation and spectral characteristics of theStokes emission in the stimulated Brillouin process,” J.Appl. Phys. 37, 2945–2955 (1966).
3. V. S. Starunov and I. L. Fabelinski�, “StimulatedMandel’shtam-Brillouin scattering and stimulated entropy(temperature) scattering of light,” Sov. Phys. Usp. 12,463–488 (1970).
4. R. W. Boyd, Nonlinear Optics (Academic, 1992).5. E. Picholle, in Guided Wave Nonlinear Optics, D. B.
Ostrowsky and R. Reinisch, eds. (Kluwer, 1992), pp.627–647.
6. G. P. Agrawal, Nonlinear Fiber Optics, 2nd. ed. (Academic,1995).
7. D. Cotter, “Observation of stimulated Brillouin scatteringin low-loss silica fiber at 1.3 �m,” Electron. Lett. 18,495–496 (1982).
8. N. Shibata, K. Okamoto, and Y. Azuma, “Longitudinalacoustic modes and Brillouin-gain spectra for GeO2-doped-core single-mode fibers,” J. Opt. Soc. Am. B 6, 1167–1174(1989).
9. A. Yeniay, J.-M. Delavaux, and J. Toulouse, “Spontaneousand stimulated Brillouin scattering gain spectra in opticalfibers,” J. Lightwave Technol. 20, 1425–1432 (2002).
0. A. I. Gaeta and R. W. Boyd, “Stimulated Brillouinscattering in the presence of feedback,” Int. J. NonlinearOpt. Phys. 1, 581–594 (1992).
1. C. Montes, D. Bahloul, I. Bongrand, J. Botineau, G. Cheval,A. Mamhound, E. Picholle, and A. Picozzi, “Self-pulsingand dynamic bistability in cw-pumped Brillouin fiber ringlasers,” J. Opt. Soc. Am. B 16, 932–951 (1999).
2. Y. Okawachi, M. S. Bigelow, J. E. Sharping, Z. Zhu, A.Schweinsberg, D. J. Gauthier, R. W. Boyd, and A. L. Gaeta,“Tunable all-optical delays via Brillouin slow light in anoptical fiber,” Phys. Rev. Lett. 94, 153902–153905 (2005).
3. K. Y. Song, M. González-Herráez, and L. Thévenaz,“Observation of pulse delaying and advancement in opticalfibers using stimulated Brillouin scattering,” Opt. Express13, 82–88 (2005).
4. Z. Zhu, D. J. Gauthier, Y. Okawachi, J. E. Sharping, A. L.Gaeta, R. W. Boyd, and A. E. Willner, “Numerical study ofall-optical slow-light delays via stimulated Brillouinscattering in an optical fiber,” J. Opt. Soc. Am. B 22,2378–2384 (2005).
5. M. González-Herráez, K.-Y. Song, and L. Thévenaz,“Optically controlled slow and fast light in optical fibersusing stimulated Brillouin scattering,” Appl. Phys. Lett.87, 081113 (2005).
6. R. W. Boyd and D. J. Gauthier, “‘Slow’ and ‘fast’ light,” inProgress in Optics, E. Wolf, ed. (Elsevier, 2002), Vol. 43,Chap. 6, pp. 497–530.
7. J. Botineau, C. Leycuras, C. Montes, and E. Picholle,“Stabilization of a stimulated Brillouin fiber ring laser bystrong pump modulation,” J. Opt. Soc. Am. B 6, 300–312(1989).
8. I. Bar-Joseph, A. A. Friesem, E. Lichtman, and R. G.Waarts, “Steady and relaxation oscillations of stimulatedBrillouin scattering in single-mode optical fibers,” J. Opt.Soc. Am. B 2, 1606–1611 (1985).
9. A. Yariv, Optical Electronics (Holt, Rinehart and Winston,1976), Chap. 6.
0. M. Dämmig and F. Mitschke, “Velocity of pulse propagationin media with amplitude nonlinearity,” Appl. Phys. B, 59,345–349 (1994).
1. J. E. McElhenny, R. K. Pattnaik, J. Toulouse, K. Saitoh,and M. Koshiba, “Unique characteristic features ofstimulated Brillouin scattering in small-core photoniccrystal fibers,” J. Opt. Soc. Am. B 25, 582–593 (2008).
2. M. Dämmig, G. Zinner, F. Mitschke, and H. Welling,“Stimulated Brillouin scattering in fibers with and withoutexternal feedback,” Phys. Rev. A 48, 3301–3309 (1993).
3. E. Picholle, C. Montes, C. Leycuras, O. Legrand, and J.Botineau, “Observation of dissipative superluminoussolitons in a Brillouin fiber ring laser,” Phys. Rev. Lett. 66,1454–1457 (1991).
4. D. Yu, W. Lu, and R. G. Harrison, “Physical origin ofdynamical stimulated Brillouin scattering in optical fiberswith feedback,” Phys. Rev. A 51, 669–674 (1995).
5. V. Lecoeuche, S. Randoux, B. Segard, and J. Zemmouri,“Dynamics of stimulated Brillouin scattering withfeedback,” Quantum Semiclassic. Opt. 8, 1109–1145 (1996).
6. C. Montes, A. Mamhmoud, and E. Picholle, “Bifurcation ina cw-pumped Brillouin fiber-ring laser: Coherent solitonmorphogenesis,” Phys. Rev. A 49, 1344–1349 (1994).
7. J. Botineau, C. Leycuras, C. Montes, and E. Picholle,“Coherent modal analysis of a Brillouin fiber ring laser,”Opt. Commun. 109, 126–132 (1994).
8. Y. Imai and H. Aso, “Chaos in fiber-optic stimulatedBrillouin scattering without external feedback in largenonlinear refractive index regime,” Opt. Rev. 4, 636–638(1997).
9. Y. Imai and H. Aso, “Chaos in fiber-optic stimulatedBrillouin scattering dependent on pump power, nonlinearrefractive index, feedback power, and fiber length,” Opt.Rev. 4, 476–480 (1997).
0. C. C. Chow and A. Bers, “Chaotic stimulated Brillouinscattering in a finite-length medium,” Phys. Rev. A 47,5144–5150 (1993).
1. R. G. Harrison, P. M. Ripley, and W. Lu, “Observation andcharacterization of deterministic chaos in stimulatedBrillouin scattering with weak feedback,” Phys. Rev. A 49,R24–R27 (1994).
2. L. Chen and X. Bao, “Analytical and numerical solutionsfor steady-state stimulated Brillouin scattering in a single-mode fiber,” Opt. Commun. 152, 65–70 (1998).
3. L. Brillouin, Wave Propagation and Group Velocity(Academic, 1960).