Access Across America: Walking 2014 Methodology Final Report Prepared by: Andrew Owen David Levinson Accessibility Observatory Department of Civil, Environmental, and Geo- Engineering University of Minnesota CTS 15-04
Transcript
Access Across America: Walking 2014 Methodology
Final Report
Prepared by:
Andrew OwenDavid Levinson
Accessibility ObservatoryDepartment of Civil, Environmental,
4. Title and Subtitle 5. Report Date Access Across America: Walking 2014 Methodology May 2015
6.
7. Author(s) 8. Performing Organization Report No. Andrew Owen, David Levinson
9. Performing Organization Name and Address 10. Project/Task/Work Unit No. Accessibility Observatory Department of Civil, Environmental, and Geo- Engineering University of Minnesota 500 Pillsbury Drive SE Minneapolis, MN 55455
11. Contract (C) or Grant (G) No.
12. Sponsoring Organization Name and Address 13. Type of Report and Period Covered Center for Transportation Studies University of Minnesota 200 Transportation and Safety Building 511 Washington Ave. SE Minneapolis, MN 55455
Final Report 14. Sponsoring Agency Code
15. Supplementary Notes http://ao.umn.edu/publications/ http://www.cts.umn.edu/Publications/ResearchReports/ 16. Abstract (Limit: 250 words) Accessibility is the ease of reaching valued destinations. It can be measured for various transportation modes, to different types of destinations, and at different times of day. There are a variety of ways to define accessibility, but the number of destinations reachable within a given travel time is the most comprehensible and transparent, as well as the most directly comparable across cities. This report describes the data and methodology used in the separate publication, Access Across America: Walking 2014. That report estimates the accessibility to jobs by walking in the 50 largest (by population) metropolitan areas in the United States. Walking mode-share for commute trips nationally is around 2.8%, and 5.0% within large cities in the United States. Rankings are determined by a weighted average of accessibility, giving a higher weight to closer jobs. Jobs reachable within ten minutes are weighted most heavily, and jobs are given decreasing weight as travel time increases up to 60 minutes. 17. Document Analysis/Descriptors 18. Availability Statement
Accessibility; walking; pedestrian traffic; walkability; walking distance; land use; travel time; travel behavior; urban transportation; work trips; commuting
No restrictions. Document available from: National Technical Information Services, Alexandria, Virginia 22312
19. Security Class (this report) 20. Security Class (this page) 21. No. of Pages 22. Price Unclassified Unclassified 14
Access Across America: Walking 2014 Methology
Final Report
Prepared by:
Andrew OwenDavid Levinson
Accessibility ObservatoryDepartment of Civil, Environmental, and Geo- Engineering
University of Minnesota
May 2015
Published by:
Center for Transportation StudiesUniversity of Minnesota
200 Transportation and Safety Building511 Washington Ave. S.E.
Minneapolis, Minnesota 55455
This report represents the results of research conducted by the authors and does not necessarily reflect the official views or policy of the Center for Transportation Studies or the University of Minnesota.
1 SummaryThis document describes the methodology used by the Accessibility Observatory at the University ofMinnesota to produce the accessibility metrics and related data that are presented in Access Across Amer-ica: Walking 2014. An overview of the methodology is provided below, and detailed descriptions canbe found in the following sections.
• Data Sources
1. U.S. Census TIGER 2010 datasets: blocks, core-based statistical areas (CBSAs)
2. U.S. Census Longitudinal Employer-HouseholdDynamics (LEHD) 2011Origin-DestinationEmployment Statistics (LODES)
3. OpenStreetMap (OSM) North America extract, retrieved April 2014
4. American Community Survey Reports: walking mode share, 2008-2012
5. Walk Score 2014
• Data Preparation
1. Construct pedestrian travel network graph for each CBSA
• Accessibility Calculation
1. For each Census block, calculate travel time to all other blocks within a 5km radius for asingle departure time
2. Calculate cumulative opportunity accessibility to jobs for each block, using thresholds of10, 20, …, 60 minutes
3. Average accessibility for each CBSA over all blocks, weighting by number of workers ineach block
4. Calculate weighted ranking for each metropolitan area
5. Calculate correlations between person-weighted accessibility, walk mode share, and walkscore.
1
2 Data Sources2.1 GeographyAll calculations and results in this project are based on geographies defined by the U.S. Census Bu-reau. Census blocks are the fundamental unit for travel time calculation, and block-level accessibilityresults are aggregated across core-based statistical areas (CBSAs) for metropolitan-level analysis. Thesegeography definitions are provided by the U.S. Census Bureau’s Topologically Integrated GeographicEncoding and Referencing (TIGER) program.1 This project uses the geography definitions establishedfor the 2010 decennial census.
Accessibility calculations are performed for every block in a given CBSA, excluding blocks whichcontain no land. Blocks outside of the CBSA are included as potential destinations as described inSection 4.2.
2.2 Employment and Worker PopulationData describing the distribution of labor and employment in the region are drawn from the US Cen-sus Bureau’s Longitudinal Employer-Household Dynamics program (LEHD)2. The LEHD Origin-Destination Employment Statistics (LODES) dataset, which is updated annually, provides Censusblock-level estimates of employee home and work locations. This project uses LODES data from 2011,the most recent available as of this writing.
2.3 Pedestrian NetworkData describing the pedestrian network in eachmetropolitan area were obtained fromOpenStreetMap3,an open-access online database of transportation network structures and other spatial information.OpenStreetMap, like Wikipedia, is comprised of contributions from many individuals. In urban areas,it typically provides a much more detailed and up-to-date representation of pedestrian networks thandatasets available from federal, state, regional, or local sources. The data used in this project wereretrieved from OpenStreetMap on April 16, 2014. Specifically, the pedestrian network is comprised offeatures with the “footway,” “pedestrian,” and “residential” tags.
2.4 Walk Mode Share &Walk ScoreWalk mode share describes the percentage of network users in a given metropolitan area that use thewalking mode, and is often used to rank metropolitan areas in hierarchy of walkability. Walking modeshare data is taken from the American Community Survey Reports for 2008-20124 Walk Score is awalkability ranking service and data platform managed by Redfin, a realtor aggregating service. Walkscores for a given origin point are calculated based on proximity to services in various categories, with
a distance-decay weighting function, and on pedestrian friendliness factors such as population densityand built environment (road) metrics5. Scores are aggregated and averaged across metropolitan areas,to allow reporting of metro-wide scores and rankings. To test if the singular measure of job-opportunityaccessibility for walking is a reasonable ranking measure, correlations between both 30-minute worker-weighted average accessibility and distance-weighted worker-weighted average accessibility, and walkscore, were performed.
Certain cities were excluded from the correlations due to incomplete data; cities without a walkscore value available were Providence, Tucson, and Salt Lake City; cities without a walk mode sharevalue available from McKenzie (2014) were Buffalo, St. Louis, New Orleans, Cincinnati, Richmond,Tampa, Orlando, Riverside, Birmingham, and Salt Lake City.
3 Data Preparation3.1 Analysis Area DefinitionThis project relies on the efficient calculation of shortest paths between a large number of origin–destination pairs - between every possible pair of origins and destinations. If there are N origins, andM > N destinations including the buffer, the number of computations is O(M ∗N) (more precisely,C = M ∗ N − 1/2 ∗ (M + N)). However, as walking times do not vary throughout the day astransit schedules do, and thus walking accessibility is independent of departure time, only one set ofaccessibility calculations for multiple thresholds must be performed for each metropolitan area. Thecomputations were performed for all CBSAs on a single workstation in a reasonable amount of time.
4
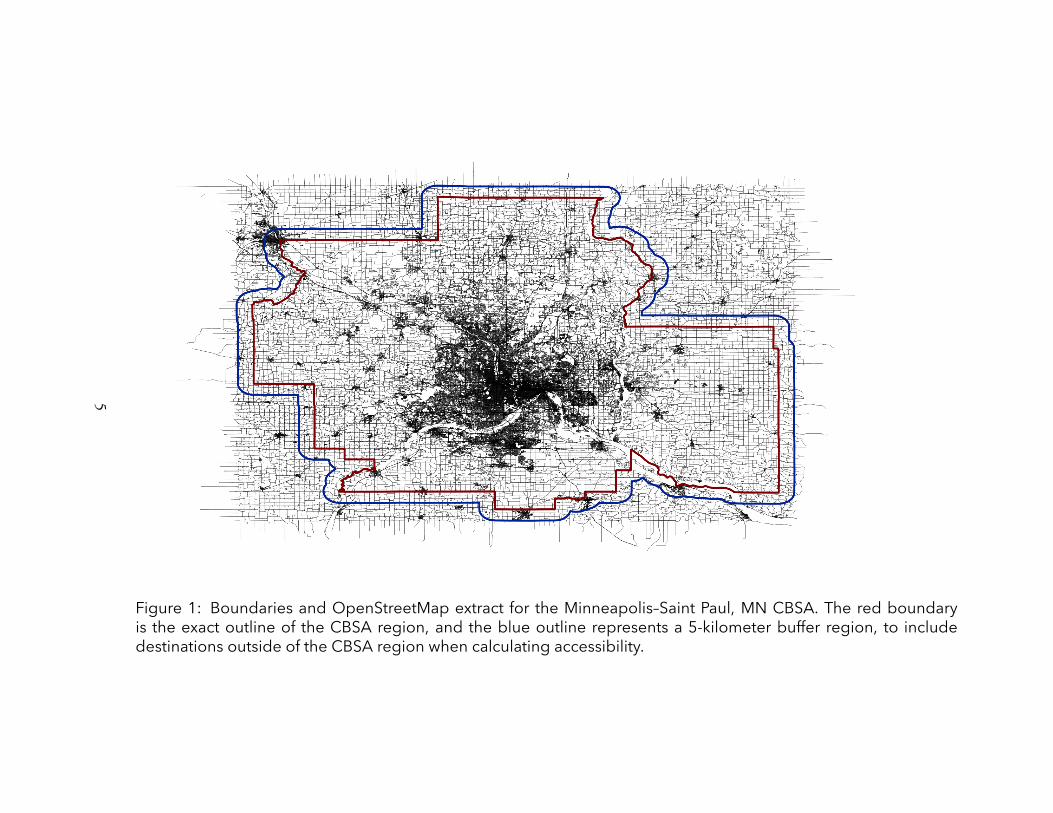
Figure 1: Boundaries and OpenStreetMap extract for the Minneapolis–Saint Paul, MN CBSA. The red boundaryis the exact outline of the CBSA region, and the blue outline represents a 5-kilometer buffer region, to includedestinations outside of the CBSA region when calculating accessibility.
5
The set of all centroids of census blocks within the CBSA region constitute the origin points fromwhich accessibility is calculated. Assuming a walking speed of 5km per hour, all census blocks whosecentroids lie within the CBSA region itself, plus a 5km buffer of the boundary of the CBSA, are includedas destinations.
3.2 Graph BuildingTravel time calculations in this project are performed using the OpenTripPlanner (OTP) software, de-scribed in more detail in Section 4.2. OTP includes a graph building function that compiles pedestriannetwork data fromOpenStreetMap. A graph is built for each CBSA area, using a rectangular boundingbox as depicted above, based on a 5km buffer from the widest and tallest points of the CBSA shape.This is combined with origin and destination locations to create a single analysis bundle that containsall data necessary to calculation accessibility values for the blocks in a single CBSA at once.
6
4 Accessibility Calculation4.1 OverviewAccessibility evaluations rely on an underlying calculation of travel times. Here, walking travel timesare evaluated from each Census block centroid based on a detailed pedestrian network. Travel timecalculations are performed for a single departure time, as the characteristics of the pedestrian travelnetwork are modeled here as time-independent. These travel times are the basis of a cumulative oppor-tunities accessibility measure which counts the number of opportunities (in this case, jobs) reachablefrom each origin within 10, 20, 30, 40, 50, and 60 minutes.
This block-level dataset provides a locational measure of accessibility — it indicates how many jobscan be reached from different points in space. This location measure is then weighted by the numberof workers residing in each Census block and averaged across the entire metro area to produce worker-weighted accessibility. This metric indicates the accessibility that is experienced by the average typicalworker in the metropolitan area.
Finally, the worker-weighted average accessibility values across the 10 through 60minute thresholdsare averaged for each metropolitan area to produce a weighted accessibility ranking.
The following sections describe the specific tools, algorithms, and parameters that were used toproduce the data presented in Access Across America: Walking 2014.
4.2 Travel Times4.2.1 SoftwareWalking travel time calculations are performed using OpenTripPlanner (OTP), an open-source multi-modal trip planning and analysis tool. OpenTripPlanner is a graph-based transit routing system whichoperates on a unified graph including links representing road, pedestrian, and transit facilities and ser-vices. OTP is available at http://opentripplanner.org and is described and evaluated in Hillsmanand Barbeau (2011).OTP’s Analyst extension provides efficient and parallelized processing of manypaths from a single origin based on the construction of shortest path trees. Locally-developed Pythonlibraries and scripts were used to automate the graph creation, OTP processes, and data post-processingand imaging.
4.2.2 Walking Trip ParametersThe time cost of travel by walking is comprised of a single component. Total travel time refers to the timecost of walking from origin to destination, including egress and ingress at the origins and destinations.A walking trip is much simpler than a transit trip, which involves pre-boarding waiting time, on-vehicletime, any transfer waiting times, and finally the time required to access the destination from the transitstation. This reduces the complexity of the accessibility calculations.
This analysis makes the assumption that walking speed is uniform at 5 km/hour along designatedpedestrian facilities such as sidewalks, trails, etc.
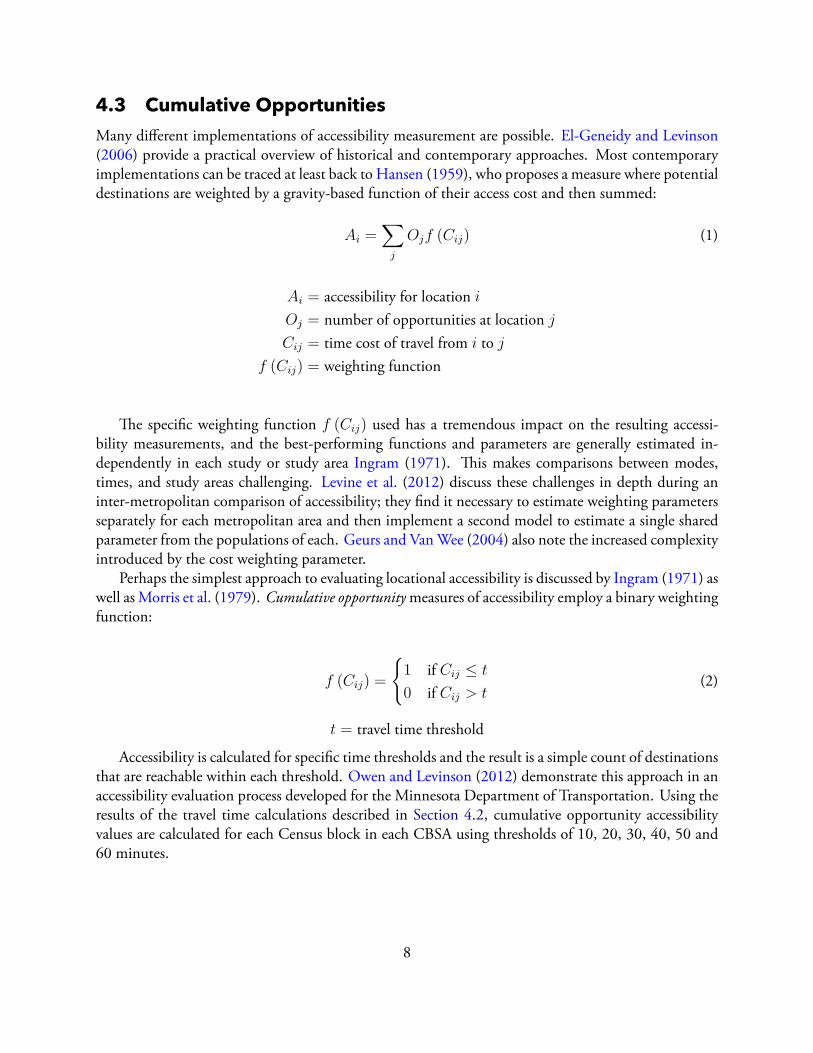
4.3 Cumulative OpportunitiesMany different implementations of accessibility measurement are possible. El-Geneidy and Levinson(2006) provide a practical overview of historical and contemporary approaches. Most contemporaryimplementations can be traced at least back to Hansen (1959), who proposes a measure where potentialdestinations are weighted by a gravity-based function of their access cost and then summed:
Ai =∑j
Ojf (Cij) (1)
Ai = accessibility for location i
Oj = number of opportunities at location j
Cij = time cost of travel from i to jf (Cij) = weighting function
The specific weighting function f (Cij) used has a tremendous impact on the resulting accessi-bility measurements, and the best-performing functions and parameters are generally estimated in-dependently in each study or study area Ingram (1971). This makes comparisons between modes,times, and study areas challenging. Levine et al. (2012) discuss these challenges in depth during aninter-metropolitan comparison of accessibility; they find it necessary to estimate weighting parametersseparately for each metropolitan area and then implement a second model to estimate a single sharedparameter from the populations of each. Geurs and VanWee (2004) also note the increased complexityintroduced by the cost weighting parameter.
Perhaps the simplest approach to evaluating locational accessibility is discussed by Ingram (1971) aswell as Morris et al. (1979). Cumulative opportunitymeasures of accessibility employ a binary weightingfunction:
f (Cij) =
{1 if Cij ≤ t
0 if Cij > t(2)
t = travel time threshold
Accessibility is calculated for specific time thresholds and the result is a simple count of destinationsthat are reachable within each threshold. Owen and Levinson (2012) demonstrate this approach in anaccessibility evaluation process developed for the Minnesota Department of Transportation. Using theresults of the travel time calculations described in Section 4.2, cumulative opportunity accessibilityvalues are calculated for each Census block in each CBSA using thresholds of 10, 20, 30, 40, 50 and60 minutes.
8
4.4 Person-Weighted AccessibilityThe accessibility calculation methods described in the sections above provide a locational accessibilitymetric — one that describes accessibility as a property of locations. The value of accessibility, however,is only realized when it is experienced by people. To reflect this fact, accessibility is averaged across allblocks in a CBSA, with each block’s contribution weighted by the number of workers in that block. Theresult is a single metric (for each travel time threshold) that represents the accessibility value experiencedby an average worker in that CBSA.
4.5 Weighted Accessibility RankingMetropolitan area rankings are based on an average of person-weighted job accessibility for eachmetropoli-tan area over the six travel time thresholds. In the weighted average of accessibility, destinations reach-able in shorter travel times are given more weight. A negative exponential weighting factor is used, fol-lowing Levinson and Kumar (1994). Here time is differenced by thresholds to get a series of “donuts”(e.g., jobs reachable from 0 to 10 minutes, from 10 to 20 minutes, etc.).
aw =∑t
(at − at−10)× eβt
aw = Weighted accessibility ranking metric for a single metropolitan areaat = Worker-weighted accessibility for threshold t
β = −0.08
9
ReferencesEl-Geneidy, A. M. and Levinson, D. M. (2006). Access to destinations: Development of accessibilitymeasures. Technical Report MN/RC-2006-16, Minnesota Department of Transportation.
Geurs, K. T. and Van Wee, B. (2004). Accessibility evaluation of land-use and transport strategies:review and research directions. Journal of Transport Geography, 12(2):127–140.
Hansen, W. (1959). How accessibility shapes land use. Journal of the American Institute of Planners,25(2):73–76.
Hillsman, E. L. and Barbeau, S. J. (2011). Enabling cost-effective multimodal trip planners throughopen transit data. Technical Report USF 21177936, National Center for Transit Research.
Ingram, D. R. (1971). The concept of accessibility: A search for an operational form. Regional Studies,5(2):101–107.
Levine, J., Grengs, J., Shen, Q., and Shen, Q. (2012). Does accessibility require density or speed? Acomparison of fast versus close in getting where you want to go in U.S. metropolitan regions. Journalof the American Planning Association, 78(2):157–172.
Levinson, D. M. and Kumar, A. (1994). Multimodal trip distribution: structure and application.Transportation Research Record, pages 124–124.
McKenzie, B. (2014). Modes less traveled — bicycling and walking to work in the United States:2008–2012. Technical Report ACS-25, U.S. Census Bureau.
Morris, J. M., Dumble, P., and Wigan, M. R. (1979). Accessibility indicators for transport planning.Transportation Research Part A: General, 13(2):91–109.
Owen, A. and Levinson, D. (2012). Annual accessibility measure for the Twin Cities metropolitanarea. Technical Report 2012-34, Minnesota Department of Transportation.