Accounting for Ecosystem Services Using Emergy
Analysis: Florida Energy Crops (Sugarcane)
HENDRY COUNTY SUSTAINABLE
BIOFUELS CENTER
ACES and Ecosystem Markets 2012
© December 2012
Nana Yaw Amponsah
Intelligentsia International Inc.
Presentation Outline
1. Hendry County Sustainable Biofuels Center
2. Project Summary
3. Analysis Tools
4. Methodology
5. Results
6. Concluding Comments
2 ACES and Ecosystem Markets 2012
3
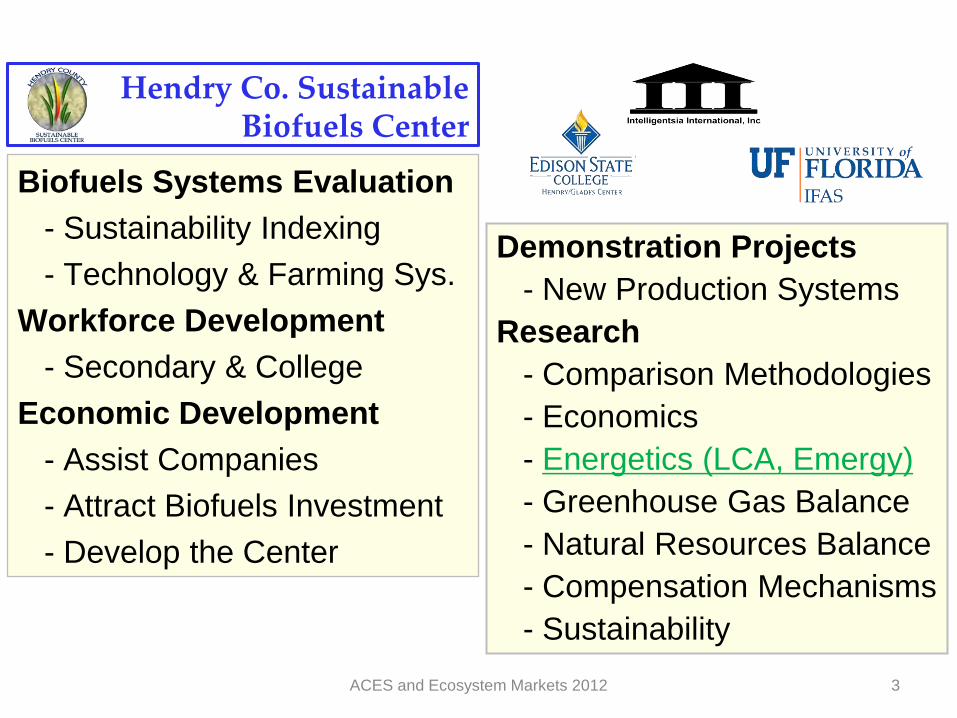
Hendry Co. Sustainable Biofuels Center
Demonstration Projects
- New Production Systems
Research
- Comparison Methodologies
- Economics
- Energetics (LCA, Emergy)
- Greenhouse Gas Balance
- Natural Resources Balance
- Compensation Mechanisms
- Sustainability
Biofuels Systems Evaluation
- Sustainability Indexing
- Technology & Farming Sys.
Workforce Development
- Secondary & College
Economic Development
- Assist Companies
- Attract Biofuels Investment
- Develop the Center
ACES and Ecosystem Markets 2012
ACES and Ecosystem Markets 2012 4
2. Project Summary
• Florida is being approached by businesses with
technologies that convert agronomic crops into
energy: Sugarcane, energycane, switchgrass,
sweet sorghum, etc.
• Florida has millions of acres of under utilized sand-
land.
• Focus on Sustainable Farming System (organic or
sandy)
• Preliminary Energetic Evaluations can help
interested parties in the decision-making process.
ACES and Ecosystem Markets 2012 5
3. Analytical Tools
PROS
Pollutant emissions
Comprehensive database
Cradle to grave perspective
Life Cycle Assessment
CONS
Difficult to include services and
labor in the same dataset
Does not account for ecological inputs
Difficulties in evaluating water
depletion
Human oriented
PROS
Includes services and labor using the
same unit (SeJ)
Includes natural inputs
Eco-centric point of view
Emergy Analysis
CONS
Does not include emissions
Lack of comprehensive database
Lack of process detail
Presentation Outline
1. Hendry County Sustainable Biofuels Center
2. Project Summary
3. Analysis Tools
4. Methodology
5. Results
6. Concluding Comments
6 ACES and Ecosystem Markets 2012
ACES and Ecosystem Markets 2012 7
Emergy Analysis – Sugarcane Biomass
ACES and Ecosystem Markets 2012 8
System Boundary Definition
System Components
(Farming system
breakdown)
Energy system
diagrams
Energy & Material
Flow Data
Emergy computations
Analysis
Materials and Methods
Mineral Soil 9 ACES and Ecosystem Markets 2012
Energy Systems Diagram
• Literature (EDIS,
Journals, Databases)
• Participatory observation
& experimentation
• Interviews with local
farmers
10 ACES and Ecosystem Markets 2012
Energy and Material Flow data
Unit Solar Solar
Data EMERGY* EMERGY
Note Item Unit (units/yr) (sej/unit) (E13 sej/yr)
1 Sun J 6.35E+13 1 6
2 Rain J 6.18E+10 3.02E+04 187
3 Et J 5.48E+10 2.59E+04 142
4 Water (irrigation) l 9.63E+06 2.25E+05 0.2
5 Net Topsoil Loss J 6.33E+08 1.24E+05 8
150
Operational inputs
6 Fuel (diesel, gasoline, lubricants) J 1.99E+10 1.11E+05 221
7 Electricity J 0.00E+00 2.69E+05 0
8 Machinery g 5.54E+04 1.12E+10 62
9 Potash g K 1.78E+05 1.85E+09 33
10 Dolomite (Lime) g 2.24E+06 1.68E+09 377
11 Slag g 3.36E+06 6.01E+06 2.0
12 Pesticides (insecticides, herbicides) $ 2.32E+02 2.30E+12 53
13 Phosphate g P 1.32E+04 3.70E+10 49
14 Nitrogen g N 4.40E+04 4.05E+10 178
15 Micronutrients (Fe, Mg, Mn, Zn) g 2.24E+04 1.45E+10 33
16 Labor J 2.71E+08 4.45E+06 120
17 Services $ 5.19E+02 4.03E+12 209
Sum of purchased inputs 1337
Total Emergy 1487
RENEWABLE RESOURCES
NONRENEWABLE STORAGES
Sum of free inputs (sun, rain omitted)
PURCHASED INPUTS
Emergy Evaluation of Sugarcane on mineral soil, per ha per year
Emergy Evaluation Table
11 ACES and Ecosystem Markets 2012
ACES and Ecosystem Markets 2012 12
Sustainability Indicators
Environmental Loading Ratio (ELR):
• Non-renewable resources from the economy and from the
environment divided by the renewable Inputs.
• A lower value favors a higher sustainability process.
% Renewability (%R):
• Renewable Input divided by total emergy.
• Higher value, greater the sustainability of the production system
Emergy Sustainability Index (ESI):
• Ratio of the EYR to ELR. To be sustainable the process must obtain
the highest yield ratio (EYR) at the lowest ELR.
Emergy Yield Ratio (EYR):
• Total emergy divided by total economic inputs.
• The higher the value, the lower the system’s reliance on economic
investment and the higher its economic competitiveness
Presentation Outline
1. Hendry County Sustainable Biofuels Center
2. Project Summary
3. Analysis Tools
4. Methodology
5. Results
6. Concluding Comments
13 ACES and Ecosystem Markets 2012
5. Results
14 ACES and Ecosystem Markets 2012
Main Emergy Contributors
• Top soil loss – major contributor for organic soil.
• Fertilizers and Lime – significant for mineral soil.
Emergy Indices Organic soil
(2009) Mineral soil
(2008) Mineral soil
(2010)
Emergy Yield Ratio 2.00 1.11 1.11
Env. Loading Ratio 8 9 9
% Renewable 11% 9% 10%
Emergy Sustainability Index
0.26 0.12 0.13
• Organic soil sugarcane has
economic advantages
• Soil subsidence takes years
or forever to replenish…a
major non-renewability
concern.
• Fertilizers + Lime form
dominant inputs for Mineral
soil. 15
5. Results cont.
• Emergy - Holistic method:
Quantified in a single unit or currency
Renewable and non renewable resources
Accounts for ecosystem services
• Way Forward - Gradual Expansion of sugarcane production
on Mineral soils:
Recycling some nutrients to reduce costs and thus
energy inputs might be an option.
Continuous surface water run-off could be stored on
fields to reduce additional water use.
Fuel-driven pumps could be modified or replaced with
electric pumps to reduce fossil emissions to the
environment.
16
6. Concluding Remarks
ACES and Ecosystem Markets 2012 17
Photo credit: Jose Alvarez, 2010, UF
ACES and Ecosystem Markets 2012 18
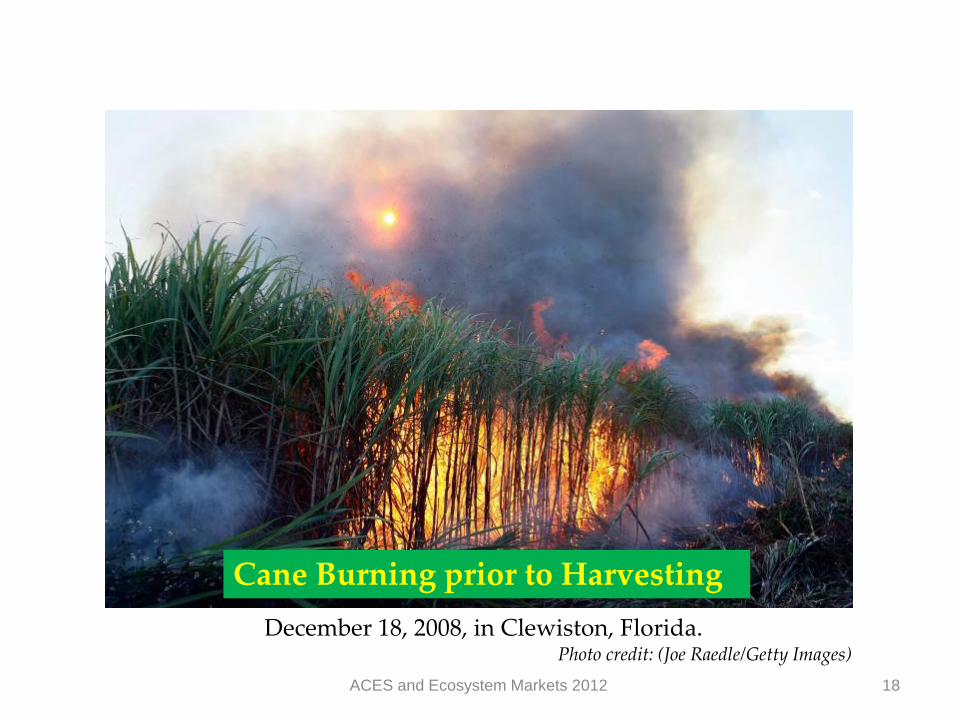
Cane Burning prior to Harvesting
Photo credit: (Joe Raedle/Getty Images)
December 18, 2008, in Clewiston, Florida.
ACES and Ecosystem Markets 2012 19
Photo credit: Jose Alvarez, 2010, UF
20
Thanks for Listening…
[email protected]