42
A PROJECT REPORT ON RATIO ANALYSIS OF TCS Submitted to:SUBMITTED BY Prof. Anil Tilak AmitLalchandani Bikash Sharma
| Date post: | 10-Apr-2015 |
| Category: |
Documents |
| Upload: | surbhi-lodha |
| View: | 306 times |
| Download: | 5 times |

A PROJECT REPORT
ON
RATIO ANALYSIS OF TCS
Submitted to:SUBMITTED BY
Prof. Anil Tilak
AmitLalchandani
Bikash Sharma
GarimaRajoria
HimanshuUpadhyay
Madhur Ahuja

CONTENTS
1) Company Profile
2) Ratio Analysis
3) Objective of the study
4) Calculations
5) Limitations
6) Bibliography

Tata Consultancy Services (TCS) is a software services and consulting company headquartered in Mumbai, India. TCS is the largest provider of information technology and business process outsourcing services in Asia. The company is listed on the National Stock Exchange and Bombay Stock Exchange of India.
Tata Consultancy Services was established in the year 1968 and is a pioneer in Information Technology Outsourcing and Management Industry. It began as the "Tata Computer Centre", for the company Tata Group whose main business was to provide computer services to other group companies. F C Kohli was the first general manager. JRD Tata was the first chairman, followed by NaniPalkhivala.
One of TCS' first assignments was to provide punched card services to a sister concern, Tata Steel (then TISCO). It later bagged the country's first software project, the Inter-Branch Reconciliation System (IBRS) for the Central Bank of India. It also provided bureau services to Unit Trust of India, thus becoming one of the first companies to offer BPO services.
In the early 1970s, Tata Consultancy Services started exporting its services. TCS's first international order came from Burroughs, one of the first business computer manufacturers. This experience also helped TCS bag its first onsite project - the Institutional Group & Information Company (IGIC), a data centre for ten banks, which catered to two million customers in the US.
In 1981, TCS set up India's first software research and development center, the Tata Research Development and Design Center (TRDDC). The first client-dedicated offshore development center was set up for Compaq (then Tandem) in 1985.
In the early 1990s, the Indian IT outsourcing industry grew tremendously due to the Y2K bug and the launch of a unified European currency, Euro. TCS pioneered the factory model for Y2K conversion and developed software tools which automated the conversion process and enabled third-party developers and clients to make use of it.
In 1999, TCS saw outsourcing opportunity in E-Commerce and related solutions and set up its E-Business division with ten people. By 2004, E-Business was contributing half a billion dollars (US) to TCS.
On 9 August 2004, TCS became a publicly listed company, much later than its rivals, Infosys, Wipro and Mahindra Satyam.
In 2008, the company went through an internal restructuring exercise that executives claim would bring about agility to the organization.
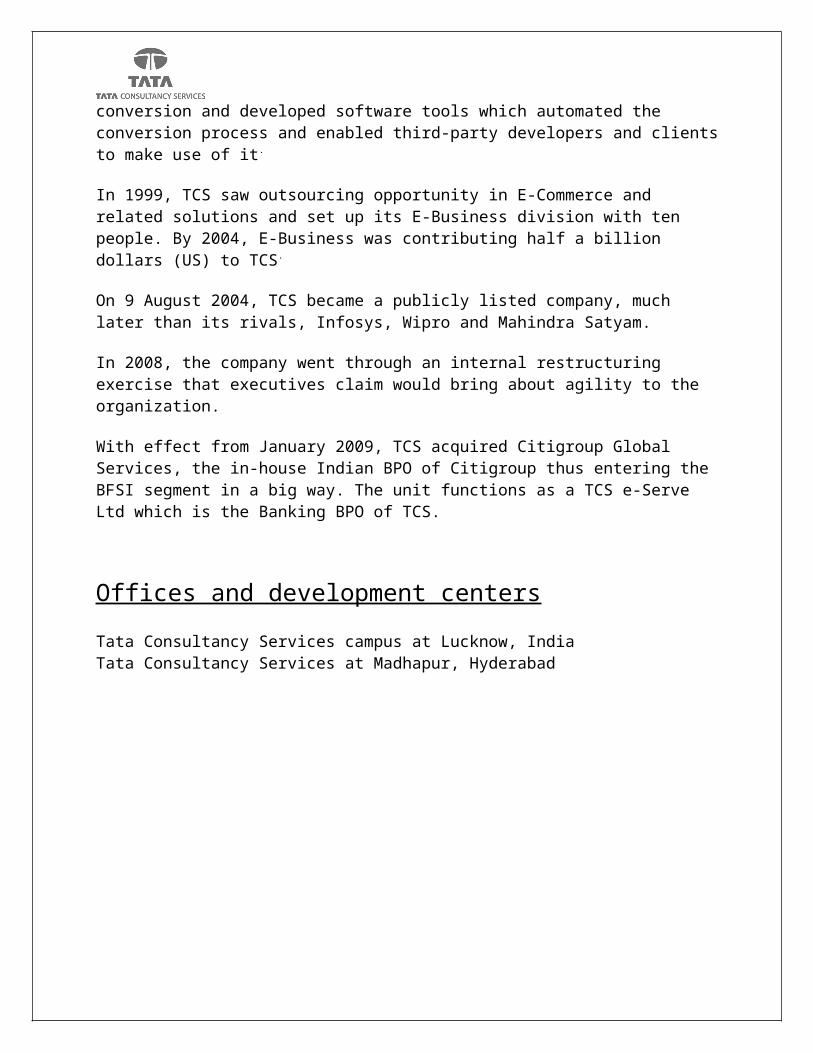
With effect from January 2009, TCS acquired Citigroup Global Services, the in-house Indian BPO of Citigroup thus entering the BFSI segment in a big way. The unit functions as a TCS e-Serve Ltd which is the Banking BPO of TCS.
Offices and development centers
Tata Consultancy Services campus at Lucknow, IndiaTata Consultancy Services at Madhapur, Hyderabad
Indian branches
TCS has development centres and/or regional offices in the following Indian cities: Ahmedabad,
Bangalore, Baroda, Bhubaneswar, Chennai, Coimbatore, Dehradun, Delhi, Gandhinagar, Goa,
Gurgaon, Guwahati, Hyderabad, Jaipur, Jamshedpur, kochi, Kolkata, Lucknow, Mumbai, Noida,
Pune, Thiruvananthapuram.
Global units
Africa : South Africa, Morocco.
Asia (outside India) : Bahrain, China, Hong Kong, Indonesia, Israel, Japan, Malaysia, Saudi Arabia, Singapore, South Korea, Taiwan, Thailand, UAE
Australia : Australia
Europe : Belgium, Denmark, Finland, France, Germany, Hungary, Iceland, Ireland, Italy, Luxembourg, Netherlands, Norway, Portugal, Spain, Sweden, Switzerland, United Kingdom
North America : Canada, Mexico, USA
South America : Argentina, Brazil, Chile, Colombia, Ecuador, Uruguay, Peru

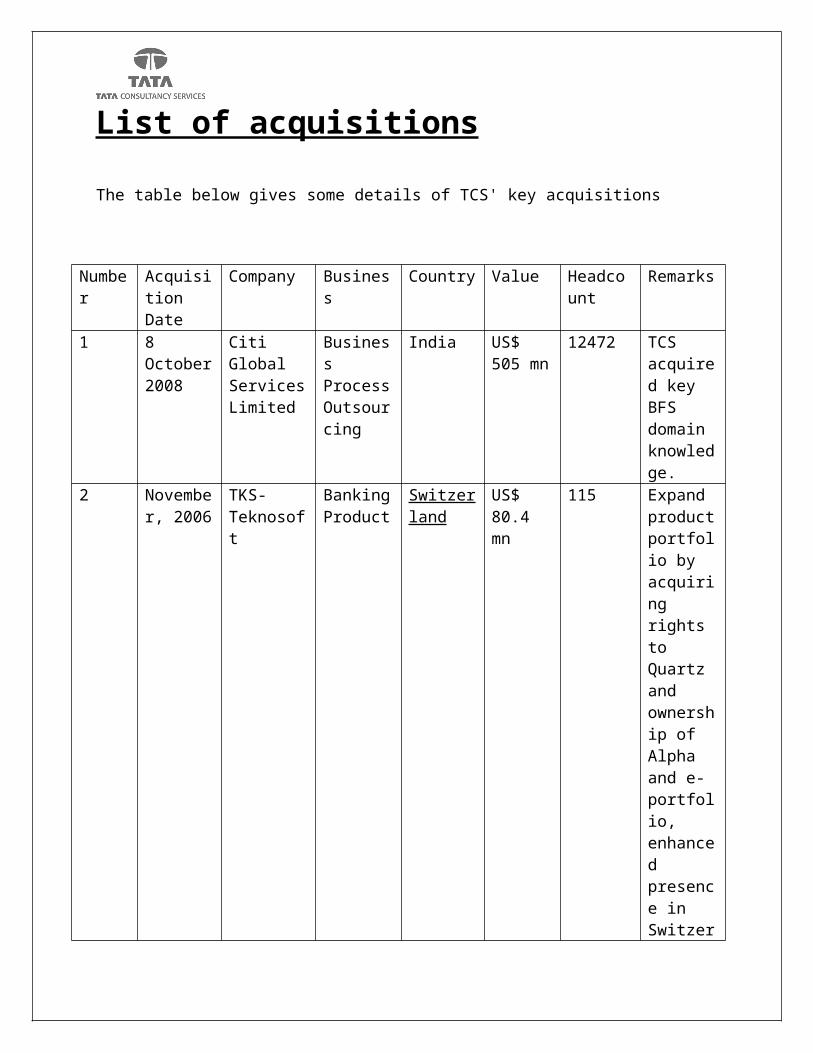
List of acquisitions
The table below gives some details of TCS' key acquisitions
Number
Acquisition Date
Company Business Country Value Headcount
Remarks
1 8 October 2008
Citi Global Services Limited
Business Process Outsourcing
India US$ 505 mn
12472 TCS acquired key BFS domain knowledge.
2 November, 2006
TKS-Teknosoft
Banking Product
Switzerland
US$ 80.4 mn
115 Expand product portfolio by acquiring rights to Quartz and ownership of Alpha and e-portfolio, enhanced presence in Switzerland and France
3 November, 2005
Comicrom Banking BPO
Chile US$ 23.7 mn
1257 Entry into Latin America; Access to payment processing platform
4 February, 2006
2006 Tata Infotech
IT Services
India - - -
5 October, 2005
FNS Core Banking Product
Australia US$ 26 mn
190 Acquired core banking
solution product and access to 116 customers in 35 countries; FNS was an existing partner for TCS
6 October, 2005
Pearl Group Insurance United Kingdom
US$ 94.7 mn
950 Acquired life and pension outsourcing business from Pearl Group; Domain knowledge of life and pension underwriting business
7 November 2006
TCS Management
IT Services
Australia US$ 13.0 mn
35 Access to Australian clients
8 May 2004 Phoenix Global Solutions
BPO India US$ 13 mn
350 Acquire expertise in insurance
9 May 2005 Swedish Indian IT Resources AB (SITAR)
IT Services
Sweden US$ 4.8 mn
- Acquire blue-chip European customers like Ericsson, IKEA, Vattenfall and Hutchison; SITAR was TCS’ exclusive partner in

Sweden and a non-exclusive partner in Norway.
10 May 2004 Aviation Software Development Consultancy India (ASDC)
IT Services
India - 180 ASDC was a Singapore Airlines-TCS JV; Acquired Singapore Airlines as a major client
11 January 2004
Airline Financial Support Services India (AFS)
BPO India US$ 5.1 mn
316 BPO expertise in Airline and Hospitality sector
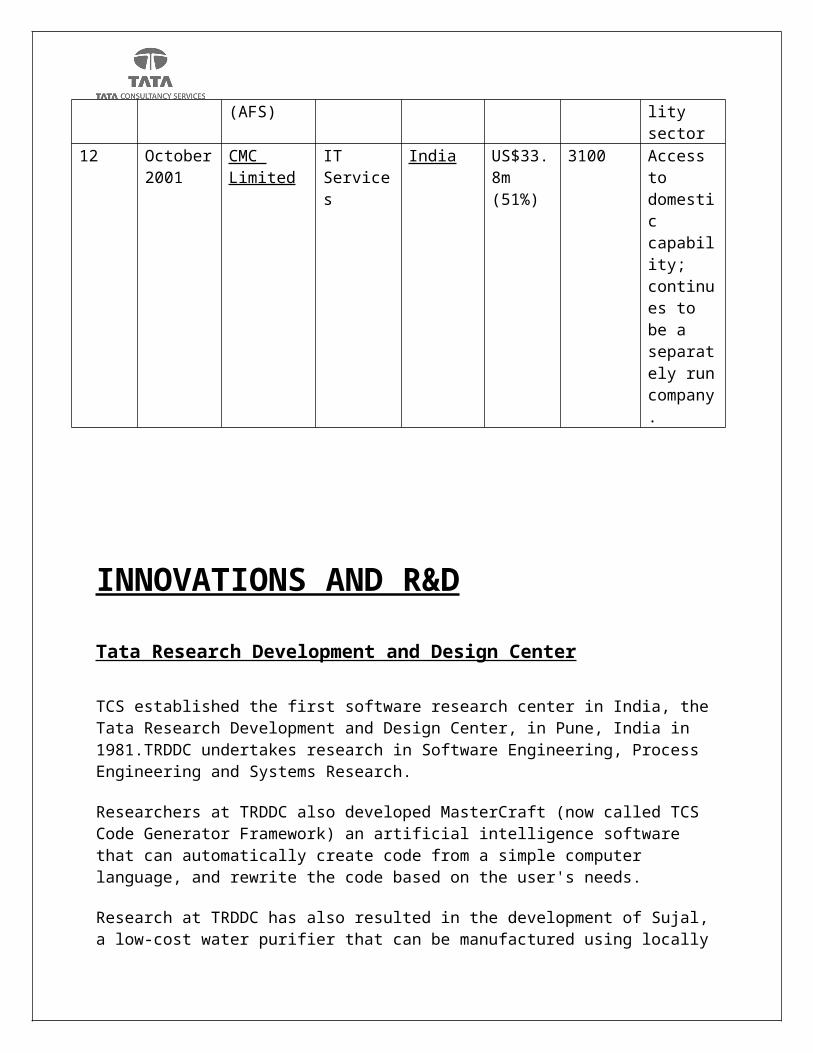
12 October 2001
CMC Limited
IT Services
India US$33.8m (51%)
3100 Access to domestic capability; continues to be a separately run company.
INNOVATIONS AND R&D
Tata Research Development and Design Center
TCS established the first software research center in India, the Tata Research Development and Design Center, in Pune, India in 1981.TRDDC undertakes research in Software Engineering, Process Engineering and Systems Research.

Researchers at TRDDC also developed MasterCraft (now called TCS Code Generator Framework) an artificial intelligence software that can automatically create code from a simple computer language, and rewrite the code based on the user's needs.
Research at TRDDC has also resulted in the development of Sujal, a low-cost water purifier that can be manufactured using locally available resources. TCS deployed thousands of these filters in the Indian Ocean Tsunami disaster of 2004 as part of its relief activities. This product has been marketed in India as Swach, a low cost water purifier.
Innovation
In 2007, TCS launched its Co-Innovation Network, a network of TCS Innovation Labs, startup alliances, University Research Departments, and venture capitalists.
In addition to TRDDC, TCS has 19 Innovation Labs based in three countries.
TCS Innovation Lab, Convergence: Content management and delivery, convergence engines, networks such as 3G, WiMax, WiMesh, IP Testing for Quality of Service, IMS, OSS/BSS systems, and others.
TCS Innovation Lab, Delhi: Software Architectures, Software as a Service, natural language processing, text, data and process analytics, multimedia applications and graphics.
TCS Innovation Lab, Embedded Systems:Medical electronics, WiMAX, and WLAN technologies.
TCS Innovation Lab, Hyderabad: Computational methods in life sciences, meta-genomics, systems biology, e-security, smart card-based applications, digital media protection, nano-biotechnology, quantitative finance.
TCS Innovation Lab, Mumbai: Speech and natural language processing, wireless systems and wireless applications.
TCS Innovation Lab, Insurance - Chennai:IT Optimization, Business Process Optimization, Customer Centricity Enablers, Enterprise Mobility, Telematics, Text Analytics, 2D Barcodes, Mashups, Innovation in Product Development and Management (PLM) for Insurance.
TCS Innovation Lab, Chennai: Infrastructure innovation, green computing, Web 2.0 and next-generation user interfaces.
TCS Innovation Lab, Peterborough, England: New-wave communications for the enterprises, utility computing and RFID (chips, tags, labels, readers and middleware).
TCS Innovation Lab: Performance Engineering, Mumbai: Performance management, high performance technology components, and others.
TCS Innovation Lab, Cincinnati, United States: Engineering and Manufacturing IT solutions.
Some of the assets created by TCS Innovation Labs are DBProdem, Jensor, Wanem, Scrutinet.

In 2008, the TCS Innovation Lab-developed product, mKrishi, won the Wall Street Journal Technology Innovation Award in the Wireless category. mKrishi is a service that would enable India's farmers to receive useful data on an inexpensive mobile device.
TCS' Co-Innovation Network partners include Collabnet, Cassatt, MetricStream, academic institutions such as Stanford, MIT, various IITs, and venture capitalists like Sequoia and Kleiner Perkins.
Employees
TCS is considered one of the largest private sector employers in India with core strength in excess of 160,000 individuals. TCS has one of the lowest attrition rates in the Indian IT industry.
US Visa Program
TCS was the fourth largest visa recipient in 2008, preceded by Infosys, Wipro and Satyam.
Ratio analysis
Ratio analysis is a widely used tool of financial analysis. The term ratio in it refers to the relationship expressed in mathematical terms between two individual figures or group of figures connected with each other in some logical manner and are selected from financial statements of the concern. The ratio analysis is based on the fact that a single accounting figure by itself may not communicate any meaningful information but when expressed as a relative to some other figure, it may definitely provide some significant information the relationship between two or more accounting figure/groups is called a financial ratio helps to express the relationship between two accounting figures in such a way that users can draw conclusions about the performance, strengths and weakness of a firm.
Classification of ratios:
A) Liquidity ratios
B) Leverage ratios
C) Activity ratios
D) Profitability ratios
A) LIQUIDITY RATIOS
These ratios portray the capacity of the business unit to meet its short term obligation from
its short-term resources (e.g.) current ratio, quick ratio.
i) Current ratio
Current ratio may be defined as the relationship between current assets and current
liabilities it is the most common ratio for measuring liquidity. It is calculated by dividing current
assets and current liabilities. Current assets are those, the amount of which can be realized with
in a period of one year. Current liabilities are those amounts which are payable with in a period
of one year.
Current assets
Current assets = -------------------------
Current liabilities

ii) Liquid Ratio
The term ‘liquidity’ refers to the ability of a firm to pay its short-term
obligation as and when they become due. The term quick assets or liquid assets refers current
assets which can be converted into cash immediately it comprises all current assets except stock
and prepaid expenses it is determined by dividing quick assets by quick liabilities.
Liquid assets
Liquid ratio = -------------------------
Liquid liabilities
iii) Absolute liquidity ratio
Absolute liquid assets include cash, bank, and marketable securities. This ratio
Obtained by dividing cash and bank and marketable securities by current liabilities.
Cash + bank +marketable securities
Absolute liquidity ratio = ----------------------------------------------
Current liabilities

B) LEVERAGE RATIOS
Many financial analyses are interested in the relative use of debt and equity in the firm.
The term ‘solvency’ refers to the ability of a concern to meet its long-term obligation.
Accordingly, long-term solvency ratios indicate a firm’s ability to meet the fixed interest and
costs and repayment schedules associated with its long-term borrowings. (E.g.) debt equity ratio,
proprietary ratio, etc….
i) Debt equity ratio
It expresses the relationship between the external equities and internal equities or the
relationship between borrowed funds and ‘owners’ capital. It is a popular measure of the long-
term financial solvency of a firm. This relationship is shown by the debt equity ratio. This ratio
indicates the relative proportion of dept and equity in financing the assets of a firm. This ratio is
computed by dividing the total debt of the firm by its equity (i.e.) net worth.
Outsider’s funds
Debt equity ratio = ------------------------------
Proprietor’s funds
ii) Proprietary ratio
Proprietary ratio relates to the proprietors funds to total assets. It reveals the owners
contribution to the total value of assets. This ratio shows the long-time solvency of the business
it is calculated by dividing proprietor’s funds by the total tangible assets.
Proprietor’s funds
Proprietary ratio = ---------------------------
Total tangible assets

C) ACTIVITY RATIOS
These ratios evaluate the use of the total resources of the business concern along with the
use of the components of total assets. They are intended to measure the effectiveness of the
assets management the efficiency with which the assts are used would be reflected in the speed
and rapidity with which the assets are converted into sales. The greater the rate of turnover, the
more efficient the management would be (E.g.) stock turnover ratio, fixed assets turnover ratios
etc….
i) Stock turnover ratio
This ratio indicates whether investment is inventory is efficiently used or not it explains
whether investment in inventories in with in proper limits or not. It also measures the
effectiveness of the firms’ sales efforts the ratio is calculated as follows.
Cost of goods sold
Stock turnover ratio = -----------------------------
Average stock
Opening Stock + Closing Stock
Average stock = -----------------------------------------
2
ii) Fixed assets turnover ratio
The ratio indicates the extent to which the investments in fixed assets contribute towards
sales. If compared with a pervious year. It indicates whether the investment infixed assets has
been judious or not the ratio is calculated as follows.
Net sales
Fixed assets turnover ratio = -------------------
Fixed assets
iii)Working capital turnover ratio
Working capital turnover ratio indicates the velocity of the utilization of net working
capital. This ratio indicates the number of times the working capital is turned over in the course
of a year. It is a good measure over –trading and under-trading.
Net sales
Working capital turnover ratio = ----------------------------
Net working capital
iv) Return on total assets
Profitability can be measured in terms of relationship between net profit and total
assets. It measures the profitability of investment. The overall profitability can be known by
applying this ratio.
Net profit
Return on total assets = ----------------------------- x100
Total assets

D)PROFITABILITY RATIOS
The profitability ratios of a business concern can be measured by the profitability ratios.
These ratios highlight the end result of business activities by which alone the over all
efficiency of a business unit can be judged, (E.g.) gross ratios, Net profit ratio.
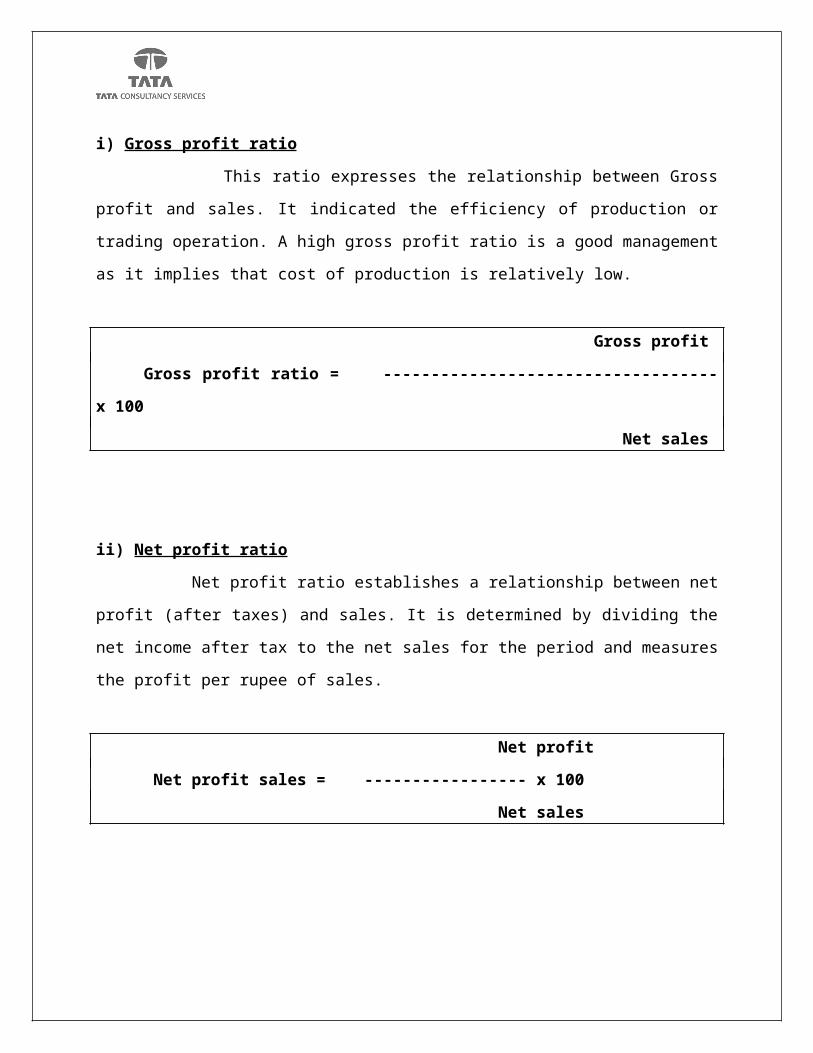
i) Gross profit ratio
This ratio expresses the relationship between Gross profit and sales. It indicated the
efficiency of production or trading operation. A high gross profit ratio is a good management as
it implies that cost of production is relatively low.
Gross profit
Gross profit ratio = ----------------------------------- x 100
Net sales
ii) Net profit ratio
Net profit ratio establishes a relationship between net profit (after taxes) and sales. It is
determined by dividing the net income after tax to the net sales for the period and measures the
profit per rupee of sales.
Net profit
Net profit sales = ----------------- x 100
Net sales

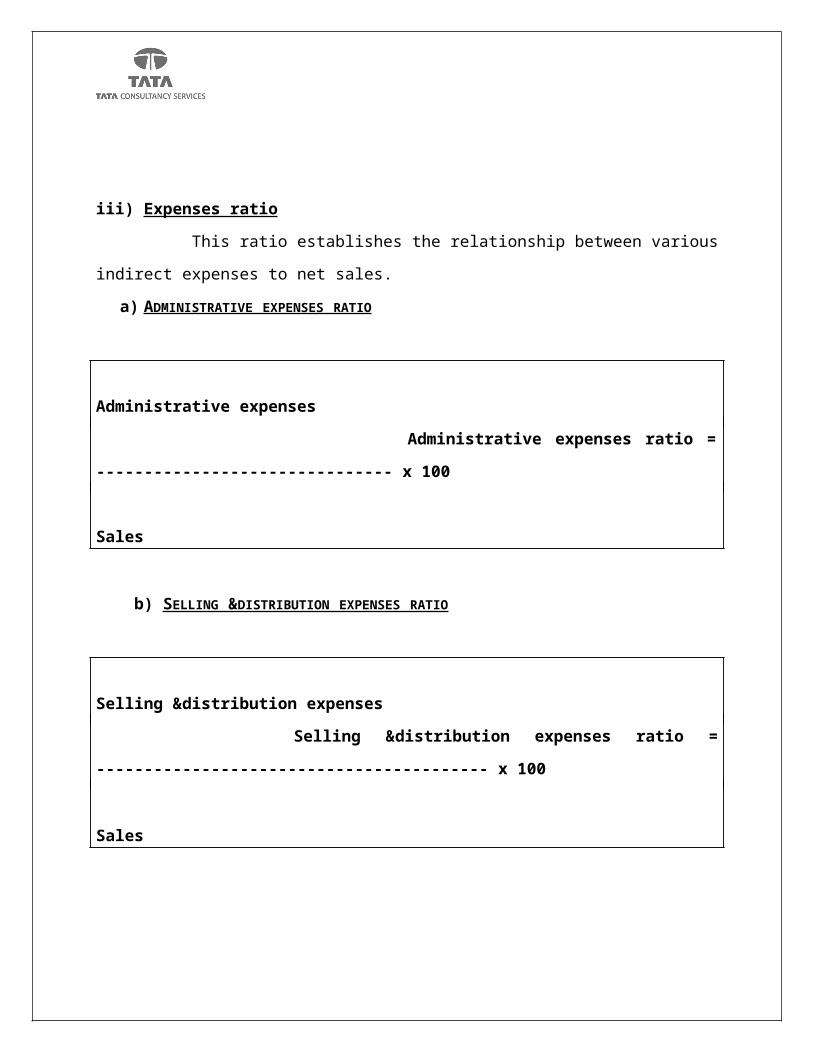
iii) Expenses ratio
This ratio establishes the relationship between various indirect expenses to net sales.
a) ADMINISTRATIVE EXPENSES RATIO
Administrative expenses
Administrative expenses ratio = ------------------------------- x 100
Sales
b) SELLING &DISTRIBUTION EXPENSES RATIO
Selling &distribution expenses
Selling &distribution expenses ratio = ----------------------------------------- x 100
Sales

OBJECTIVES OF THE STUDY
The basic objective of studying the ratios of the company is to know the financial position of the company.
To know the borrowings of the company as well as the liquidity position of the company.
To study the current assets and current liabilities so as to know weather the shareholders could invest in Tata Consultancy Services or not.
To study the profits of the business and net sales of the business and to know the stock reserve for sales of the business.
To know the solvency of the business and the capacity to give interest to the long term loan lenders (debenture holders) and dividend to the share holders.

CALCULATIONS
(A) Current Assets Ratio
Year 2008 2009 2010
Current Assets 7396.76 9250.7910837.0
8Current Liabilities 3713 5054.41 7279.35
Current Ratio1.99212
51.83024
11.48874
3
2008 2009 20100
0.5
1
1.5
2
2.5
Current Ratio
Current Ratio
The above diagram shows the Current Ratio of TCS for the year 2008-2010.The current Ratio is declining every year.The normal current ratio is 2:1.Though there is a decline in the current ratio but the company is still enjoying its credit worthiness.

(B) Liquid Ratio
Year 2008 2009 2010Liquid Assets 7379.27 9233.84 10830.3Current Liabilities 3713 5054.41 7279.35
Liquid ratio1.98741
41.82688
81.48781
1
2008 2009 20100
0.5
1
1.5
2
2.5
Liquid ratio
Liquid ratio
The above diagram shows the Liquid Ratio of TCS for the year 2008-2010.Liquid ratio us declining every year. The liquid ratio of TCS is more than the standard liquid ratio i.e. 1:1. It signifies that the firm is able to meet it’s short term obligations in time.
(C)Debt Equity Ratio
Year 2008 2009 2010Outsider's Fund 18.25 40.37 35.74Proprietor's Fund 197.86 197.86 295.72
Debt Equity Ratio0.09223
70.20403
30.12085
8
2008 2009 20100
0.05
0.1
0.15
0.2
0.25
Debt Equity Ratio
Debt Equity Ratio
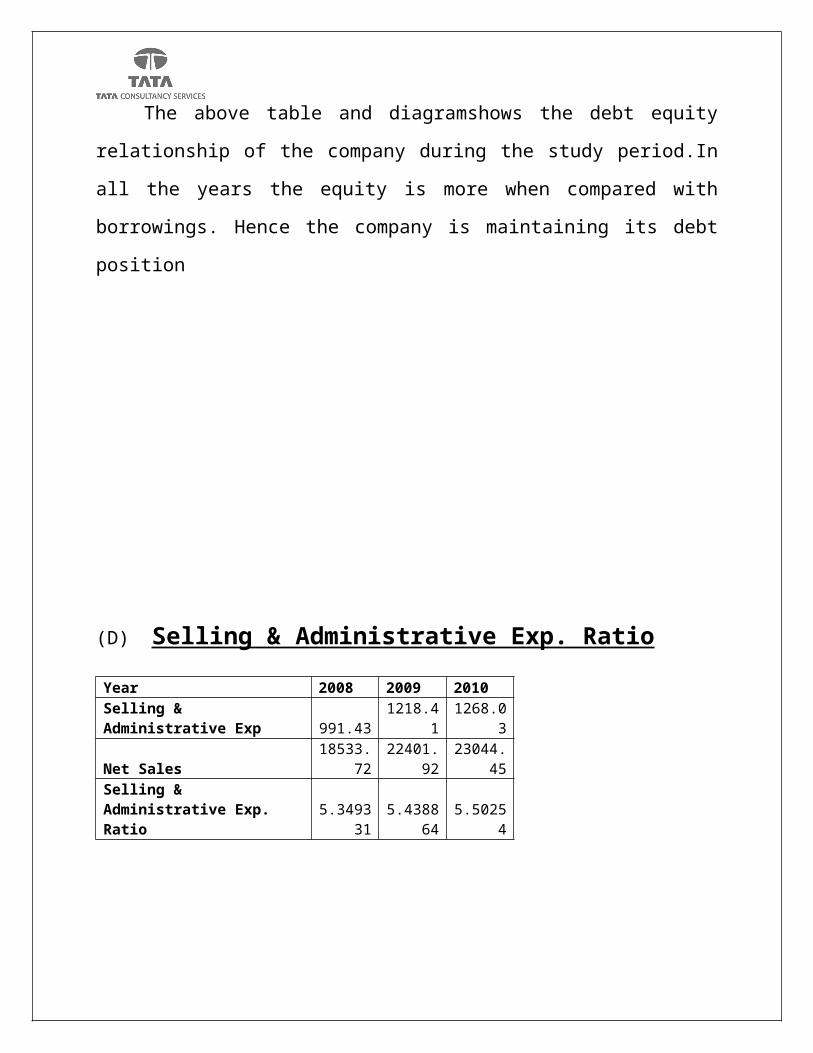
The above table and diagramshows the debt equity relationship of the
company during the study period.In all the years the equity is more when
compared with borrowings. Hence the company is maintaining its debt position
(D) Selling & Administrative Exp. Ratio
Year 2008 2009 2010Selling & Administrative Exp 991.43 1218.41 1268.03
Net Sales18533.7
222401.9
223044.4
5Selling & Administrative Exp. Ratio
5.349331
5.438864 5.50254
2008 2009 20105.25
5.3
5.35
5.4
5.45
5.5
5.55
Selling & Administrative Exp. Ratio
Selling & Administrative Exp. Ratio
The ratio shows selling and administrative expenses against the sales.The graph
shows that the ratio is increasing this is because the sales are increasing, so is the
cost associated with it.
(E)Stock turnover ratio
Year 2008 2009 2010
Net Sales18533.7
222401.9
223044.4
5Average Stock 17.19 16.95 6.78
Stock Turnover Ratio1078.16
91321.64
73398.88
6
2008 2009 20100
500
1000
1500
2000
2500
3000
3500
4000
Stock Turnover Ratio
Stock Turnover Ratio
The above table and diagram shows the relation ship between Net sales and average stock. A high inventory ratio of TCS means that the company is efficiently managing and selling its inventory. The faster the inventory sells, the less funds the company has tied up.
(F) Fixed Assets Turnover Ratio
Year 2008 2009 2010Net Sales 18533.72 22401.92 23044.45Fixed Assets 3240.64 4359.24 4871.27Fixed Assets Turnover Ratio 5.719154 5.138951 4.730686
2008 2009 20100
1
2
3
4
5
6
7
Fixed Assets Turnover Ratio
Fixed Assets Turnover Ra-tio
The above table and diagram shows the relationship between the fixed assets and sales. A higher fixed-asset turnover ratio shows that the company has been more effective in using the investment in fixed assets to generate revenues.
But in case of TCS both the Net Sales and value of fixed assets have increased but the percentage change in fixed assets is much more than that of the change in Net Sales.

(G) Working Capital Turnover Ratio
Year 2008 2009 2010
Net Sales18533.7
222401.9
223044.4
5
Current Assets 7396.76 9250.7910837.0
8Current Liabilities 3713 5054.41 7279.35Working Capital 3683.76 4196.38 3557.73
Working Capital Turnover Ratio5.03119
65.33839
2 6.47729
2008 2009 20100
1
2
3
4
5
6
7
Working Capital Turnover Ratio
Working Capital Turnover Ratio
The above table and diagram shows the relation ship between net working capital and net sales.As the above ratio is increasing it means that the company is generating a lot of sales compared to the money it uses to fund the sales.
(H) Return on total assets
Year 2008 2009 2010Net Profit 4508.76 4696.21 5618.51
Total Assets11023.0
613486.6
215152.3
6
Return on Total Assets40.9029
834.8212
5 37.0801
2008 2009 201030
32
34
36
38
40
42
Return on Total Assets
Return on Total Assets

The above table and diagram shows the relation ship between the total assets to net sales. In 2008 the return on assets was comparatively high as compared to 2009. The ROA figure gives investors an idea of how effectively the company is converting the money it has to invest into net income
(I)Gross Profit Ratio
2008 2009 201025.5
26
26.5
27
27.5
28
28.5
29
29.5
Gross Profit Ratio
Gross Profit Ratio
Year 2008 2009 2010Gross Profit 5025.61 6020.83 6667.17
Net Sales18533.7
222401.9
223044.4
5
Gross Profit Ratio27.1160
3 26.876428.9317
8

The above table and diagram shows the relation ship between the gross profit and net sales in percentage. It can be seen that the G.P ratio is almost constant for the period of study.
(J) Net profit ratio
Year 2008 2009 2010Net Profit 4508.76 4696.21 5618.51
Net Sales18533.7
222401.9
223044.4
5
Net Profit Ratio24.3273
320.9634
324.3811
9
2008 2009 201019
20
21
22
23
24
25
Net Profit Ratio
Net Profit Ratio

The above table and diagram shows the relation ship between net profit and net sales. The above graph shows that the N.P ratio decreased in 2009 as compared to 2008 but again increased in 2010.
LIMITATIONS
The analysis was made with the help of the secondary data collected from
the company balance sheet
The period of study is 3 years from 2008-2010.
BIBLIOGRAPHY
1) www.investopedia.com/university/ratios/ 2) http://www.moneycontrol.com/financials/tataconsultancyservices/balance-
sheet/TCS