30
ACERINOX GROUP: NOVEMBER 2010 Miguel Ferrandis CFO of Acerinox Group Spain Investors Day Hotel Ritz, Madrid 22-23 th November 2010
| Date post: | 31-Oct-2018 |
| Category: |
Documents |
| Upload: | nguyenxuyen |
| View: | 214 times |
| Download: | 0 times |

ACERINOX GROUP: NOVEMBER 2010
Miguel FerrandisCFO of Acerinox Group
Spain Investors Day
Hotel Ritz, Madrid
22-23th November 2010

0
2,000
4,000
6,000
8,000
10,000
12,000
14,000
16,000
18,000
20,000
22,000
24,000
26,000
28,000
30,000
50 60 70 80 90 00 09 Source: VALE INCO e ISSF
Compound annual growth rate
Years 1950-2009: +5.5%
Thousand Mt.WORLD PRODUCTION OF STAINLESS STEEL
ACERINOX GROUP: Spain Investors Day
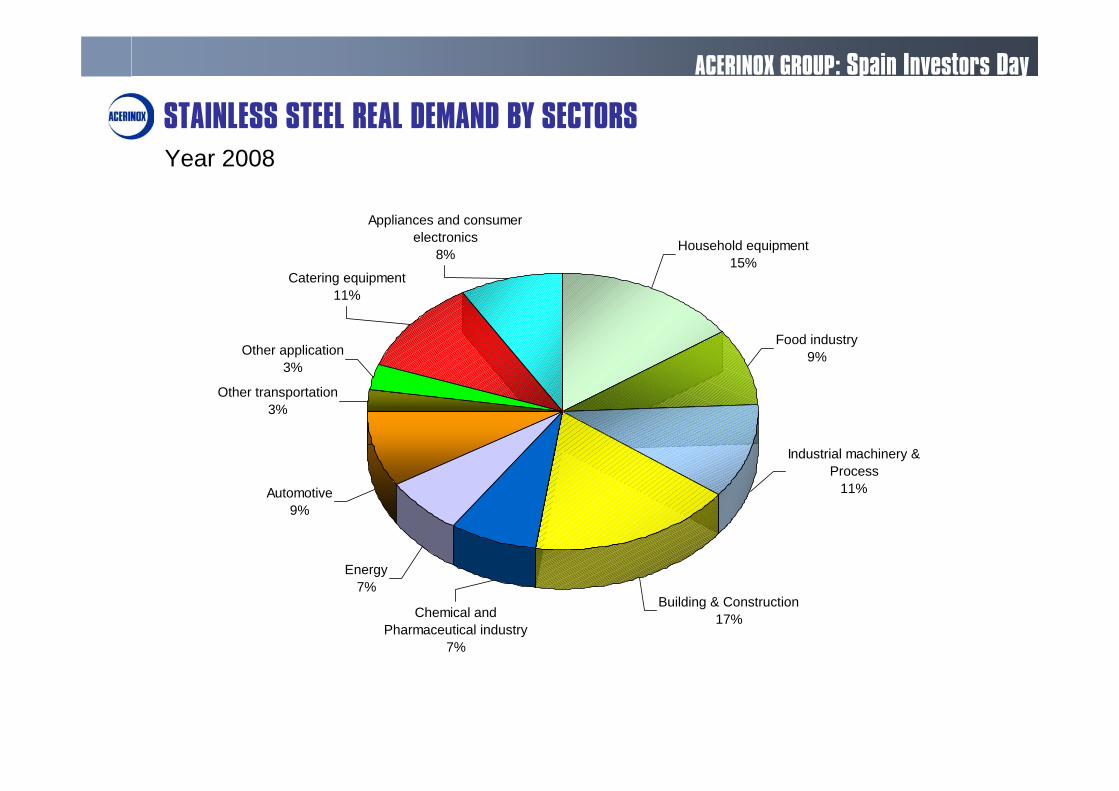
Other transportation3%
Other application3%
Appliances and consumer electronics
8%
Food industry9%
Automotive9%
Energy7%
Chemical and Pharmaceutical industry
7%
Building & Construction17%
Industrial machinery & Process
11%
Household equipment15%
Catering equipment11%
STAINLESS STEEL REAL DEMAND BY SECTORSYear 2008
ACERINOX GROUP: Spain Investors Day

3.06
3.52
2.49
3.06
4.69
5.03
Lead
Copper
Zinc
Aluminium
Steel withoutstainless steel
Stainless steel
Average 3.36
GROWTH OF STAINLESS STEEL AND ALTERNATIVE METALIC MATERIALS (Years 1995-2009)Compound annual growth in % per year
Source: ISSF
ACERINOX GROUP: Spain Investors Day
0
5,000
10,000
15,000
20,000
25,000
30,000
35,000
40,000
45,000
50,000
55,000
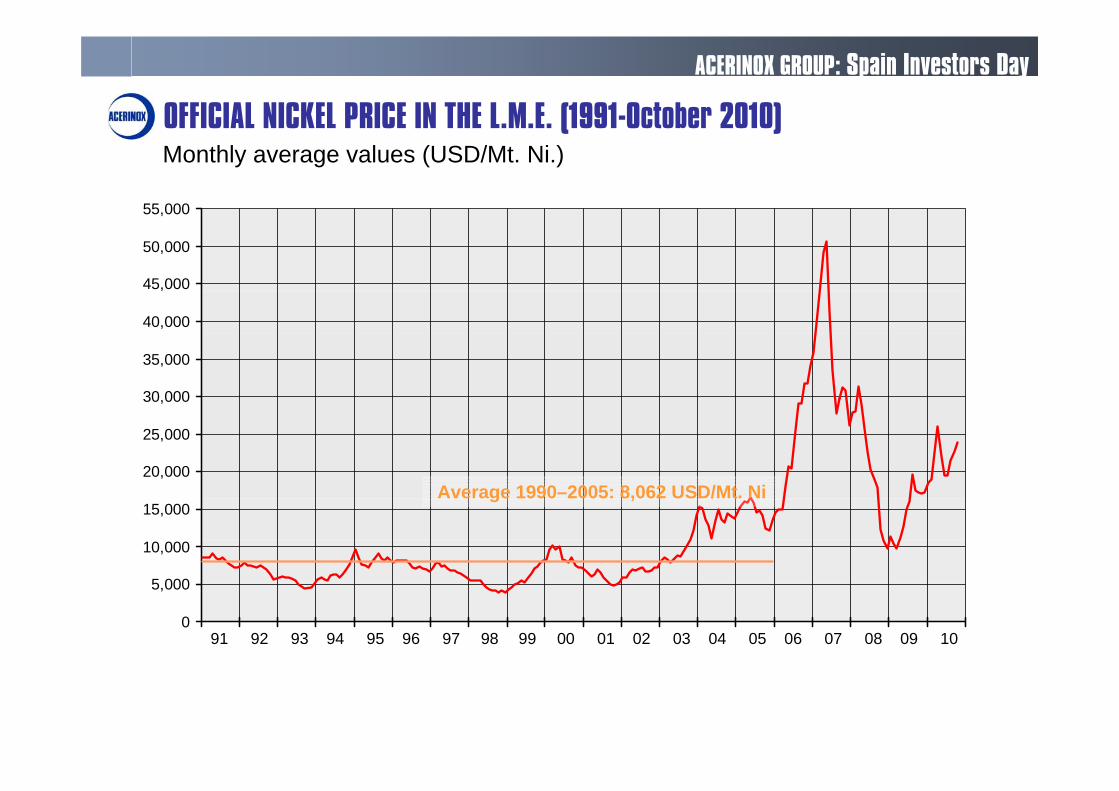
Average 1990–2005: 8,062 USD/Mt. Ni
91 92 93 94 95 96 97 98 99 00 01 02 03 04 05 06 07 08 09 10
OFFICIAL NICKEL PRICE IN THE L.M.E. (1991-October 2010)Monthly average values (USD/Mt. Ni.)
ACERINOX GROUP: Spain Investors Day
1,000
1,500
2,000
2,500
3,000
3,500
4,000
4,500
5,000
5,500
6,000
6,500
7,000
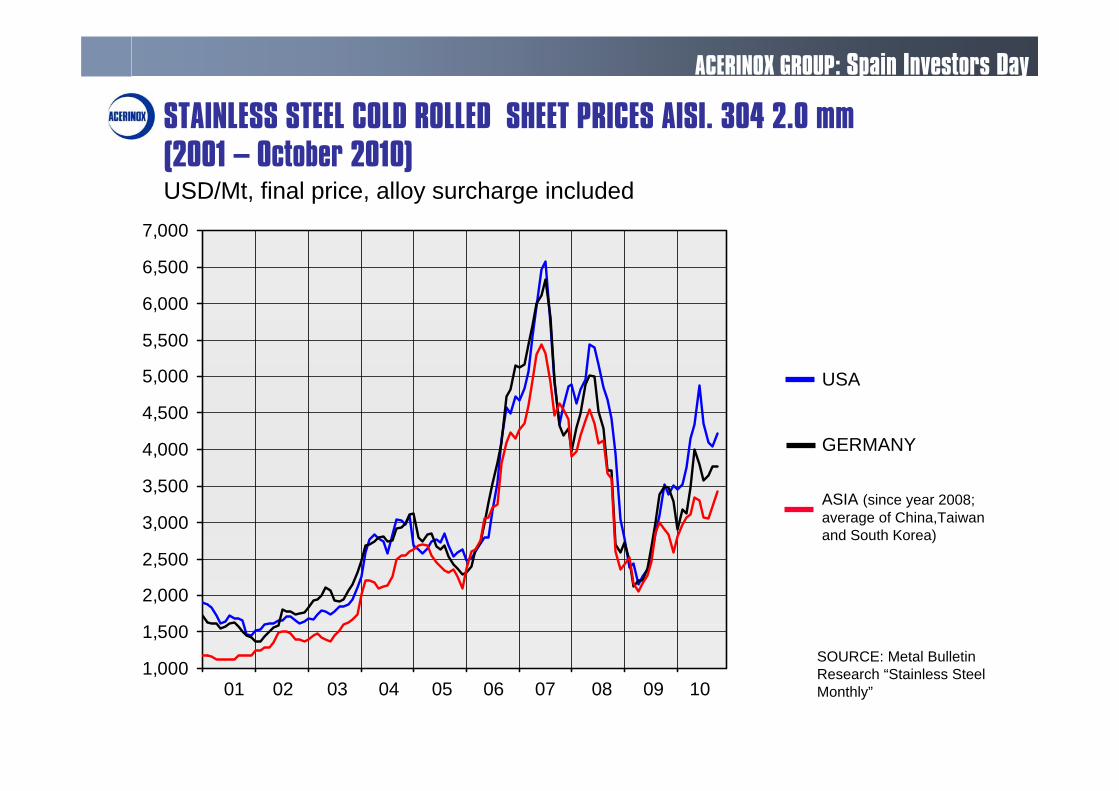
USA
GERMANY
SOURCE: Metal BulletinResearch “Stainless SteelMonthly”
ASIA (since year 2008; average of China,Taiwanand South Korea)
01 02 03 04 05 06 07 08 09 10
STAINLESS STEEL COLD ROLLED SHEET PRICES AISI. 304 2.0 mm(2001 – October 2010)USD/Mt, final price, alloy surcharge included
ACERINOX GROUP: Spain Investors Day

0
500
1,000
1,500
2,000
2,500
3,000
3,500
4,000
4,500
5,000
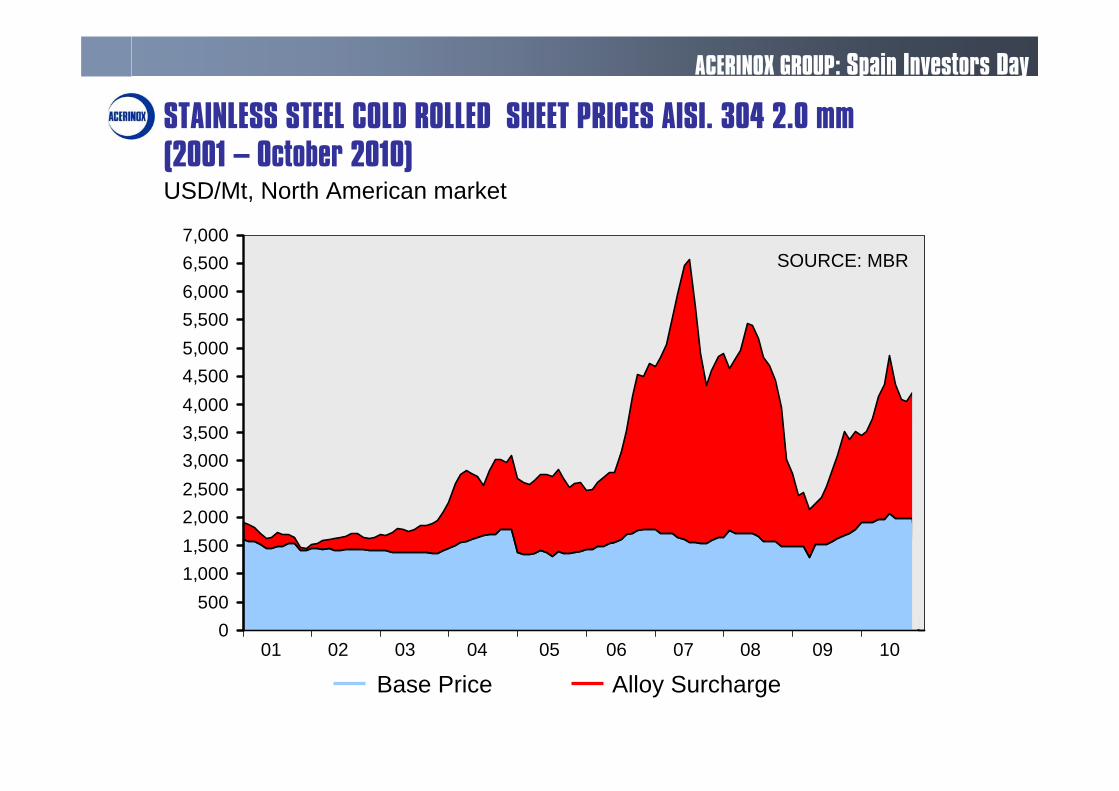
Base Price Alloy Surcharge
01 02 03 04 05 06 07 08 09 10
STAINLESS STEEL COLD ROLLED SHEET PRICES AISI. 304 2.0 mm(2001 – October 2010)€/Mt, German market
SOURCE: MBR
ACERINOX GROUP: Spain Investors Day
0500
1,0001,5002,0002,5003,0003,5004,0004,5005,0005,5006,0006,5007,000
Base Price Alloy Surcharge01 02 03 04 05 06 07 08 09 10
SOURCE: MBR
STAINLESS STEEL COLD ROLLED SHEET PRICES AISI. 304 2.0 mm(2001 – October 2010)USD/Mt, North American market
ACERINOX GROUP: Spain Investors Day
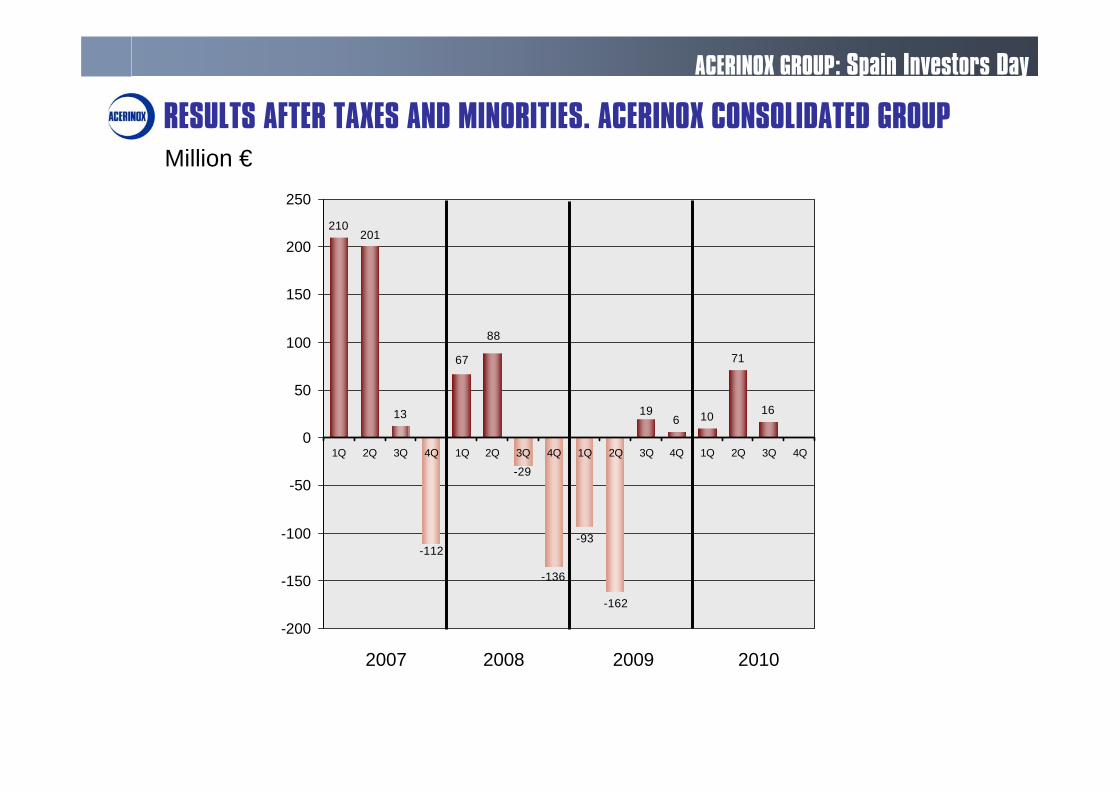
210
13
-93
6 10
71
16
-112
-29
-136
19
201
-162
88
67
-200
-150
-100
-50
0
50
100
150
200
250
1Q 2Q 3Q 4Q 1Q 2Q 3Q 4Q 1Q 2Q 3Q 4Q 1Q 2Q 3Q 4Q
2008 2009 2010
RESULTS AFTER TAXES AND MINORITIES. ACERINOX CONSOLIDATED GROUPMillion €
2007
ACERINOX GROUP: Spain Investors Day

CONDENSED PROFIT & LOSS ACOUNT. ACERINOX CONSOLIDATED GROUP
Million € 1º Q. 10 2º Q. 10 3º T.10 2010 2009 Variation
Net sales 999,39 1.172,80 1.176,40 3.348,59 2.501,45 33,9%
Gross margin 262,56 382,62 290,74 935,92 393,88 137,6%% over sales 26,3% 32,6% 24,7% 27,9% 15,7%
EBITDA (*) 61,03 172,11 64,22 297,37 -189,35 ----% over sales 6,1% 14,7% 5,5% 8,9% -7,6%
Gross operating result 61,03 151,49 74,22 286,74 -215,04 ----% over sales 6,1% 12,9% 6,3% 8,6% -8,6%
EBIT 25,59 112,51 37,35 175,45 -319,20 ----
% over sales 2,6% 9,6% 3,2% 5,2% -12,8%
Result before taxes16,01 103,51 24,13 143,64 -345,22 ----
Result after taxes
and minorities10,11 71,00 16,39 97,50 -224,28 ----
Depreciation 35,36 37,92 36,61 109,89 102,77 6,9%Net cash flow 45,47 108,93 53,00 207,39 -121,50 ----
January-September
(*) EBITDA is defined as the operating result plus depreciation and provisions
ACERINOX GROUP: Spain Investors Day
Strong balance sheet
Prudent leverage
Well balanced debt
Diversified bank pool
TRADITIONAL FINANCIAL STRENGTHS
ACERINOX GROUP: Spain Investors Day

CONDENSED BALANCE SHEET OF ACERINOX CONSOLIDATED GROUPSeptember 2010
ASSETS LIABILITIESMillion € Sep-10 2009 Variation Million € Sep-10 2009 variation
Non-current assets 2,256.21 2,002.06 12.7% Equity 1,969.43 1,752.52 12.4%
Current assets 2,142.09 1,615.72 32.6% Non-current liabilities 924.67 800.07 15.6% - Inventories 1,403.61 1,154.45 21.6% - Interest-bearing loans and borrowings 647.53 543.18 19.2% - Debtors 599.06 371.19 61.4% - Other non-current liabilities 277.14 256.89 7.9% Trade debtors 574.12 304.17 88.7%
Other debtors 24.94 67.01 -62.8% Current liabilities 1,504.20 1,065.19 41.2% - Cash and other current assets 139.42 90.09 54.8% - Interest-bearing loans and borrowings 746.59 604.63 23.5%
- Trade creditors 486.97 306.15 59.1% - Other current liabilities 270.64 154.42 75.3%
TOTAL ASSETS 4,398.30 3,617.79 21.6% TOTAL EQUITY AND LIABILITIES 4,398.30 3,617.79 21.6%
ACERINOX GROUP: Spain Investors Day

30%
70%
Credit lines
Total existing lines:1,992 mill. €
Used creditfacilities
Availablecredit facilities
DEBT STRUCTURE
ACERINOX GROUP: Spain Investors Day
September 2010
Net debt
49%
51%
Long term debt
Short termdebt (*)
Net debt:1,275.94 million €
(*) Treasury has been deducted of the short term debt

Ongoing capex program
Keeping retribution to shareholders
Flexibility to manage a volatile working capital
FINANCIAL ACHIEVEMENTS IN A WORLDWIDE RECESSION
ACERINOX GROUP: Spain Investors Day
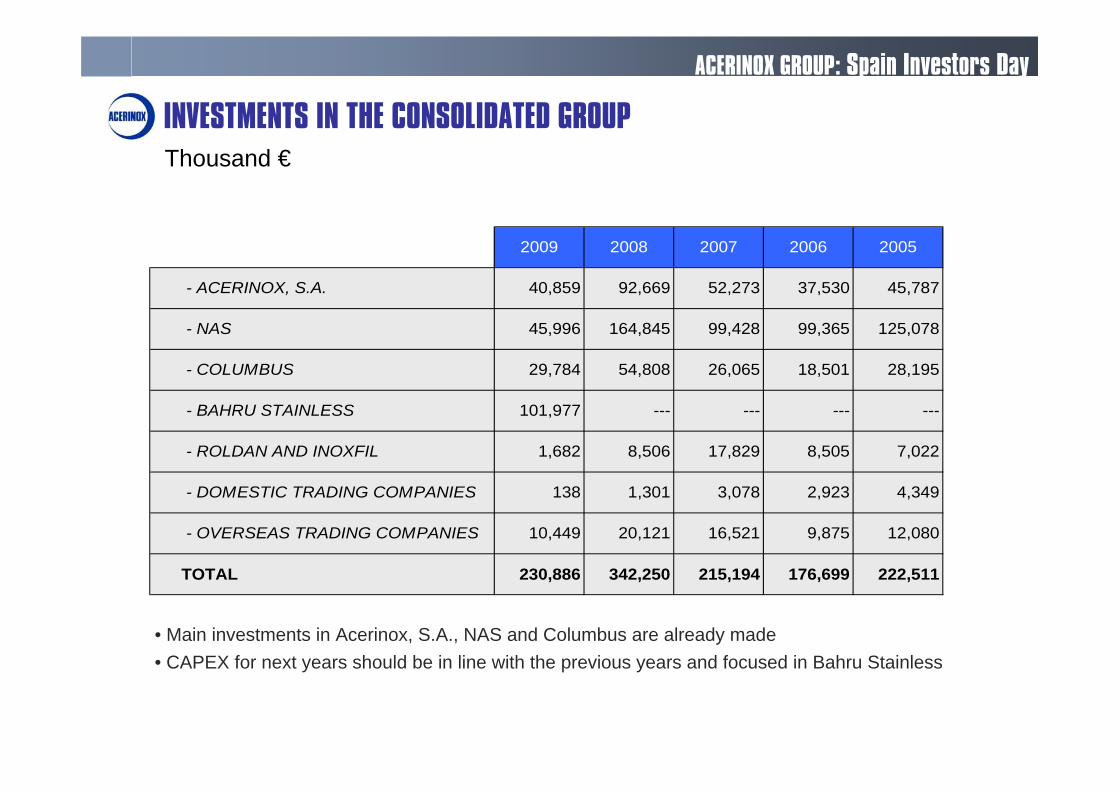
2009 2008 2007 2006 2005
- ACERINOX, S.A. 40,859 92,669 52,273 37,530 45,787
- NAS 45,996 164,845 99,428 99,365 125,078
- COLUMBUS 29,784 54,808 26,065 18,501 28,195
- BAHRU STAINLESS 101,977 --- --- --- ---
- ROLDAN AND INOXFIL 1,682 8,506 17,829 8,505 7,022
- DOMESTIC TRADING COMPANIES 138 1,301 3,078 2,923 4,349
- OVERSEAS TRADING COMPANIES 10,449 20,121 16,521 9,875 12,080
TOTAL 230,886 342,250 215,194 176,699 222,511
• Main investments in Acerinox, S.A., NAS and Columbus are already made• CAPEX for next years should be in line with the previous years and focused in Bahru Stainless
INVESTMENTS IN THE CONSOLIDATED GROUPThousand €
ACERINOX GROUP: Spain Investors Day
DividendDividend
0.00
0.05
0.10
0.15
0.20
0.25
0.30
0.35
0.40
0.45
0.50
0.55
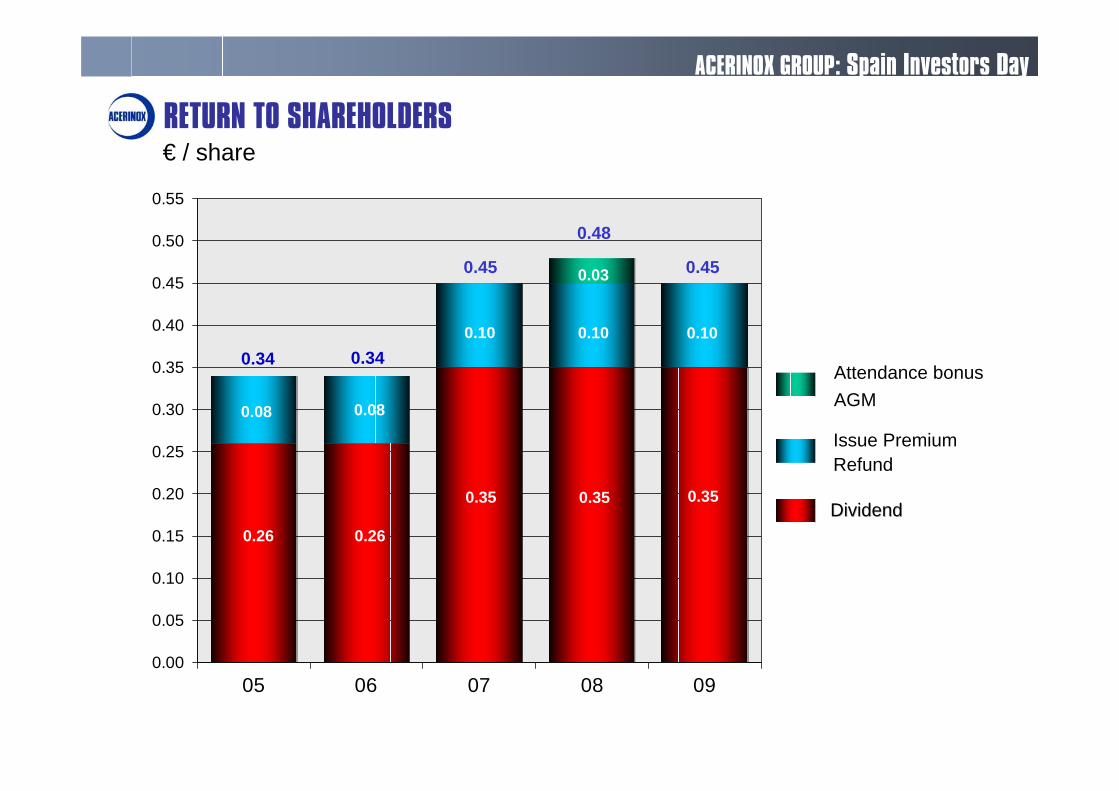
05 06 07 08 09
0.34
0.26
0.08
0.34
0.26
0.08
0.48
0.35
0.10
0.45
0.35
0.10
0.45
0.35
0.10
0.03
Attendance bonusAGM
Issue PremiumRefund
RETURN TO SHAREHOLDERS€ / share
ACERINOX GROUP: Spain Investors Day

0
250
500
750
1.000
1.250
1.500
1.750
2.000
2.250
00 01 02 03 04 05 06 07 08 09 Sep10
Inventories
Trade debtors
Trade creditors
EVOLUTION OF THE WORKING CAPITALMillion €
ACERINOX GROUP: Spain Investors Day

Well Defined Production Strategy
Excellence Plan
Global Expansion
STRATEGIC PLAN 2008 - 2020
ACERINOX GROUP: Spain Investors Day

• Consolidate and develop a commercial network
• Use the group synergies, without adding new capacity to the market
2,665,000 mt/year4,100,000 mt/year4,500,000 mt/year
1,000,000 mt/year
1,000,000 mt/year
1,200,000 mt/year
900,000 mt/year
Hot rolling
600,000 mt/year1,000,000 mt/year
545,000 mt/year1,000,000 mt/year
850,000 mt/year
670,000 mt/year
Cold rolling
1,400,000 mt/year
1,100,000 mt/year
MeltingCapacity
STRATEGIC PLAN 2008 - 2020Bahru Stainless
ACERINOX GROUP: Spain Investors Day
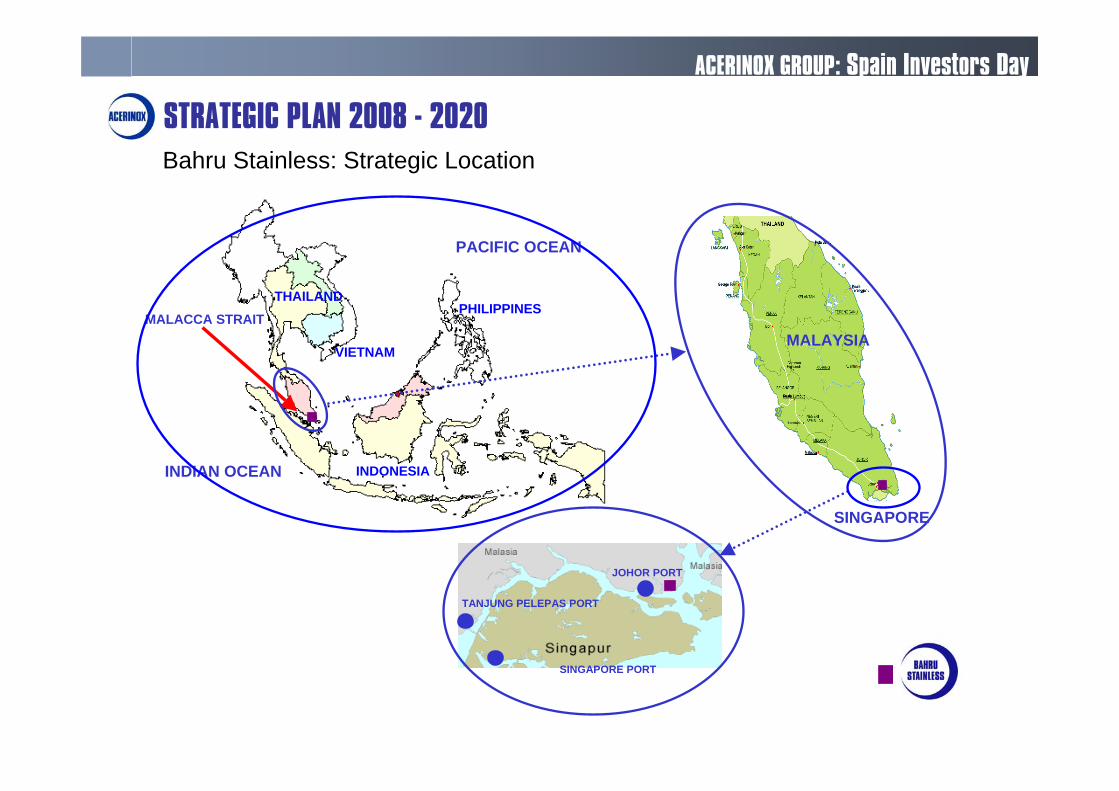
MALAYSIA
THAILAND
VIETNAM
PHILIPPINES
INDONESIA
PACIFIC OCEAN
MALACCA STRAIT
INDIAN OCEAN
MALAYSIA
SINGAPORE
JOHOR PORT
TANJUNG PELEPAS PORT
SINGAPORE PORT
STRATEGIC PLAN 2008 - 2020Bahru Stainless: Strategic Location
ACERINOX GROUP: Spain Investors Day

Population SS production Consumption per
(million) (Mt/year) capita (kg/year)
Thailand 66 250.000 200.000 3,8
Malaysia 26 220.000 --- 8,4
Singapore 5 120.000 --- 25,5
Indonesia 243 125.000 20.000 0,5
Vietnam 90 90.000 12.000 1,0
Philippines 100 30.000 --- 0,3
Burma 53 --- 0,1
Laos 7 --- 0,1
Brunei 0 --- 0,1
Cambodia 15 --- 0,1
Total ASEAN countries 605 845.000 232.000 1,5
Total flat consumption of SS (Mt/year)
10.000
ASEAN Countries
ASEAN ZONE STAINLESS STEEL MARKET
ACERINOX GROUP: Spain Investors Day
Data referred to year 2009
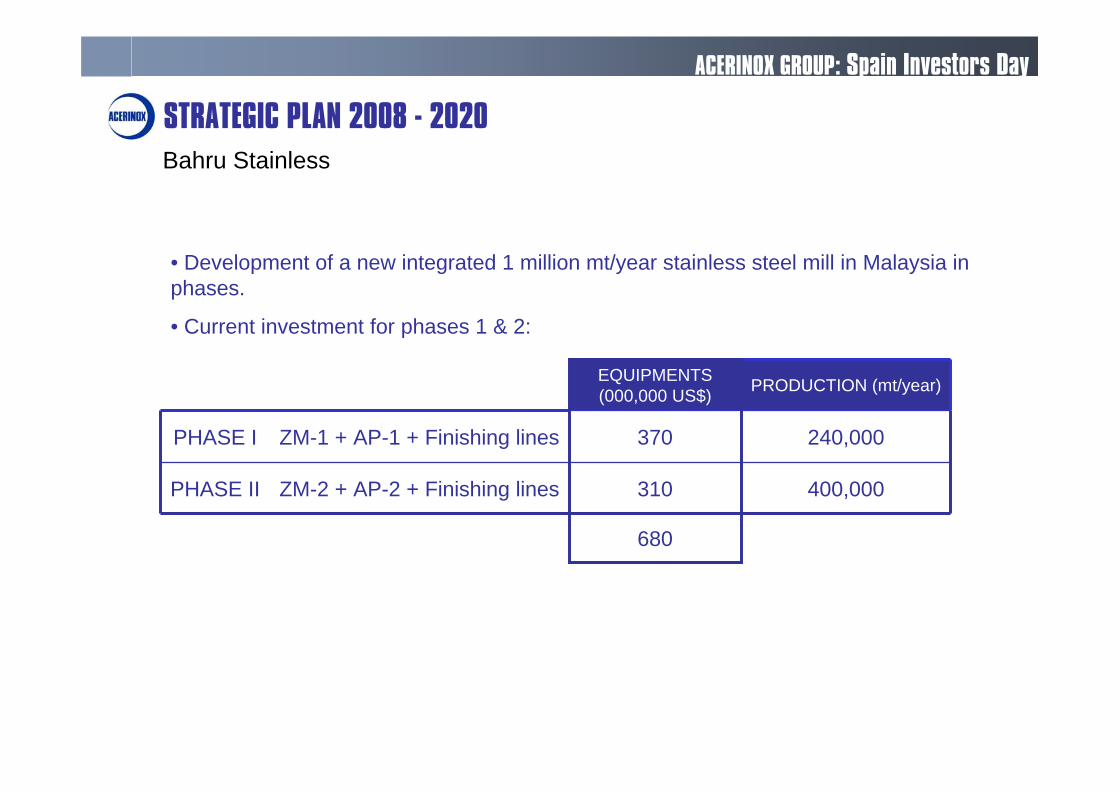
• Development of a new integrated 1 million mt/year stainless steel mill in Malaysia in phases.
• Current investment for phases 1 & 2:
680
400,000310ZM-2 + AP-2 + Finishing linesPHASE II
240,000370ZM-1 + AP-1 + Finishing linesPHASE I
PRODUCTION (mt/year)EQUIPMENTS (000,000 US$)
STRATEGIC PLAN 2008 - 2020Bahru Stainless
ACERINOX GROUP: Spain Investors Day
Strategic Location at the seaside
Competitive costs
Strong and growing local markets in Malaysia and Singapore
Developed commercial presence in the region of Acerinox
Malaysia: Stable and developed country, with good infrastructure
Unique geographic distribution of the group within the stainless steel sector
Consolidate the presence in the region with the highest consumption andgrowth of the world
Guarantee of success due to best available technology and the accumulated experience in the group, in addition to the competitive cost factors of the region
Cost reduction in the group due to economy of scale benefits
Bahru Stainless: Main advantages
STRATEGIC PLAN 2008 - 2020
CREATING VALUECREATING VALUE
ACERINOX GROUP: Spain Investors Day
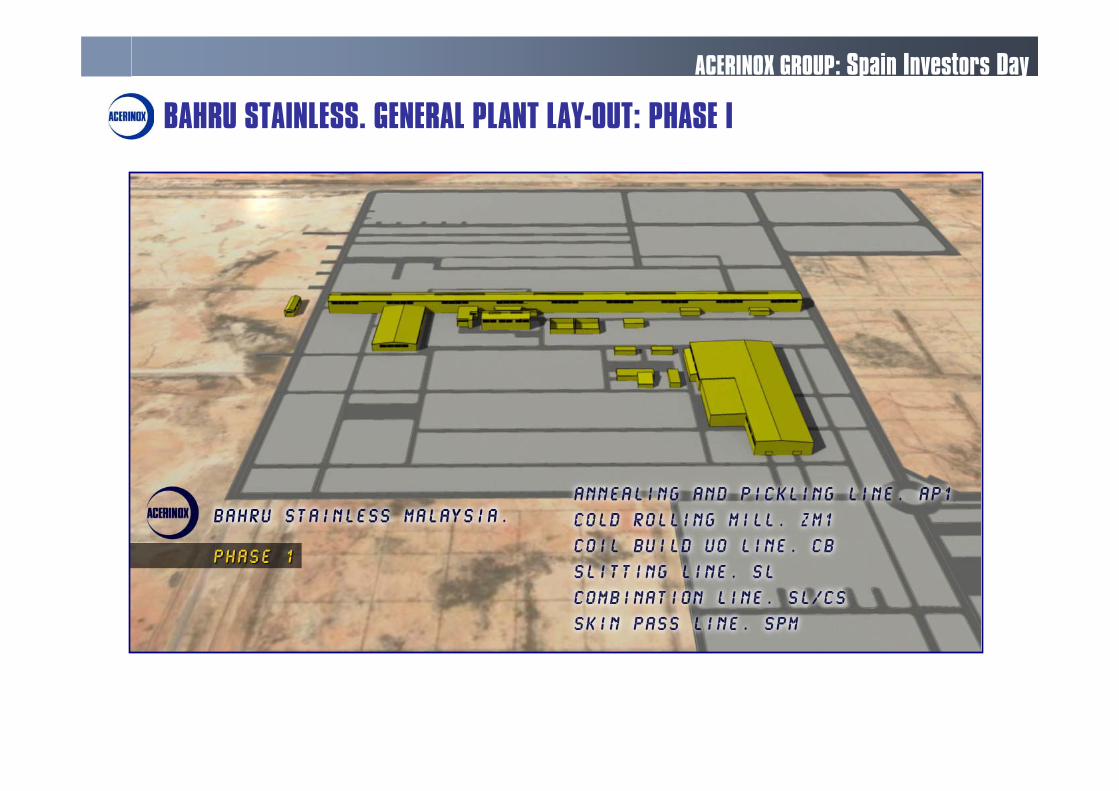
BAHRU STAINLESS. GENERAL PLANT LAY-OUT: PHASE I
ACERINOX GROUP: Spain Investors Day
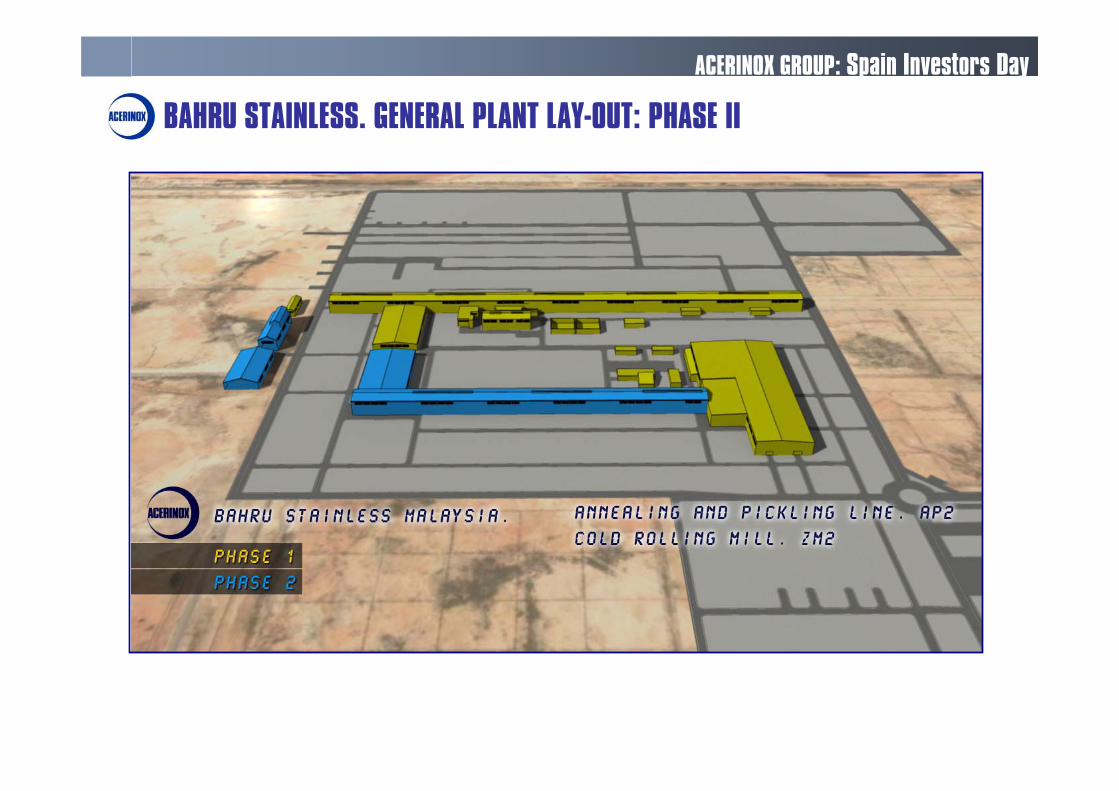
BAHRU STAINLESS. GENERAL PLANT LAY-OUT: PHASE II
ACERINOX GROUP: Spain Investors Day

BAHRU STAINLESS. GENERAL PLANT LAY-OUT: PHASE III
ACERINOX GROUP: Spain Investors Day
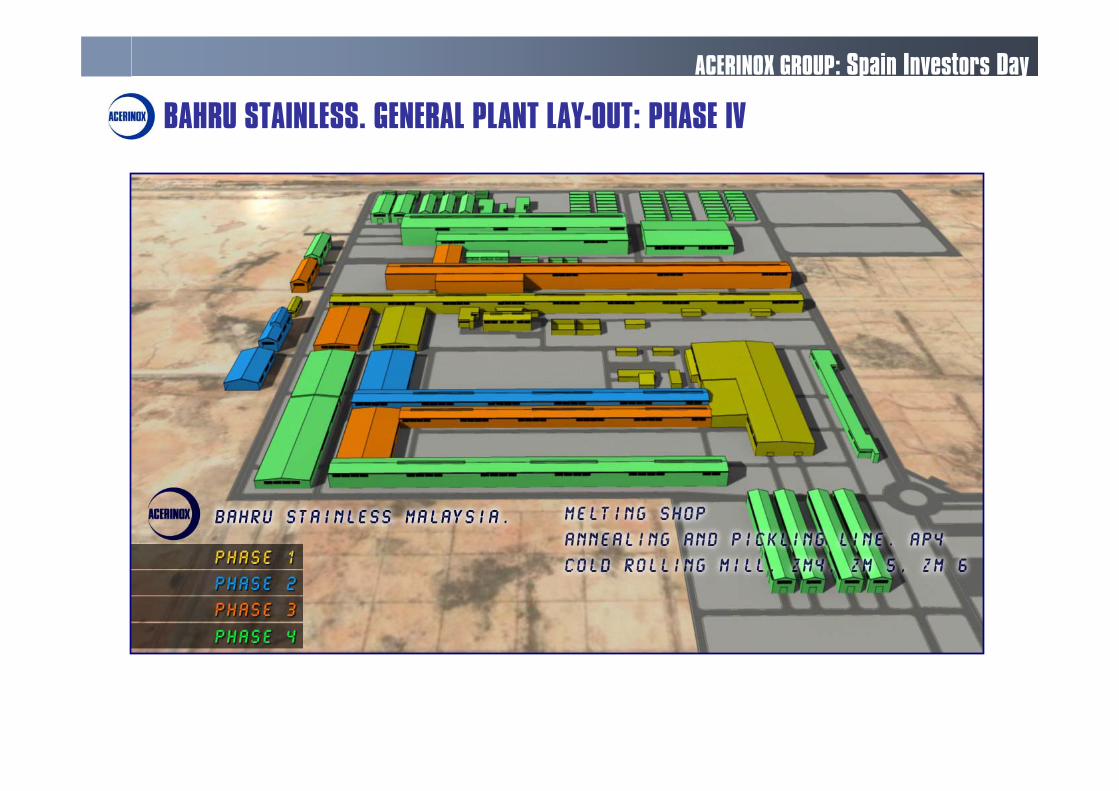
BAHRU STAINLESS. GENERAL PLANT LAY-OUT: PHASE IV
ACERINOX GROUP: Spain Investors Day
0
250
500
750
1,000
1,250
1,500
1,750
2,000
2007 2008 2009 2010 2011 2012 2013 2014 2015 2016 2017 2018 2019 2020
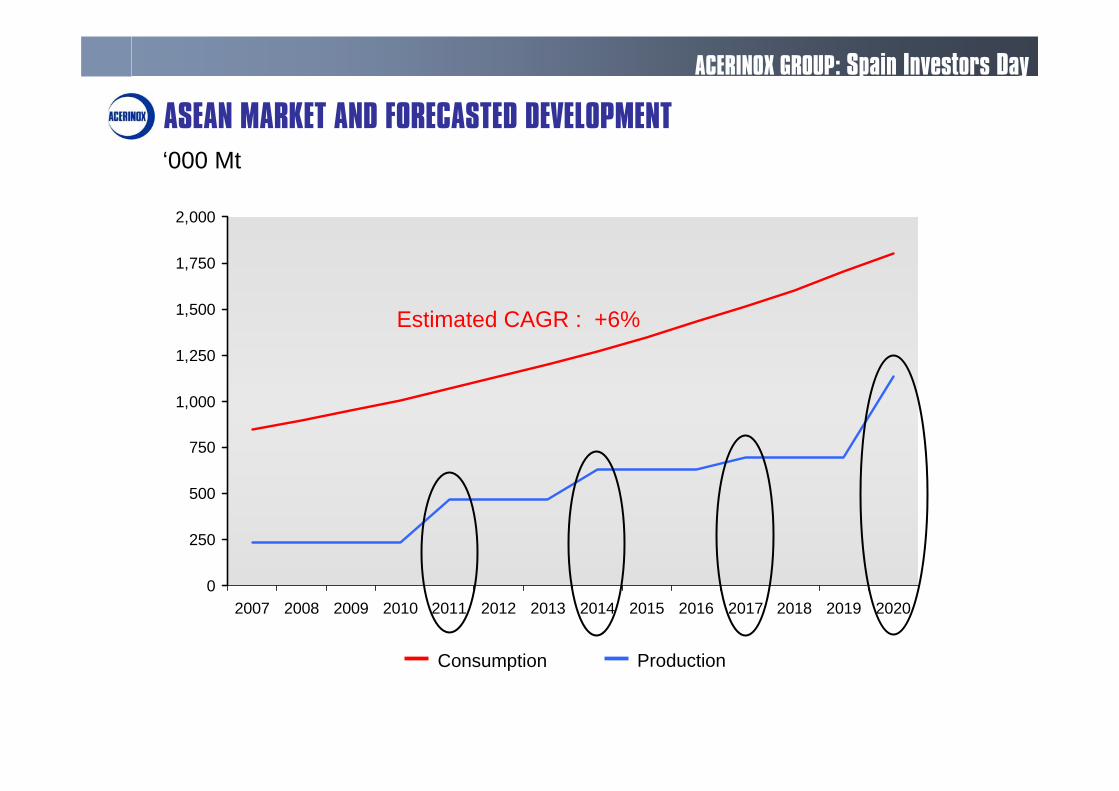
Estimated CAGR : +6%
Consumption Production
ASEAN MARKET AND FORECASTED DEVELOPMENT‘000 Mt
ACERINOX GROUP: Spain Investors Day
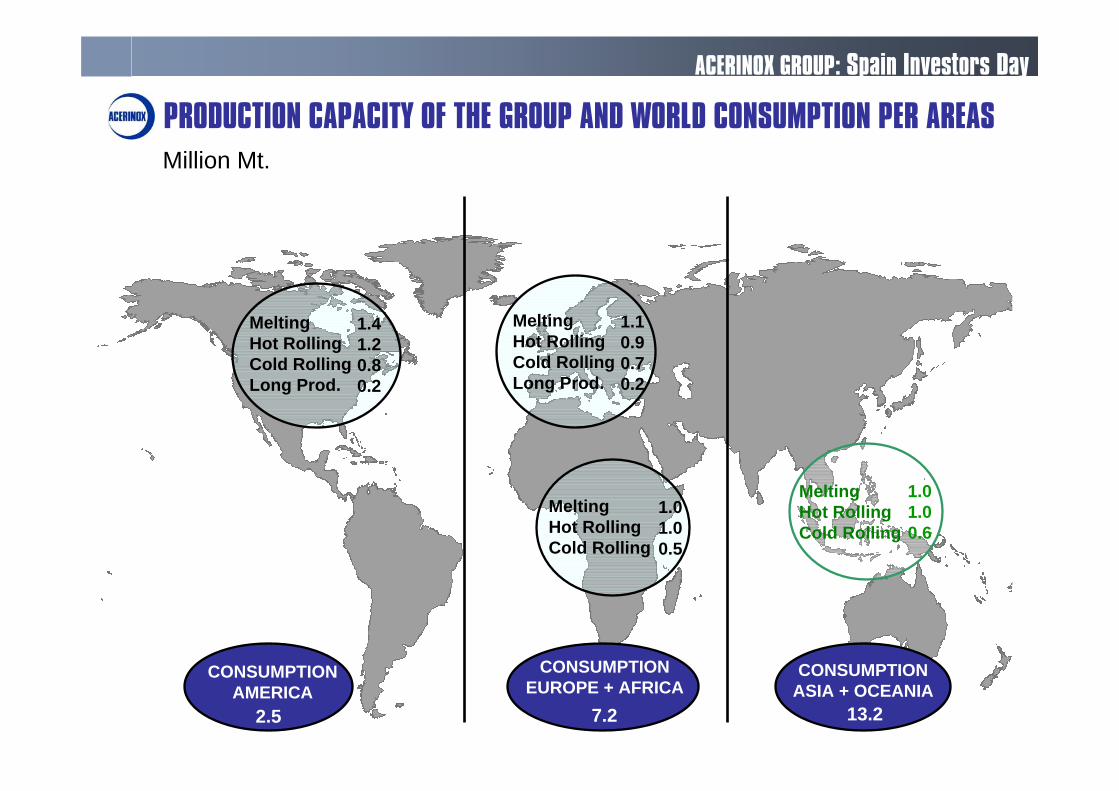
1.41.20.80.2
1.10.90.70.2
1.01.00.5
CONSUMPTION AMERICA
CONSUMPTIONASIA + OCEANIA
CONSUMPTIONEUROPE + AFRICA
13.27.22.5
1.01.00.6
Melting Hot Rolling Cold Rolling Long Prod.
Melting Hot Rolling Cold Rolling Long Prod.
Melting Hot Rolling Cold Rolling
Melting Hot Rolling Cold Rolling
PRODUCTION CAPACITY OF THE GROUP AND WORLD CONSUMPTION PER AREASMillion Mt.
ACERINOX GROUP: Spain Investors Day
Risk mitigation:
Commercial
Financial
Strategic
Operational
Proximity to markets
Global supplier for global customers
Excellence through cultural and technical exchange
Unique benchmarking opportunity
WHY GLOBAL?
ACERINOX GROUP: Spain Investors Day


