12
Source: ACI WORLD ACI EUROPE July 2013 Airport Traffic Report ACI EUROPE
| Date post: | 25-Aug-2018 |
| Category: |
Documents |
| Upload: | truongdieu |
| View: | 240 times |
| Download: | 1 times |

Source: ACI WORLDACI EUROPE
July 2013
Airport Traffic ReportACI EUROPE

Airport traffic posts tepid growth in July
Brussels, 4 September 2013: Airports’ trade body, ACI EUROPE today released itstraffic report for the month of July, posting an underwhelming result for Europe’s airports.
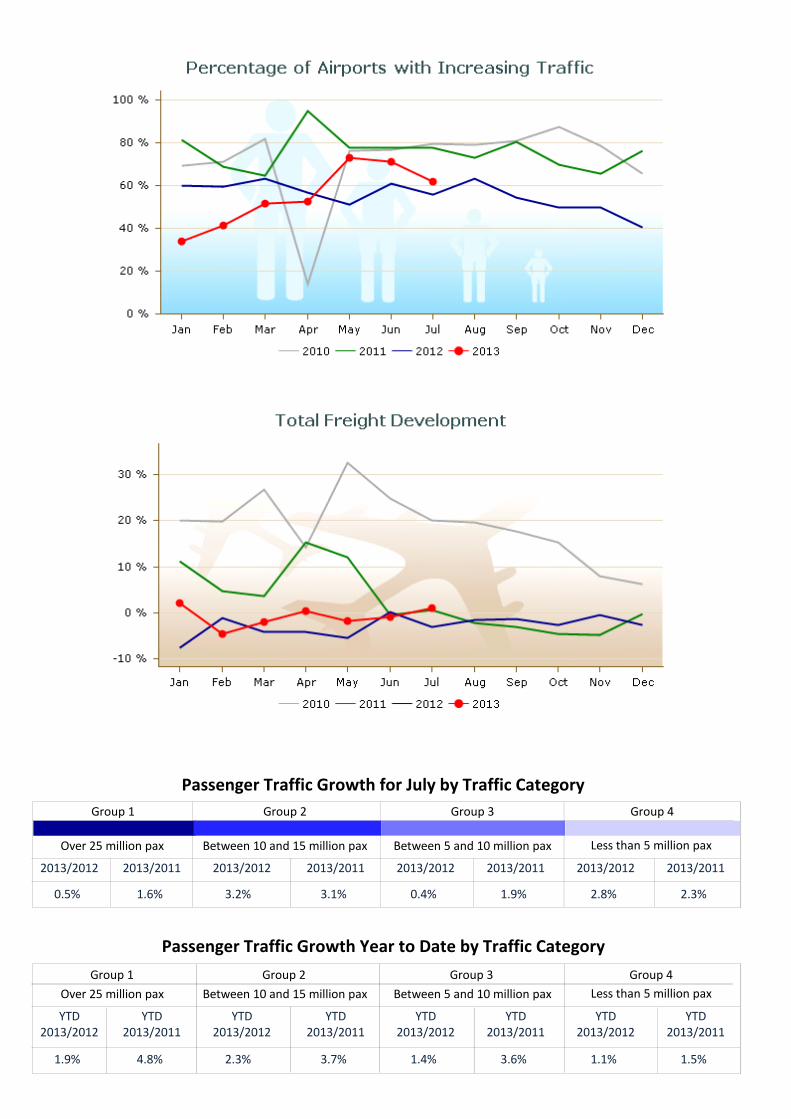
Following some welcome signs of green shoots during the month of June (passengers+3.4%), today’s July figures reveal a less buoyant picture of peak season traffic this year.
Overall passenger traffic at European airports in the month of July reported tepid growthof +1.6%. The overall freight traffic increased by +1.2%, while aircraft movements(an indicator of airline capacity) at European airports produced a near-flat result of+0.1% compared with the same month last year.
At EU airports, passenger traffic growth registered a timid increase of just +0.4% whilenon-EU airport passenger traffic continued to enjoy growth of +6.8%.
Olivier Jankovec, Director General ACI EUROPE commented ”These figures, whileslightly improving, continue to be disappointing - with the pace of air traffic recovery inthe EU being almost anaemic. This reflects modest improvements in consumer andbusiness confidence as well as unemployment recorded for July – and further illustratesthe fact that the pace of economic recovery is extremely slow and uneven across thecontinent.”
Airports welcoming more than 25 million passengers per year (Group 1),airports welcoming between 10 and 25 million passengers (Group 2), airports welcomingbetween 5 and 10 million passengers (Group 3) and airports welcoming less than 5million passengers per year (Group 4) reported for July 2013 an average increase of+0.5%, +3.2%, +0.4% and +2.5% respectively when compared with July 2012.Airports that experienced the highest increase in passenger traffic per group, whencomparing July 2013 with July 2012, include:
GROUP 1 airports – Moscow SVO (+11.8%), London LHR (+5.5%), Istanbul IST(+4.9%), Antalya (+2.1%) and Amsterdam (+1.9%)
GROUP 2 airports – Istanbul SAW (+18.7%), St Petersburg (+18.1%),Stockholm ARN (+10.2%), Helsinki (+9.2%) and Berlin TXL (+8.7%)
GROUP 3 airports – Bergen (+12.7%), Alicante (+9.5%),Warsaw WAW (+8.7%), Glasgow GLA (+5.3%) and Faro (+4.9%)
GROUP 4 airports – Chambery (+63.3%), Kazan (+37.7%), Clermont-Ferrand (+23.3%),Tivat (+21.9%) and Chita (+21.5%)
In terms of the year-to-date passenger traffic results at European airports, comparisonwith the same period in 2012 reveals an average increase of +1.9%, +2.3%, +1.4%and +0.9% respectively, across the 4 traffic groups.
The 'ACI EUROPE Airport Traffic Report - July 2013' includes 172 airports in total.These airports represent over 88% of European passenger traffic.

Executive Summary
Passenger Analysis
Total PAX
EU airports
Non-EU airports
Freight
Movements(total)
PAX + FreightCombined
Cargo only
Total PAX
International
Domestic
Transit *
Month2013/2012
Month2013/2011
Month2013/2010
YTD2013/2012
YTD2013/2011
YTD2013/2010
Month2013/2012
Month2013/2011
Month2013/2010
YTD2013/2012
YTD2013/2011
YTD2013/2010
* Transit passengers refers exclusively to passengers that come to an airport and leave on the same flight with the same flight number.
1.6% 2.2% 9.7% 1.6% 11.6% 15.3%
0.4%
7.0%
1.2% -2.4% -2.4% -0.4% -4.5% -0.6%
0.1% -1.2% 2.1% -2.7% -4.7% 1.2%
-0.2%
1.5%
1.6% 2.2% 9.7% 1.6% 11.6% 15.3%
2.3% 3.9% 12.5% 3.0% 5.4% 16.9%
-0.5% -3.6% 0.7% -3.0% -5.4% 2.3%
-2.7% -18.9% -20.4% -2.5% -11.3% -13.6%
0.3% 6.3% -0.1% 0.5% 8.8%
12.0% 27.5% 8.9% 16.8% 36.1%
-1.5% 1.2% -2.7% -5.0% 0.7%
1.7% -3.5% -2.3% -4.9% -2.7%

Passenger Development European CountriesJuly 2013

Over 25 million pax
Group 1 Group 2 Group 3 Group 4
Between 10 and 15 million pax Between 5 and 10 million pax Less than 5 million pax
Passenger Traffic Growth for July by Traffic Category
2013/2012 2013/2012 2013/2012 2013/20112013/2011 2013/2011 2013/2012 2013/2011
0.5% 0.4% 1.9% 2.8%1.6% 3.2% 3.1% 2.3%
Over 25 million pax
Group 1 Group 2 Group 3 Group 4
Between 10 and 15 million pax Between 5 and 10 million pax Less than 5 million pax
YTD2013/2012
YTD2013/2012
YTD2013/2012
YTD2013/2011
YTD2013/2011
YTD2013/2011
YTD2013/2012
YTD2013/2011
1.9% 1.4% 3.6% 1.1%4.8% 2.3% 3.7% 1.5%
Passenger Traffic Growth Year to Date by Traffic Category

2013/20112013/2012
July JulyCODECITY July
2013/2012 2013/2012
Passengers Commercial Movements Freight
6,934,248London LHR 5.5% 0.8% 41,323 0.5% 118,963 -6.0%1
6,051,339Paris CDG -0.5% -1.3% 43,102 -2.3% N/A N/A2
5,726,988Frankfurt FRA -0.7% 3.0% 42,408 0.2% 170,406 -0.8%3
5,325,471Amsterdam AMS 1.9% 3.3% 40,125 0.3% 124,515 -1.7%4
4,539,995Istanbul IST 4.9% 19.0% 34,864 9.1% 54,484 15.7%5
3,910,577Antalya AYT 2.1% 1.8% 22,252 3.4% 626 8.1%6
3,878,574Madrid MAD -14.4% -20.8% 30,184 -10.4% 28,473 -4.5%7
3,836,158Barcelona BCN 0.3% 6.4% 27,766 -3.4% 8,317 0.3%8
3,755,301Rome FCO -2.7% -3.2% 29,264 -2.7% 13,029 2.4%9
3,626,290Munich MUC 0.5% -0.1% 32,740 -3.2% 22,806 -1.5%10
3,389,894Palma De Mallorca PMI -1.3% -0.4% 23,371 -1.2% 1,337 -4.6%11
3,115,056Moscow SVO 11.8% 26.3% 21,904 7.9% 15,070 26.2%12
2,770,329Paris ORY -0.2% 0.3% 21,386 0.5% N/A N/A13
2,484,465Zurich ZRH 0.6% 1.5% 24,642 7.9% 24,934 4.2%14
2,281,245Manchester MAN 4.1% 6.6% 16,187 2.2% 9,069 -2.4%15
2,219,419Oslo OSL 7.1% 12.6% 18,962 6.2% 7,791 33.8%16
2,176,768Dublin DUB 7.1% 6.5% 16,013 7.9% 9,525 9.2%17
2,175,989Düsseldorf DUS 1.3% 5.9% 19,380 -1.3% 8,076 1.3%18
2,165,015Vienna VIE -1.3% 0.5% 21,031 -4.2% 13,724 3.8%19
2,030,298Brussels BRU -1.1% 0.0% 18,861 -1.4% 33,688 -1.3%20
1,895,614Stockholm ARN 10.2% 12.9% 15,869 13.6% 3,821 -20.5%21
1,871,681Berlin TXL 8.7% 18.0% 15,397 2.0% 2,491 5.4%22
1,786,330Milan MXP -6.3% -9.3% 15,346 -6.8% 39,697 8.0%23
1,784,523Istanbul SAW 18.7% 20.0% 13,152 5.4% 41 -98.0%24
1,736,515London STN -2.5% -7.6% 11,803 -5.7% 17,982 -2.4%25
1,654,981Lisbon LIS 3.1% 5.6% 13,726 1.5% 7,825 -2.8%26
1,560,179St Petersburg LED 18.1% 7.8% 14,168 10.9% 2,217 3.9%27
1,549,709Malaga AGP 1.5% 1.7% 11,156 1.6% 264 -8.7%28
1,450,095Helsinki HEL 9.2% 4.1% 13,404 4.4% 16,357 14.0%29
1,447,495Athens ATH -3.2% -14.5% 12,946 -8.9% 6,102 2.0%30
1,365,341Hamburg HAM 3.7% 4.6% 12,084 -1.2% 2,517 5.1%31
1,358,697Nice NCE 2.5% 11.5% 19,265 1.2% 1,400 -2.9%32
1,315,683Geneva GVA 2.4% 6.3% 12,137 -1.1% 3,864 0.0%33
1,249,865Prague PRG 5.5% -5.6% 12,553 6.2% 3,844 -0.2%34
1,178,712Warsaw WAW 8.7% 18.3% 12,636 6.2% 2,825 -26.7%35
1,175,788Alicante ALC 9.5% 0.2% 7,931 11.9% 244 3.4%36
1,052,142Ibiza IBZ -1.6% -1.3% 8,984 -6.5% 282 -6.3%37
1,020,049London LTN 0.3% -0.1% 8,004 -3.6% 2,332 -7.4%38
1,005,096Birmingham BHX 2.9% 7.0% 8,731 4.3% 2,549 25.5%39
965,511Stuttgart STR -2.4% -2.0% 9,161 -3.4% 1,843 -5.3%40
945,819Cologne CGN -4.7% -6.3% 10,224 -4.6% 62,049 -1.5%41
938,941Venice VCE 3.2% -8.5% 7,831 -4.8% 3,382 22.0%42
927,620Milan LIN -0.7% 1.0% 8,540 -5.8% 1,435 3.9%43
926,642Milan BGY 0.5% 7.6% 6,744 -3.1% 10,697 2.1%44
881,194Kiev KBP -9.0% -2.9% 7,762 -15.6% 2,295 -12.0%45
871,401Budapest BUD -2.1% -8.2% 7,298 -6.5% 5,006 3.0%46
854,808Faro FAO 4.9% 7.0% 5,568 6.2% 19 0.0%47
833,424Glasgow GLA 5.3% 4.7% 7,333 3.6% 1,116 28.6%48
826,424Lyon LYS -2.2% -1.5% 10,518 0.2% 4,087 41.0%49
787,301Bucharest OTP -1.0% 55.9% 8,014 -5.0% 2,162 21.1%50
760,184Gran Canaria LPA -5.2% -10.8% 7,233 -7.0% 1,459 -10.2%51
725,840Bourgas BOJ 2.4% 10.1% 4,481 0.5% 138 -26.2%52
722,990Charleroi CRL 3.6% 21.6% 4,515 3.4% 1 -50.0%53
707,706Catania CTA 0.2% -3.6% 5,510 -4.2% 523 -24.7%54
679,354Toulouse TLS -2.7% 9.4% 7,109 -7.3% 4,006 6.3%55
670,619Larnaca LCA -5.7% -11.1% 4,551 -14.0% 2,268 -5.9%56
670,049Tenerife TFS 2.1% -3.9% 4,000 1.9% 227 -11.0%57
664,283Porto OPO 4.4% 6.1% 5,839 1.9% 2,663 -11.5%58
637,849Bologna BLQ 1.9% 4.9% 5,827 -6.6% 3,164 20.8%59
631,217Berlin SXF -7.3% -7.9% 4,859 -13.0% 641 23.3%60
600,151Basel BSL 8.5% 15.9% 6,069 6.2% 3,327 -3.0%61
578,816Naples NAP -5.7% -4.1% 4,885 -9.3% 556 392.0%62
560,461Hanover HAJ 0.6% 0.3% 5,162 -3.8% 269 -11.8%63
547,572East Midlands EMA 10.7% 16.4% 6,184 11.6% 22,559 3.9%64
543,424Bergen BGO 12.7% 15.1% 7,423 29.7% 239 -57.4%65

2013/20112013/2012
July JulyCODECITY July
2013/2012 2013/2012
Passengers Commercial Movements Freight
520,465Newcastle NCL -0.6% 0.0% 4,317 -0.2% 52 10.6%66
516,549Riga RIX 0.8% -9.1% 6,278 1.4% 6,900 232.5%67
503,665Valencia VLC -4.5% -4.0% 4,616 -6.5% 977 3.5%68
490,407Menorca MAH -2.2% -1.2% 3,833 -8.0% 183 -19.7%69
486,815Palermo PMO -5.6% -9.2% 4,213 -5.5% 47 11.9%70
484,147Lanzarote ACE -3.0% -8.6% 3,711 -5.3% 186 -5.6%71
479,200Ekaterinburg SVX 16.9% -14.6% 4,308 4.5% 1,908 -1.5%72
471,756Malta MLA 5.7% 13.0% 3,572 8.8% 1,228 -4.8%73
469,593Bordeaux BOD 4.6% 15.3% 4,603 3.1% 719 6.0%74
464,425Keflavik KEF 9.3% 39.7% 3,318 4.9% 3,272 7.8%75
461,291Rome CIA 5.5% 6.5% 3,023 3.3% 1,358 -12.3%76
454,444Cagliari CAG 4.0% 0.6% 3,484 -3.7% 200 29.0%77
442,727Gothenburg GOT 7.3% -0.5% 4,289 6.9% 2,361 -4.4%78
433,105Belgrade BEG 5.7% 12.7% 4,761 11.1% 637 -4.1%79
430,396Belfast BFS -11.9% -10.1% 3,690 -9.3% 2,490 8.4%80
404,756Novosibirsk OVB 11.5% 26.3% 3,762 10.6% 2,323 1.1%81
404,344Bilbao BIO -13.5% -5.8% 3,769 -14.1% 241 19.3%82
384,257Krakow KRK 2.3% 21.4% 3,456 -7.1% 48 -17.2%83
383,840Fuerteventura FUE -5.2% -16.9% 3,076 -3.4% 81 -20.6%84
382,631Girona GRO -1.7% 8.9% 2,840 -0.7% 7 -93.7%85
380,203Stavanger SVG 9.2% 19.9% 5,826 54.3% 209 2.5%86
369,725Eindhoven EIN 11.4% 27.2% 2,495 8.0% N/A N/A87
342,484Trondheim TRD 5.8% 15.6% 3,823 2.4% 97 -14.9%88
335,729Aberdeen ABZ 6.8% 11.5% 9,472 5.3% 644 2.5%89
334,841Sevilla SVQ -16.9% -29.7% 2,760 -16.1% 423 0.7%90
334,665Split SPU 14.9% 22.7% 2,798 13.8% 56 -29.1%91
332,876Tenerife TFN -7.8% -14.6% 4,101 -10.1% 1,417 2.8%92
332,520Sofia SOF -0.8% -1.2% 3,260 -5.1% 1,392 7.1%93
324,987Katowice KTW -4.4% -3.9% 2,584 -13.3% 786 1.3%94
322,651Varna VAR -2.0% 7.8% 2,140 -4.8% 5 0.0%95
296,098Nuremberg NUE -4.8% -13.0% 4,445 1.9% 616 -17.9%96
279,883Paphos PFO -6.0% 19.0% 1,621 -7.0% 10 -50.0%97
277,080Dubrovnik DBV -0.8% 7.8% 2,247 0.5% 37 8.8%98
273,839Bremen BRE 9.1% 8.8% N/A N/A 40 -25.9%99
271,880Vilnius VNO 15.2% 46.4% 2,850 9.4% 487 38.4%100
249,066Zagreb ZAG -4.1% -3.4% N/A N/A 587 -4.6%101
235,157Bratislava BTS 2.3% -6.2% 1,874 -1.2% 1,958 4.1%102
233,453Luxembourg LUX 12.6% 46.4% 4,701 2.0% 58,099 8.7%103
223,257Kazan KZN 37.7% -14.6% 1,700 35.1% 295 -41.5%104
210,677Astrakhan ASF 19.8% -14.6% 1,868 13.6% 546 23.3%105
206,386Florence FLR 11.2% 5.0% 2,573 5.0% 15 7.1%106
198,336Tallinn TLL -13.1% 4.9% 2,672 -28.0% 1,280 13.3%107
190,259Tirana TIA 8.9% -4.6% 2,030 2.1% 150 -9.1%108
190,017Tivat TIV 21.9% 28.7% 778 23.7% 3 50.0%109
188,840Southampton SOU 8.4% -1.9% 3,532 -4.6% 11 -65.6%110
184,245Malmo MMX 8.2% 20.3% 1,858 4.4% 1,832 -9.2%111
179,395Yerevan EVN -3.9% -1.5% 1,589 -20.7% 962 -7.8%112
169,088Tromsoe TOS -4.3% 4.4% 2,951 2.6% 113 -27.6%113
160,312Shannon SNN 5.3% 1.9% 1,969 5.4% 1,004 -17.3%114
156,114Bastia BIA 14.7% 7.6% N/A N/A 78 -62.7%115
154,632Montpellier MPL 15.7% -14.9% 1,784 16.4% 337 19.1%116
153,852Bodo BOO -3.3% -1.0% 3,136 -2.3% 66 -25.8%117
152,266Ljubljana LJU 6.0% -11.6% 2,294 -0.7% 725 1.3%118
145,704Chisinau KIV -0.5% 19.5% 1,768 7.3% 234 49.0%119
142,194Salzburg SZG 6.0% -5.2% 1,597 18.6% 13 -7.1%120
131,899Chelyabinsk CEK 20.6% -14.6% 620 21.6% 287 18.1%121
128,921Biarritz BIQ -2.2% 7.6% 996 -37.7% N/A N/A122
122,722Ponta Delgada PDL 7.3% 2.7% 1,351 3.4% 515 3.4%123
118,888Stockholm BMA 3.6% 9.5% 2,131 -2.6% 24 -20.0%124
116,265Strasbourg SXB -2.9% 13.6% 2,066 -5.9% 14 16.7%125
112,967Skopje SKP 16.5% 15.7% 1,069 10.0% 183 4.0%126
112,397Cluj CLJ 14.2% 5.7% 1,187 10.6% 104 44.4%127
97,844Graz GRZ -6.8% -11.2% 1,512 3.4% 14 75.0%128
96,718Aalesund AES 21.0% 30.6% 965 33.5% 48 -5.9%129
95,163Podgorica TGD 13.0% 24.5% 555 6.9% 55 -11.3%130

2013/20112013/2012
July JulyCODECITY July
2013/2012 2013/2012
Passengers Commercial Movements Freight
94,467Trieste TRS -3.1% -3.2% 1,018 -9.5% 10 150.0%131
90,039Guernsey GCI -1.4% -7.2% 3,196 -5.3% 173 -10.8%132
88,170Bournemouth BOH -1.1% 16.4% 769 -0.5% 160 -11.6%133
87,119Brno BRQ -6.7% 19.0% 688 -11.1% 287 4.7%134
84,347Luleå LLA 8.9% 14.7% 770 20.7% 25 -16.7%135
84,236Kristiansand KRS 12.2% 20.6% 1,233 -17.9% 19 -89.3%136
83,603Figari FSC -2.1% 17.5% 1,696 2.7% N/A N/A137
79,443Volgograd VOG 19.0% 7.8% 412 10.2% 67 13.6%138
75,651Harstad EVE 6.9% 10.0% 860 10.1% 26 -10.3%139
75,590Toulon TLN -5.7% 1.7% 1,700 -0.7% N/A N/A140
69,699Sarajevo SJJ 0.5% -14.0% 447 12.9% 133 10.8%141
68,061Isle Of Man IOM 9.7% 7.0% 2,725 -3.1% 41 -6.8%142
64,863Umeå UME 2.0% 1.5% 809 -3.0% 10 -41.2%143
62,103Haugesund HAU 3.5% 20.4% 586 14.0% 14 0.0%144
59,334Visby VBY 20.6% 15.9% 1,193 16.2% 8 60.0%145
58,414Friedrichshafen FDH 0.8% -5.9% 867 -10.9% 2 -33.3%146
57,147Pau PUF 8.2% 7.3% 789 -13.8% 41 -42.3%147
55,910Calvi CLY -0.4% -2.1% N/A N/A 1 0.0%148
55,365Liege LGG 5.3% -1.7% 2,473 -3.2% 47,359 1.7%149
47,728Oulunsalo OUL -35.7% -99900.0% N/A N/A N/A N/A150
46,777Tampere TMP -18.8% -99900.0% N/A N/A N/A N/A151
41,939Clermont-Ferrand CFE 23.3% 17.5% 975 11.0% 325 -15.8%152
35,396Ostend OST -4.4% -1.7% 333 -6.5% 2,702 -37.5%153
35,228Chita HTA 21.5% -14.6% 186 15.5% 182 18.2%154
29,248Metz ETZ -10.6% -14.9% 558 2.0% N/A N/A155
28,261Klagenfurt KLU 8.3% -11.2% 420 5.5% N/A N/A156
25,797Rovaniemi RVN -6.3% -99900.0% N/A N/A N/A N/A157
25,293Turku TKU -38.0% -99900.0% N/A N/A N/A N/A158
22,739Sibiu SBZ 7.3% -14.6% 412 -5.5% 1 0.0%159
20,157Vaasa VAA 0.0% -99900.0% N/A N/A N/A N/A160
20,036Skellefteå SFT 0.2% 0.6% 181 9.0% N/A N/A161
17,582Kiruna KRN 0.9% 13.1% 206 -1.0% 8 33.3%162
15,842Ohrid OHD -10.5% -2.8% 204 14.6% N/A N/A163
15,308Ostersund OSD 10.5% 0.7% 145 -1.4% 6 0.0%164
12,494Vatry XCR 0.0% 51.1% 162 -8.0% 373 -49.2%165
10,078Ronneby RNB 6.3% 4.7% 235 37.4% 1 -66.7%166
10,062Monaco MCM 8.3% 19.5% 3,820 7.2% N/A N/A167
3,134Oradea OMR -12.2% -14.6% 136 -6.8% N/A N/A168
2,744Arad ARW 9.7% 6433.3% 120 -13.0% 94 22.1%169
539Chambery CMF 63.3% 114.7% 73 15.9% N/A N/A170
148Bucharest BBU -50.8% -99.9% 111 -31.5% N/A N/A171
-999Sundsvall SDL 3.6% 9.5% N/A N/A N/A N/A172
Group 1 Group 1 Group 1 Group 1
Over 25 million pax Between 10 and 15 million pax Between 5 and 10 million pax Less than 5 million pax

2013/20112013/2012
YTD YTDCODECITY YTD
2013/2012 2013/2012
Passengers Commercial Movements Freight
41,349,174London LHR 2.9% 4.0% 272,040 -1.5% 817,019 -4.2%1
35,579,614Paris CDG -0.5% 1.7% 274,563 -4.2% N/A N/A2
32,863,666Frankfurt FRA -1.0% 2.4% 266,049 -3.4% 1,150,097 0.7%3
30,021,742Amsterdam AMS 2.8% 6.2% 244,577 -0.6% 861,124 0.6%4
28,982,554Istanbul IST 16.3% 39.9% 219,273 13.1% 343,147 10.9%5
22,781,637Madrid MAD -14.7% -20.9% 193,265 -12.8% 194,003 -6.0%6
22,202,639Munich MUC 0.3% 3.0% 210,058 -5.2% 156,814 -1.9%7
20,679,821Rome FCO -2.4% -3.4% 171,829 -4.0% 78,688 0.9%8
19,962,149Barcelona BCN -1.4% 2.5% 158,641 -5.9% 57,087 2.3%9
16,474,340Moscow SVO 13.2% N/A 132,864 5.9% 92,826 11.4%10
16,266,275Paris ORY 2.2% 2.3% 133,934 -0.4% N/A N/A11
14,460,098Antalya AYT 7.1% 5.0% 86,768 5.7% 3,593 5.8%12
14,289,118Zurich ZRH 0.2% 3.0% 143,603 -1.1% 179,033 -0.5%13
13,224,242Oslo OSL 3.8% 9.6% 133,147 1.0% 49,524 15.3%14
12,674,020Palma De Mallorca PMI 0.2% -0.1% 95,681 -2.9% 7,257 -10.9%15
12,406,735Vienna VIE -1.7% 5.0% 132,924 -6.1% 100,604 -5.5%16
11,860,161Düsseldorf DUS 0.4% 4.1% 114,317 -4.5% 51,891 7.7%17
11,804,516Stockholm ARN 3.6% 8.7% 119,149 3.5% 29,075 -12.6%18
11,702,541Manchester MAN 4.7% 9.9% 92,566 -0.8% 54,975 -2.2%19
11,521,299Dublin DUB 5.2% 4.6% 92,752 3.6% 60,498 4.3%20
11,090,214Berlin TXL 7.7% 16.4% 97,213 0.9% 14,943 -5.1%21
10,914,590Brussels BRU 0.1% 2.2% 116,001 -4.0% 225,883 -7.1%22
10,301,665Milan MXP -4.5% -7.9% 93,166 -6.6% 245,007 1.6%23
10,182,448London STN 2.4% -2.3% 76,316 -0.1% 124,107 2.2%24
9,917,821Istanbul SAW 18.2% 25.7% 72,404 2.6% 14,853 -11.4%25
8,968,318Lisbon LIS 4.2% 7.2% 81,522 0.6% 50,617 -1.7%26
8,902,024Helsinki HEL 1.1% 2.9% 96,993 -2.5% 102,269 0.3%27
8,665,135Geneva GVA 4.0% 9.9% 83,354 -1.1% 25,625 -7.3%28
7,717,069Hamburg HAM -2.2% 0.6% 74,270 -7.5% 16,317 0.1%29
7,255,064Malaga AGP 0.7% -1.3% 55,204 -3.6% 1,487 -7.7%30
7,203,925St Petersburg LED 15.8% N/A 75,964 6.3% 14,361 7.4%31
6,970,741Athens ATH -5.7% -16.8% 71,911 -13.0% 37,945 -3.3%32
6,671,170Nice NCE 3.6% 10.5% 93,466 -1.7% 9,156 6.0%33
6,212,733Warsaw WAW 6.2% 17.7% 76,806 2.6% 25,919 3.1%34
6,108,294Prague PRG 0.0% -9.1% 72,051 -4.3% 25,858 -7.9%35
5,556,858London LTN 0.6% 2.3% 44,642 -3.8% 16,594 -0.9%36
5,457,613Gran Canaria LPA -5.6% -9.8% 51,471 -10.6% 10,678 -13.5%37
5,424,079Alicante ALC 7.4% -4.7% 38,193 7.2% 1,504 -1.4%38
5,385,430Stuttgart STR -1.5% 2.0% 54,871 -7.0% 11,286 -10.5%39
5,256,737Milan LIN -2.4% 1.2% 53,639 -5.4% 9,383 -0.7%40
5,105,309Birmingham BHX 1.1% 4.9% 48,459 -3.6% 14,288 34.7%41
5,094,585Milan BGY -0.6% 6.6% 39,739 -4.6% 67,219 0.5%42
4,989,923Lyon LYS 1.5% -0.3% 67,250 -2.6% 24,190 24.9%43
4,966,456Cologne CGN -4.9% -7.6% 60,721 -7.7% 410,941 -2.1%44
4,934,938Tenerife TFS -0.3% 0.5% 30,342 -4.1% 1,967 -12.3%45
4,809,206Venice VCE 4.6% N/A 43,712 -1.4% 19,360 15.4%46
4,779,685Budapest BUD 1.1% -3.2% 44,994 -4.3% 35,319 6.6%47
4,425,977Toulouse TLS 0.7% 8.0% 50,515 -4.4% 34,420 9.3%48
4,288,078Bucharest OTP 11.6% 52.0% 48,230 1.4% 14,465 12.4%49
4,170,787Kiev KBP -13.1% N/A 40,010 -23.7% 15,085 -20.4%50
4,168,581Glasgow GLA 2.0% 5.8% 42,108 0.0% 6,582 18.8%51
3,809,731Berlin SXF -7.1% -5.7% 32,666 -10.1% 4,035 61.5%52
3,793,165Charleroi CRL 2.7% 13.1% 25,802 0.7% 11 -42.1%53
3,622,999Catania CTA -2.3% -4.5% 30,226 -4.7% 3,238 -32.7%54
3,537,182Bologna BLQ 5.4% 4.4% 35,712 -2.4% 19,512 14.6%55
3,535,873Porto OPO 2.3% 2.6% 33,022 -2.2% 17,573 -14.5%56
3,388,696Bergen BGO 8.4% 11.4% 46,283 5.4% 1,633 -32.2%57
3,338,033Faro FAO 4.9% 5.3% 23,265 2.6% 93 -12.3%58
3,333,969Basel BSL 9.9% N/A 36,567 1.5% 22,778 0.2%59
3,068,300Naples NAP -8.0% -5.3% 27,767 -12.2% 1,324 81.1%60
3,035,824Ibiza IBZ 2.2% 1.6% 28,094 -5.1% 1,305 -2.9%61
2,948,999Hanover HAJ 0.1% -0.8% 30,738 -7.4% 2,107 -23.7%62
2,936,643Lanzarote ACE -1.7% -7.4% 23,193 -9.4% 1,126 -6.3%63
2,882,917Gothenburg GOT 2.0% 2.8% 32,858 -4.4% 15,472 -25.9%64
2,787,928Riga RIX 1.2% -5.6% 37,567 -2.6% 25,574 54.2%65
2013/20112013/2012
YTD YTDCODECITY YTD
2013/2012 2013/2012
Passengers Commercial Movements Freight
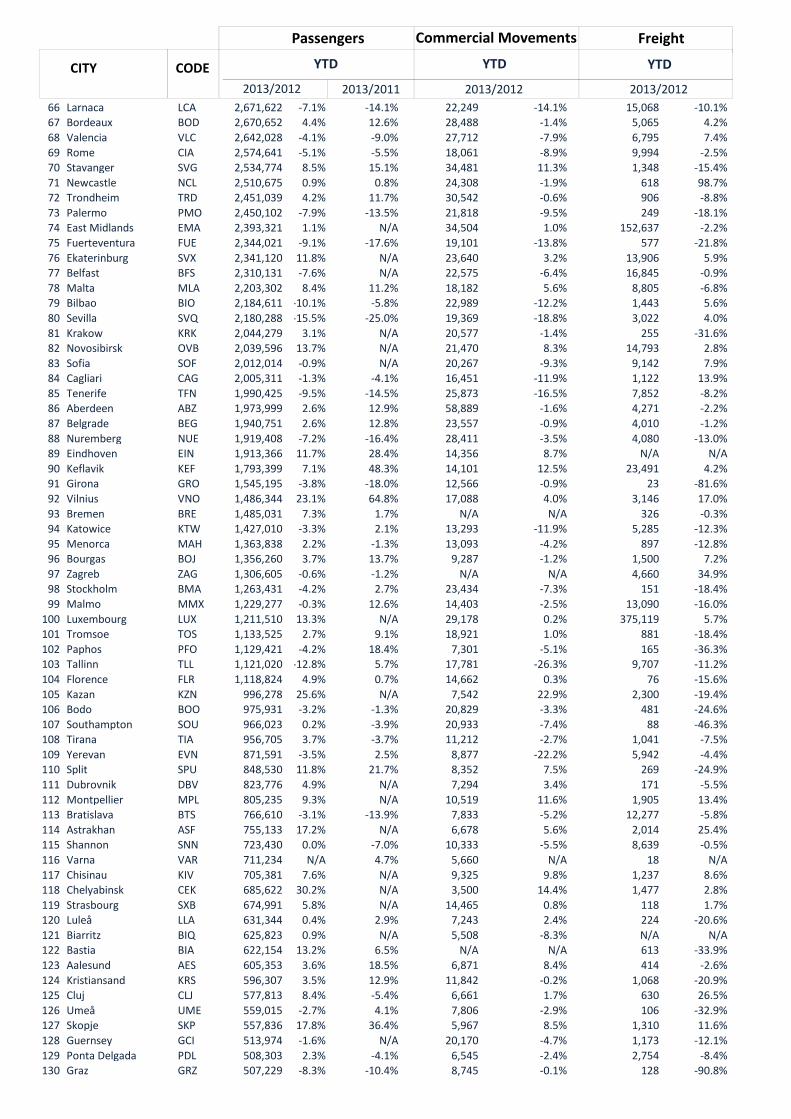
2,671,622Larnaca LCA -7.1% -14.1% 22,249 -14.1% 15,068 -10.1%66
2,670,652Bordeaux BOD 4.4% 12.6% 28,488 -1.4% 5,065 4.2%67
2,642,028Valencia VLC -4.1% -9.0% 27,712 -7.9% 6,795 7.4%68
2,574,641Rome CIA -5.1% -5.5% 18,061 -8.9% 9,994 -2.5%69
2,534,774Stavanger SVG 8.5% 15.1% 34,481 11.3% 1,348 -15.4%70
2,510,675Newcastle NCL 0.9% 0.8% 24,308 -1.9% 618 98.7%71
2,451,039Trondheim TRD 4.2% 11.7% 30,542 -0.6% 906 -8.8%72
2,450,102Palermo PMO -7.9% -13.5% 21,818 -9.5% 249 -18.1%73
2,393,321East Midlands EMA 1.1% N/A 34,504 1.0% 152,637 -2.2%74
2,344,021Fuerteventura FUE -9.1% -17.6% 19,101 -13.8% 577 -21.8%75
2,341,120Ekaterinburg SVX 11.8% N/A 23,640 3.2% 13,906 5.9%76
2,310,131Belfast BFS -7.6% N/A 22,575 -6.4% 16,845 -0.9%77
2,203,302Malta MLA 8.4% 11.2% 18,182 5.6% 8,805 -6.8%78
2,184,611Bilbao BIO -10.1% -5.8% 22,989 -12.2% 1,443 5.6%79
2,180,288Sevilla SVQ -15.5% -25.0% 19,369 -18.8% 3,022 4.0%80
2,044,279Krakow KRK 3.1% N/A 20,577 -1.4% 255 -31.6%81
2,039,596Novosibirsk OVB 13.7% N/A 21,470 8.3% 14,793 2.8%82
2,012,014Sofia SOF -0.9% N/A 20,267 -9.3% 9,142 7.9%83
2,005,311Cagliari CAG -1.3% -4.1% 16,451 -11.9% 1,122 13.9%84
1,990,425Tenerife TFN -9.5% -14.5% 25,873 -16.5% 7,852 -8.2%85
1,973,999Aberdeen ABZ 2.6% 12.9% 58,889 -1.6% 4,271 -2.2%86
1,940,751Belgrade BEG 2.6% 12.8% 23,557 -0.9% 4,010 -1.2%87
1,919,408Nuremberg NUE -7.2% -16.4% 28,411 -3.5% 4,080 -13.0%88
1,913,366Eindhoven EIN 11.7% 28.4% 14,356 8.7% N/A N/A89
1,793,399Keflavik KEF 7.1% 48.3% 14,101 12.5% 23,491 4.2%90
1,545,195Girona GRO -3.8% -18.0% 12,566 -0.9% 23 -81.6%91
1,486,344Vilnius VNO 23.1% 64.8% 17,088 4.0% 3,146 17.0%92
1,485,031Bremen BRE 7.3% 1.7% N/A N/A 326 -0.3%93
1,427,010Katowice KTW -3.3% 2.1% 13,293 -11.9% 5,285 -12.3%94
1,363,838Menorca MAH 2.2% -1.3% 13,093 -4.2% 897 -12.8%95
1,356,260Bourgas BOJ 3.7% 13.7% 9,287 -1.2% 1,500 7.2%96
1,306,605Zagreb ZAG -0.6% -1.2% N/A N/A 4,660 34.9%97
1,263,431Stockholm BMA -4.2% 2.7% 23,434 -7.3% 151 -18.4%98
1,229,277Malmo MMX -0.3% 12.6% 14,403 -2.5% 13,090 -16.0%99
1,211,510Luxembourg LUX 13.3% N/A 29,178 0.2% 375,119 5.7%100
1,133,525Tromsoe TOS 2.7% 9.1% 18,921 1.0% 881 -18.4%101
1,129,421Paphos PFO -4.2% 18.4% 7,301 -5.1% 165 -36.3%102
1,121,020Tallinn TLL -12.8% 5.7% 17,781 -26.3% 9,707 -11.2%103
1,118,824Florence FLR 4.9% 0.7% 14,662 0.3% 76 -15.6%104
996,278Kazan KZN 25.6% N/A 7,542 22.9% 2,300 -19.4%105
975,931Bodo BOO -3.2% -1.3% 20,829 -3.3% 481 -24.6%106
966,023Southampton SOU 0.2% -3.9% 20,933 -7.4% 88 -46.3%107
956,705Tirana TIA 3.7% -3.7% 11,212 -2.7% 1,041 -7.5%108
871,591Yerevan EVN -3.5% 2.5% 8,877 -22.2% 5,942 -4.4%109
848,530Split SPU 11.8% 21.7% 8,352 7.5% 269 -24.9%110
823,776Dubrovnik DBV 4.9% N/A 7,294 3.4% 171 -5.5%111
805,235Montpellier MPL 9.3% N/A 10,519 11.6% 1,905 13.4%112
766,610Bratislava BTS -3.1% -13.9% 7,833 -5.2% 12,277 -5.8%113
755,133Astrakhan ASF 17.2% N/A 6,678 5.6% 2,014 25.4%114
723,430Shannon SNN 0.0% -7.0% 10,333 -5.5% 8,639 -0.5%115
711,234Varna VAR N/A 4.7% 5,660 N/A 18 N/A116
705,381Chisinau KIV 7.6% N/A 9,325 9.8% 1,237 8.6%117
685,622Chelyabinsk CEK 30.2% N/A 3,500 14.4% 1,477 2.8%118
674,991Strasbourg SXB 5.8% N/A 14,465 0.8% 118 1.7%119
631,344Luleå LLA 0.4% 2.9% 7,243 2.4% 224 -20.6%120
625,823Biarritz BIQ 0.9% N/A 5,508 -8.3% N/A N/A121
622,154Bastia BIA 13.2% 6.5% N/A N/A 613 -33.9%122
605,353Aalesund AES 3.6% 18.5% 6,871 8.4% 414 -2.6%123
596,307Kristiansand KRS 3.5% 12.9% 11,842 -0.2% 1,068 -20.9%124
577,813Cluj CLJ 8.4% -5.4% 6,661 1.7% 630 26.5%125
559,015Umeå UME -2.7% 4.1% 7,806 -2.9% 106 -32.9%126
557,836Skopje SKP 17.8% 36.4% 5,967 8.5% 1,310 11.6%127
513,974Guernsey GCI -1.6% N/A 20,170 -4.7% 1,173 -12.1%128
508,303Ponta Delgada PDL 2.3% -4.1% 6,545 -2.4% 2,754 -8.4%129
507,229Graz GRZ -8.3% -10.4% 8,745 -0.1% 128 -90.8%130

2013/20112013/2012
YTD YTDCODECITY YTD
2013/2012 2013/2012
Passengers Commercial Movements Freight
494,040Trieste TRS -1.1% N/A 6,073 -6.1% 172 30.3%131
483,765Tivat TIV 24.5% 41.2% 2,159 11.9% 11 22.2%132
427,019Isle Of Man IOM 6.0% 5.7% 17,721 -3.2% 269 9.8%133
407,033Haugesund HAU 8.6% 18.6% 4,595 6.2% 133 -5.7%134
382,817Harstad EVE 5.6% 8.5% 5,177 4.8% 250 13.1%135
382,337Podgorica TGD 8.0% 11.9% 2,788 0.2% 317 -7.0%136
375,337Pau PUF 4.4% N/A 5,693 -5.2% 1,794 185.7%137
373,528Sarajevo SJJ 12.2% 5.0% 2,637 7.4% 966 2.8%138
372,110Bournemouth BOH -7.0% -0.2% 4,265 -7.7% 1,163 N/A139
366,606Volgograd VOG 15.1% N/A 2,002 4.3% 442 -2.0%140
337,394Toulon TLN 4.2% N/A 6,001 -4.6% N/A N/A141
296,944Friedrichshafen FDH 0.4% -7.2% 5,577 -9.2% N/A N/A142
258,483Brno BRQ -13.0% N/A 2,532 -14.2% 2,046 -6.8%143
250,458Clermont-Ferrand CFE 7.6% 4.6% 6,488 1.0% 1,543 9.7%144
241,644Figari FSC -2.9% N/A 4,849 2.6% N/A N/A145
226,221Ostersund OSD -1.7% 2.7% 2,623 -17.4% 54 5.9%146
204,285Visby VBY 4.7% 1.6% 5,467 -0.6% 39 0.0%147
189,291Chambery CMF -6.6% -9.8% 2,888 -8.9% N/A N/A148
178,810Liege LGG 7.7% 6.2% 14,866 -4.3% 325,041 -7.8%149
168,429Chita HTA 37.2% N/A 1,096 15.9% 1,140 3.4%150
168,228Calvi CLY -1.9% 3.1% N/A N/A 7 -12.5%151
163,056Skellefteå SFT -2.4% 7.7% 1,759 -3.4% N/A N/A152
154,714Klagenfurt KLU -10.0% N/A 2,593 -6.2% N/A N/A153
137,667Metz ETZ -12.0% -16.1% 3,069 -8.1% N/A N/A154
137,511Kiruna KRN 12.2% 39.1% 1,833 26.2% 166 172.1%155
126,604Ostend OST 7.2% N/A 1,674 -1.5% 29,105 -6.7%156
125,890Sibiu SBZ 10.4% N/A 2,520 -7.1% 7 133.3%157
119,536Ronneby RNB -4.5% -4.5% 2,216 2.2% N/A N/A158
54,548Vatry XCR 5.2% 82.0% 797 -1.7% 2,529 -48.4%159
53,845Monaco MCM -2.4% N/A 19,904 -3.0% N/A N/A160
43,509Ohrid OHD -1.5% -2.4% 560 25.0% N/A N/A161
22,670Oradea OMR -5.0% N/A 914 -5.3% N/A N/A162
15,444Arad ARW 269.0% 1,937.5% 756 23.9% 565 29.9%163
1,561Bucharest BBU N/A -99.9% 988 -74.6% N/A N/A164
Total commercial passengers
International passengers (enplaned + deplaned) + domestic passengers (enplaned + deplaned) + direct transit passengers (passengers who arrive at and depart from the airport on a flight bearing the same number. They are counted only ONCE).
Commercial movements
Landing or take off of an aircraft operating a scheduled or non scheduled commercial service.
Freight
Freight loaded and unloaded (arriving or departing) at the airport. Freight comprises goods, newspapers, diplomatic bags, parcel


