Page 1
1
Acid Dissociation Constants of Bilirubin and Related Carboxylic Acid Compounds in Bile Salt Solutions William E. Kurtin†, Jason Enz†, Celeste Dunsmoor†, Neil Evans†, David A. Lightner* †Department of Chemistry, Trinity University, San Antonio, TX, 78212 and the *Department of Chemistry and Biochemistry, University of Nevada, Reno, NV 89557-0020 Corresponding author:
William E. Kurtin Department of Chemistry Trinity University 715 Stadium Drive San Antonio, TX 78212 Telephone: (210) 999-7382 Email: [email protected] Fax: (210) 999-7569
(Running Title: pKa of Bilirubin in Bile Salt Solution
Page 2
2
Summary
Bilirubin, the yellow-orange tetrapyrrole pigment of jaundice, is essentially insoluble in
pure water, but is much more soluble in solutions of bile salts such as sodium taurocholate. The
biophysical chemistry of bilirubin in bile salt solutions is affected by changes in the pH of the
solution in the range 5-9, suggesting that interactions with bile salt molecules and micelles may
alter the acidity of the pigment. We have examined this possibility by determining the apparent
pKa values for a series of carboxyl 13C-enriched model compounds, including the bilirubin
analog mesobilirubin XIIIα, in solutions of sodium taurocholate and sodium taurodeoxycholate.
Apparent pKa values were determined by 13C NMR titrations in dimethyl sulfoxide-water
mixtures. The results show that the acidity of all compounds is decreased, or pKa increased, in
micellar bile salt solution relative to pure water, and that the effect is greatest for the larger, less
water-soluble compounds. We have proposed a model to explain these results, and discussed the
implications of these findings for the biophysical chemistry of bilirubin in bile.
Page 3
3
Introduction
Bilirubin is the yellow-orange tetrapyrrole pigment that is formed in humans primarily by
the oxidative degradation of the heme from senescent red blood cells (1,2). It is best known
because of its role in various hepatobiliary diseases, especially kernicterus and gallstone disease.
More recently, it has been found to have a beneficial antioxidant function (3).
Like heme, bilirubin has two propionic acid substituents, and the state of ionization of
these functional groups can be assumed to play a crucial role in determining the conformation,
solubility and transport of the molecule in the various tissues of the biliary tract. The apparent
acid dissociation constants of these groups are difficult to obtain because of the very low water
solubility of bilirubin. Nevertheless, numerous investigators, using a variety of methods, have
reported apparent pKa values for the propionic acid groups, and the reported values have ranged
between 4.4 and 9.3 (4-9). Recently, a series of mono-, di-, and tetrapyrrole model compounds
containing carboxyl substituents with 99% 13C-enrichment were synthesized, and the apparent
pKa values determined by 13C NMR in aqueous solutions containing various amounts of
dimethylsulfoxide (10). Furthermore, the validity of this method was proven in a similar study
that examined the effect of dimethylsulfoxide on the apparent pKas of a series of slightly soluble
carboxylic acids (11). The conclusions from these studies are that the acidities of the propionic
acid substituents of bilirubin are similar to those of most aliphatic carboxylic acids in aqueous
solution, and the estimated pKa values in water are ∼ 5.
In bile, bilirubin is solubilized mainly by interaction with the steroidal surfactants known
as bile salts. Various spectroscopic and chromatographic properties of bilirubin in bile salt
solutions have been reported to vary with pH (12-17). Furthermore, the pH dependence of these
Page 4
4
observations suggests that the acidity of the propionic acid substituents may be affected as a
result of the interaction with bile salts. To investigate this possibility, we have determined the
pKas of a series of carboxyl 13C-enriched model compounds in bile salt solution using NMR
spectroscopy. Specifically, we have determined the apparent pKa values for benzoic acid-
carboxy – 13C (1), [1-13C]phenylacetic acid (2), a carboxy-13C butanoic acid-substituted
monopyrrole (3), the dipyrrinone [83-13C]xanthobilirubic acid (4), and the bilirubin analog [83,
123 - 13C2]mesobilirubin XIIIα (5) (see Figure 1) in solutions of the bile salts sodium
taurocholate (TC)1 and sodium taurodeoxycholate (TDC) in aqueous solutions containing10-
20%(v/v) dimethylsulfoxide (DMSO).
Page 5
5
Materials and Methods
99% carboxyl 13C-enriched benzoic acid (1) and phenylacetic acid (2) were purchased
from Sigma-Aldrich Chemical Co. and used without further purification.
The compound 3,5-dimethyl-2-methoxycarbonyl-1H-pyrrole-4-[4-13C]-butanoic acid (3)
was synthesized from 3,5-dimethyl-2-ethoxycarbonyl-1H-pyrrole-4-[4-13C]-butyronitrile using a
procedure based on that reported previously (18). Thus, 912 mg of the starting nitrile were added
to a 100 mL r.b. flask, to which 15 mL of ethyl alcohol, 15 mL of water, and 3.64 g of KOH
were added. Then the mixture was refluxed for 40 hr. Excess solvent was removed by rotary
evaporation, and the remaining solution cooled in an ice bath, producing a tan solid. The solid
was taken up in 12 mL of 50%(w/v) NaNO3. The suspension was cooled in a dry ice - acetone
bath. 4.5 mL of cold conc. HNO3 were added dropwise so that the temperature did not exceed -
10°C during addition. The resulting solid was filtered, and washed with ice cold water, affording
the diacid as a lavender solid, which was dried in vacuo. The diacid was taken up in 10 mL of
methanol, cooled in an ice bath, and 40 mL of ethereal diazomethane were added, and stirred for
5 min. The solvent was then removed by rotary evaporation. The residue was taken up in 10 mL
of CHCl3, and the dimethyl ester was isolated by radial chromatography, using hexane:CH2Cl2
(1.2:1). Then 405 mg of the diester were placed in a 25 mL r.b. flask, to which 8 mL of methanol
and 2 mL of 1M NaOH were added, and the solution was refluxed for 18 hr. The excess
methanol was removed by rotary evaporation. The resulting orange-brown solution was diluted
with 8 mL water, cooled in an ice bath, and 2 mL of 1.1M HCl were added. The resulting pink
precipitate was filtered, washed with ice cold water, and dried in vacuo. The desired product
(348 mg) was obtained in an overall yield for the four-step synthesis of approximately 40%. The
Page 6
6
compound appeared to be pure by proton NMR, and showed only a single peak in the COOH
region in the C-13 NMR.
[83-13C]Xanthobilirubic acid (4) was synthesized using a modification of a published
procedure (19). Thus, 102 mg (0.32 mmol) of [83-13C]-xanthobilirubic acid methyl ester were
placed in a 25 mL round bottom flask equipped with a stirring bar and reflux condenser. Eight
mL of CH3OH and 2 mL of 10%(w/v) NaOH were added to the flask, and the mixture was
heated at reflux for 5 hours. The resulting dark orange solution was cooled to room temperature,
and the CH3OH removed by rotary evaporation to yield a yellow-orange paste. Ten mL of
10%(w/v) HCl were cooled in an ice bath while flushing with nitrogen gas. The HCl was then
added to the rotovapped saponification product in an ice bath, and the suspension was stirred for
20 minutes under nitrogen flushing. The suspension was filtered, and the solid was washed with
ice cold water. The solid was dried in vacuo, yielding 77.8 mg (0.26 mmol) of the yellow
dipyrrinone (80% yield). The melting point was 270-275°C (dec), and the compound appeared to
be pure by proton NMR. The compound yielded only a single line in the COOH region upon C-
13 NMR.
[83, 123 - 13C2]Mesobilirubin-XIIIα (5) was synthesized as described previously (18).
Sodium taurocholate and sodium taurodeoxycholate were purchased from Sigma-Aldrich
Co., and were used without further purification.
Carboxylic acid Ka values were determined by acid-base titration in DMSO-H2O
solutions (10-20% by volume DMSO). Typically, 2-15 mg of the target acid were dissolved in 1-
3 mL of DMSO. To this solution was added a volume of H2O or an aqueous solution of bile salt
at an appropriate concentration. The pH of the resulting solution was then measured using an
Orion Model 810 or 920 pH meter equipped with a glass combination electrode and a
Page 7
7
temperature compensation probe. The pH of the solution was then adjusted to 2.5-3 using dilute
HCl in DMSO-H2O, and a sample taken for NMR purposes. The sample was then titrated using
dilute NaOH in DMSO-H2O, and an aliquot was taken for NMR purposes approximately every
0.5 pH unit increase. Back titrations were performed in some cases to verify the reversibility of
the system. The concentrations of HCl and NaOH were such that the total volume of acid and
base added during the titration was less than 5% of the starting sample volume.
It was found that 4 was not soluble enough in 10% DMSO to permit a titration without
added bile salt. In a solution of 40 mM bile salt, the dipyrrinone was significantly more soluble.
But even under these conditions, 4 precipitated in samples with pH<6 after the samples had been
standing for 1-2 hr. Therefore, titrations of 4 were performed also at higher concentrations of
DMSO in the solvent, and the data extrapolated to 10% DMSO. To obtain an approximate value
for the pKa with no bile salt present, values were determined at several different bile salt
concentrations, and the data extrapolated to zero bile salt.
Compound 5 was found to be only very slightly soluble in 10% DMSO, 40 mM bile salt,
and very long acquisition times were necessary to obtain titration data points. For samples of
pH<5, overnight scanning (>8000 transients) was required. The compound was much more
soluble in 20% DMSO, and the pKa determinations were done in this solvent.
NMR measurements of the carboxyl chemical shift were obtained on either a Varian
Unity Plus 500-MHz (frequency, 125.706 MHz; spectral width, 28,368.8 Hz; acquisition time,
2.000 s; pulse width, 5.0 µs; decouple, 1H; line broadening, 1.8 Hz; temperature, 25°C) or a
Varian Unity Plus 400 MHz (frequency, 100.580 MHz; spectral width, 25,000.0 Hz; acquisition
time, 1.000 s; pulse width, 6.0 µs; decouple, 1H; line broadening, 1.5 Hz; temperature, 25°C)
spectrometer. The decoupler was continuously on for all experiments, and the number of
Page 8
8
transients varied depending on the sample concentration. For 1 and 2 the carboxyl C-13 chemical
shift was determined relative to a reference of deuterodimethylsulfoxide [(CD3)2SO], which was
used in place of non-deuterated DMSO in sample preparation. For all other compounds, the
chemical shift was determined relative to that for deuteroacetone [(CD3)2CO], which was placed
in the NMR tube in a sealed capillary insert.
The observed C-13 chemical shift of the acid was plotted versus the pH of the sample,
and the data were fit using the equation
where a and b are the carboxyl chemicals shifts of the fully protonated and deprotonated forms
of the compound, respectively. The curve fitting was done by non-linear regression using the
program Sigmaplot (SPSS, Inc.). For the dicarboxylic acid 5 the equation above was expanded to
)
][()
][(1
)][
()][
(
2211
2211
++
++
++
++=
H
KK
H
KH
KKc
H
Kba
yaaa
aaa
where a, b, and c are the chemical shifts of the acid, monoanion, and dianion, respectively. It was
not possible experimentally to determine the chemical shift of the monoanion. Therefore, the
value for this parameter was estimated using the method reported previously (10).
)][
(1
)][
(
+
+
+
+=
H
KH
Kba
ya
a
Page 9
9
Results
Benzoic acid (1), phenylacetic acid (2), and the pyrrole-butanoic acid compound (3) were
completely soluble in 10% DMSO over the whole pH range used in the titrations. Sample
titration curves with no added bile salt are presented in Figure 2. These titration data were fit
very well by non-linear regression, with typical values of r2 for the fit exceeding 0.99, and the
standard error in the estimated value of the dissociation constant being less than 2%. The mean
values of the pKa determined for 1, 2, and 3 in this manner were 4.34±0.04, 4.42±0.02, and
4.99±0.05, respectively.
To examine the effect of the DMSO co-solvent on the dissociation constant, and to get an
estimate of the pKa values in 100% water, additional titrations were performed with varying
amounts of DMSO up to 20%(v/v). The results for 1, 2, and 3 are shown in Figure 3. The general
effect of the increasing concentration of DMSO was to move the chemical shift of both the acid
and conjugate base forms of these compounds upfield, with the difference in chemical shift in
10% and 20% DMSO being 0.2-0.3 ppm. Thus, there was an overall shift of the titration curves
downward in the vertical direction, and to the right in the horizontal direction, resulting in an
increase in the apparent pKa. It was found that the pKa was linearly proportional to the vol%
DMSO over this small range of percentages (Fig. 3). The extrapolated values of the pKas in
water (0% DMSO) were 4.14 (1), 4.27 (2), and 4.67 (3). The literature values of the pKas for 1
and 2 in water are 4.19, and 4.28, respectively. The pKa for 3 has not been determined
previously, but the value for butanoic acid (4.83) represents a reasonable approximation. These
literature values in water are in good agreement with the extrapolated values from this work. The
results obtained with these compounds are quite similar to those obtained previously concerning
Page 10
10
the effects of added DMSO (20). The one difference is that the pKa was found to be linearly
correlated with the vol% DMSO in this work, instead of the log vol% as was found in the earlier
studies. The reason for this difference has been explained recently and is associated with the
difference in methodology (21).
The effect of DMSO co-solvent on the pKa for 1 is in very good agreement with the work
of Rubino and Berryhill (22). Those authors attributed the effects of the co-solvent on the pKa to
both electrostatic and non-electrostatic medium effects. Theory suggests that the pKa should be
inversely proportional to the dielectric constant of the medium, and the increase in apparent pKa
that is observed in DMSO is consistent with that idea (23). However, the pKa of 2 was also
determined in 10%(v/v) N-methylformamide (dielectric constant 170), and was found to be 4.39,
compared to 4.49 in 10% DMSO. Although the change in pKa is in the right direction, it might
be expected that the value would be less than that for pure water, which was not the case. Thus,
additional factors beyond a simple medium effect appear to be involved.
The effects of bile salts on the apparent acidities of 1, 2, and 3 were determined next, and
the results for 3 in the absence and presence of 40mM taurodeoxycholate (TDC) are shown in
Fig. 4. The effect of the bile salt on chemical shift was somewhat different from that of DMSO.
The chemical shift of the anion was not greatly affected, while that of the acid was shifted
upfield by approximately 0.6 ppm. The calculated pKa was higher than the value without bile
salt, by about 0.30 pH units, and this difference was statistically significant. The results suggest
significant interaction of fully protonated 3 with TDC, but little interaction of the anionic
conjugate base with the bile salt. The interaction with the anion is presumably weaker because of
charge repulsion between it and the negatively charged bile salt monomers and micelles. The
reason for the upfield shift of the carboxyl resonance in bile salt solution is not clear, but might
Page 11
11
be due to disruption of hydrogen-bonded dimers of the carboxylic acid by interaction with the
bile salt. This explanation was proposed for the solvent effect on the carboxyl chemical shift of
acetic acid (24). Results with 1 and 2 were very similar to those for 3, but the magnitudes of the
shifts were smaller than those observed for 3. Results using the bile salt taurocholate (TC) were
very similar to those using TDC.
To examine whether the observed effects were due to interactions with bile salt
monomers and/or micelles, the carboxyl chemical shifts of 1, 2, and 3 were determined in a
series of solutions of varying bile salt concentration in 10% DMSO/90% 0.1M acetic acid
(pH≈3.0), and 10% DMSO/90% phosphate (pH≈8). In acid solution, the chemical shift decreased
slowly up to approximately 5 mM TDC or 15 mM TC, and then decreased more rapidly as bile
salt concentration was increased further, up to 40 mM. Representative results are shown in
Figure 5 for 3. The results for 1 and 2 were very similar, and the data for all three compounds
are consistent with micellar solubilization in these solutions. The cmc’s for TC and TDC in
aqueous solutions are known to be 8-10 mM and 2-4 mM, respectively (25). The effect of the
DMSO co-solvent on the cmc of these bile salts has not been investigated. However, it might be
expected that the cmc would be increased slightly due to the decreased polarity of the medium.
As would be expected from the results shown in Figure 4, the effect of bile salt concentration on
chemical shift at pH 8 was much smaller in all cases.
Typical titration data for 4 in 40mM TDC and TC solutions (20%DMSO) are presented
in Figure 6. For 4, the mean pKa values were 5.87 and 5.51in TDC and TC solutions,
respectively. From the dependence of the pKa on the bile salt concentration (results not shown),
an extrapolated pKa value with no bile salt was determined to be 4.93. Thus the shift in apparent
pKa in the presence of TDC is almost 1 pH unit. From the dependence of the pKa of 4 on the
Page 12
12
Vol% DMSO in the solvent (results not shown), extrapolated values in 10%(v/v) DMSO were
obtained, and were found to be 5.74 and 5.27 for 40mM TDC and 40mM TC, respectively. Thus
the estimated ∆pK values in 10% DMSO are significantly higher than those for 1, 2, and 3 under
the same conditions. Table 1 shows the effects of bile salt on the carboxyl chemical shift of 4 at
low and high pH. First, the changes in chemical shift are significantly larger than those observed
for 3, indicating greater interaction of both the anionic and neutral forms of 4 with bile salt than
was the case with the monopyrrole. Secondly, TDC has a greater effect than TC, but the effects
are much more pronounced at low pH than at high pH.
Titration data for 5 in 40mM TDC, 20% DMSO are shown in Figure 7. Since it was not
possible to determine the chemical shift of the monoanion from the titration data, this data was
analyzed three different ways. Using the curve-fitting procedure, and allowing the monoanion
chemical shift to take on a best-fit value, pKa1 and pKa2 values of 6.2 and 6.5 were obtained.
However, the dependence on the monoanion chemical shift was very high, and errors in the
estimation of pKa1 and pKa2 were between 10 and 20%. Prior work on 5 and other dicarboxylic
acid compounds showed that the titration data could be fit reasonably well by using correction
factors obtained from the titration of adipic acid. (10, 11) Applying that approximation to our
data for 5, values of pKa1 and pKa2 were estimated to be 6.4 and 7.0. Lastly, an assumption was
made that the chemical shift of the monoanion is approximately the average of those for the acid
and dianion. Using this approximation, estimated pKa1 and pKa2 values were 6.3 and 6.9. The
errors in all these estimated values are at least 10%. However, it is clear from the titration curve
that both pKa values are in the range 6.0 - 7.3, and we estimate pKa1 to be 6.2-6.4 and pKa2 to be
6.4-7.0. We did not determine the pKa values for this compound with no bile salt present,
because of solubility problems. However, these values in comparable solvents were reported
Page 13
13
previously, and, for example, were approximately 5.2 and 5.9 in 27 vol% DMSO (10). By
varying the vol% DMSO in the solvent, we were able to estimate values for pKa1 and pKa2 of 5
in 10% DMSO, 40 mM TDC of 5.9 and 6.5. Thus, in 10% DMSO, the bile salt at 40mM
concentration causes a shift in apparent pKa of about 1 pH unit for the tetrapyrrole. In pure water
we would expect the pKa1 and pKa2 values with 40mM TDC to be similarly shifted, with values
between 5.6-6.6.
We were unable to obtain a complete titration curve for 5 in 20% DMSO in the presence
of 40mM TC. Below pH 6.5, the carboxyl-13C peak was not observed, even after overnight
scanning. However, the data obtained at pH>6.5 are plotted in Fig. 7. From these data it appears
that the pKa shift for 5 in TC solution would be less than that in TDC solution, as was found for
compounds 1 through 4.
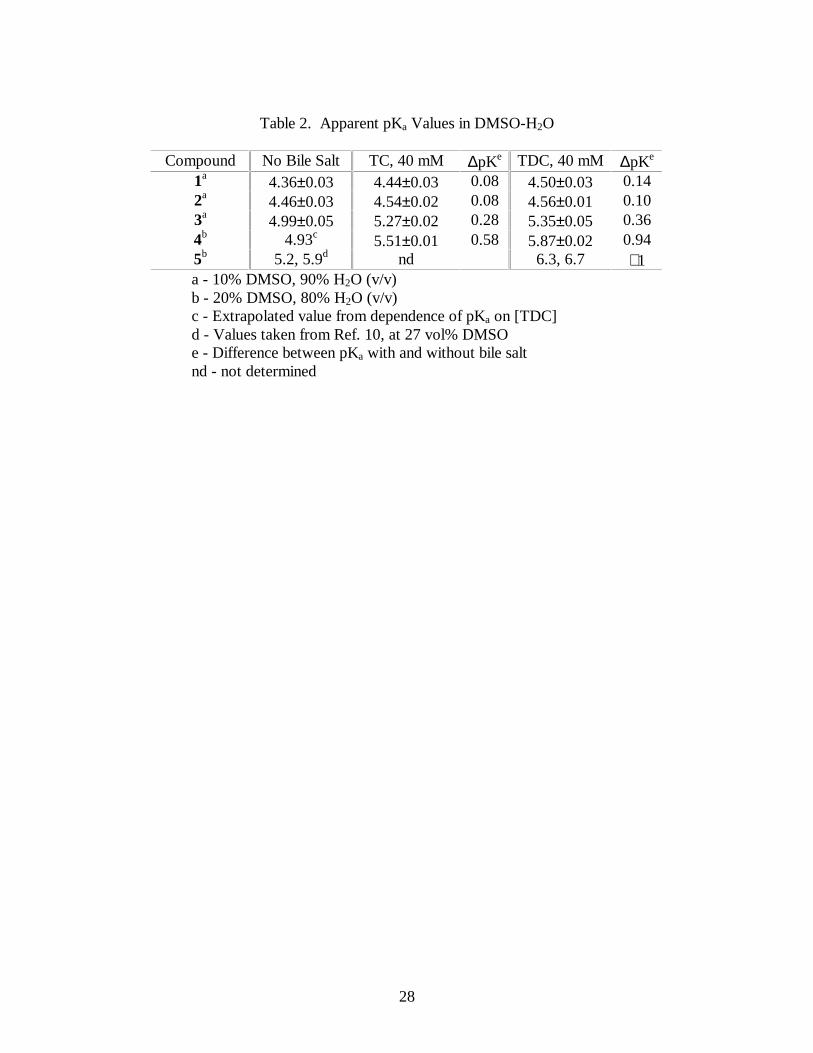
Table 2 lists the experimentally determined pKa values for all five compounds in
solutions without bile salt present compared to those in samples containing either TC or TDC (40
mM). The magnitude of the increase in pKa in the presence of bile salt is smallest for the simple
aromatic acids 1 and 2, and increases as the size of the parent acid increases, and the
corresponding water solubility decreases. The increase in pKa is always greatest for TDC
solutions compared to TC solutions, and this difference in the effect of the two bile salts on pKa
increases as the size and nonpolar character of the compounds increases.
Page 14
14
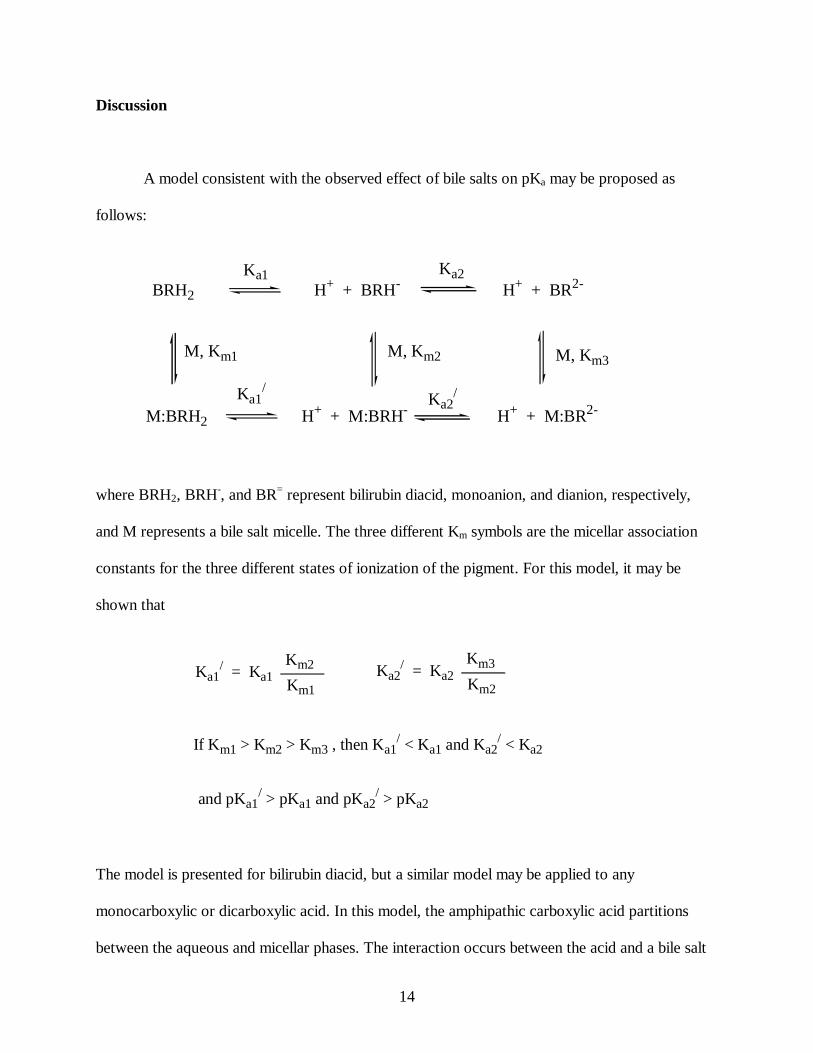
Discussion
A model consistent with the observed effect of bile salts on pKa may be proposed as
follows:
BRH2 H+ + BRH- H+ + BR2-
Ka1 Ka2
M:BRH2 H+ + M:BRH- H+ + M:BR2-Ka1
/Ka2
/
M, Km1 M, Km2 M, Km3
where BRH2, BRH-, and BR= represent bilirubin diacid, monoanion, and dianion, respectively,
and M represents a bile salt micelle. The three different Km symbols are the micellar association
constants for the three different states of ionization of the pigment. For this model, it may be
shown that
Ka1/ = Ka1
Km2
Km1Ka2
/ = Ka2Km3
Km2
If Km1 > Km2 > Km3 , then Ka1/ < Ka1 and Ka2
/ < Ka2
and pKa1/ > pKa1 and pKa2
/ > pKa2
The model is presented for bilirubin diacid, but a similar model may be applied to any
monocarboxylic or dicarboxylic acid. In this model, the amphipathic carboxylic acid partitions
between the aqueous and micellar phases. The interaction occurs between the acid and a bile salt
Page 15
15
micelle. This interaction could also be with bile salt monomer, but the results indicate that
monomer interaction is probably insignificant, and this is supported by our prior spectroscopic
investigations (17). Complexation in the micellar phase is assumed to occur by hydrophobic
interactions, analogous to the model proposed by McGown for bile salt solubilization of
polycyclic aromatic hydrocarbons (26), and also suggested by our prior studies of bilirubin and
xanthobilirubic acid with bile salts (17, 27). It is assumed that all the equilibria depicted are
established rapidly, and that an observed carboxyl chemical shift is the time average of the
chemical shifts of all acid and conjugate base species present in the sample. Since the acid is in a
less polar environment in the micellar phase, the observed chemical shift of the carboxyl carbon
should decrease, i.e., the resonance should be shifted upfield, analogous to the reported solvent
effects on C-13 chemical shifts of carbonyl groups (28). This “solvent effect” might also occur
by interaction of the acid with bile salt monomers. However, as shown in Figure 5, the changes
in chemical shift did not become significant until the concentrations of the bile salts were
increased to levels that exceeded the known cmc values for these surfactants.
Since the acid partitions between the aqueous and micellar phases, the relative acidity
will be decreased, i.e., the apparent pKa will increase, because of the decrease in activity of the
acid in the bulk solvent. As the water solubility of the series of acids decreases, the relative pKa
values should increase because of greater partitioning of the more nonpolar compounds into the
micellar phase. The presence of bile salt monomers in the bulk solvent is expected to decrease
the dielectric constant of the medium. This also would produce an increase in apparent pKa due
to the medium effect. However, this effect is assumed to be small because of the relatively low
concentration of the bile salts in these experiments.
Page 16
16
It is possible that both the acid and conjugate base forms of these compounds partition
into the micellar phase, although the complexation of the anions would be less likely due to
electrostatic repulsion. The NMR data clearly indicate that there is little, if any, interaction of the
anions of 1, 2, and 3 with bile salt aggregates, but that there is interaction of the anions of 4 and 5
with the micelle phase. In the case of 4 and 5, the magnitudes of the chemical shift changes
indicate weaker interaction of the conjugate bases compared to the parent acids, as expected. In
any case, the magnitude of the shift in pKa should increase with the relative propensity of the
compound to be sequestered in the micellar phase. This should be the least for 1 and greatest for
5, and is consistent with the experimental results.
The proposed model, while consistent with the results of these studies, is oversimplified,
and does not take into account other factors such as electrostatic effects at the micelle-water
interface. Fernandez and Fromherz studied the pK shifts of certain pH indicators in micellar
solution, and found, for example, a substantial increase in pKa for incorporation of
hydroxycoumarin in SDS micelles (29). They attributed the pKa shift to the reduced polarity at
the micelle surface, and also to the effect of the electrical potential at the surface of the charged
micelles. The pKa shifts that we have observed in bile salt solutions appear to be similar in
character to those reported for SDS. However, knowledge of the equilibria involved is
incomplete, and the factors contributing to the pKa shifts cannot be accurately defined from our
results. The effect of bile salt on the pKa of these compounds is similar to that recently reported
for bile salt solubilization of retinoic acid and derivatives (30). Our results are also similar to
those reported earlier for the ionization behavior of cholic acid in micelles and membranes (31),
and for the acidity of fatty acids when bound to proteins and membranes (32). The micellar
Page 17
17
complexation model that we have used is similar to those proposed for complexation of aromatic
carboxylic acids by cyclodextrins (33, 34).
Taurocholate (TC) is a trihydroxy-substituted bile salt, while taurodeoxycholate (TDC) is
dihydroxy-substituted. TC is thus somewhat more polar than TDC, as reflected in the higher cmc
value for this species. Assuming that micellar solubilization of the compounds in this study
occurs by hydrophobic interaction with the non-polar faces of the bile salts, the
microenvironments provided by TC and TDC would not be expected to differ greatly. It is
known, however, that the size and shape of the micelles formed by these two species are
different (35, 36). Based on the relative polarities of the two bile salts, it can be predicted that the
observed pKa values should be higher in TDC solution than in TC solution. The results are
consistent with this prediction. Whether the difference in these values is due to differences in the
structure of the micellar complexes or to a more general type of medium effect cannot be
determined from these results.
The results of this study help to explain earlier results on the effects of pH on various
properties of bilirubin in aqueous solutions of bile salts. Specifically, the light scattering intensity
of such solutions, as well as the capacity factor of bilirubin in capillary electrophoresis (CE)
experiments, have been shown to have a marked pH dependency. Some of the relevant light
scattering data are presented in Figure 8. Plotted along with this data is the relative concentration
of the fully protonated form of bilirubin, calculated using the pKa1 and pKa2 values determined in
this study. The data strongly suggest that the observed variations in these properties with pH are
coincident with the formation of the fully protonated acid. The increase in light scattering
intensity would be due to formation of colloidal aggregates of the pigment, a process that would
be more favorable for the neutral species. The increase in CE capacity factor might also involve
Page 18
18
aggregation, but might also be due to the reduced mobility of the pigment in the electric field
upon charge neutralization.
The results also have implications concerning the biophysical chemistry of bile fluid. The
pH of hepatic bile varies between 5.7-8.6, with a typical value of about 7.6, while the pH of
concentrated gallbladder bile has been reported to be 6.1-8.6, with a typical value of about 6.8
(37). There has been disagreement about the state of ionization of bilirubin in these fluids, due to
the lack of widely accepted values for the ionization constants of the pigment in relevant media.
Assuming that bilirubin behaves like mesobilirubin XIIIα (5) in bile salt solution, the molecule
in bile will be a weaker acid than in pure water. Between pH 6 and 7 monoanionic forms would
predominate, but significant amounts of the fully protonated species might also be present. The
distribution of the various acid and base forms of the pigment would depend on the respective
micellar partition coefficients of these species. In any case, the existence of significant amounts
of the protonated forms in gallbladder bile would enhance the likelihood of aggregation and
precipitation of the pigment. Bile fluid is a much more complex medium than a simple bile salt
solution, but it is expected that similar effects on the acidity of bilirubin will be found when it is
solubilized in solutions containing mixed micelles of bile salts and phospholipids.
Page 19
19
Acknowledgements
This work was supported by the National Science Foundation (Grant Nos. CHE-9531357
and CHE-9820176), the Robert A. Welch Foundation (Grant No. W-0031), and the National
Institutes of Health (Grant No.HD17779). We thank Drs. Darren Holmes and Bernhard Knipp
for synthesis work directed toward the preparation of compounds 3-5.
Page 20
20
References
1. Berk, P. D., and Noyer, C. (1994) Seminars in Liver Disease 14 , 323-394
2. Chowdury, J. R., Wolkoff, A. W., Chowdury, N. R., and Arias, I. M. (1995), in The
Metabolic and Molecular Bases of Inherited Disease (Scriver, C. R., Beaudet, A. L., Sly,
W. S., and Valle, D., eds.) Vol II, pp. 2161-2208, McGraw-Hill, Inc., New York.
3. Neuzil, J., and Stocker, R. (1994) J. Biol. Chem. 269, 16712-16719.
4. Krasner, J., and Yaffe, S. J. (1973) Biochem. Med. 7, 128-134.
5. Lee, J. J., Daly, L. H., and Cowger, M. L. (1974) Res. Commun. Chem. Pathol.
Pharmacol. 9, 763-770.
6. Kolosov, I. V., and Shapolovenko, E. P. (1977) Zh. Obshch. Khim. 47, 2149-2151.
7. Hansen, P. E., Thiessen, H., and Brodersen, R. (1979) Acta Chem. Scand. 33, 281-293.
8. Moroi, Y., Matuura, R., and Hisadome, T. (1985) Bull. Chem. Soc. Jpn. 58, 1426-1431.
9. Hahm, J.-S., Ostrow, J. D., Mukerjee, P., and Celic, L. (1992) J. Lipid Res. 33, 1123-
1137.
Page 21
21
10. Lightner, D. A., Holmes, D. L., and McDonagh, A. F. (1996) J. Biol. Chem. 271, 2397-
2405.
11. Trull, F. R., Boiadjiev, S., Lightner, D. A., and McDonagh, A. F. (1997) J. Lipid Res. 38,
129-139.
12. Perrin, J. H., and Wilsey, M. (1971) Chem. Commun. , 769-770.
13. Puranam, K. L., and Balaram, P. (1987) Proc. Ind. Acad. Sci. 98, 453-468.
14. Ostrow, J. D., Celic, L., and Mukerjee, P. (1988) J. Lipid. Res. 29, 335-348.
15. D’Alagni, M., Galantini, L., Giglio, E., Gavuzzo, E., and Scaramuzza, L. (1994) J. Chem.
Soc. Faraday Trans. 90, 1523-1532.
16. Nittler, M. P., Desai, R. A., Salikof, D. A., Kurtin, W. E., and Bushey, M. M. (1997) J.
Chromatogr. A 779, 205-214.
17. Kurtin, W. E., Heo, R., Breimeir, D. J., Tran, N. T.-V., Elizondo, E., Salas, R. E.,
Morales, M., Huang, L., and Frank, B. (1998) J. Chem. Soc., Perkin Trans. 2, 1677-1682.
18. Dörner, T., Knipp, B., and Lightner, D. A. (1997) Tetrahedron 53, 2697-2716.
Page 22
22
19. Lightner, D. A., Ma, J.-S., Adams, T. C., Franklin, R. W., and Landen, G. L. (1983) J.
Heterocycl. Chem. 21, 139-144.
20. Holmes, D. L., and Lightner, D. A. (1995) Tetrahedron 51, 1607-1622.
21. McDonagh, A. F., Phimister, A., Boiadjiev, S. E., and Lightner, D. A. (1999)
Tetrahedron Lett. , in press.
22. Rubino, J. T., and Berryhill, W. S. (1986) J. Pharm. Sci. 75, 182-186.
23. Bates, R. G. (1973 Determination of pH, Theory and Practice, 2nd. Ed., John Wiley &
Sons, New York.
24. Maciel, G., and Traficante, D. D. (1966) J. Am. Chem. Soc. 88, 220-223.
25. Roda, A., Hofmann, A. F., and Mysels, K. J. (1983) J. Biol. Chem. 258, 6362-6370.
26. Li, G., and McGown, L. B. (1994) J. Phys. Chem. 98, 13711-13719.
27. Kurtin, W. E., Reck, D., Lafontaine, J., DeLeon, M., and Tran, N. T.-V. (1993) J. Chem.
Soc., Perkin Trans. 2, 2393-2397.
Page 23
23
28. Maciel, G. E., and Natterstad, J. J. (1965) J. Chem. Phys. 42, 2752-2759.
29. Fernandez, M. S., and Fromherz, P. (1977) J. Phys. Chem. 81, 1755-1761.
30. Han, C.-H., Zimmerman, C. L., and Wiedmann, T. S. (1998) Int. J. Pharmaceut. 172,
229-240.
31. Cabral, D. J., Hamilton, J. A., and Small, D. M. (1986) J. Lipid Res. 27, 334-343.
32. Hamilton, J. A. (1995), in Carbon-13 NMR Spectroscopy of Biological Systems
(Beckman, N., ed.) Academic Press, San Diego, CA, pp. 117-157.
33. Gelb, R. I., Schwartz, L. M., Johnson, R. F., and Laufer, D. A. (1979) J. A m. Chem. Soc.
101, 1869-1874.
34. Junquera, E., and Aicart, E. (1997) J. Phys. Chem. B 101, 7163-7171.
35. Carey, M. C., and Small, D. M. (1972) Arch. Intern. Med. 130, 506-527.
36. D’Alagni, M., D’Archivio, A. A., Giglio, E., and Scaramuzza, L. (1994) J. Phys. Chem.
98, 343-353.
Page 24
24
37. Eastwood, M. A., and Mitchell, W. D. (1979) Scientific Basis of Gastroenterology,
(Duthie, H. L., and Wormsley, K. G., eds.), Churchill Livingstone, New York, NY, p.
289.
Footnotes
1The abbreviations used are: TC, sodium taurocholate; TDC, sodium taurodeoxycholate;
DMSO, dimethyl sulfoxide.
Page 25
25
Figure Legends
Fig.1 Molecular structures of 13C-enriched compounds and bile salts used in this study. (1)
benzoic acid; (2) phenylacetic acid; (3) 3,5-dimethyl-2-methoxycarbonyl-1H-pyrrole-4-butanoic
acid; (4) xanthobilirubic acid; (5) mesobilirubin XIIIα
Fig.2 13C NMR titration curves for carboxy 13C-enriched compounds in 10% DMSO, 90%
H2O (v/v). Benzoic acid (1, - -); carboxy 13C-enriched phenylacetic acid (2, -�
-); carboxy 13C-
enriched pyrrole butanoic acid (3, - -).
Fig. 3 Dependence of the experimentally determined pKa values on the vol% DMSO in the
solvent. Benzoic acid (1, - -); carboxy 13C-enriched phenylacetic acid (2, - � -); carboxy 13C-
enriched pyrrole butanoic acid (3, - -).
Fig. 4 Effect of bile salt on the 13C NMR titration curve for 3 in 10% DMSO, 90% H2O
(v/v). Curve without bile salt (- -); curve with 40mM taurodeoxycholate (- -).
Fig. 5 Effect of bile salt concentration on the carboxyl-13C chemical shift of 3 in 10%
DMSO, 90% H2O (v/v). Taurocholate (- -); taurodeoxycholate (- -).
Fig. 6 Effect of different bile salts on the 13C NMR titration curves for carboxy 13C-
enriched xanthobilirubic acid (4) in 20%DMSO, 80% H2O (v/v). 40mM taurocholate (- -);
40mM taurodeoxycholate (- -).
Page 26
26
Fig. 7 Effect of different bile salts on the 13C NMR titration curves for carboxy 13C-
enriched mesobilirubin XIIIα (5) in 20%DMSO, 80% H2O (v/v). 40mM taurocholate ( ���
40mM taurodeoxycholate (- -).
Fig. 8 Comparison of the pH dependence of the normalized light scattering intensity
and relative concentration of diacid species for bilirubin in solution with the bile salt
taurocholate. Light scattering data from Ref. 16, for bilirubin in 20 mM sodium taurocholate
(- -); calculated relative concentration of bilirubin diacid species, based on estimated pKa values
for bilirubin of 5.8 and 6.4 (- -). All data are normalized to the value at pH 5.
Page 27
27
Table 1. Effect of Bile Salt on Carboxyl Chemical Shift of XBR(4) at Low and High pH _____________________________________________ Bile Salt pH ∆δa (ppm) _____________________________________________ TC, 40mM 2.5 1.19 TDC, 40mM 2.5 1.51 TC, 40 mM 8.5 0.19 TDC, 40mM 8.5 0.21 _____________________________________________ a - ∆δ = [δ(no bile salt) - δ(40mM bile salt) ]
Page 28
28
Table 2. Apparent pKa Values in DMSO-H2O
Compound No Bile Salt TC, 40 mM ∆pKe TDC, 40 mM ∆pKe
1a 4.36±0.03 4.44±0.03 0.08 4.50±0.03 0.14 2a 4.46±0.03 4.54±0.02 0.08 4.56±0.01 0.10 3a 4.99±0.05 5.27±0.02 0.28 5.35±0.05 0.36 4b 4.93c 5.51±0.01 0.58 5.87±0.02 0.94 5b 5.2, 5.9d nd 6.3, 6.7 ∼1
a - 10% DMSO, 90% H2O (v/v) b - 20% DMSO, 80% H2O (v/v) c - Extrapolated value from dependence of pKa on [TDC] d - Values taken from Ref. 10, at 27 vol% DMSO e - Difference between pKa with and without bile salt nd - not determined