104
ANNUAL REPORT TO STOCKHOLDERS 2006

A N N U A L R E P O R T T O S T O C K H O L D E R S 2 0 0 6
AC
ME
P
AC
KE
T,
I
NC
.• A
NN
UA
L
RE
PO
RT
T
O
ST
OC
KH
OL
DE
RS
2
00
6
Corporate Office
Acme Packet, Inc.
71 Third Avenue
Burlington, MA 01803
Corporate Telephone (781) 328-4400
Corporate Fax (781) 425-5077
Investor Relations Telephone: (781) 328-4790
www.acmepacket.com
278279_Acme.cover.final:Layout 1 3/21/07 5:43 PM Page 1

Acme Packet, Inc. (NASDAQ: APKT), the leader in session border controlsolutions, enables service providers to deliver trusted, first class interac-tive communications – voice, video and multimedia sessions – across IPnetwork borders. Our Net-Net family has been selected by over 360 serviceproviders in 75 countries to satisfy critical security, service assurance andregulatory requirements in wireline, cable and wireless networks. Ourcustomers include 23 of the top 25, and 72 of the top 100 serviceproviders in the world. These deployments support multiple applications– from VoIP trunking to hosted enterprise and residential services tofixed mobile convergence; multiple protocols – SIP, H.323, MGCP/NCSand H.248; and multiple border points – interconnect, access networkand data center. For more information, contact us at (781) 328-4400, orvisit www.acmepacket.com.
2004 2005 2006 2004 2005 2006
$15,993
$36,120
$84,070
($6,957) ($35)
$28,864
T OTA L R E V E N U E(in thousands)
N E T I N C O M E(in thousands)
F I N A N C I A L H I G H L I G H T S(in thousands)
Fiscal Year 2006 2005 2004Statements of Operations DataTotal revenue $84,070 $36,120 $15,993Gross profit 66,495 26,893 10,198 Total operating expenses 43,313 27,276 17,299 Net income (loss) 28,864 (35) (6,957)
Balance Sheet DataCash and cash equivalents $118,714 $15,369 $16,748 Total assets 153,923 30,399 25,902 Total stockholders’ equity 130,937 17,723 17,634
278279_Acme.cover.final:Layout 1 2007.03.27 17:25 Page 2
1
Dear fellow stockholder:
I am pleased to report that 2006 was a year of significant progress for the Company.We begin our new fiscal year well positioned as the leader in one of the fastest growing areas in the Internet Protocol (IP) communications industry—the SessionBorder Controller (SBC) market. Some of Acme Packet’s key accomplishments in2006 include:
• We added over 150 new customers around the world, including such industryleaders as Broadwing, Impsat Fiber Networks, KDDI, Korea Telecom, Brasil Telecom and Vodafone Spain.
• We expanded our customer base to just over 360 service providers, including72 of the 100 largest Tier-1 service providers in the world.
• We expanded our leadership position1 in the SBC market to 50%.
• We delivered several new innovative demand-driven solutions to the market, including our Net-Net SBC 9200 and new configurations, which decompose theSBC into separate signaling and media control systems, including the Net-Net Border Gateway, Net-Net Session Controller and Net-Net Signaling Firewall.
• We achieved record revenue and earnings, including four consecutive quartersof profitability.
These accomplishments reflect the growing recognition of the value that Acme Packet’sSBCs can have in IP-based communications networks and the role they can play in how the world communicates. Our service provider customers deploy our solutions in order to lower operating costs and accelerate the delivery of new IP-based service offerings to the market. Our ability to help our customers realizeboth of these objectives has translated into substantially improved financial results for our Company.
In 2006, revenues increased 133% to $84.1 million from $36.1 million in 2005, reflecting continued strong new customer acquisition as well as expanding deploy-ments within many of our existing customers’ networks. Earnings growth was alsorobust, with net income of $28.9 million compared to break-even bottom-line resultsin 2005. This earnings growth—coupled with our recent initial public offering—enabled us to bolster our balance sheet, ending 2006 with cash and cash equivalentsof $118.7 million and no debt. We believe Acme Packet is in a much stronger strategicand financial position than at any time in its history.
Andrew D. OryPresident, Chief Executive Officer and Co-FounderAcme Packet, Inc.
278279_Acme Annual.final.4pager:Acme Annual.07.1 3/26/07 2:18 PM Page 1

Our vision: Session border controllers at every IP network edge
Since pioneering the SBC market in 2000, we have built a company and helped shapean industry around a basic belief that SBCs will eventually become ubiquitous atevery network edge within IP-based networks. Prior to the advent of the SBC, IP net-work infrastructure equipment such as softswitches, routers and data firewalls, wereable to initiate and route undifferentiated data, but lacked the ability to specificallytarget the management of interactive communications sessions. SBCs act as the sourceand destination for all signaling messages and media streams entering and exitingthe provider’s network. SBCs are deployed at the borders of IP networks, such as between two service providers (referred to as an interconnect border); between aservice provider and its business, residential or mobile customers (referred to as access-backbone borders); or between a service provider’s network and its datacenter (referred to as a data center border).
Our products, which are powered by our patented technology and proprietary hard-ware and software, provide critical security and control elements for the next gener-ation networks being deployed by wireline, wireless and cable IP communicationservice providers. Our products serve as a central element in unifying separate IP interactive communication networks and provide our customers with keycontrol functions in five important areas: security, service reach, service assurance,revenue and profit protection and regulatory compliance.
Our customers share our belief that there is valuein transitioning interactive communications fromthe legacy telephone network to an all-IP-basednetwork. By enabling our customers to delivertrusted, first-class interactive IP communicationservices, we allow our customers to realize oper-ating expense savings over traditional telephonenetworks. What’s more, we also enable our cus-tomers to deliver innovative and valuable newservice offerings—such as Voice over IP (VoIP),video conferencing, real time distance learning,multimedia collaboration, presence-based serv-ices, fixed mobile convergence and gaming—totheir customers with the same quality assuranceand security as they historically have offered forvoice services over their legacy telephone net-works. The ability to lower operating costs andaccelerate new innovative service offerings to themarket is driving more and more companies to
2
We have built a company and helped shape
an industry around a basic belief that session
border controllers (SBCs) will eventually become
ubiquitous at every network edge within IP-based
networks. More than 360 service provider
customers—including 72 of the 100 largest tier
one providers in the world—deploy our SBC
solutions to lower operating costs and accelerate
the delivery of new IP-based service offerings
to the market. Our ability to help our customers
realize both of these objectives has translated into
improved financial results for our Company.
278279_Acme Annual.final.4pager:Acme Annual.07.1 3/26/07 2:20 PM Page 2

3
embrace IP-enabled strategies for their next generation network architectures and is driving rapid growth in the SBC market. According to Infonetics Research1, a mar-ket research and consulting firm specializing in IP data networking and telecommu-nications, the SBC market is expected to grow from $143 million in 2006 to $592million by 2010—a compounded average annual growth rate of 43%. As the clearleader in our marketplace, we believe we are well positioned to capitalize on thismarket-growth opportunity.
Customer leadership across
multiple dimensions
We believe that we have emerged as the leader in a very fragmented market. According to InfoneticsResearch1, our market share grew to 50% by the endof 2006. Our SBCs are now deployed in the nextgeneration networks of over 360 service providercustomers in 75 countries. Our customer base hasbecome diverse in many dimensions including cus-tomer size, profile, access, service, border points and signaling protocol.
• We are the trusted partner of the world’s largest service providers: Our SBC solutions are now deployed at 72 of the top 100 service providers in the worldand enable VoIP offerings for 7 of the top 10 North American cable operators.
• We are a leader across all service provider profiles: Incumbent and competitivelocal exchange and long distance providers; international service providers; cableoperators; Internet telephony service providers, including offerings from leadingportal providers; and voice application service providers.
• We are a leader in multiple access networks including wireline, cable, wireless and Internet.
• We are a leader across the IP network border points, including access, intercon-nect or peering, and data center.
• We are a leader across major services and applications, including hosted voice,video and multimedia communications, IP PBX trunking, PSTN termination andorigination, fixed-mobile convergence, gaming, contact centers, directory services, calling card, emergency (E-911) and lawful intercept services.
• We are a leader among signaling protocols, including SIP, H.323, MGCP/NCSand H.248.
The ability to lower operating costs and accelerate
new innovative service offerings to the market is
driving more and more companies to embrace
IP-enabled strategies for their next generation
network architectures and is driving rapid growth
in the SBC market. According to Infonetics
Research1 the SBC market is expected to grow at
a compounded average annual growth rate of
43% through 2010. As the clear leader in our
marketplace, we believe we are well positioned
to capitalize on this market-growth opportunity.
278279_Acme Annual.final.4pager:Acme Annual.07.1 2007.03.27 12:32 Page 3

4
1 Infonetics Research, Service Provider VoIP and IMS Equipment and Subscribers
Quarterly Worldwide Market Share and Forecasts, February 16, 2007
Our customers rely on our SBC technology to deliver trusted, interactive IP communication services. As these services proliferate and innovative new servicescome to market, we believe that the need for our SBCs will continue to grow. And because we have seen that service providers often elect to effectively single-sourcetheir SBC requirements, we believe there is great strategic value in winning new customers, establishing incumbency and expanding deployments over time. For thisreason, we believe that the depth and breadth of our customer base continue to bekey company strengths.
Our focus in 2007
Our performance in 2007 will be predicated on our continued dedication to the success of our customers; our ability to rapidly and pragmatically innovate to meet the needs of our customer base; our ability to focus on growth markets; and our ability to effectively leverage our partner program. We are confident that ourgrowth strategy will enable us to strengthen our leadership position in the SBC market.
On behalf of our employees and our Board of Directors, I thank you, our valuedstockholder, for the continued confidence you place in our vision for the SBC marketplace.
Sincerely,
Andrew D. OryPresident, Chief Executive Officerand Co-FounderAcme Packet, Inc.
278279_Acme Annual.final.4pager:Acme Annual.07.1 2007.03.27 12:33 Page 4

UNITED STATESSECURITIES AND EXCHANGE COMMISSION
Washington, D.C. 20549
FORM 10-K## ANNUAL REPORT PURSUANT TO SECTION 13 OR 15(d) OF THE SECURITIES EXCHANGE ACT OF 1934
For the fiscal year ended December 31, 2006or
"" TRANSITION REPORT PURSUANT TO SECTION 13 OR 15(d) OF THE SECURITIES EXCHANGE ACTOF 1934
Commission File Number: 001-33041
ACME PACKET, INC.(Exact name of registrant as specified in its charter)
Delaware 04-3526641(State or other jurisdiction of incorporation or organization) (I.R.S. Employer Identification No.)
71 Third AvenueBurlington, MA 01803
(Address of principal executive offices) (zip code)
(781) 328-4400(Registrant’s telephone number, including area code)
Securities registered pursuant to Section 12(b) of the Act:
Title of each class Name of each exchange on which registeredCommon Stock, $0.001 par value The Nasdaq Stock Market LLC
Securities registered pursuant to Section 12(g) of the Act: None.
Indicate by check mark whether the registrant is a well-known seasoned issuer, as defined in Rule 405 of the SecuritiesAct. Yes " No #
Indicate by check mark whether the registrant is not required to file reports pursuant to Section 13 or Section 15(d) ofthe Act. Yes " No #
Indicate by check mark whether the registrant (1) has filed all reports required to be filed by Section 13 or 15(d) of theSecurities Exchange Act of 1934 during the preceding 12 months (or for such shorter period that the registrant was requiredto file such reports), and (2) has been subject to such filing requirements for the past 90 days. Yes # No "
Indicate by check mark if disclosure of delinquent filers pursuant to Item 405 of Regulation S-K is not contained hereinand will not be contained, to the best of registrant’s knowledge, in definitive proxy or information statements incorporated byreference in Part III of this Form 10-K or any amendment to this Form 10-K. #
Indicate by check mark whether the registrant is a large accelerated filer, an accelerated filer, or a non-accelerated filer.See definition of “accelerated filer and large accelerated filer” in Rule 12b-2 of the Exchange Act. (Check one):
Large accelerated filer " Accelerated filer " Non-accelerated filer #
Indicate by check mark whether the registrant is a shell company (as defined in Rule 12b-2 of the Act).Yes " No #
The aggregate market value of common stock held by nonaffiliates of the registrant (19,217,882 shares) based on theclosing price of the registrant’s common stock as reported on the NASDAQ National Market on October 13, 2006, which wasthe first business day on which the registrant’s common stock was publicly traded, was $305,756,503. Shares of voting andnon-voting stock held by executive officers, directors and holders of more than 5% of the outstanding stock have beenexcluded from this calculation because such persons or institutions may be deemed affiliates. This determination of affiliatestatus is not a conclusive determination for other purposes.
58,648,031 shares of the registrant’s common stock were outstanding as of March 13, 2007.
DOCUMENTS INCORPORATED BY REFERENCE
The registrant intends to file a definitive Proxy Statement pursuant to Regulation 14A within 120 days of the end of thefiscal year ended December 31, 2006. Portions of such Proxy Statement are incorporated by reference into Part III of thisForm 10-K.

(This page has been left blank intentionally.)

1
TABLE OF CONTENTS
PART IItem 1. Business . . . . . . . . . . . . . . . . . . . . . . . . . . . . . . . . . . . . . . . . . . . . . . . . . . . . . . . . . . . . . . . . . . . . 3Item 1A. Risk Factors. . . . . . . . . . . . . . . . . . . . . . . . . . . . . . . . . . . . . . . . . . . . . . . . . . . . . . . . . . . . . . . . . 19Item 1B. Unresolved Staff Comments. . . . . . . . . . . . . . . . . . . . . . . . . . . . . . . . . . . . . . . . . . . . . . . . . . . 35Item 2. Properties. . . . . . . . . . . . . . . . . . . . . . . . . . . . . . . . . . . . . . . . . . . . . . . . . . . . . . . . . . . . . . . . . . . 35Item 3. Legal Proceedings . . . . . . . . . . . . . . . . . . . . . . . . . . . . . . . . . . . . . . . . . . . . . . . . . . . . . . . . . . . 35Item 4. Submission of Matters to a Vote of Security Holders . . . . . . . . . . . . . . . . . . . . . . . . . . . . . 35
PART IIItem 5. Market for Registrant’s Common Equity, Related Stockholder Matters and
Issuer Purchases of Equity Securities . . . . . . . . . . . . . . . . . . . . . . . . . . . . . . . . . . . . . . . . . 36Item 6. Selected Financial Data. . . . . . . . . . . . . . . . . . . . . . . . . . . . . . . . . . . . . . . . . . . . . . . . . . . . . . . 39Item 7. Management’s Discussion and Analysis of Financial Condition and Results
of Operations . . . . . . . . . . . . . . . . . . . . . . . . . . . . . . . . . . . . . . . . . . . . . . . . . . . . . . . . . . . . . 40Item 7A. Quantitative and Qualitative Disclosure About Market Risk. . . . . . . . . . . . . . . . . . . . . . . 58Item 8. Financial Statements and Supplementary Data . . . . . . . . . . . . . . . . . . . . . . . . . . . . . . . . . . 59Item 9. Changes in and Disagreements with Accountants on Accounting and
Financial Disclosure . . . . . . . . . . . . . . . . . . . . . . . . . . . . . . . . . . . . . . . . . . . . . . . . . . . . . . . 84Item 9A. Controls and Procedures. . . . . . . . . . . . . . . . . . . . . . . . . . . . . . . . . . . . . . . . . . . . . . . . . . . . . . 84Item 9B. Other Information . . . . . . . . . . . . . . . . . . . . . . . . . . . . . . . . . . . . . . . . . . . . . . . . . . . . . . . . . . . 84
PART IIIItem 10. Directors and Executive Officers of the Registrant . . . . . . . . . . . . . . . . . . . . . . . . . . . . . . . 85Item 11. Executive Compensation. . . . . . . . . . . . . . . . . . . . . . . . . . . . . . . . . . . . . . . . . . . . . . . . . . . . . . 85Item 12. Security Ownership of Certain Beneficial Owners and Management and
Related Stockholder Matters . . . . . . . . . . . . . . . . . . . . . . . . . . . . . . . . . . . . . . . . . . . . . . . . 85Item 13. Certain Relationships and Related Transactions and Director Independence . . . . . . . . 85Item 14. Principal Accountant Fees and Services. . . . . . . . . . . . . . . . . . . . . . . . . . . . . . . . . . . . . . . . . 85
PART IVItem 15. Exhibits, Financial Statement Schedules . . . . . . . . . . . . . . . . . . . . . . . . . . . . . . . . . . . . . . . . 86
SIGNATURES. . . . . . . . . . . . . . . . . . . . . . . . . . . . . . . . . . . . . . . . . . . . . . . . . . . . . . . . . . . . . . . . . . . . . . . . . . . 88

2
SPECIAL NOTE REGARDING FORWARD-LOOKING STATEMENTS
The information in this Annual Report contains forward-looking statements within the meaning ofSection 27A of the Securities Act of 1933, as amended (“Securities Act”) and Section 21 E of the SecuritiesExchange Act of 1934, as amended (“Exchange Act”). Such statements are based upon currentexpectations that involve risks and uncertainties. Any statements contained herein that are not statementsof historical facts may be deemed to be forward-looking statements. We may, in some cases, use wordssuch as “project,” “believe,” “anticipate,” “plan,” “expect,” “estimate,” “intend,” “continue,” “should,”“would,” “could,” “potentially,” “will,” “may” or similar words and expressions that convey uncertainty offuture events or outcomes to identify these forward-looking statements. Forward-looking statements in thisAnnual Report may include statements about:
• our ability to attract and retain customers;
• our financial performance;
• our development activities;
• our position in the session border controller market;
• the benefits of our products, services, or programs;
• the advantages of our technology as compared to that of others;
• our ability to establish and maintain intellectual property rights;
• our ability to retain and hire necessary employees and appropriately staff our operations; and
• our cash needs.
The outcome of the events described in these forward-looking statements is subject to known andunknown risks, uncertainties and other factors that could cause actual results to differ materially from theresults anticipated by these forward-looking statements. These important factors include our financialperformance, difficulties in attracting and retaining customers, difficulties in meeting customer needsthrough our development activities, difficulties leveraging market opportunities, poor product sales, longsales cycles, difficulties in developing new products, difficulties in our relationships with vendors andpartners, risks associated with international operations, difficulty in managing rapid growth and increasedcompetition, and those factors we discuss in this Annual Report under the caption “Risk Factors” and therisks discussed in our other SEC filings. We undertake no obligation to publicly release any revisions to theforward-looking statements after the date of this Annual Report other than as required by law. You shouldread these factors and the other cautionary statements made in this Annual Report as being applicable toall related forward-looking statements wherever they appear in this Annual Report. These risk factors arenot exhaustive and other sections of this Annual Report may include additional factors which couldadversely impact our business and financial performance.

3
PART I
Item 1. Business
Overview
Acme Packet is the leading provider of session border controllers, or SBCs, that enable interactivecommunications service providers to deliver secure and high quality interactive communications—voice,video and other real-time multimedia sessions—across defined border points where Internet Protocolnetworks connect, known as network borders. Interactive communications service providers, which werefer to generally as service providers, include cable service providers, wireline and mobile wirelesstelecommunications service providers, information service providers and data transport service providers.The Internet Protocol, or IP, is a standardized method of transmitting information, such as interactivecommunications, from one device, such as a personal computer, server, IP telephone and personal digitaladvisor, to another device over any type of physical private or public network, including the Internet. OurNet-Net products, which consist of our hardware and proprietary software, serve as a central element inunifying the separate IP networks that comprise wireline, wireless and cable networks. Interactivecommunications service providers can use our products to create a premium service tier that delivers next-generation interactive communications services, such as Voice over IP, or VoIP, with the same qualityassurance and security as they historically have offered for voice services over their legacy telephonenetworks.
SBCs are deployed at the borders between IP networks, such as between two service providers orbetween a service provider and its business, residential or mobile customers as more fully described belowin the sections entitled “Industry Background,” “The Need for a New IP Element,” “Our Solution” and“Our Technology.” SBCs are the only network element currently capable of integrating the control ofsignaling messages and media flows. This capability complements the roles and functionality of routers,softswitches and data firewalls that operate within the same network. Our Net-Net products support abroad range of communications applications at multiple network border points, providing key controlfunctions in the areas of security, service reach maximization, service level agreement assurance, revenueand profit protection and regulatory compliance, while also supporting next-generation servicearchitectures such as IP Multimedia Subsystem, or IMS. IMS provides a blueprint for building a networkcapable of delivering IP-based voice, video and multimedia services to subscribers.
We began shipping our Net-Net products in 2002. Since that time, over 360 interactivecommunications service providers in 75 countries have purchased our products.
We sell our products and support services through approximately 30 distribution partners and ourdirect sales force. Our distribution partners include many of the largest networking andtelecommunications equipment vendors throughout the world.
We were founded in 2000 under the name Primary Networks, Inc. and changed our name to AcmePacket, Inc. in January 2001. Our principal executive offices are located at 71 Third Avenue, Burlington,MA 01803. Our telephone number is (781) 328-4400. Our website address is www.acmepacket.com.Through a link on the Investor Relations section of our Website, we make available the following filingsafter they are electronically filed with or furnished to the SEC: our Annual Report on Form 10-K,Quarterly Reports on Form 10-Q, Current Reports on Form 8-K, and any amendments to those reportsfiled or furnished pursuant to Section 13 or 15(d) of the Exchange Act. All such filings are available free ofcharge.
Industry Background
Since the advent of the Internet, interactive communications service providers have delivered voiceand data services separately over the Public Switched Telephone Network, or PSTN, and the Internet. The

4
PSTN, also known as the voice or traditional telephone network, was created decades ago to provideseamless, reliable and secure global voice communications services. Users are accustomed to the highreliability and security of the PSTN, and have high confidence in utilizing it to share personal informationand engage in activities such as banking and commerce. The PSTN is limited, however, in its ability tosupport high bandwidth video and other interactive multimedia services.
The Internet is a collection of IP networks that provides global reach for a broad range of informationservices such as e-mail, web browsing, electronic commerce and research. IP is a data-oriented protocolwhich provides communicable unique global addressing among computers. Internet service quality, whileadequate for these types of information services, can vary significantly depending upon, among otherfactors, available bandwidth, how busy a particular web site may be, how many people are using thenetwork at a particular time and the activity being performed. Although the Internet is capable of cost-effectively transmitting any form of traffic that is IP-based, including interactive voice, video and data, ittransmits only on a best-efforts basis, because all forms of traffic have the same priority. The Internet,therefore, attempts to deliver all traffic without distinction, which can result in significantly varying degreesof service quality for the same or similar types of traffic transmissions. In addition, Internetcommunications, unlike those over the PSTN, are subject to disruptive and fraudulent behavior, includingidentity theft, viruses, unwanted and excessively large input data known as SPAM, unauthorized use, andattempts to circumvent or bypass security mechanisms associated with those services, known as hacking.Although Internet users have adopted many security measures to protect themselves, their networks andtheir websites, these measures currently are not adequate to provide highly secure, real-time interactivecommunications.
Evolution to a Converged IP Network
In recent years, interactive communications service providers have experienced a significant decreasein wireline voice revenue due to the competition from voice over IP, or VoIP, and mobile voice services.VoIP technology allows the routing of voice conversations over the Internet. This phenomenon haschallenged service providers’ business models, causing a decline in profitability and a significant reductionin capital expenditure budgets. Interactive service providers are focusing their efforts on introducing newrevenue-generating opportunities, while rationalizing capital and network operations costs.
IP networks can be designed and operated more cost-effectively than the PSTN. In addition, IPnetworks are capable of delivering converged voice, video and data service packages to businesses andconsumers. Service providers are seeking to provide these next-generation services to enhance theirprofitability by generating incremental revenue and by reducing subscriber turnover. However, managingtwo distinct networks—the PSTN and an IP network—is not a viable economic alternative. As a result,service providers are beginning to migrate to a single IP network architecture to serve as the foundationfor their next-generation service offerings. In order to successfully transition to a single IP network,however, service providers must maintain the same reliability and security that have for decadesexemplified their delivery of voice services.
Challenges of IP Networks in Delivering Session-Based Communications
IP networks were designed initially to provide reliable delivery of data services such as file downloadsand web site traffic that are not sensitive to latency, or time delay. If data packets are lost or misdirected,an IP network exhibits tremendous resiliency in re-transmitting and eventually executing the desired userrequest, which generally is an acceptable result for these types of data services. However, IP networkshistorically have not been capable of guaranteeing real-time, secure delivery of high quality sessions-basedcommunications such as interactive voice and video.

5
A session is a communications interaction that has a defined beginning and end, and is effective onlywhen transmitted in real-time without latency or delays. In order to enable a session-basedcommunication, a service provider must be able to control the session from its origination point to itsdefined end point. No single service provider’s IP network extends far enough to enable that level ofcontrol, however, and the Internet lacks the fundamental quality of service and security mechanismsnecessary to consistently deliver the security and quality of real- time multimedia communications thatconsumers and businesses require. In order to gain the trust of consumer and business customers, serviceproviders must be able to assure secure and high quality interactive communications across multiplecustomer networks, access networks and other service provider networks.
The Need for a New IP Network Element
Managing session-based communications
In order to provide secure and high quality interactive communications, IP networks must be able tomanage and integrate the communication flows that comprise a session. Each session includes three sets ofbidirectional communication flows:
• Session signaling messages, which are used to initiate, modify or terminate a session;
• Media streams, which are data packets containing the actual media being exchanged; and
• Media control messages, which are used to compile information used to report on quality of servicelevels.
A session is initiated using signaling messages. These messages establish a virtual connection betweenthe participants’ personal computers, IP phones or other IP devices. In addition, they negotiate the IPaddresses used for the session’s media streams and control messages as well as the algorithms, referred toas codecs, used to digitize analog voice and video. Various codecs are required for voice and video, andthey involve trade-offs between quality and bandwidth efficiency. Once the call is initiated, media streamsand control messages flow in both directions between participants. Signaling messages also are used totransfer a call, place a call on hold and terminate a session.
The management of session-based communications is complicated by the following characteristics oftoday’s IP networks:
• The identities of the participants are difficult to ascertain and security needs are complex.
• The number of session signaling protocols, codecs and related standards continues to grow.
• Addressing schemes are not consistent or compatible across networks.
• Bandwidth and signaling element resources are finite.
• Interactive communications service provider business models and regulatory compliancerequirements continue to evolve and require network flexibility.
Additionally, unlike typical data communications, not all session-based communications can betreated with the same priority. For example, a 911 call or a high quality enterprise video conference shouldtake priority over a person calling into a reality TV program.

6
Limitations of Existing Network Elements
Successful session-based communications require tight integration between signaling and mediacontrol. However, existing network elements such as softswitches, routers and data firewalls do not providethe control functions required for session-based communications.
• Softswitches, including Session Initiation Protocol, or SIP, servers, H.323 gatekeepers and MediaGateway Control Protocol, or MGCP, call agents, process only signaling messages while performinga variety of signaling-based functions, such as subscriber registration, authentication, authorizationand session routing based upon telephone numbers or SIP addresses. Softswitches currently do notprovide functions relating to, for example, media control for interactive communication sessions orprotection against signaling-based denial of service and distributed denial of service, or DoS/DDoS,attacks. DoS/DDoS attacks prevent network equipment from receiving legitimate network traffic byoverloading network equipment with unrequested information.
• Routers make simple routing decisions for IP packets based upon IP addresses. Routers do notparticipate in call signaling, and therefore, are unable to recognize the multiple individual datapackets that comprise a single voice call or multi-media session. Without signaling intelligence,routers currently are unable to perform key border control functions such as softswitch overloadprevention or call routing based upon quality and cost requirements. Routers may use a number ofquality of service technologies, such as Multi-Protocol Label Switching or MPLS, DifferentiatedServices or DiffServ, and Resource Reservation Protocol or RSVP, to provide preferentialtreatment to certain IP packets. However, routers using these technologies are currently incapableof classifying all the communications flows associated with a single voice call and handling thosecommunications flows correctly as a single entity. Without the ability to identify the multipleindividual packets that compromise a session, control call signaling, or understand the access linkcapacity and utilization, the router is unable to make any call admission or rejection decisions. As aresult, the router will continue to send packets along a path even though the session should havebeen rejected because the quality was insufficient for the requested session. When this overloadingof a path occurs, not only is the quality of the session associated with that packet insufficient tosupport the session, but other sessions using that same path also will suffer degradation.
• Data firewalls are the most common security element in IP networks. Firewalls work by allowinginto the network only traffic that has been requested from inside the network and by presenting asingle IP address for all of the personal computers, phones and other devices behind it. The firewalleffectively blocks session-based communications because it does not allow incoming calls fromunknown endpoints. Furthermore, firewalls are not capable of identifying and protecting againstservice overloads or DoS/DDoS attacks on other signaling elements such as the softswitch.
Our Solution
We provide a new category of network equipment called the session border controller, or SBC, toenable interactive communications service providers to offer secure and high quality interactivecommunications across multiple IP networks, including the separate IP networks that comprise wireline,wireless and cable networks. Prior to the advent of the SBC, IP network infrastructure equipment, such assoftswitches, routers and data firewalls, were able to initiate and route undifferentiated data, but lackedthe ability to target specifically the management of interactive communications sessions. The developmentof the SBC, unlike many emerging networking products, was not catalyzed by standards bodies, but ratherby the pragmatic needs of service providers.
To date, SBCs have been deployed around the world principally to deliver VoIP services, or therouting of voice conversations over the Internet. We believe that there is a significant demand for SBCsthat can assure delivery of secure and high quality real-time interactive communications across all IP

7
network borders. Infonetics Research, a market research and consulting firm specializing in datanetworking and telecommunications, projects that worldwide revenue for SBCs will increase from$143 million in 2006 to $592 million in 2010.
SBCs are deployed at the borders of IP networks, such as between two service providers, referred to asan interconnect border, between a service provider and its business, residential or mobile customers,referred to as access-backbone borders, or between a carrier’s network and its data center, referred to as adata center border. SBCs act as the source and destination for all signaling messages and media streamsentering and exiting the provider’s network. To that end, SBCs complement rather than replacesoftswitches, data firewalls or routers. At all borders, SBCs sit in front of softswitches and make callacceptance or rejection decisions. This function protects the softswitch from both malicious signalingattacks initiated by hackers and non-malicious overloads as well as ensures calls are only accepted whenadequate network quality and softswitch resources are available. At many borders, SBCs sit alongside datafirewalls. The data firewalls protect web and application servers and PCs from attacks while the SBCprotects the softswitch. SBCs augment the simple and different packet-by-packet routing decisions routersmake. Unlike routers that make simple and different routing decisions on a packet by packet basis, SBCsare able to classify these flows as a single interactive communication session and make more intelligentrouting decisions to use the best path across the network to ensure secure, high quality communications.
• Security. SBCs protect themselves, softswitches and other elements of the service deliveryinfrastructure, as well as customer networks, systems and relationships. They protect customernetworks and session privacy, and provide DoS/DDoS protection from malicious attacks and non-malicious overloads.
• Service reach maximization. SBCs extend the reach of offered services by maximizing the differenttypes of networks and devices supported. Support is provided for enabling sessions to traverseexisting data firewall and cross network translation, or NAT, devices, bridging private networksusing overlapping IP addresses and virtual private networks, or VPNs, mediating between differentsignaling, transport and encryption protocols, converting between incompatible codecs, andtranslating signaling-layer telephone numbers, addresses and response codes.
• Service level agreement assurance. SBCs play a critical role in assuring session capacity and quality.They perform admission control to ensure that both the network and service infrastructure has thecapacity to support a session with high quality. SBCs also monitor and report actual session qualityto determine compliance with performance specifications set forth in service level agreementsbetween service providers and their customers.
• Revenue and profit protection. SBCs can help service providers increase revenues and profits byprotecting against both bandwidth and quality of service theft, by routing sessions to minimize costs,and by providing accounting and related mechanisms to maximize billable sessions.
• Regulatory compliance. SBCs support compliance with government-mandated regulationsworldwide, including emergency services such as E-9-1-1 and lawful intercept, which involves lawenforcement agencies’ electronic surveillance of circuit and packet-mode communications asauthorized by judicial or administrative order, such as the Communications Assistance for LawEnforcement Act, or CALEA.
Our SBCs utilize our proprietary technology to process session-based communications at networkborders, and are designed to ensure that critical security and quality standards are met. Our keyadvantages include the following:
• Significant experience in service provider deployments. We have significant experience in productiondeployments of SBCs by large interactive communications service providers, including deploymentsat 23 of the top 25 and 72 of the top 100 wireline, wireless and cable service providers in the world,

8
based on 2006 revenues. Our product functionality and quality have continually improved based onthe knowledge about network challenges and complexities that we have acquired throughdeployments with over 360 large and small wireline, wireless and cable providers across the globe.
• Breadth of applications and standards support. Our products are capable of processing the mostwidely used real-time interactive voice, video and multimedia communications sessions at wireline,wireless and cable IP network borders. We support a broad range of IP signaling protocols, such asSIP, H.323 and MGCP/NCS, transport protocols, encryption protocols, codecs, and addressingmethods.
• Depth of border control features. We offer a deep set of session border control features for security,service reach maximization, service level agreement assurance, revenue and profit protection, andregulatory compliance. In addition, our flexible product architecture facilitates rapid adoption ofnew control features required by emerging services, applications, business models and regulatoryrequirements.
• Responsive service and support. Our responsiveness to our customers’ and distribution partners’ newfeature requirements and interoperability testing, as well as our commitment to swift problemresolution, has been critical in deployments of our products.
• Carrier-class platform. Interactive communications service providers operate complex, mission-critical networks that require security protection; high degrees of reliability, availability andmaintainability, scalable performance and capacity, space and power-saving hardware design; andcomprehensive network management. Products or platforms that satisfy these requirements areknown as carrier-class. We have designed our products to be carrier-class.
• Proven interoperability. We have demonstrated the ability of our SBCs to interoperate with keyproducts being deployed by major vendors for next-generation services, such as softswitches,application servers, media gateways, media servers, policy servers and other communicationsinfrastructure elements.
We believe that these key advantages of our products and services, together with our deployment ofour products in approximately 360 service provider networks, make Acme Packet the leading provider ofSBCs.
Our Strategy
Our objective is to grow our market and technology leadership in the SBC market. Principal elementsof our strategy include:
• Continue to satisfy the evolving border requirements of large service providers. By continuing to workclosely with Tier-1 and other large service providers as they deploy and scale their services, we arewell-positioned to gain valuable knowledge that we can use to expand and enhance our products’features and functionality. Our experience has demonstrated that new services, applications,business models and regulatory requirements will drive the need for supporting new interfaces,protocols and control features. For example, in January 2006, we began delivering support formedia using TCP, a transport protocol used for many real-time, interactive gaming applications.
• Exploit new technologies to enhance product performance and scalability. Our purpose-built hardwareplatforms incorporate leading edge hardware and proprietary software technology. We will seek toleverage new technologies as they become available to increase the performance, capacity andfunctionality of our product family, as well as to reduce our costs. For example, our Net-Net 9000series can increase signaling performance by four to eight times over previously available levels andincorporates essential transcoding, or the ability to change data from one format to another.

9
• Invest in quality and responsive support. Our professional services team, dedicated to product qualityand responsive support, ensures that our customers successfully deploy our products and efficientlytransition their subscribers to a converged IP network infrastructure. As we broaden our productplatform and increase our product capabilities, we will continue to provide comprehensive serviceand support targeted at maximizing customer satisfaction and retention.
• Facilitate and promote service interconnects among our customers. We facilitate and encouragebusiness relationships and interconnections among our customers to extend the reach of theirservices and, consequently, to increase the value of their services to their customers. We expect thatthese interconnections, in turn, will lead to increased demand for both our customers’ services andfor our products.
• Leverage distribution partnerships to enhance market penetration. We have approximately 30distribution partners, which provide us with access to additional customers and increase our marketpenetration. As we invest in training and tools for our distribution partners’ sales, systemsengineering and support organizations, we expect the overall efficiency and effectiveness of thesepartnerships to increase, which will allow us to dedicate more of our resources to furtherpenetrating the global market for our products and services.
• Actively contribute to architecture and standards definition processes. As the result of our breadth anddepth of experience with actual production deployments of SBCs, we are poised to contributesignificantly to organizations developing standards and architectures for next-generation IPnetworks, such as the Internet Engineering Task Force, 3GPP, ETSI, ATIS, MultiService Forumand PacketCable. We believe that the evolution of these standards and architectures willincreasingly be driven by the realities learned from the pragmatic needs of service providers, not bytheories.
Our Technology
Our SBCs are designed specifically to make networks “session aware” by enabling them to recognize,manage and integrate the various communication flows that comprise a single session and then treat thosemedia flows as a single session with the appropriate priority, security and routing among other differentnetworks. Acme Packet Session Aware Networking, our technology architecture, enables the delivery ofsecure and high quality interactive communication sessions across IP network borders. Implemented by thetight integration of our Net-Net OS software and Net-Net hardware platforms, our technology combinesfive elements that make the network session aware:
• session routing policy;
• session signaling service;
• session media control;
• session monitoring and reporting; and
• session security service.
Session Aware Networking is designed to enable these five elements to share information dynamically.The session routing policy element collects the information necessary to guide the session signaling servicein the selection of the optimal route across multiple IP networks. The media control element moves voicepackets in compliance with security, quality of service, bandwidth and regulatory requirements. The sessionmonitoring and reporting element updates the routing policy element with information about actualsignaling element load, bandwidth availability and route performance. The session security service elementprotects the SBC, service infrastructure, customer networks and sessions among customers’ subscribers.

10
We believe that the combination of these elements creates a comprehensive solution required to deliversecure and high quality interactive communications services across IP network borders.
Session routing policy. This software-based element defines and collects the information needed tomake routing and related decisions. Session routing policy includes the following:
• Admission control, which determines whether session initiation requests should be accepted basedupon signaling element availability and load, bandwidth availability and observed session quality;
• Routing, which determines the next signaling element on the network based upon multiple metrics,including source, destination, service provider preference, prefix, cost, time-of-day and time-of-week;
• Load balancing, which determines how sessions should be load balanced across multiple signalingelements on the network utilizing round-robin, hunt, least busy or proportional allocations;
• Number translations, which specifies how telephone numbers should be manipulated when beingforwarded; and
• Call limiting, which limits number or rate of calls to prevent overloads from less valuable sources ordestinations.
Session signaling service. This software-based element supports a broad range of signaling protocolssuch as SIP, H.323, MGCP/NCS and H.248. Based on information received from the session routing policyelement, the signaling service element selects the best path through the network for each session. It selectsthe next signaling element in the network, such as user devices, softswitches, gateways and applicationservers, that each session should visit. To initiate the session, this element signals the next device along thepath. If no acceptable path is available, the signaling service rejects the initiation request. It performsnetwork address and port translations for addresses exposed in the signaling messages for security andbridging incompatible networks, strips previous routing information to hide customers or suppliers andadds or strips codecs to ensure codec compatibility. It also determines if the media flows should bereleased peer-to-peer between endpoints or relayed through the media control element. For relayedsessions, it passes address information for the next signaling element in the path to the media controlelement. The signaling service also performs protocol repair and interworking by, for example, convertingone protocol into another. Lastly, this element is able to track sessions for reporting and billing purposes.
Session media control. Once the session is established, this hardware-based element controls themedia flows that are not released peer-to-peer between endpoints. Media control performs networkaddress and port translations for security and bridging incompatible networks. It relays media to supportthe ability to address the cross network address translation and firewall devices, applies quality of servicemarkings such as DiffServ bits and virtual area network, or VLAN, tags, performs transcoding betweencodecs when needed, and polices bandwidth usage in order to prevent, for example, a 64-Kbps voicesession from switching to 384-Kbps video without permission. Media control also can extract touch tonesembedded in the media flows, replicate the media flows for lawful intercept when required, and detect andrepair certain session faults based on limits for items such as call length and maximum idle time. Forexample, if a signaling message terminating a session is lost, the session media control element notices andterminates the errant connection, freeing resources for other use.
Session monitoring and reporting. This element compiles signaling and media performanceinformation on a per session basis. Media quality measurements may include objective network attributes,such as delay, jitter and packet loss, or subjective measurements using mean opinion score algorithms.Signaling performance information includes signaling element availability, load and call completion ratios.The reported information is used in fault and performance management and in service level agreementreporting, and is input to subsequent routing and admission control policy decisions.

11
Session security service. This element exploits integrated hardware and software capabilities to securethe SBC, the service infrastructure and subscriber sessions with respect to signaling and media flows. Staticand dynamic access control lists for signaling messages are enforced by the SBC’s network processingsubsystem to protect the signaling processor from DoS/DDoS attack and overload. DoS/DDoS attacksprevent network equipment from receiving legitimate media flows by overloading the network equipmentwith unrequested information. To avoid such attacks, subscriber endpoints must earn trust throughsuccessful registrations or calls to gain trusted access. For media flows, an SBC acts as a media firewall,permitting access for authorized sessions and blocking other traffic. All internal bandwidth consumed byall signaling and media flows are policed in hardware for optimum scalability in DoS/DDoS protection.
DoS/DDoS attack prevention entails blocking all attacks and overloads at the SBC. Many of thesession routing policies described above prevent signaling and media overloads on the serviceinfrastructure from legitimate subscribers. A hardware-based encryption engine can ensure confidentialityof both signaling and media flows for subscriber sessions.
Our Products
Our Net-Net family of products consists of the Net-Net OS, 4000, 4000 PAC, 9000 and EMS. Thebrand name “Net-Net” reflects the role of these products in interconnecting IP networks for voice, videoand multimedia services. Our Net-Net products serve as a central element in unifying the separate IPnetworks that comprise wireline, wireless and cable networks. Our products include our hardwareplatforms and proprietary software. They deliver high quality session border control functionality,performance, capacity, scalability, availability and manageability, while allowing interactivecommunications service providers to create a premium service tier of next-generation real-time, interactivecommunications.
Our hardware and software products are designed to work in conjunction with each other. Our Net-Net OS software platform will only operate on our Net-Net SBC hardware platforms and, accordingly, ourNet-Net SBC hardware platforms will only operate with our embedded software installed. Customers canpurchase our SBCs in either a standalone or high-availability configuration and can license our software invarious configurations depending on customers’ requirements for session capacity, feature groups andprotocols.
Acme Packet Net-Net OS
The Acme Packet Net-Net OS is our software platform. It operates on all of the Net-Net 4000 and9000 series SBC hardware platforms. It offers rich border control functionality in terms of architecturalflexibility, signaling protocol breadth, control feature depth, and carrier-class availability andmanageability.
Net-Net OS supports all five required SBC control functions:
• Security. Net-SAFE, our SBC security framework, protects the service delivery infrastructure andcustomer/subscriber networks, systems and relationships with support for SBC DoS/DDoSprotection, access control, topology hiding, session privacy, virtual private network separation,service infrastructure DoS/DDoS prevention and fraud prevention.
• Service reach maximization. Our SBCs extend the reach of offered services by maximizing thedifferent types of networks and devices supported. Critical features include: NAT traversal, which isthe ability to enable communication sessions to be carried over existing data firewall and NATdevices; bridging of private and public address spaces including VPNs, signaling, encryption andtransport protocol interworking; transcoding; and number, address and response code translations.

12
• Service level agreement assurance. Our SBCs support a number of features designed to guaranteesession capacity and quality. These features include: admission control based upon signalingelement load, bandwidth availability (including policy server interfaces) and observed quality ofservice; quality of service marking and mapping; and quality of service reporting.
• Revenue and profit protection. Net-Net OS includes a number of features that help customersgenerate incremental revenues and protect against revenue leakage by service theft, includingbandwidth policing, quality of service theft protection, accounting, session timers, routing and loadbalancing.
• Regulatory compliance. Our SBCs support compliance with government-mandated regulationsworldwide, including emergency services such as E-9-1-1 and lawful intercept such as CALEA in theUnited States.
Other Net-Net OS features include the following:
• Multi-protocol support. Net-Net OS provides support for a broad range of signaling protocols forinterworking, load balancing and routing, and decomposed SBC control.
• High availability. Our high availability configurations protect against loss of service in the event ofhardware or software failures. The checkpointing of media, signaling and configuration state isdesigned to ensure no loss of active calls, or support for new call requests.
• Management. Our SBCs include support for a comprehensive collection of element managementtools and operational support system interfaces.
• SBC architectural flexibility. Our SBCs support different architectural models. They can beconfigured as an integrated solution with signaling service and media control (each of which isdescribed above) supported on a single hardware platform or a decomposed solution with mediacontrol and signaling service supported on two separate hardware platforms. The choice ofintegrated or decomposed SBC solutions provides our distribution partners and customers withincreased flexibility and scalability in implementing next-generation architectures. An integratedSBC solution offers more session border control functionality and simplifies the evaluation,deployment and on-going support of the product. A decomposed solution enables scaling thesignaling and media control elements independently for optimum performance and capacity. Ourproducts also support both subscriber access and service provider interconnect applications.
Acme Packet Net-Net SBC Platforms
The Acme Packet Net-Net 4000, 4000 PAC and 9000 hardware platforms address a broad range ofinteractive communications service provider requirements for performance, capacity and bandwidth. Eachof these hardware platforms may be configured to support an SBC integrated with our proprietarysoftware, although our hardware platforms are not designed to be used with software platforms from otherSBC software providers. Our integrated SBCs include our hardware platform with our proprietarysoftware, and customers may purchase our proprietary software separately to obtain new features orincrease the capacity of their existing SBCs. We also offer decomposed SBCs with signaling service andmedia control (each of which is described above) supported on two separate hardware platforms. Thechoice of integrated or decomposed SBC solutions provides our distribution partners and customers withincreased flexibility and scalability in implementing next-generation network architectures. An integratedSBC solution offers more session border control functionality and simplifies the evaluation, deployment,and on-going support of the product. A decomposed solution enables scaling the signaling and mediacontrol elements independently for optimum performance and capacity. Configurations supportingsubscriber access in each case are available with and without IMS signaling control functionality to
13
complement the IMS products offered by our distribution partners. Our SBC hardware platforms consistof:
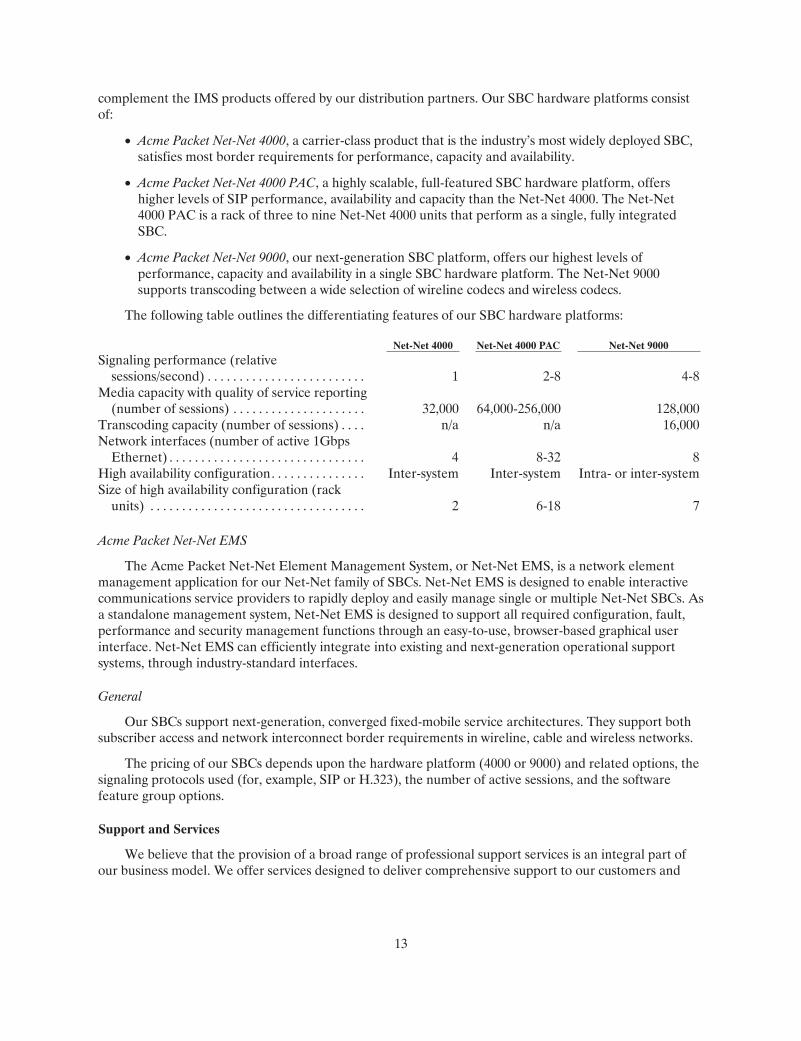
• Acme Packet Net-Net 4000, a carrier-class product that is the industry’s most widely deployed SBC,satisfies most border requirements for performance, capacity and availability.
• Acme Packet Net-Net 4000 PAC, a highly scalable, full-featured SBC hardware platform, offershigher levels of SIP performance, availability and capacity than the Net-Net 4000. The Net-Net4000 PAC is a rack of three to nine Net-Net 4000 units that perform as a single, fully integratedSBC.
• Acme Packet Net-Net 9000, our next-generation SBC platform, offers our highest levels ofperformance, capacity and availability in a single SBC hardware platform. The Net-Net 9000supports transcoding between a wide selection of wireline codecs and wireless codecs.
The following table outlines the differentiating features of our SBC hardware platforms:
Net-Net 4000 Net-Net 4000 PAC Net-Net 9000
Signaling performance (relativesessions/second) . . . . . . . . . . . . . . . . . . . . . . . . . 1 2-8 4-8
Media capacity with quality of service reporting(number of sessions) . . . . . . . . . . . . . . . . . . . . . 32,000 64,000-256,000 128,000
Transcoding capacity (number of sessions) . . . . n/a n/a 16,000Network interfaces (number of active 1Gbps
Ethernet) . . . . . . . . . . . . . . . . . . . . . . . . . . . . . . . 4 8-32 8High availability configuration. . . . . . . . . . . . . . . Inter-system Inter-system Intra- or inter-systemSize of high availability configuration (rack
units) . . . . . . . . . . . . . . . . . . . . . . . . . . . . . . . . . . 2 6-18 7
Acme Packet Net-Net EMS
The Acme Packet Net-Net Element Management System, or Net-Net EMS, is a network elementmanagement application for our Net-Net family of SBCs. Net-Net EMS is designed to enable interactivecommunications service providers to rapidly deploy and easily manage single or multiple Net-Net SBCs. Asa standalone management system, Net-Net EMS is designed to support all required configuration, fault,performance and security management functions through an easy-to-use, browser-based graphical userinterface. Net-Net EMS can efficiently integrate into existing and next-generation operational supportsystems, through industry-standard interfaces.
General
Our SBCs support next-generation, converged fixed-mobile service architectures. They support bothsubscriber access and network interconnect border requirements in wireline, cable and wireless networks.
The pricing of our SBCs depends upon the hardware platform (4000 or 9000) and related options, thesignaling protocols used (for, example, SIP or H.323), the number of active sessions, and the softwarefeature group options.
Support and Services
We believe that the provision of a broad range of professional support services is an integral part ofour business model. We offer services designed to deliver comprehensive support to our customers and

14
distribution partners through every stage of our products’ deployment. Our services can be categorized asfollows:
Professional Services. Our professional services group provides pre-installation services, such asplanning and consulting and network engineering and design, as well as installation and networkintegration services.
Technical Assistance Center. From our headquarters in Burlington, Massachusetts, we operate atechnical assistance center to provide our customers with post-installation services such as support andmaintenance, informational services, and technical support services. We provide remote assistance tocustomers worldwide, including periodic updates to our software and product documentation. To respondto our customers’ needs, our technical assistance group is available 24 hours a day, 7 days a week andaccessible by phone, by e-mail and, when required, on site.
Training. We offer an array of training services to our customers, including, a five-day course aboutconfiguration and administrative basics and a three-day course about troubleshooting maintenance. Wepresent these courses monthly at our headquarters, and we also can deliver customized versions of thecourses at customer sites.
We had 63 employees dedicated to providing these services as of December 31, 2006. We believe ourcommitment to servicing our products and our customers provides us with a competitive advantage byhelping us to retain customers and to identify new product opportunities.
Sales and Marketing
We market and sell our products and support services indirectly through our distribution partners anddirectly through our sales force. Our sales and marketing team consisted of 66 employees and full timecontractors as of December 31, 2006.
Marketing and Product Management. In addition to building brand awareness and broadly marketingour products, our marketing team actively supports our sales process and team and works to influencenext-generation service architectures and interactive communications service provider requirementsglobally by actively contributing to industry-related standards organizations, conferences, trades shows,publications and analyst consulting services.
Direct Sales. Our direct sales team, with assistance from marketing, sells directly to large, individualservice providers worldwide. We maintain sales offices in Burlington, Massachusetts; Madrid, Spain; andTokyo, Japan. We also have sales and support personnel in Australia, Belgium, Brazil, Canada, China,France, Germany, Hong Kong, Israel, Italy, Korea, Malaysia, Mexico, Peru, Russia and the UnitedKingdom and throughout the United States.
Distribution Partners
We enter into non-exclusive distribution or reseller agreements with distribution partners around theglobe to acquire new customers. These agreements typically have a duration of one to two years andprovide for a full spectrum of sales and marketing services, implementation services, technical and trainingsupport, and warranty protection. They do not contain minimum sales requirements. We may seek to adddistribution partners selectively, particularly in additional countries outside the United States, in order tocomplement or expand our business.
We follow a standard contracting process with our distribution partners. The first time a distributionpartner places an order for any of our products, we enter into a master agreement that contains generalterms and conditions applicable to all purchases of our products by the distribution partner. By enteringinto this type of distribution partner agreement with us, a distribution partner does not become obligated

15
to order or purchase any fixed or minimum quantities of our products. Our distribution partners generallyorder products from us by submitting purchase orders that describe, among other things, the type andquantities of our products that they desire to order and the delivery date and other applicable deliveryterms that are applicable to these products. We typically do not offer contractual rights of return, stockbalancing or price protection to our distribution partners, and actual product returns from distributionpartners have been insignificant to date.
Our sales fulfillment typically is provided through our distribution partners. While we may providefulfillment services through our direct sales force from time to time at the request of a customer, we intendto continue to provide substantially all of our sales fulfillment through our distribution partners.
As of December 31, 2006, we had approximately 30 distribution partners and resellers. Our partnersinclude many of the largest networking and telecommunications equipment vendors in the world, as well asregionally focused system and network integrators.
Customers
Our products and services have been sold to over 360 customers in 75 countries. These companiesconsist of legal entities that have either purchased products and services directly from us or have purchasedour products through us or one of our distribution partners. Our customers include incumbent andcompetitive local exchange and long distance providers, international service providers, cable operators,Internet telephony service providers, voice application service providers, and wireless service providers. Inaddition to these many different service provider profiles, our customers reflect different services andapplications, network types, business models and countries.
Revenue from customers located outside the United States and Canada represented 43% of our totalrevenue in 2006, 41% of our total revenue in 2005 and 50% of our total revenue in 2004 (of which revenuesfrom customers in Italy and Japan represented 17% and 12% of total revenue, respectively). The followingis a list of our customers who accounted for at least 10% of our net revenue for the applicable periodindicated below:
Year Ended December 31,2006 2005 2004
Sprint—16% Sprint—14% Italtel—15%Siemens—11% Lucent Technologies—14% Alcatel—13%
Time Warner Cable—12% Nissho Electronics—11%Alcatel—11%
We follow a standard contracting process with all of our direct customers. The first time a directcustomer places an order for any of our products we enter a master agreement that contains general termsand conditions applicable to all purchases of our products by such direct customer. By entering into anend-user agreement with us, a direct customer does not become obligated to order or purchase any fixed orminimum quantities of our products. Our direct customers generally order products from us by submittingpurchase orders that describe, among other things, the type and quantities of our products that they desireto order and the delivery date and other applicable delivery terms that are applicable to products.
Research and Development
Continued investment in research and development is critical to our business. We have assembled ateam of 85 engineers as of December 31, 2006, with expertise in various fields of communications andnetwork infrastructure. Our research and development organization is responsible for designing,developing and enhancing our software products and hardware platforms, performing product testing andquality assurance activities, and ensuring the compatibility of our products with third-party hardware and

16
software products. We employ advanced software development tools, including automated testing,performance monitoring, source code control and defect tracking systems. In addition, we have investedsignificant time and financial resources into the development of our Net-Net family of products, includingour Net-Net OS software platform.
Research and development expense totaled $13.0 million for 2006, $8.7 million for 2005 and$5.6 million for 2004.
Manufacturing
We outsource the manufacturing of our Net-Net products. We subcontract all of the manufacturing ofour Net-Net 4000 series of products to Jabil Circuit, Inc. and Benchmark Electronics. We subcontract allof the manufacturing of our Net-Net 9000 series of products to Jabil Circuit, Inc. and TTMTechnologies, Inc. We do not have a written agreement with any of these manufacturers. We submitpurchase orders to these manufacturers that describe, among other things, the type and quantities of ourproducts or components to be manufactured by the applicable manufacturer and the delivery date andother delivery terms applicable to the products or components. Our manufacturers do not have any writtencontractual obligation to accept any purchase order that we submit for the manufacture of any of ourproducts or components. If one of our manufacturers accepts in writing a purchase order submitted by us,the manufacturer is legally obligated to manufacture the product or component covered by such purchaseorder and we are obligated to purchase and take delivery of such product or component. Our reliance onoutside manufacturers involves a number of potential risks, including the absence of adequate capacity, theunavailability of, or interruptions in access to, necessary manufacturing processes, and reduced controlover delivery schedules. In addition, we cannot be certain or provide any assurance that our manufacturerswill accept all of our purchase orders, or any of them, and agree to manufacture and supply any or all ofour manufacturing requirements for our products or any components. If our manufacturers are unable orunwilling to continue manufacturing our products and components in required volumes, we will have toidentify one or more acceptable alternative manufacturers. The use of new manufacturers may causesignificant interruptions in supply if the new manufacturers have difficulty manufacturing products to ourspecifications.
Although there are multiple sources for most of the component parts of our products, some of ournetwork processors, traffic managers, microprocessors and network search engines are sourced from singleor, in some cases, limited sources. For example, our contract manufacturers purchase through electronicsdistributors various types of network processors, traffic managers, microprocessors and network searchengines from various component manufacturers, including Applied Micro Circuits Corporation, BroadcomCorporation, Freescale Semiconductor, Inc. and Integrated Device Technology, Inc., which are presentlyour contract manufacturers’ sole sources for these particular components. We do not have a writtenagreement with any of these component manufacturers to guarantee the supply of the key componentsused in our products, and we do not require any of our contract manufacturers to have a written agreementwith any of these component manufacturers. We regularly monitor the supply of the component parts andthe availability of alternative sources. Also, we have entered into arrangements with a few electronicsdistributors which require the electronics distributors to establish and maintain at least three months’inventory of certain key components, and, at the request of our contract manufacturers, to supply all or aportion of the key components held pursuant to this arrangement to our contract manufacturers for use inthe manufacture of our products. Our contractual arrangements with the electronics distributors do notprovide for the electronics distributors to enter into any contract with any of these componentmanufacturers to guarantee the supply of these key components. Our contract manufacturers provideforecasts to the electronics distributors of our manufacturers’ requirements of these key components.These electronics distributors use the forecasts to source the key components from time to time, to theextent that these key components are available from the applicable component manufacturers, with the

17
objective of maintaining at all times at least three months’ supply of these key components available fordelivery to our contract manufacturers. When our contract manufacturers require certain key componentsfor use in the manufacture of our products, we direct them to issue purchase orders to the applicableelectronics distributor and, if the applicable electronics distributor has the requested quantities of thesekey components on hand, it will accept the purchase order issued by our contract manufacturers andsupply the quantities of the key components covered by the purchase order. Despite these arrangements,we cannot be certain or provide any assurance that the applicable component manufacturers will accept allof the purchase orders, or any of them, issued by these electronics distributors and agree to supply any ofthe quantities of these components requested by these electronics distributors. Accordingly, we cannot becertain or provide any assurance that these electronics distributors will have at all times at least threemonths’ inventory of these key components or any quantities of the key components in inventory or thatour contract manufacturers will be able to source their requirements of these key components from othersources in the event that the electronics distributors cannot meet our contract manufacturers’ requirements.
If our supply of any key component is disrupted, we may be unable to deliver our products to ourcustomers on a timely basis, which could result in lost or delayed revenue, injury to our reputation,increased manufacturing costs and exposure to claims by our customers. Even if alternate suppliers areavailable, we may have difficulty identifying them in a timely manner, we may incur significant additionalexpense in changing suppliers, and we may experience difficulties or delays in the manufacturing ofour products.
Competition
The market for SBCs is competitive and continually evolving. While we believe we are currently themarket leader, we expect competition to persist and intensify in the future as the SBC market grows andgains greater attention. We believe the following factors are the principal methods of competition in theSBC market:
• customer traction and experience;
• breadth of standards support;
• depth of border control features;
• proven interoperability and a carrier-class platform; and
• competitive costs.
Our primary competitors generally consist of start-up vendors, such as Newport Networks andNexTone and more established network equipment and component companies, such as Ditech Networks,through its acquisition of Jasomi, Juniper Networks, through its acquisition of Kagoor and AudioCodes,through its acquisition of Netrake. We also compete with some of the companies with which we havedistribution partnerships, such as Sonus Networks. We believe we compete successfully with all of thesecompanies based upon our experience in interactive communications service provider networks, thebreadth of our applications and standards support, the depth of our border control features, thedemonstrated ability of our products to interoperate with key communications infrastructure elements, andour comprehensive service support. We also believe our products are priced competitively with othermarket offerings. As the SBC market opportunity grows, we expect competition from additionalnetworking and telecommunications equipment suppliers, including other of our distribution partners. Forexample, Cisco Systems recently announced a new product for the SBC market.
Our current and potential competitors may have significantly greater financial, technical, marketingand other resources than we do and may be able to devote greater resources to the development,promotion, sale and support of their products. Our competitors may have more extensive customer bases

18
and broader customer relationships than we do, including relationships with our potential customers. Inaddition, these companies may have longer operating histories and greater name recognition than we do.Our competitors may be in a stronger position to respond quickly to new technologies and may be able tomarket and sell their products more effectively. Moreover, if one or more of our competitors were tomerge or partner with another of our competitors, the change in the competitive landscape could adverselyaffect our ability to compete effectively.
Intellectual Property
Our success as a company depends upon our ability to protect our core technology and intellectualproperty. To accomplish this, we rely on a combination of intellectual property rights, including patents,trade secrets, copyrights and trademarks, as well as customary contractual protections.
As of December 31, 2006, we have been issued seven U.S. patents, and one U.S. patent has beenallowed. In addition, fourteen U.S. utility patent applications are pending, as well as counterparts pendingin other jurisdictions around the world. Once a patent is “allowed” by the U.S. Patent Office, the patentwill be issued upon the completion of certain administrative procedures. A U.S. provisional application canbe filed with the U.S. Patent Office to establish a priority date for potentially inventive intellectualproperty. To patent the inventive intellectual property disclosed in a provisional filing, a U.S. utility patentapplication must be filed with the U.S. Patent Office referencing the U.S. provisional patent within onecalendar year. One advantage of filing a provisional patent is the establishment of an earlier priority datewhich may have value during a patent infringement lawsuit. Our three registered trademarks in the UnitedStates are “Acme Packet,” “Net-Net” and “Acme Packet Session Aware Networking.”
In addition to the protections described above, we generally control access to and use of ourproprietary software and other confidential information through the use of internal and external controls,including contractual protections with employees, contractors, customers and partners, and our software isprotected by U.S. and international copyright laws. We also incorporate a number of third party softwareprograms into our Net-Net appliances pursuant to license agreements.
We may not receive competitive advantages from the rights granted under our patents and otherintellectual property rights. Our competitors may develop technologies that are similar or superior to ourproprietary technologies, duplicate our proprietary technologies or design around the patents owned orlicensed by us. Our existing and future patents may be circumvented, blocked, licensed to others orchallenged as to inventorship, ownership, scope, validity or enforceability. It is possible that literature wemay be advised of by third parties in the future could negatively affect the scope or enforceability of eitherour present or future patents. Furthermore, our pending and future patent applications may not issue withthe scope of claims sought by us, if at all, or the scope of claims we are seeking may not be sufficientlybroad to protect our proprietary technologies. Moreover, we have adopted a strategy of seeking limitedpatent protection with respect to the technologies used in or relating to our products. If our products,patents or patent applications are found to conflict with any patents held by third parties, we could beprevented from selling our products, our patents may be declared invalid or our patent applications maynot result in issued patents. In foreign countries, we may not receive effective patent, copyright andtrademark protection. We may be required to initiate litigation in order to enforce any patents issued to us,or to determine the scope or validity of a third party’s patent or other proprietary rights. In addition, in thefuture we may be subject to lawsuits by third parties seeking to enforce their own intellectual propertyrights, as described in “Risk Factors—Claims by other parties that we infringe their proprietary technologycould force us to redesign our products or to incur significant costs.”
We license our software pursuant to agreements that impose restrictions on customers’ ability to usethe software, such as prohibiting reverse engineering and limiting the use of copies. We also seek to avoiddisclosure of our intellectual property by requiring employees and consultants with access to ourproprietary information to execute nondisclosure and assignment of intellectual property agreements and

19
by restricting access to our source code. Other parties may not comply with the terms of their agreementswith us, and we may not be able to enforce our rights adequately against these parties.
Employees
As of December 31, 2006, we had 247 employees and 5 full-time independent contractors, consistingof 61 employees and 5 full-time independent contractors engaged in sales and marketing, 85 employees inengineering, 63 employees in professional support services, 19 employees in manufacturing, and 19employees in finance, administration and operations. A total of 49 of those employees and full-timeindependent contractors were located outside of the United States. None of our employees arerepresented by labor unions or covered by a collective bargaining agreement. We have not experienced anywork stoppages, and we consider our current employee relations to be good.
ITEM 1A. RISK FACTORS
Set forth below and elsewhere in this Annual Report and in other documents we file with the SEC, are risksand uncertainties that could cause actual results to differ materially from the results contemplated by theforward-looking statements contained in this Annual Report. Because of the following factors, as well as othervariables affecting our operating results, past financial performance should not be considered as a reliableindicator of future performance and investors should not use historical trends to anticipate results or trends infuture periods.
Risks Relating to Our Business
If the market for SBCs does not develop as we anticipate, our revenue may decline or fail to grow, which wouldadversely affect our operating results.
We derive, and expect to continue to derive, all of our revenue from providing SBCs. The market forSBCs is relatively new and still evolving, and it is uncertain whether these products will achieve and sustainhigh levels of demand and market acceptance. Our success will depend to a substantial extent on thewillingness of interactive communications service providers to continue to implement SBCs.
Some service providers may be reluctant or unwilling to implement SBCs for a number of reasons,including failure to perceive the need for improved quality and security of interactive communicationsacross IP borders and lack of knowledge about the potential benefits that SBCs may provide. Even ifservice providers recognize the need for improved quality and security of interactive communicationsacross IP borders, they may not select SBCs such as ours because they choose to wait for the introductionof products and technologies that serve as a replacement or substitute for, or represent an improvementover, our SBCs.
If service providers do not perceive the benefits of SBCs, the SBC market may not continue todevelop or may develop more slowly than we expect, either of which would significantly adversely affectour revenue and profitability. Because the market for SBCs is developing and the manner of itsdevelopment is difficult to predict, we may make errors in predicting and reacting to relevant businesstrends, which could harm our operating results.
We have incurred operating losses in the past and may not be able to sustain profitability in the future.
We have incurred significant losses in several fiscal years since inception, which included net losses of$7.5 million in 2003, $7.0 million in 2004 and $35,000 in 2005. We expect to continue to incur significantsales and marketing, product development, administrative, and other expenses. We have only a limitedoperating history on which you can base your evaluation of our business, including our ability to increaseour revenue. We commenced operations in August 2000 and began recognizing revenue in 2003. We willneed to generate significant revenue to maintain profitability, and we cannot be sure that we will remainprofitable for any substantial period of time. If we are unable to remain profitable, the market price of ourcommon stock will probably fall.
20
The unpredictability of our quarterly results may adversely affect the trading price of our common stock.
If our quarterly revenue, earnings or other operating results fall below the expectations of securitiesanalysts or investors, the price of our common stock could fall substantially. Our operating results can varysignificantly from quarter to quarter due to a number of factors, many of which are outside of our control.Generally, a service providers’ purchases of communications equipment have been unpredictable andclustered, rather than steady and predictable, as service providers frequently build out and update theircommunications networks in stages. In addition, the following factors, among others, can contribute to theunpredictability of our operating results:
• fluctuations in demand for our products, and the timing and size of customer orders;
• the length and variability of the sales and deployment cycles for our products, and thecorresponding timing of recognizing revenue;
• new product introductions and enhancements by our competitors and us;
• changes in our pricing policies or the pricing policies of our competitors;
• changes in our third-party manufacturing costs or in the prices of components and materials used inour products;
• our ability to develop, introduce and deploy new products and product enhancements that meetcustomer requirements in a timely manner;
• our ability to obtain sufficient supplies of limited source components or materials;
• our ability to attain and maintain production volumes and quality levels for our products; and
• general economic conditions, as well as those specific to the communications, networking andrelated industries.
As with other communications equipment suppliers, we may recognize a substantial portion of ourrevenue in a given quarter from sales booked and shipped in the last month of that quarter. As a result, adelay in customer orders is likely to result in a delay in shipments and recognition of revenue beyond theend of a given quarter. Since a relatively small number of customers may account for a substantial portionof our revenue in any quarter, any such delay in an order from a customer could have a material adverseeffect on our revenue for that quarter.
Our operating expenses are largely based on our anticipated organizational and revenue growth. Mostof our expenses, such as employee compensation, are relatively fixed in the short term. As a result, anyshortfall in revenue in relation to our expectations, whether for the reasons set forth above, the reasonsidentified below or any other reason, could cause significant changes in our operating results from quarterto quarter and could result in increased quarterly losses.
We believe that quarter-to-quarter comparisons of our operating results are not a good indication ofour future performance. It is likely that in some future quarters, our operating results will be below theexpectations of securities analysts and investors. In this event, the price of our common stock may decreasesubstantially.
We depend on a limited number of customers for a substantial portion of our revenue in any fiscal period, and theloss of, or a significant shortfall in orders from, key customers could significantly reduce our revenue.
We derive a substantial portion of our total revenue in any fiscal period from a limited number ofcustomers as a result of the nature of our target market and the relatively early stage of our development.During any given fiscal quarter, a small number of customers may each account for 10% or more of ourrevenue. For example, four such customers accounted for 51% of our total revenue in 2005 and two such

21
customers accounted for 27% of our total revenue in 2006. Additionally, we do not have and we do notenter into long-term purchase contracts with our customers, and have no contractual arrangements toensure future sales of our products to our existing customers. Our inability to generate anticipated revenuefrom our key existing or targeted customers, or a significant shortfall in sales to them, would significantlyreduce our revenue and adversely affect our business. Our operating results in the foreseeable future willcontinue to depend on our ability to effect sales to existing and other large customers.
Our revenue growth may be constrained by our product concentration and lack of revenue diversification.
We have derived all of our revenue to date from sales of our SBCs, and we expect that our SBCs willaccount for substantially all of our total revenue for the foreseeable future. Continued market acceptanceof these products is critical to our future success. As a result, our business, operating results, financialcondition and cash flows could be adversely affected by:
• any decline in demand for our existing products;
• the failure of our existing products to achieve continued market acceptance;
• the introduction of products and technologies that serve as a replacement or substitute for, orrepresent an improvement over, our existing products;
• technological innovations or new standards that our existing products do not address; and
• our inability to release enhanced versions of our existing products on a timely basis.
The long and variable sales and deployment cycles for our products may cause our operating results to varymaterially, which could result in a significant unexpected revenue shortfall in any given quarter.
Our products have lengthy sales cycles, which typically extend from six to twelve months and may takeup to two years. A customer’s decision to purchase our products often involves a significant commitment ofits resources and a product evaluation and qualification process that can vary significantly in length. Thelength of our sales cycles also varies depending on the type of customer to which we are selling, the productbeing sold and the type of network in which our product will be utilized. We may incur substantial salesand marketing expenses and expend significant management effort during this time, regardless of whetherwe make a sale.
Even after making the decision to purchase our products, our customers may deploy our productsslowly. Timing of deployment can vary widely among customers. The length of a customer’s deploymentperiod may directly affect the timing of any subsequent purchase of additional products by that customer.
As a result of the lengthy and uncertain sales and deployment cycles for our products, it is difficult forus to predict the quarter in which our customers may purchase additional products or features from us, andour operating results may vary significantly from quarter to quarter, which may negatively affect ouroperating results for any given quarter.
Our revenue growth will be limited if we are unable to continue to sell our products to large interactivecommunications service providers.
Our future success depends in part on our ability to sell our products to large interactivecommunications service providers operating complex networks that serve large numbers of subscribers andtransport high volumes of traffic. The communications industry historically has been dominated by arelatively small number of service providers. While deregulation and other market forces have led to anincreasing number of service providers in recent years, large service providers continue to constitute asignificant portion of the market for communications equipment. If we fail to sell additional SBCs to ourlarge customers or to expand our customer base to include additional customers that deploy our productsin large-scale networks serving significant numbers of subscribers, our revenue growth will be limited.

22
Our large customers have substantial negotiating leverage, which may require that we agree to terms andconditions that could result in increased cost of sales and decreased revenues and could adversely affect ouroperating results.
Many of our customers are large interactive communications service providers that have substantialpurchasing power and leverage in negotiating contractual arrangements with us. These customers mayrequire us to develop additional features and require penalties for performance obligations, such asdelivery, outages and response time. As we seek to sell more products to large service providers, we may berequired to agree to additional performance-based terms and conditions, which may affect the timing ofrevenue recognition and may adversely affect our operating results.
Future interpretations of existing accounting standards could adversely affect our operating results.
Generally accepted accounting principles in the United States are subject to interpretation by theFinancial Accounting Standards Board, or FASB, the American Institute of Certified Public Accountants,or AICPA, the SEC and various other bodies formed to promulgate and interpret appropriate accountingprinciples. A change in these principles or interpretations could have a significant effect on our reportedfinancial results, and could affect the reporting of transactions completed before the announcement of achange.
For example, we recognize our product software license revenue in accordance with AICPAStatement of Position, or SOP, 97-2, Software Revenue Recognition , and related amendments andinterpretations contained in SOP 98-9, Software Revenue Recognition with Respect to Certain Transactions .The AICPA and its Software Revenue Recognition Task Force continue to issue interpretations andguidance for applying the relevant accounting standards to a wide range of sales contract terms andbusiness arrangements that are prevalent in software licensing arrangements. Future interpretations ofexisting accounting standards, including SOP 97-2 and SOP 98-9, or changes in our business practicescould result in future changes in our revenue recognition accounting policies that have a material adverseeffect on our results of operations. We may be required to delay revenue recognition into future periods,which could adversely affect our operating results. In the future we may have to defer recognition forlicense fees due to several factors, including whether a transaction involves:
• software arrangements that include undelivered elements for which we do not have vendor specificobjective evidence of fair value;
• requirements that we deliver services for significant enhancements and modifications to customizeour software for a particular customer; or
• material acceptance criteria.
Because of these factors and other specific requirements under accounting principles generallyaccepted in the United States for software revenue recognition, we must have very precise terms in oursoftware arrangements in order to recognize revenue when we initially deliver software or performservices. Negotiation of mutually acceptable terms and conditions can extend our sales cycle, and wesometimes accept terms and conditions that do not permit revenue recognition at the time of delivery.
In December 2004, the FASB issued Statement of Financial Accounting Standards, or SFAS,No. 123(R), Share Based Payment. SFAS No. 123(R) requires measurement of all employee stock-basedcompensation awards using a fair-value method and the recording of such expense in the consolidatedfinancial statements. In addition, the adoption of SFAS No. 123(R) requires additional accounting relatedto the income tax effects and disclosure regarding the cash flow effects resulting from share-based paymentarrangements. In January 2005, the SEC issued Staff Accounting Bulletin No. 107, which providessupplemental implementation guidance for SFAS No. 123(R). We have selected the Black-Scholes option-pricing model as the most appropriate fair-value method for our awards and are recognizing compensation

23
costs on a straight-line basis over our awards’ vesting periods. We adopted SFAS No. 123(R) on January 1,2006, and in fiscal 2006 recognized stock-based compensation expense of $867,000.
If the migration to an IP network architecture for real-time interactive communications does not continue, theSBC market may not expand as predicted, and our ability to obtain new customers may decrease and our revenuewill decrease.
We derive our revenue by providing SBCs to interactive communications service providers seeking todeliver premium interactive communications over IP networks. Our success depends on the continuedmigration of service providers’ networks to a single IP network architecture. The migration of voice trafficfrom the PSTN to IP networks is in its early stages, and the continued migration to IP networks dependson a number of factors outside of our control. Among other things, existing networks include switches andother equipment that may have estimated useful lives of twenty or more years and therefore may continueto operate reliably for a lengthy period of time. Other factors that may delay the migration to IP networksinclude service providers’ concerns regarding initial capital outlay requirements, available capacity onlegacy networks, competitive and regulatory issues, and the implementation of an enhanced servicesbusiness model. As a result, service providers may defer investing in products, such as ours, that aredesigned to migrate interactive communications to IP networks. If the migration to IP networks does notoccur for these or other reasons, or if it occurs more slowly than we expect, the SBC market may notexpand as predicted, if at all, and we will not be able to gain new customers. In addition, even if there is asuccessful migration to an IP network for interactive communications, new unforseen technologies mayrender the SBC unnecessary. As a result, our sales and revenues will decrease and our operating resultswill be harmed.
If functionality similar to that offered by our SBCs is added to existing network infrastructure elements,organizations may decide against adding our SBCs to their network which would cause the market for standaloneSBC systems to decrease resulting in fewer customers for and decreased sales of standalone SBC systems.
Other providers of network infrastructure elements are offering or proposing to offer functionalityaimed at addressing the problems addressed by our products. The inclusion of, or the announcement of anintent to include, functionality perceived to be similar to that offered by our products in infrastructureelements that are already generally accepted as necessary components of network architecture may causethe market not to grow as predicted, which would have an adverse effect on our ability to market and sellcertain of our products. Furthermore, even if the functionality offered by other network infrastructureelements is more limited than our products, a significant number of customers may elect to accept suchlimited functionality in lieu of adding additional equipment from an additional vendor, which could alsohave a material adverse effect on the market for standalone SBC systems. Many organizations haveinvested substantial personnel and financial resources to design and operate their networks and haveestablished deep relationships with other providers of network infrastructure elements, which may makethem reluctant to add new components to their networks, particularly from new vendors. In addition, anorganization’s existing vendors or new vendors with a broad product offering may be able to offerconcessions that we are not able to match because we currently offer only a single line of products and mayhave fewer financial resources than some of our competitors. If organizations are reluctant to addadditional network infrastructure from new vendors or otherwise decide to work with their existingvendors, the market for our products may prove smaller than predicted and our business, operating resultsand financial condition will be adversely affected.
The market for SBCs is competitive and continually evolving, and if we are not able to compete effectively, we maynot be able to continue to expand our business as expected and our business may suffer.
Although relatively new, the market for SBCs is competitive and continually evolving. We expectcompetition to persist and intensify in the future as the SBC market grows and new and existingcompetitors devote considerable resources to introducing and enhancing products. Our primary

24
competitors generally consist of start-up vendors, such as Newport Networks and NexTone, and moreestablished network equipment and component companies, such as Ditech Networks, through itsacquisition of Jasomi, Juniper Networks, through its acquisition of Kagoor, and AudioCodes, through itsacquisition of Netrake. In addition, we compete with some of the companies with which we havedistribution partnerships, such as Sonus Networks. We compete on the basis of customer traction andexperience in interactive communications service provider networks, breadth of applications and standardssupport, depth of border control features, demonstrated ability of products to interoperate with keycommunications infrastructure elements, comprehensive service support, and price.
Networking and telecommunications equipment suppliers without competitive solutions today, such asCisco Systems, may introduce solutions in the future, either through internal development or acquisition.These additional competitors may include some of our distribution partners. Any new entrant would belikely to devote significant sales and marketing resources to establish its position in the SBC market andmay be willing to price its products at a discount or bundle its products with other equipment or services inan attempt to rapidly gain market share. New product introductions or new market entrants could causeservice providers to delay purchase decisions or reopen bidding processes. If new product enhancementsand introductions are superior to ours, and we are unable to make comparable enhancements to ourproducts, our competitive advantage would be compromised and the condition of our business would beharmed.
We may not be able to compete effectively against current and potential competitors, especially thosewith significantly greater resources and market leverage. Our competitors may have more extensivecustomer bases and broader customer relationships than we do, including relationships with our potentialcustomers. In addition, these companies may have longer operating histories and greater name recognitionthan we do. These competitors may be in a position to respond more quickly than we do to new oremerging technologies or changes in customer requirements or may foresee the course of marketdevelopments more accurately than we do. As a result, we may experience price reductions for ourproducts, order cancellations and increased expenses. Accordingly, our business may not grow as expectedand our business may suffer.
If we do not timely deliver new and enhanced products that respond to customer requirements and technologicalchanges, interactive communications service providers may not buy our products and our revenue may decline.
To achieve market acceptance for our products, we must effectively anticipate, and adapt in a timelymanner to, customer requirements and must offer products that meet changing customer demands.Prospective customers may require product features and capabilities that our current products do not have.For example, our most recent product introduction, the Net-Net 9000 Series, may not adequately respondto new customer demands, and, therefore, demand for our products may decrease or may fail to increaseto the extent contemplated by our business plan. If we fail to develop products that satisfy customerrequirements, our ability to create or increase demand for our products will be harmed, and we may losecurrent and prospective customers.
The market for SBCs is characterized by rapid technological change, frequent new productintroductions and evolving industry requirements. We may be unable to respond quickly or effectively tothese developments. We may experience difficulties with software development, hardware design,manufacturing or marketing that could delay or prevent our development, introduction or implementationof new products and enhancements. The introduction of new products by competitors, the emergence ofnew industry standards, or the development of entirely new technologies to replace existing productofferings could render our existing or future products obsolete. If our products become technologicallyobsolete, customers may purchase solutions from our competitors and we may be unable to sell ourproducts in the marketplace and generate revenue.

25
If our products do not interoperate with our customers’ existing networks, the demand for our products willdecrease and our operating results will be harmed.
Our products must interface with our customers’ existing networks, each of which may have differentspecifications. An unanticipated lack of interoperability may result in significant support and repair costsand harm our relations with customers. If our products do not interoperate with those of our customers’networks, installations could be delayed or orders for our products could be cancelled, which would resultin losses of revenue and customers that could significantly impair our business and operating results.
We rely on many distribution partners to assist in selling our products, and if we do not develop and manage theserelationships effectively, our ability to generate revenue and control expenses will be adversely affected.
As of December 31, 2006, we had approximately 30 distribution partners. Our success is highlydependent upon our ability to continue to establish and maintain successful relationships with thesedistribution partners from whom, collectively, we derive a significant portion of our revenue. Revenuederived through distribution partners accounted for 52% of our total revenue in 2005 and 48% of our totalrevenue in 2006. Although we have entered into contracts with each of our distribution partners, ourcontractual arrangements are not exclusive and do not obligate our distribution partners to order, purchaseor distribute any fixed or minimum quantities of our products. Accordingly, our distribution partners, attheir sole discretion, may choose to purchase SBCs from our competitors rather than from us. Under ourcontracts with our distribution partners, our distribution partners generally order products from us bysubmitting purchase orders that describe, among other things, the type and quantities of our productsdesired, delivery date and other delivery terms applicable to the ordered products. Accordingly, our abilityto sell our products and generate significant revenue through our distribution partners is highly dependenton the continued desire and willingness of our distribution partners to purchase and distribute ourproducts and on the continued cooperation between us and our distribution partners. Some of ourdistribution partners may develop competitive products in the future or may already have other productofferings that they may choose to offer and support in lieu of our products. Divergence in strategy, changein focus, competitive product offerings, potential contract defaults, and changes in ownership ormanagement of a distribution partner may interfere with our ability to market, license, implement orsupport our products with that party, which in turn could harm our business. Some of our competitors mayhave stronger relationships with our distribution partners than we do, and we have limited control, if any,as to whether those partners implement our products rather than our competitors’ products or whetherthey devote resources to market and support our competitors’ products rather than our offerings.
Moreover, if we are unable to leverage our sales and support resources through our distributionpartner relationships, we may need to hire and train additional qualified sales and engineering personnel.We cannot be assured, however, that we will be able to hire additional qualified sales and engineeringpersonnel in these circumstances, and our failure to do so may restrict our ability to generate revenue orimplement our products on a timely basis. Even if we are successful in hiring additional qualified sales andengineering personnel, we will incur additional costs and our operating results, including our gross margin,may be adversely affected.
Our international operations expose us to additional business risks, and failure to manage these risks mayadversely affect our revenue generated in foreign countries, and our overall operating results.
We have employees in Australia, Belgium, Brazil, Canada, China, France, Germany, Hong Kong,Israel, Italy, Japan, Korea, Malaysia, Mexico, Peru, Russia, South Africa, Spain and the United Kingdom.In the coming years, we may find that the success of our business may depend, in part, on our ability toexpand further into international markets. Any continued expansion into international markets will requiresignificant resources and management attention and will subject us to new regulatory, economic andpolitical risks. Given our limited experience in international markets, we cannot be sure that any furtherinternational expansion will be successful. In addition, we will face new risks in doing business
26
internationally. These risks could reduce demand for our products, lower the prices at which we can sellour products or otherwise have an adverse effect on our operating results. Among the risks we believe aremost likely to affect us are:
• our ability to comply with differing technical standards and certification requirements outside NorthAmerica;
• difficulties and costs of staffing and managing foreign operations;
• greater difficulty collecting accounts receivable and longer payment cycles;
• unexpected changes in regulatory requirements;
• reduced protection for intellectual property rights in some countries;
• new and different sources of competition;
• fluctuations in currency exchange rates;
• adverse tax consequences; and
• political and economic instability and terrorism.
Because we derive all of our revenue from interactive communications service providers, our operating results willsuffer if the interactive communications industry experiences an economic downturn.
We derive all of our revenue from the communications industry. Our future success depends upon thecontinued demand for communications equipment by interactive communications service providers. Thecommunications industry is cyclical and reactive to general economic conditions. In the recent past,worldwide economic downturns, pricing pressures and deregulation have led to consolidations andreorganizations. These downturns, pricing pressures and restructurings have been causing delays andreductions in capital and operating expenditures by many interactive communications service providers.These delays and reductions, in turn, have been reducing demand for communications products like ours.A continuation or subsequent recurrence of these industry patterns, as well as general domestic andforeign economic conditions and other factors that reduce spending by companies in the communicationsindustry, could harm our operating results in the future.
The loss of key personnel or an inability to attract and retain additional personnel may impair our ability to growour business.
We are highly dependent upon the continued service and performance of our senior managementteam and key technical, marketing and production personnel, including our founders, Andrew D. Ory, whois also our President and Chief Executive Officer, and Patrick MeLampy, who is also our Chief TechnologyOfficer. Neither of these officers is a party to an employment agreement with us, and either of themtherefore may terminate employment with us at any time with no advance notice. The replacement ofeither of these two officers likely would involve significant time and costs, and the loss of either of theseofficers may significantly delay or prevent the achievement of our business objectives.
We face intense competition for qualified individuals from numerous technology, marketing, financialservices, manufacturing and e-commerce companies. For example, our competitors may be able attract andretain a more qualified engineering team by offering more competitive compensation packages. If we areunable to attract new engineers and retain our current engineers, we may not be able to develop andservice our products at the same levels as our competitors and we may, therefore, lose potential customersand sales penetration in certain markets. Our failure to attract and retain suitably qualified individualscould have an adverse effect on our ability to implement our business plan and as a result, our ability tocompete effectively in the SBC market would decrease, our operating results would suffer and ourrevenues would decrease.
27
We will incur significant increased costs as a result of operating as a public company, and our management willbe required to devote substantial time to public company compliance initiatives. If we are unable to absorb theseincreased costs or maintain management focus on development and sales of our product offerings and services, wemay not be able to achieve our business plan.
As a public company, we will incur significant legal, accounting and other expenses that we did notincur as a private company. In addition, the Sarbanes-Oxley Act, as well as rules subsequentlyimplemented by the SEC and the Nasdaq Stock Market, have imposed a variety of new requirements onpublic companies, including requiring changes in corporate governance practices. Our management andother personnel will need to devote a substantial amount of time to these new compliance initiatives.Moreover, these rules and regulations will increase our legal and financial compliance costs and will makesome activities more time-consuming and costly. For example, we expect these new rules and regulationshave made it more difficult and expensive for us to obtain director and officer liability insurance, and wehave incurred substantial costs to maintain the same or similar coverage.
In addition, the Sarbanes-Oxley Act requires, among other things, that we maintain effective internalcontrols for financial reporting and disclosure controls and procedures. In particular, commencing in fiscal2007, we must perform system and process evaluation and testing of our internal controls over financialreporting to allow management and our independent registered public accounting firm to report on theeffectiveness of our internal controls over financial reporting, as required by Section 404 of the Sarbanes-Oxley Act. Our testing, or the subsequent testing by our independent registered public accounting firm,may reveal deficiencies in our internal controls over financial reporting that are deemed to be materialweaknesses. Our compliance with Section 404 will require that we incur substantial accounting expenseand expend significant management efforts. We currently do not have an internal audit group, and we willneed to hire additional accounting and financial staff with appropriate public company experience andtechnical accounting knowledge. Moreover, if we are not able to comply with the requirements ofSection 404 in a timely manner, or if we or our independent registered public accounting firm identifiesdeficiencies in our internal controls over financial reporting that are deemed to be material weaknesses,the market price of our stock could decline and we could be subject to sanctions or investigations byNasdaq, the SEC or other regulatory authorities, which would require additional financial andmanagement resources.
The increased costs associated with operating as a public company may decrease our net income orincrease our net loss, and may require us to reduce costs in other areas of our business or increase theprices of our products or services. Additionally, if these requirements divert our management’s attentionfrom other business concerns, they could have a material adverse effect on our business, financialcondition and results of operations.
If we are unable to manage our growth and expand our operations successfully, our business and operating resultswill be harmed and our reputation may be damaged.
We significantly expanded our operations in 2005 and 2006. For example, during the period fromDecember 31, 2004 through December 31, 2006, we increased the number of our employees and full-timeindependent contractors by 142%, from 104 to 252, and we opened new sales offices in Japan and Spain. Inaddition, our total operating expenses for the year ended December 31, 2005 increased by 58% ascompared to the fiscal year ended December 31, 2004, and for the year ended December 31, 2006 were59% higher than for the year ended December 31, 2005. We anticipate that further expansion of ourinfrastructure and headcount will be required to achieve planned expansion of our product offerings,projected increases in our customer base and anticipated growth in the number of product deployments.Our rapid growth has placed, and will continue to place, a significant strain on our administrative andoperational infrastructure. Our ability to manage our operations and growth will require us to continue torefine our operational, financial and management controls, human resource policies, and reporting systemsand procedures.

28
We may not be able to implement improvements to our management information and control systemsin an efficient or timely manner and may discover deficiencies in existing systems and controls. If we areunable to manage future expansion, our ability to provide high quality products and services could beharmed, which would damage our reputation and brand and substantially harm our business and results ofoperations.
Our ability to compete and the success of our business could be jeopardized if we are unable to protect ourintellectual property adequately.
Our success depends to a degree upon the protection of our software, hardware designs and otherproprietary technology. We rely on a combination of patent, copyright, trademark and trade secret laws,and confidentiality provisions in agreements with employees, distribution partners, consultants andcustomers to protect our intellectual property rights. Other parties may not comply with the terms of theiragreements with us, and we may not be able to enforce our rights adequately against these parties. Inaddition, unauthorized parties may attempt to copy or otherwise obtain and use our products ortechnology. Monitoring unauthorized use of our products is difficult, and we cannot be certain that thesteps we have taken will prevent unauthorized use of our technology, particularly in foreign countrieswhere the laws may not protect our proprietary rights as fully as in the United States. If competitors areable to use our technology, our ability to compete effectively could be harmed. For example, if acompetitor were to gain use of certain of our proprietary technology, it might be able to manufacturesimilarly designed and equipped SBCs at a reduced cost, which would result in a decrease in demand forour products. Furthermore, we have adopted a strategy of seeking limited patent protection both in theUnited States and in foreign countries with respect to the technologies used in or relating to our products.Others may independently develop and obtain patents for technologies that are similar to or superior toour technologies. If that happens, we may need to license these technologies and we may not be able toobtain licenses on reasonable terms, if at all, thereby causing great harm to our business. In addition, if weresort to legal proceedings to enforce our intellectual property rights, the proceedings could becomeburdensome and expensive, even if we were to prevail.
Claims by other parties that we infringe upon their proprietary technology could force us to redesign our productsor to incur significant costs.
We may become involved in litigation as a result of allegations that we infringe upon intellectualproperty rights of others. Any parties asserting that our products infringe upon their proprietary rightswould force us to defend ourselves, and possibly our customers, distribution partners or contractmanufacturers, against the alleged infringement. These claims and any resulting lawsuit, if successful, couldsubject us to significant liability for damages and invalidation of our proprietary rights. Any potentialintellectual property litigation also could force us to do one or more of the following:
• stop selling, incorporating or using our products that use the challenged intellectual property;
• obtain from the owner of the infringed intellectual property right a license to sell or use the relevanttechnology, which license may not be available on reasonable terms, or at all;
• redesign those products that use any allegedly infringing technology; or
• refund deposits and other amounts.
Any lawsuits regarding intellectual property rights, regardless of their success, could be time-consuming, could be expensive to resolve, and would divert our management’s time and attention.

29
Compliance with regulations and standards applicable to our products may be time consuming, difficult andcostly, and if we fail to comply, our product sales will decrease.
In order to achieve and maintain market acceptance, our products must continue to meet a significantnumber of regulations and standards. In the United States, our products must comply with variousregulations defined by the Federal Communications Commission and Underwriters Laboratories.
As these regulations and standards evolve, and if new regulations or standards are implemented, wewill be required to modify our products or develop and support new versions of our products, and this willincrease our costs. The failure of our products to comply, or delays in compliance, with the various existingand evolving industry regulations and standards could prevent or delay introduction of our products, whichcould harm our business. User uncertainty regarding future policies may also affect demand forcommunications products, including our products. Moreover, distribution partners or customers mayrequire us, or we may otherwise deem it necessary or advisable, to alter our products to address actual oranticipated changes in the regulatory environment. Our inability to alter our products to address theserequirements and any regulatory changes could have a material adverse effect on our business, financialcondition and operating results.
Regulations affecting IP networks could reduce demand for our products.
Laws and regulations governing the Internet and electronic commerce are emerging but remainlargely unsettled, even in the areas where there has been some legislative action. Regulations may focuson, among other things, assessing access or settlement charges, or imposing tariffs or regulations based onthe characteristics and quality of products, either of which could restrict our business or increase our costof doing business. Government regulatory policies are likely to continue to have a major impact on thepricing of existing and new network services and, therefore, are expected to affect demand for thoseservices and the communications products, including our products, supporting those services.
Any changes to existing laws or the adoption of new regulations by federal or state regulatoryauthorities or any legal challenges to existing laws or regulations affecting IP networks could materiallyadversely affect the market for our products. In addition, the convergence of the PSTN and IP networkscould become subject to governmental regulation, including the imposition of access fees or other tariffs,that adversely affects the market for services and equipment, including our products, for interactivecommunications across IP networks. User uncertainty regarding future policies may also affect demand forcommunications products, including our products. Moreover, distribution partners or customers mayrequire us, or we may otherwise deem it necessary or advisable, to alter our products to address actual oranticipated changes in the regulatory environment. Our inability to alter our products or address anyregulatory changes could have a material adverse effect on our business, financial condition or operatingresults.
We are subject to environmental and occupational health and safety regulations that may increase our costs ofoperations or limit our activities.
We are subject to environmental and occupational health and safety regulations relating to matterssuch as reductions in the use of harmful substances, comprehensive risk management in manufacturingactivities and final products, the use of lead-free soldering, and the recycling of products and packagingmaterials. The European Parliament and the Counsel of the European Union have published directives onwaste electrical and electronic equipment and on the restriction of the use of certain hazardous substancesin electrical and electronic equipment. These directives generally require electronics producers to bear thecost of collection, treatment, recovery and safe disposal of past and future products from end-users and toensure that new electrical and electronic equipment does not contain specified hazardous substances.While the cost of these directives to us cannot be determined before regulations are adopted in individualmember states of the European Union, it may be substantial and may divert resources, which could detractfrom our ability to develop new products. We may not be able to comply in all cases with applicable

30
environmental and other regulations, and if we do not, we may incur remediation costs or we may not beable to offer our products for sale in certain countries, which could adversely affect our results.
Because our products are sophisticated and designed to be deployed in complex environments, they may haveerrors or defects that we find only after deployment, which could result in a loss of customers and adversely affectour reputation, future sales and operating results.
Products as complex as ours may contain undetected errors that result in product failures. Ourproducts can be fully tested only when deployed in large networks with high volumes of traffic. Ourcustomers may discover errors or defects in the software or hardware, or the products may not operate asexpected. If we are unable to fix errors or other performance problems identified after deployment of ourproducts, we could experience:
• a loss of, or delay in, revenue;
• a loss of customers and market share;
• a failure to attract new customers or achieve market acceptance for our products;
• increased service, support and warranty costs and a diversion of development resources; and
• costly and time-consuming legal actions by our customers and injury to our reputation.
Any of these results could have a material adverse effect on our business and operating results.
Our dependence on outside contractors for critical manufacturing services could result in product delivery delays,damage our customer relations and adversely affect our operating results.
We outsource the manufacturing of our Net-Net products. We subcontract all of the manufacturing ofour Net-Net 4000 series of products to Jabil Circuit, Inc. and Benchmark Electronics. We subcontract allof the manufacturing of our Net-Net 9000 series of products to Jabil Circuit, Inc. and TTMTechnologies, Inc. We do not have a written agreement with any of these manufacturers. We submitpurchase orders to these manufacturers that describe, among other things, the type and quantities of ourproducts or components to be manufactured by the applicable manufacturer and the delivery date andother delivery terms applicable to the products or components. Our manufacturers do not have any writtencontractual obligation to accept any purchase order that we submit for the manufacture of any of ourproducts or components. If one of our manufacturers accepts in writing a purchase order submitted by us,the manufacturer is legally obligated to manufacture the product or component covered by such purchaseorder and we are obligated to purchase and take delivery of such product or component. Our reliance onoutside manufacturers involves a number of potential risks, including the absence of adequate capacity, theunavailability of, or interruptions in access to, necessary manufacturing processes, and reduced controlover delivery schedules. In addition, we cannot be certain or provide any assurance that our manufacturerswill accept all of our purchase orders, or any of them, and agree to manufacture and supply any or all ofour manufacturing requirements for our products or any components. If our manufacturers are unable orunwilling to continue manufacturing our products and components in required volumes, we will have toidentify one or more acceptable alternative manufacturers. The use of new manufacturers may causesignificant interruptions in supply if the new manufacturers have difficulty manufacturing products to ourspecifications.
Certain component parts used in the manufacture of our products are sourced from single or limited sources. Ifour contract manufacturers are unable to obtain these components on a timely basis, we will not be able to meetour customers’ product delivery requirements, which could harm our reputation and adversely affect ouroperating results.
Certain key components used in the manufacture of our products are sourced from single or, in somecases, limited sources. For example, the third parties that we hire to manufacture our products, or contract

31
manufacturers, purchase through electronics distributors various types of network processors, trafficmanagers, microprocessors and network search engines. Specifically, Applied Micro Circuits Corporation,Broadcom Corporation, Freescale Semiconductor, Inc. and Integrated Device Technology, Inc., arepresently the sole sources for these particular components. We do not have a written agreement with anyof these component manufacturers to guarantee the supply of the key components used in our products,and we do not require any of our contract manufacturers to have a written agreement with any of thesecomponent manufacturers. We have entered into arrangements under which electronics distributors haveagreed to establish and maintain at least three months’ inventory of certain key components, and, at therequest of our contract manufacturers, to supply all or a portion of the key components held pursuant tothis arrangement to our contract manufacturers for use in the manufacture of our products. Ourcontractual arrangements with the electronics distributors do not provide for these electronics distributorsto enter into any contract with any component manufacturer to guarantee the supply of these keycomponents. Our contract manufacturers provide forecasts to the electronics distributors of our contractmanufacturers’ requirements of the key components. These electronics distributors use the forecasts tosource these key components from time to time, to the extent that the key components are available fromthe applicable component manufacturers, with the objective of maintaining at all times at least threemonths’ supply of the key components available for delivery to our contract manufacturers. When ourcontract manufacturers require certain key components for use in the manufacture of our products, wedirect them to issue purchase orders to the applicable electronics distributor and, if the applicableelectronics distributor has the requested quantities of these key components available, it will accept thepurchase order issued by our contract manufacturers and supply the quantities of the key componentscovered by the purchase order. Despite these arrangements, we cannot be certain or provide any assurancethat the component manufacturers will accept all of the purchase orders, or any of them, issued by theelectronics distributors and agree to supply any or all of the quantities requested. Accordingly, we cannotbe certain or provide any assurance that these electronics distributors will have at all times at least threemonths’ supply of these key components or any quantities of the key components in inventory or that ourcontract manufacturers will be able to source their requirements of the key components from other sourcesin the event that the electronics distributors cannot meet our contract manufacturers’ requirements.Additionally, if our contract manufacturers underestimate our component requirements, they may nothave an adequate supply, which could interrupt manufacturing of our products and result in delays inshipments and revenue. If any of our sole or limited source suppliers experience capacity constraints, workstoppages or other reductions or disruptions in output, they may not be able to meet, or may choose not tomeet, our delivery schedules. Also our suppliers may:
• enter into exclusive arrangements with our competitors;
• be acquired by our competitors;
• stop selling their products or components to us at commercially reasonable prices;
• refuse to sell their products or components to us at any price; or
• be unable to obtain or have difficulty obtaining components for their products from their suppliers.
If our supply of any key components is disrupted, we may be unable to deliver our products to ourcustomers on a timely basis, which could result in lost or delayed revenue, injury to our reputation,increased manufacturing costs and exposure to claims by our customers. Even if alternate suppliers areavailable, we may have difficulty identifying them in a timely manner, we may incur significant additionalexpense in changing suppliers, and we may experience difficulties or delays in the manufacturing of ourproducts. For example, we have customized some of our hardware products to accommodate the design ofsome key components, and the loss of the sole supplier of a key customized component could require thatwe redesign related components to accommodate replacement components. Any failure to meet ourcustomers’ delivery requirements could harm our reputation and decrease our revenue.
32
Product liability claims related to our customers’ networks could result in substantial costs.
Our products are critical to the business operations of our customers. If one of our products fails,interactive communications service provider may assert a claim for substantial damages against us,regardless of our responsibility for the failure. Our product liability insurance may not cover claimsbrought against us. Product liability claims could require us to spend significant time and money inlitigation or to pay significant damages. Any product liability claims, whether or not successful, couldseriously damage our reputation and our business.
We may undertake acquisitions to further expand our business, which may pose risks to our business and dilutethe ownership of our existing stockholders.
Our business and our customer base have been built through organic growth. While we do not haveany present plans to acquire businesses, technologies or services, we may enter into such arrangements inthe future in order to expand our capabilities, enter new markets, or increase our market share. We do nothave any experience making significant acquisitions. Integrating any newly acquired businesses,technologies or services is likely to be expensive and time consuming. To finance any acquisitions, it maybe necessary for us to raise additional funds through public or private financings. Additional funds may notbe available on terms that are favorable to us, and, in the case of equity financings, would result in dilutionto our stockholders. If we do complete any acquisitions, we may be unable to operate the acquiredbusinesses profitably or otherwise implement our strategy successfully. If we are unable to integrate anynewly acquired entities, technologies or services effectively, our business and results of operations willsuffer. The time and expense associated with finding suitable and compatible businesses, technologies orservices could also disrupt our ongoing business and divert our management’s attention. Futureacquisitions by us could also result in large and immediate write-offs or assumptions of debt andcontingent liabilities, any of which could substantially harm our business and results of operations.
We may need additional capital in the future, which may not be available to us, and if it is available, may diluteyour ownership of our common stock.
We may need to raise additional funds through public or private debt or equity financings in order to:
• fund ongoing operations;
• take advantage of opportunities, including more rapid expansion of our business or the acquisitionof complementary products, technologies or businesses;
• develop new products; or
• respond to competitive pressures.
Any additional capital raised through the sale of equity may dilute the ownership percentage of ourexisting stockholders. Capital raised through debt financing would require us to make periodic interestpayments and may impose potentially restrictive covenants on the conduct of our business. Furthermore,additional financings may not be available on terms favorable to us, or at all. A failure to obtain additionalfunding could prevent us from making expenditures that may be required to grow or maintain ouroperations.
Risks Relating Ownership of Our Common Stock
The price of our common stock may be volatile.
Prior to October 13, 2006, there was no public trading market for our common stock. The tradingmarket for our common stock is therefore immature, and the trading price of our common stock may

33
fluctuate substantially. These fluctuations could cause investors to lose part or all of the value of anyinvestment in shares of our common stock.
The following factors, most of which are outside of our control, could cause the market price of ourcommon stock to decrease significantly:
• loss of any of our major customers;
• departure of key personnel;
• variations in our quarterly operating results;
• announcements by our competitors of significant contracts, new products or product enhancements,acquisitions, distribution partnerships, joint ventures or capital commitments;
• changes in governmental regulations and standards affecting our business and our products,including implementation of additional regulations relating to IP network communications;
• decreases in financial estimates or recommendations by equity research analysts;
• sales of common stock or other securities by us in the future;
• decreases in market valuations of communications equipment companies; and
• fluctuations in stock market prices and volumes.
In the past, securities class action litigation often has been initiated against a company following aperiod of volatility in the market price of the company’s securities. If class action litigation is initiatedagainst us, we will incur substantial costs and our management’s attention will be diverted from ouroperations. All of these factors could cause the market price of our stock to decline, and investors may losesome or all of the value of their investment.
If equity research analysts do not publish research or reports about our business or if they issue unfavorablecommentary or downgrade our common stock, the price of our common stock could decline.
The trading market for our common stock will rely in part on the research and reports that equityresearch analysts publish about us and our business. We do not control these analysts. The price of ourstock could decline if one or more equity research analysts downgrade our stock or if those analysts issueother unfavorable commentary or cease publishing reports about us or our business.
Future sales of our common stock by existing stockholders could cause our stock price to decline.
If our existing stockholders sell substantial amounts of our common stock in the public market, themarket price of our common stock could decrease significantly. The perception in the public market thatour stockholders might sell shares of common stock could also depress the market price of our commonstock. Substantially all of our stockholders prior to the initial public offering are subject to lock-upagreements with the underwriters that restrict their ability to transfer their stock until at least April 2007.Upon expiration of the lock-up agreements, an additional 45,370,278 shares of our common stock will beeligible for sale in the public market. The market price of shares of our common stock may decreasesignificantly when the restrictions on resale by our existing stockholders lapse and our stockholders areable to sell shares of our common stock into the market. A decline in the price of shares of our commonstock might impede our ability to raise capital through the issuance of additional shares of our commonstock or other equity securities, and may cause you to lose part or all of your investment in our shares ofcommon stock.
In addition, the holders of an aggregate of 26,961,039 shares of our common stock as of December 31,2006 have rights, subject to some conditions, to require us to file registration statements covering their
34
shares or to include their shares in registration statements that we may file for ourselves or otherstockholders. We also have registered the issuance of all shares of common stock that we have issued andmay issue under our employee option and purchase plans. Having registered the issuance of these shares,they can be freely sold in the public market upon issuance, subject to lock-up agreements.
Due to these factors, sales of a substantial number of shares of our common stock in the public marketcould occur at any time. These sales, or the perception in the market that the holders of a large number ofshares intend to sell shares, could reduce the market price of our common stock.
Insiders continue to have substantial control over Acme Packet and could delay or prevent a change in corporatecontrol.
Our directors, executive officers and principal stockholders, together with their affiliates, beneficiallyown, in the aggregate, approximately 62% of our outstanding shares of common stock based on thenumber of shares outstanding as of December 31, 2006. As a result, these stockholders, if acting together,may have the ability to determine the outcome of matters submitted to our stockholders for approval,including the election of directors and any merger, amalgamation, consolidation or sale of all orsubstantially all of our assets. In addition, these persons, acting together, may have the ability to control themanagement and affairs of our company. Accordingly, even though such transactions may be in the bestinterests of other stockholders, this concentration of ownership may harm the market price of our commonstock by:
• delaying, deferring or preventing a change in control of our company;
• impeding a merger, amalgamation, consolidation, takeover or other business combination involvingour company; or
• discouraging a potential acquirer from making a tender offer or otherwise attempting to obtaincontrol of our company.
Our corporate documents and Delaware law will make a takeover of our company more difficult, which may limitthe market price of our common stock.
Our restated charter and bylaws and Section 203 of the Delaware General Corporation Law willcontain provisions that might enable our management to resist a takeover of our company. Theseprovisions might discourage, delay or prevent a change in the control of our company or a change in ourmanagement. These provisions could also discourage proxy contests and make it more difficult for you andother stockholders to elect directors and take other corporate actions. The existence of these provisionscould limit the price that investors might be willing to pay in the future for shares of our common stock.Some provisions in our restated charter and bylaws may deter third parties from acquiring us, which maylimit the market price of our common stock and may not be in the best interests of our stockholders. Theseinclude:
• a classified board of directors;
• the ability of the board of directors to issue undesignated shares without stockholder approval,which could be used to institute a “poison pill” that would work to dilute the share ownership of apotential hostile acquirer, effectively preventing acquisitions that have not been approved by theboard;
• limitations on the removal of directors; and
• advance notice requirements for election to the board and for proposing matters that can be actedupon at stockholder meetings.

35
If our earlier involvement in and hyperlinking to four articles previously posted on our website, or any otherpublicity regarding our company or our initial public offering during the waiting period associated with theoffering were held to violate Section 5 of the Securities Act, we could be required to repurchase shares sold in theinitial public offering.
We participated in and hyperlinked to a June 7, 2006 NewTelephony.com article entitled “AcmePacket’s Ory on Preparing to Go Public” and an August 2006 TIA PulseOnline Member Spotlight aboutour company, and we hyperlinked to a June 5, 2006 NetworkingPipeline.com blog article entitled “A VoIPIPO That Actually Makes Sense,” and a June 6, 2006 Datamonitor.com article entitled “SBC VendorAcme Seeks $85m in IPO.”
These articles included information regarding our initial public offering and our company. TheNewTelephony.com article included quotes from Andrew D. Ory, our President and Chief ExecutiveOfficer, regarding the initial public offering and our reasons for conducting the offering and the TIAPulseOnline member spotlight included quotes from Mr. Ory regarding the development of our companyand our business strategy. Neither the NetworkingPipeline.com blog entry nor the Datamonitor.comarticle included any quotes from us or our employees, but both provided information and commentary onour financial information. While these articles included some of the factual statements about us disclosedin our prospectus, they presented these statements in isolation, did not disclose many of the related risksand uncertainties described in the prospectus or this Annual Report and provided commentary expressingthe authors’ opinions of our company and the initial public offering. Notwithstanding our earlierhyperlinking to the articles, the commentary expressed therein reflected the opinions of the authors andshould not be attributed to us.
It is uncertain whether our involvement or our participation in publicity related activities could beheld to violate Section 5 of the Securities Act. If so, we could be required to repurchase the shares sold topurchasers in this offering at the original $9.50 purchase price, plus interest, for a period of one yearfollowing the date of the violation. We would contest vigorously any claim that such a violation of theSecurities Act had occurred.
Item 1B. Unresolved Staff Comments
Not applicable.
Item 2. Properties
We lease approximately 72,000 square feet of office space in Burlington, Massachusetts pursuant toleases that expire in June 2010. We also maintain sales offices in Madrid, Spain and Tokyo, Japan. Webelieve that our current facilities are suitable and adequate to meet our current needs. We intend to addnew facilities or expand existing facilities as we add employees, and we believe that suitable additional orsubstitute space will be available as needed to accommodate any such expansion of our operations.
Item 3. Legal Proceedings
We are not currently a party to any material litigation, and we are not aware of any pending orthreatened litigation against us that could have a material adverse effect on our business, operating resultsor financial condition. The software and communications infrastructure industries are characterized byfrequent claims and litigation, including claims regarding patent and other intellectual property rights aswell as improper hiring practices. As a result, we may be involved in various legal proceedings from time totime.
Item 4. Submission of Matters to a Vote of Security Holders
None.

36
PART II
Item 5. Market for Registrant’s Common Equity, Related Stockholder Matters and Issuer Purchasesof Equity Securities.
Market Information for Common Stock
Our common stock has been quoted on the Nasdaq Global Market under the symbol “APKT” sinceour initial public offering on October 13, 2006. Prior to that time, there was no public market for ourcommon stock.
The following table sets forth for the indicated periods the high and low sales prices of our commonstock as reported by the Nasdaq Global Market.
High LowFourth Quarter 2006 (from October 13, 2006) . . . . . . . . . . . . . . . . . . . . . . . . . . . . . . . . . . . . $21.97 $13.00First Quarter 2007 (through March 13, 2007) . . . . . . . . . . . . . . . . . . . . . . . . . . . . . . . . . . . . $21.43 $14.73
The last reported sale price for our common stock on the Nasdaq Global Market was $14.79 per shareon March 13, 2007.
Dividend Policy
We have never paid or declared any cash dividends on our common stock. We currently intend toretain earnings, if any, to finance the growth and development of our business, and we do not expect to payany cash dividends on our common stock in the foreseeable future. Payment of future dividends, if any, willbe at the discretion of the board of directors and will depend on our financial condition, results ofoperations, capital requirements, restrictions contained in current or future financing instruments, andother factors the board deems relevant.
Stockholders
As of February 28, 2007, there were 196 registered stockholders of record of our common stock.
Stock Performance Graph
The graph set forth below compares the cumulative total stockholder return on our common stockbetween October 13, 2006 (the date of our initial public offering) and December 29, 2006, with thecumulative total return of (i) the Nasdaq Telecommunications Index and (ii) the Nasdaq Composite Index,over the same period. This graph assumes the investment of $100,000 on October 13, 2006 in our commonstock, the Nasdaq Telecommunications Index and the Nasdaq Composite Index, and assumes thereinvestment of dividends, if any. The graph assumes our closing sales price on October 13, 2006 of $15.91per share as the initial value of our common stock.
The comparisons shown in the graph below are based upon historical data. We caution that the stockprice performance shown in the graph below is not necessarily indicative of, nor is it intended to forecast,the potential future performance of our common stock. Information used in the graph was obtained fromFactSet Research Systems, Inc., a financial data provider and a source believed to be reliable. We are notresponsible for any errors or omissions in such information.

37
Prior to October 13, 2006 there was no public market for our securities. As such, data for the periodpreceding October 13, 2006 is not presented on the graph below.
90.0
100.0
110.0
120.0
130.0
10/13/06
DO
LL
AR
S
10/31/06 11/30/06 12/29/06
Nasdaq Composite Index
Nasdaq Telecommunications Index
Acme Packet
10/13/2006 10/31/2006 11/30/2006 12/29/2006Acme Packet . . . . . . . . . . . . . . . . . . . . . . . . . . . . . . . . . . . . . . . . 100.0 108.1 109.6 129.7Nasdaq Composite Index . . . . . . . . . . . . . . . . . . . . . . . . . . . . . 100.0 100.4 103.2 102.5Nasdaq Telecommunications Index . . . . . . . . . . . . . . . . . . . . 100.0 97.9 105.2 106.5
Equity Compensation Information
For information regarding our equity compensation plans, see Note 6 of the notes to our consolidatedfinancial statements included in this Annual Report.
Recent Sales of Unregistered Securities
(a) Sales of Unregistered Securities
During the year ended December 31, 2006, we granted stock options to purchase an aggregate of2,263,000 shares of common stock to our employees and directors under our 2000 and 2006 EquityIncentive Plans at exercise prices ranging from $1.10 to $18.36 per share. The options granted are typicallyexercisable over a four year period and 50% of the unvested options will vest upon certain circumstancesfollowing a change in control of the Company. During this period, we issued an aggregate of 801,276shares of common stock to employees pursuant to the exercise of stock options for cash consideration withaggregate exercise proceeds of approximately $213,000. The foregoing stock and option issuances wereexempt from registration under the Securities Act of 1933, either pursuant to Rule 701 under theSecurities Act, as transactions pursuant to a compensatory benefit plan, or pursuant to Section 4(2) underthe Securities Act, as a transaction by an issuer not involving a public offering.

38
(b) Use of Proceeds from Public Offering of Common Stock
In October 2006, we completed an initial public offering (“IPO”) of our common stock pursuant to aregistration statement on Form S-1 (Registration No. 333-134683) which the SEC declared effective onOctober 12, 2006. In connection with the IPO, we sold and issued 9.7 million shares of our common stock,including 1.7 million shares sold by us pursuant to the underwriters’ full exercise of their over-allotmentoption, and another additional 3.5 million shares of our common stock were sold by our sellingstockholders. The offering did not terminate until after the sale of all of the shares registered on theregistration statement. All of the shares of common stock registered pursuant to the registration statement,including the shares sold by the selling shareholders, were sold at a price to the public of $9.50 per share.The managing underwriters were Goldman, Sachs & Co., JPMorgan, Credit Suisse and Think EquityPartners LLC.
We raised a total of $92.4 million in gross proceeds from the IPO, or approximately $83.2 million innet proceeds after deducting underwriting discounts and commissions of $6.5 million and other estimatedoffering costs of approximately $2.7 million. No payments for such expenses were made directly orindirectly to (i) any of our officers or directors or their associates, (ii) any persons owning 10% or more ofany class of our equity securities, or (iii) any of our affiliates. We did not receive any proceeds from thesale of shares in the IPO by the selling stockholders. None of our net proceeds from the IPO have beenutilized to support business operations. Pending such application, we have invested the remaining netproceeds in money-market mutual funds. None of the remaining net proceeds were paid, directly orindirectly, to directors, officers, persons owning ten percent or more of our equity securities, or any of ourother affiliates. There has been no material change in the planned use of proceeds from our IPO from thatdescribed in the final prospectus filed with the SEC pursuant to Rule 424(b).
(c) Purchases of Equity Securities by the Issuer and Affiliated Purchasers
None.

39
Item 6. Selected Consolidated Financial Data
You should read the following selected consolidated financial data in conjunction with“Management’s Discussion and Analysis of Financial Condition and Results of Operations,” the financialstatements and related notes, and the other financial information included in this Annual Report.
We derived the consolidated financial data for the years ended December 31, 2004, 2005 and 2006 andas of December 31, 2005 and 2006 from our consolidated financial statements, which have been audited byErnst & Young LLP, and are included elsewhere in this Annual Report. We derived the consolidatedfinancial data for the years ended December 31, 2002 and 2003 and as of December 31, 2002, 2003, and2004 from audited financial statements which are not included in this Annual Report. Historical results arenot necessarily indicative of the results to be expected in future periods.
Year Ended December 31,2006 2005 2004 2003 2002
(in thousands, except share and per share data)Statement of Operations Data:Revenue:
Product. . . . . . . . . . . . . . . . . . . $ 71,810 $ 31,080 $ 14,641 $ 3,038 $ —Maintenance, support and
service . . . . . . . . . . . . . . . . . 12,260 5,040 1,352 298 —Total revenue . . . . . . . . . . . 84,070 36,120 15,993 3,336 —
Cost of revenue:Product. . . . . . . . . . . . . . . . . . . 14,624 8,026 5,212 918 —Maintenance, support and
service . . . . . . . . . . . . . . . . . 2,951 1,201 583 177 —Total cost of revenue. . . . . 17,575 9,227 5,795 1,095 —
Gross profit . . . . . . . . . . . . . . . . . 66,495 26,893 10,198 2,241 —Operating expenses:
Sales and marketing. . . . . . . . 23,759 14,969 8,558 3,480 2,373Research and development . 12,988 8,705 5,552 4,117 3,517General and administrative . 6,566 3,602 2,341 2,141 1,959Lease abandonment. . . . . . . . — — 848 — —
Total operating expenses . 43,313 27,276 17,299 9,738 7,849Income (loss) from operations . 23,182 (383) (7,101) (7,497) (7,849)Total other income, net. . . . . . . 2,239 348 144 33 17Income (loss) before benefit
from income taxes . . . . . . . . . 25,421 (35) (6,957) (7,464) (7,832)Benefit from income taxes . . . . (3,443) — — — —Net income (loss) . . . . . . . . . . . . $ 28,864 $ (35) $ (6,957) $ (7,464) $ (7,832)Net income (loss) per share
applicable to commonstockholders:Basic(1) . . . . . . . . . . . . . . . . . . $ 0.57 $ 0.00 $ (0.47) $ (0.52) $ (0.55)Diluted(1) . . . . . . . . . . . . . . . . $ 0.50 $ 0.00 $ (0.47) $ (0.52) $ (0.55)
Weighted average number ofcommon shares used in netincome (loss) per sharecalculation:Basic(1) . . . . . . . . . . . . . . . . . . 50,437,801 15,240,890 14,732,597 14,380,027 14,121,414Diluted(1) . . . . . . . . . . . . . . . . 57,418,796 15,240,890 14,732,597 14,380,027 14,121,414
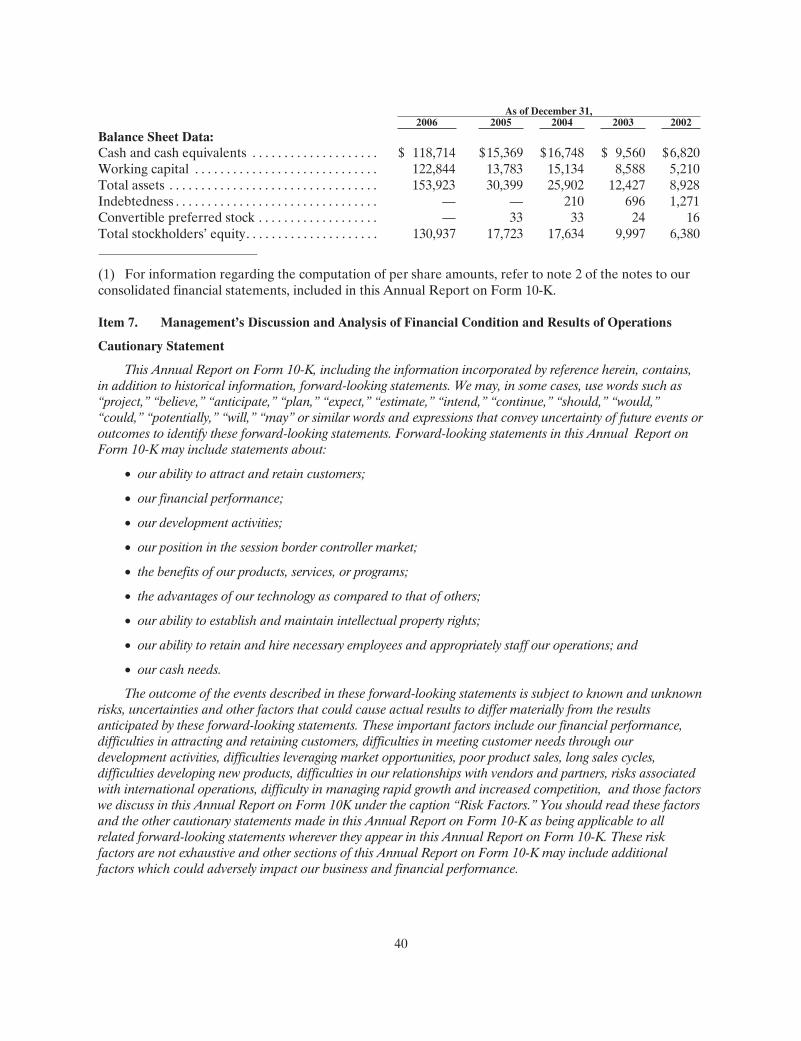
40
As of December 31,2006 2005 2004 2003 2002
Balance Sheet Data:Cash and cash equivalents . . . . . . . . . . . . . . . . . . . . $ 118,714 $15,369 $16,748 $ 9,560 $6,820Working capital . . . . . . . . . . . . . . . . . . . . . . . . . . . . . 122,844 13,783 15,134 8,588 5,210Total assets . . . . . . . . . . . . . . . . . . . . . . . . . . . . . . . . . 153,923 30,399 25,902 12,427 8,928Indebtedness . . . . . . . . . . . . . . . . . . . . . . . . . . . . . . . . — — 210 696 1,271Convertible preferred stock . . . . . . . . . . . . . . . . . . . — 33 33 24 16Total stockholders’ equity. . . . . . . . . . . . . . . . . . . . . 130,937 17,723 17,634 9,997 6,380
(1) For information regarding the computation of per share amounts, refer to note 2 of the notes to ourconsolidated financial statements, included in this Annual Report on Form 10-K.
Item 7. Management’s Discussion and Analysis of Financial Condition and Results of Operations
Cautionary Statement
This Annual Report on Form 10-K, including the information incorporated by reference herein, contains,in addition to historical information, forward-looking statements. We may, in some cases, use words such as“project,” “believe,” “anticipate,” “plan,” “expect,” “estimate,” “intend,” “continue,” “should,” “would,”“could,” “potentially,” “will,” “may” or similar words and expressions that convey uncertainty of future events oroutcomes to identify these forward-looking statements. Forward-looking statements in this Annual Report onForm 10-K may include statements about:
• our ability to attract and retain customers;
• our financial performance;
• our development activities;
• our position in the session border controller market;
• the benefits of our products, services, or programs;
• the advantages of our technology as compared to that of others;
• our ability to establish and maintain intellectual property rights;
• our ability to retain and hire necessary employees and appropriately staff our operations; and
• our cash needs.
The outcome of the events described in these forward-looking statements is subject to known and unknownrisks, uncertainties and other factors that could cause actual results to differ materially from the resultsanticipated by these forward-looking statements. These important factors include our financial performance,difficulties in attracting and retaining customers, difficulties in meeting customer needs through ourdevelopment activities, difficulties leveraging market opportunities, poor product sales, long sales cycles,difficulties developing new products, difficulties in our relationships with vendors and partners, risks associatedwith international operations, difficulty in managing rapid growth and increased competition, and those factorswe discuss in this Annual Report on Form 10K under the caption “Risk Factors.” You should read these factorsand the other cautionary statements made in this Annual Report on Form 10-K as being applicable to allrelated forward-looking statements wherever they appear in this Annual Report on Form 10-K. These riskfactors are not exhaustive and other sections of this Annual Report on Form 10-K may include additionalfactors which could adversely impact our business and financial performance.

41
Overview
Acme Packet, Inc. is the leading provider of session border controllers, or SBCs, that enable serviceproviders to deliver secure and high quality interactive communications—voice, video and other real-timemultimedia sessions—across IP network borders. As of December 31, 2006, over 360 service providers in75 countries have deployed our products. We sell our products and support services through our directsales force and approximately 30 distribution partners, including many of the largest networking andtelecommunications equipment vendors throughout the world.
Our headquarters are located in Burlington, Massachusetts. We maintain sales offices in Burlington,Massachusetts; Madrid, Spain and Tokyo, Japan. We also have sales personnel in Australia, Belgium,Brazil, Canada, China, France, Germany, Hong Kong, Israel, Italy, Korea, Malaysia, Mexico, Peru, Russiaand the United Kingdom and throughout the United States. We expect to continue to add personnel in theUnited States and internationally to provide additional geographic sales and technical support coverage.
In October 2006, we completed an initial public offering (“IPO”) of our common stock in which wesold and issued 9.7 million shares of our common stock, including 1.7 million shares sold by us pursuant tothe underwriters’ full exercise of their over-allotment option, at an issue price of $9.50 per share. We raiseda total of $92.4 million in gross proceeds from the IPO, or $83.2 million in net proceeds after deductingunderwriting discounts and commissions of $6.5 million and other offering costs of $2.7 million. Upon theclosing of the IPO, all shares of convertible preferred stock outstanding automatically converted into32.2 million shares of common stock.
Our fiscal year ends on December 31. Reference to 2006, for example, refers to the fiscal year endedDecember 31, 2006.
Revenue
We derive product revenue from the sale of our Net-Net hardware and the licensing of our Net-Netsoftware. We generally recognize product revenue at the time of product delivery, provided all otherrevenue recognition criteria have been met, pursuant to the requirements of Statement of Position, orSOP, 97-2, Software Revenue Recognition, as amended by SOP 98-9, Software Revenue Recognition withRespect to Certain Transactions. For arrangements that include customer acceptance or other material non-standard terms, we defer revenue recognition until after delivery, and all other criteria for revenuerecognition have been met.
We generate maintenance, support and service revenue from (a) maintenance associated withsoftware licenses, (b) technical support services for our product software, (c) hardware repair andmaintenance services, (d) implementation, training and consulting services, and (e) reimbursable traveland other out-of-pocket expenses paid to us by our customers.
We offer our products and services indirectly through distribution partners and directly through oursales force. Our distribution partners include networking and telecommunications equipment vendorsthroughout the world. Our distribution partners generally purchase our products after they have received apurchase order from their customers and do not maintain an inventory of our products in anticipation ofsales to their customers. Generally, the pricing offered to our distribution partners will be lower than toour direct customers.
The product configuration, which reflects the mix of session capacity and requested features,determines the price for each SBC sold. Customers can purchase our SBCs in either a standalone or highavailability configuration and can license our software in various configurations, depending on thecustomers’ requirements for session capacity, feature groups and protocols. The product softwareconfiguration mix will have a direct impact on the average selling price of the system sold. As the market

42
continues to develop and grow, we expect to experience increased price pressure on our products andservices.
We believe that our revenue and results of operations may vary significantly from quarter to quarteras a result of long sales and deployment cycles, variations in customer ordering patterns, and theapplication of complex revenue recognition rules to certain transactions. Some of our arrangements withcustomers include clauses under which we may be subject to penalties for failure to meet specifiedperformance obligations. We have not incurred any such penalties to date.
Cost of Revenue
Cost of product revenue primarily consists of payments to third party manufacturers for purchasedmaterials and services, salaries and benefits related to personnel, provision for inventory obsolescence, andrelated overhead.
Cost of maintenance, support and service revenue consists primarily of (a) salaries and benefitsrelated to professional services and technical support personnel, (b) billable and non-billable travel,lodging, and other out-of-pocket expenses, (c) related overhead, and (d) contract manufacturer services forrepairs and warranty services.
Gross Profit
Our gross profit has been, and will be, affected by many factors, including (a) the demand for ourproducts and services, (b) the average selling price of our products, which in turn depends in part on themix of product configurations sold, (c) new product introductions, (d) the mix of sales channels throughwhich our products are sold, and (e) the volume and costs of manufacturing of our hardware products.
Operating Expenses
Operating expenses consist of sales and marketing, research and development, and general andadministrative expenses. Personnel-related costs are the most significant component of each of theseexpense categories. We grew from 104 employees and full-time independent contractors at December 31,2004 to 252 employees and full-time independent contractors at December 31, 2006. We expect tocontinue to hire significant numbers of new employees to support our growth.
Sales and marketing expense consists primarily of (a) salaries and related personnel costs includingstock-based compensation, (b) commissions, (c) travel, lodging and other out-of-pocket expenses,(d) marketing programs such as trade shows, and (e) other related overhead. Commissions are recorded asexpense when earned by the employee. We expect absolute dollar increases in sales and marketing expensefor the foreseeable future as we further increase the number of sales professionals and, to a lesser extent,increase our marketing activities with the intent to grow our revenue. We expect sales and marketingexpense to increase as a percentage of total revenue for the foreseeable future.
Research and development expense consists primarily of (a) salaries and related personnel costsincluding stock-based compensation, (b) payments to suppliers for design and consulting services,(c) prototype and equipment costs relating to the design and development of new products andenhancement of existing products, (d) quality assurance and testing, and (e) other related overhead. Todate, all of our research and development expense has been expensed as incurred. We intend to continueto invest significantly in our research and development efforts, which we believe are essential tomaintaining our competitive position. We expect research and development expense to increase inabsolute dollars and to increase as a percentage of total revenue for the foreseeable future. We anticipatethat research and development expense will increase as a percentage of total revenue in the long term.
43
General and administrative expense consists primarily of (a) salaries and personnel costs related toour executive, finance, human resource and information technology organizations, including stock-basedcompensation (b) facilities expenses, (c) accounting and legal professional fees, and (d) other relatedoverhead. We expect general and administrative expense to continue to increase in absolute dollars and asa percentage of total revenue for the foreseeable future as we invest in infrastructure to support continuedgrowth and incur additional expenses related to being a publicly traded company, including increased auditand legal fees, costs of compliance with securities and other regulations, investor relations expense, andhigher insurance premiums.
Stock-Based Compensation
Through December 31, 2005, cost of revenue and operating expenses include stock-basedcompensation expense to the extent the fair value of our common stock exceeded the exercise price ofstock options granted to employees on the date of grant. Effective in the first quarter of fiscal 2006, weadopted the requirements of Statement of Financial Accounting Standards, or SFAS, No. 123(R), ShareBased Payment. SFAS No. 123(R) addresses all forms of shared-based payment awards, including sharesissued under employee stock purchase plans, stock options, restricted stock and stock appreciation rights.SFAS No. 123(R) requires us to expense share-based payment awards with compensation cost for share-based payment transactions measured at fair value. We continue to evaluate the effect that the adoption ofSFAS No. 123(R) will have on our financial position and results of operations. We currently expect thatour adoption of SFAS No. 123(R) will adversely affect our operating results to some extent in futureperiods. For the year ended December 31, 2006, we recorded expense of $867,000 in connection withshare-based payment awards. Based on options granted in 2006, a future expense of non-vested options of$6.9 million is expected to be recognized over a weighted-average period of 3.45 years. The adoption ofSFAS No. 123(R) will have no effect on our financial position or cash flow for any period.
Other Income (Expense), Net
Other income (expense) primarily consists of interest income earned on cash balances. We historicallyhave invested our cash in money market funds. Other income (expense) also includes interest expense onour debt facilities and gains (losses) from foreign currency translation adjustments of our foreignsubsidiaries. The functional currency of our foreign operations in Europe and Asia is the U.S. dollar.Accordingly, all assets and liabilities of these foreign subsidiaries are remeasured into U.S. dollars usingthe exchange rates in effect at the balance sheet date. Revenue and expenses of these foreign subsidiariesare remeasured into U.S. dollars at the average rates in effect during the year. Any differences resultingfrom the remeasurement of assets, liabilities and operations of the European and Asian subsidiaries arerecorded within other income (expense).
Application of Critical Accounting Policies and Use of Estimates
Our financial statements are prepared in accordance with accounting principles generally accepted inthe United States. The preparation of these financial statements requires that we make estimates andassumptions that affect the reported amounts of assets and liabilities and disclosure of contingent assetsand liabilities at the date of the financial statements and the reported amounts of revenue and expensesduring the reporting period. We base our estimates on historical experience and on various otherassumptions that we believe to be reasonable under the circumstances. We evaluate our estimates andassumptions on an ongoing basis. Our actual results may differ significantly from these estimates underdifferent assumptions or conditions. There have been no material changes to these estimates for theperiods presented in this Annual Report.
We believe that of our significant accounting policies, which are described in note 2 of the notes to ourconsolidated financial statements included in this Annual Report on Form 10-K, the following accounting

44
policies involve a greater degree of judgment and complexity. Accordingly, these are the policies webelieve are the most critical to aid in fully understanding and evaluating our financial condition and resultsof operations.
Revenue Recognition
We recognize revenue in accordance with SOP 97-2, as amended by SOP 98-9, and Emerging IssuesTask Force, or EITF, Issue No. 03-5, Applicability of AICPA Statement of Position 97-2 to NonsoftwareDeliverables in an Arrangement Containing More-Than-Incidental Software. We have determined that thesoftware element of our product is “more than incidental” to the products as a whole. As a result, inaccordance with EITF Issue No. 03-5, we are required to recognize revenue under SOP 97-2 andSOP 98-9.
In all of our arrangements, we do not recognize any revenue until we can determine that persuasiveevidence of an arrangement exists, delivery has occurred, the fee is fixed or determinable, and we deemcollection to be probable. In making these judgments, we evaluate these criteria as follows:
• Evidence of an arrangement. We consider a non-cancelable agreement signed by the customer andus to be representative of pervasive evidence of an arrangement.
• Delivery has occurred. We consider delivery to have occurred when product has been delivered tothe customer and no post-delivery obligations exist. In instances where customer acceptance isrequired, delivery is deemed to have occurred when customer acceptance has been achieved.
• Fees are fixed or determinable. We consider the fee to be fixed or determinable unless the fee issubject to refund or adjustment or is not payable within normal payment terms. If the fee is subjectto refund or adjustment, we recognize revenue when the right to a refund or adjustment lapses. Ifoffered payment terms exceed our normal terms, we recognize revenue as the amounts become dueand payable or upon the receipt of cash.
• Collection is deemed probable. We conduct a credit review for all transactions at the inception of anarrangement to determine the creditworthiness of the customer. Collection is deemed probable if,based upon our evaluation, we expect that the customer will be able to pay amounts under thearrangement as payments become due. If we determine that collection is not probable, revenue isdeferred and recognized upon the receipt of cash.
A substantial percentage of our revenue is generated by multiple-element arrangements, such asproducts, maintenance, professional services and training. When arrangements include multiple elements,we allocate the total fee among the various elements using the residual method. Under the residualmethod, revenue is recognized when vendor-specific objective evidence, or VSOE, of fair value exists forall of the undelivered elements of the arrangement, but does not exist for one or more of the deliveredelements of the arrangement. Each arrangement requires us to analyze the individual elements in thetransaction and to estimate the fair value of each undelivered element, which typically includesmaintenance and services. Revenue is allocated to each of the undelivered elements based on its respectivefair value, with the fair value determined by the price charged when that element is sold separately.
Maintenance and support services include telephone support, return and repair services, andunspecified rights to product upgrades and enhancements, and are recognized ratably over the term of theservice period, which is generally 12 months. Maintenance and support revenue generally is deferred untilthe related product has been accepted and all other revenue recognition criteria have been met.Professional services and training revenue is recognized as the related service is performed.
Our products and services are distributed indirectly through distribution partners and directly throughour sales force. Revenue arrangements with distribution partners are recognized when the above criteria

45
are met and only when we receive evidence that the distribution partner has an order from an end-usercustomer. We typically do not offer contractual rights of return, stock balancing or price protection to ourdistribution partners, and actual product returns from them have been insignificant to date. As a result, wedo not maintain reserves for product returns and related allowances.
Allowance for Doubtful Accounts
We offset gross trade accounts receivable with an allowance for doubtful accounts. The allowance fordoubtful accounts is our best estimate of the amount of probable credit losses in our existing accountsreceivable. We review our allowance for doubtful accounts on a regular basis, and all past due balances arereviewed individually for collectibility. Account balances are charged against the allowance after all meansof collection have been exhausted and the potential for recovery is considered remote. Provisions forallowance for doubtful accounts are recorded in general and administrative expense. If our historicalcollection experience does not reflect our future ability to collect outstanding accounts receivables, ourfuture provision for doubtful accounts could be materially affected. To date, we have not incurred anysignificant write-offs of accounts receivable and have not been required to revise any of our assumptions orestimates used in determining our allowance for doubtful accounts. As of December 31, 2006, theallowance for doubtful accounts was $695,000.
Stock-Based Compensation
Through December 31, 2005, we accounted for our stock-based awards to employees using theintrinsic value method prescribed in Accounting Principles Board, or APB, Opinion No. 25, Accountingfor Stock Issued to Employees, and related interpretations. Under the intrinsic value method, compensationexpense is measured on the date of the grant as the difference between the deemed fair value of ourcommon stock and the exercise or purchase price multiplied by the number of stock options or restrictedstock awards granted. Generally, we granted stock-based compensation awards with exercise prices equalto the estimated fair value of our common stock; however, to the extent that the deemed fair value of thecommon stock exceeds the exercise or purchase price of stock-based awards granted to employees on thedate of grant, the Company amortizes the expense over the vesting schedule of the awards, generally fouryears. The fair value of our common stock for periods through December 31, 2005 was determined by ourboard of directors (“the Board”).
Through December 31, 2005, we accounted for stock-based compensation expense for non-employeesusing the fair value method prescribed by SFAS No. 123, Accounting for Stock-Based Compensation,and the Black-Scholes option-pricing model, and recorded the fair value, for financial reporting purposes,of non-employee stock options as an expense over either the vesting term of the option or theservice period.
In December 2004, the Financial Accounting Standards Board, or FASB, issued SFAS No. 123(R),which requires companies to expense the fair value of employee stock options and other forms of stock-based compensation. We adopted SFAS No. 123(R) effective January 1, 2006. SFAS No. 123(R) requiresnonpublic companies that used the minimum value method in SFAS No. 123 for either recognition orpro forma disclosures to apply SFAS No. 123(R) using the prospective-transition method. As such, we willcontinue to apply APB Opinion No. 25 in future periods to equity awards outstanding at the date ofSFAS No. 123(R)’s adoption that were measured using the minimum value method. In accordance withSFAS No. 123(R), we will recognize the compensation cost of stock-based awards on a straight-line basisover the vesting period of the award. Effective with the adoption of SFAS No. 123(R), we have elected touse the Black-Scholes option pricing model to determine the weighted-average fair value of stock optionsgranted.

46
As there was no public market for our common stock prior to October 13, 2006, we have determinedthe volatility for options granted in 2006 based on an analysis of reported data for a peer group ofcompanies that issued options with substantially similar terms. The expected volatility of options grantedhas been determined using an average of the historical volatility measures of this peer group of companies.The expected volatility for options granted during 2006 was 81.44%. The expected life of options has beendetermined utilizing the “simplified” method as prescribed by the Securities and Exchange Commission’sStaff Accounting Bulletin No. 107, Share-Based Payment. During 2006, the weighted-average risk freeinterest rate used was 4.79%. The risk-free interest rate is based on a treasury instrument whose term isconsistent with the expected life of the stock options. We have not paid and do not anticipate paying cashdividends on our common stock; therefore, the expected dividend yield is assumed to be zero. In addition,SFAS No. 123(R) requires companies to utilize an estimated forfeiture rate when calculating the expensefor the period, whereas, SFAS No. 123 permitted companies to record forfeitures based on actualforfeitures, which was our historical policy under SFAS No. 123. As a result, we applied an estimatedforfeiture rate of 11.25% in 2006 in determining the expense recorded in the accompanying consolidatedstatement of operations.
Prior to our IPO there was no public market for our common stock, and, in connection with ourissuance of stock options and restricted stock awards, the Board, with input from management, determinedthe fair value of our common stock. The Board exercised judgment in determining the estimated fair valueof our common stock on the date of grant based on several factors, including the liquidation preferences,dividend rights and voting control attributable to our then-outstanding convertible preferred stock and,primarily, the likelihood of achieving a liquidity event such as an initial public offering or sale of ourcompany. In the absence of a public trading market for our common stock, the Board considered objectiveand subjective factors in determining the fair value of our common stock. In addition, in certain instances,the Board engaged an unrelated third-party valuation specialist to assist management in preparingvaluation reports for stock options and restricted stock awards granted by the Board. Based upon ourinternal peer company analyses and based on several arm’s-length transactions involving our commonstock supportive of the results produced by this valuation methodology, we believe the methodology usedwas reasonable.
In connection with the preparation for the IPO of our common stock, we reassessed the valuations ofour common stock during 2005 and 2006, in light of the AICPA’s Practice Aid, Valuation of Privately-Held-Company Equity Securities Issued as Compensation. As a result, we reassessed the fair value of our commonstock as of December 14, 2005, December 23, 2005, February 7, 2006 and March 15, 2006.
Based on these reassessments, we are required to recognize compensation expense of $821,000 toreflect the difference between the reassessed fair value of the our common stock and the grant price forthe stock-based awards granted on December 14, 2005 and December 23, 2005 and an amount equal to thedifference between the value calculated using the Black-Scholes option pricing model with the initialassessment of fair value of common stock and the value calculated using the Black-Scholes option pricingmodel with the reassessed fair value of common stock for the stock-based awards granted on February 7,2006 and March 22, 2006. The compensation expense is being recognized over the vesting schedule of theawards. As a result of these reassessments, we recognized compensation expense of approximately$202,000 during the year ended December 31, 2006 to reflect the difference between the reassessed fairvalue of our stock and the grant price for the stock-based awards granted. The compensation expense willcontinue to be recognized over the vesting schedule of the awards.
Including stock-based compensation expense related to the reassessment of the fair value of ourcommon stock, for the year ended December 31, 2006, we recorded stock-based compensation expense of$867,000 in connection with stock-based payment awards, respectively. As of December 31 2006, there was$6.9 million of unrecognized compensation expense related to non-vested stock option awards that isexpected to be recognized over a weighted-average period of 3.45 years.

47
Inventory
We recognize inventory losses based on obsolescence and levels in excess of forecasted demand. Inthese cases, inventory is written down to estimated realizable value based on historical usage and expecteddemand. Inherent in our estimates of market value in determining inventory valuation are estimatesrelated to economic trends, future demand for our products and technical obsolescence of our products. Iffuture demand or market conditions are less favorable than our projections, additional inventory write-downs could be required and would be reflected in the cost of revenue in the period the revision is made.To date, we have not been required to revise any of our assumptions or estimates used in determining ourinventory valuations.
When products have been delivered, but the product revenue associated with the arrangement hasbeen deferred as a result of not meeting the revenue recognition criteria required by SOP 97-2, we alsodefer the related inventory costs for the delivered items.
Product Warranties
Substantially all of our products are covered by a standard warranty of 90 days for software and oneyear for hardware. In the event of a failure of hardware or software covered by this warranty, we mustrepair or replace the hardware or software or, if those remedies are insufficient, provide a refund. Ourcustomers typically purchase maintenance and support contracts, which encompass our warrantyobligations. Our warranty reserve reflects estimated material and labor costs for potential or actualproduct issues in our installed base that are not covered under maintenance contracts but for which weexpect to incur an obligation. Our estimates of anticipated rates of warranty claims and costs are primarilybased on historical information and future forecasts. We periodically assess the adequacy of the warrantyallowance and adjust the amount as necessary. To date, we have not been required to revise any of ourassumptions or estimates used in determining our warranty allowance. If the historical data we use tocalculate the adequacy of the warranty allowance is not indicative of future requirements, additionalwarranty reserves may be required.
Some of our arrangements with customers include clauses whereby we may be subject to penalties forfailure to meet certain performance obligations. We have not incurred any such penalties to date.
Research and Development Expense for Software Products
Research and development expense includes costs incurred to develop intellectual property. The costsfor the development of new software and substantial enhancements to existing software are expensed asincurred until technological feasibility has been established, at which time any additional costs would becapitalized. We have determined that technological feasibility is established at the time a working model ofsoftware is completed. Because we believe our current process for developing software will be essentiallycompleted concurrently with the establishment of technological feasibility, no costs have been capitalizedto date.
Income Taxes
We are subject to income taxes in both the United States and foreign jurisdictions, and we useestimates in determining our provision for income taxes. We account for income taxes in accordance withSFAS No. 109, Accounting for Income Taxes, which is the asset and liability method for accounting andreporting for income taxes. Under SFAS No. 109, deferred tax assets and liabilities are recognized basedon temporary differences between the financial reporting and income tax bases of assets and liabilitiesusing statutory rates. This process requires us to project our current tax liability and estimate our deferredtax assets and liabilities, including net operating loss (NOL’s) and tax credit carryforwards. In assessing theneed for a valuation allowance, we considered our recent operating results, future taxable incomeprojections and feasible tax planning strategies. In the year ended December 31, 2005, due to uncertainty

48
surrounding the Company’s ability to utilize its remaining NOL and credit carryforwards and otherdeferred tax assets, we provided a full valuation allowance against our otherwise remaining recognizabledeferred tax assets. In the year ended December 31, 2006, we utilized a substantial portion of our NOLcarryforwards to reduce income taxes currently payable and determined that it was more likely than notthat we would realize all of our remaining deferred tax assets. Therefore, we reduced the valuationallowance of $4.8 million in December 2006 related to these deferred tax assets. The benefit of the releaseof the valuation allowance was realized through a reduction of income tax expense.
As of December 31, 2006, we had U.S. federal research and development tax credits of $979,000 thatexpire beginning in 2023 and state research and development tax credits of $868,000 that expire beginningin 2019, and are both subject to review and possible adjustment by the taxing authorities. The InternalRevenue Code contains provisions that limit the net operating losses and tax credit carryforwards availableto be used in any given year in the event of certain circumstances, including significant changes inownership interests, as defined.
Our current intention is to reinvest the total amount of our unremitted earnings in the localjurisdiction or to repatriate the earnings only when tax-effective. As such, we have not provided for U.S.taxes on the unremitted earnings of our foreign subsidiaries.
Results of Operations
Comparison of Years Ended December 31, 2006 and 2005
Revenue
Year Ended December 31,
2006 2005Period-to-Period
Change
Amount
Percentageof TotalRevenue Amount
Percentageof TotalRevenue Amount Percentage
(dollars in thousands)Revenue by Type:
Product revenue . . . . . . . . . . . . . . . $71,810 85% $31,080 86% $40,730 131%Maintenance, support and service
revenue . . . . . . . . . . . . . . . . . . . . 12,260 15 5,040 14 7,220 143Total revenue . . . . . . . . . . . . . . . . . . . $84,070 100% $36,120 100% $47,950 133%
Revenue by Geography:United States and Canada . . . . . . $47,965 57% $21,357 59% $26,608 125%International . . . . . . . . . . . . . . . . . . 36,105 43 14,763 41 21,342 145
Total revenue . . . . . . . . . . . . . . . . . . . $84,070 100% $36,120 100% $47,950 133%
Revenue by Sales Channel:Direct . . . . . . . . . . . . . . . . . . . . . . . . $43,670 52% $17,324 48% 26,346 152%Indirect. . . . . . . . . . . . . . . . . . . . . . . 40,400 48 18,796 52 21,604 115
Total revenue . . . . . . . . . . . . . . . . . . . $84,070 100% $36,120 100% $47,950 133%
The $40.7 million increase in product revenue was a result of an increase in the number of systemssold in 2006 which reflected the growth in the worldwide market for our products. This growth was realizedthrough both our United States and Canadian customers and international customers, as well as throughour direct and indirect sales channels. Direct product revenues increased $22.7 million, of which$19.8 million was attributable to United States and Canadian customers and $2.9 million was attributableto international customers. Indirect product revenues increased $18.0 million, of which $2.7 million wasattributable to United States and Canadian customers and $15.3 million was attributable to internationalcustomers.

49
An increase in the average selling price of our systems due to changes in our product softwareconfiguration mix also contributed to the increase in product revenue in 2006. The product configuration,which reflects the mix of session capacity and requested features, determines the price for each SBC sold.Customers can license our software in various configurations, depending on the customers’ requirementsfor session capacity, feature groups and protocols. The product software configuration mix will have adirect impact on the average selling price of the system sold. Systems with higher software content (highersession capacity and a larger number of feature groups) will generally have a higher average selling pricethan those systems sold with lower software content.
The $7.2 million increase in maintenance, support and service revenue was attributable primarily tothe $5.5 million increase in maintenance and support fees associated with the growth in our installedproduct base and a $1.7 million increase in installation and training revenue, including reimbursable travelexpenses.
Cost of Revenue and Gross Profit
Year Ended December 31,
2006 2005Period-to-Period
Change
Amount
Percentageof RelatedRevenue Amount
Percentageof RelatedRevenue Amount Percentage
(dollars in thousands)Cost of Revenue:
Product. . . . . . . . . . . . . . . . . . . . . . $14,624 20% $ 8,026 26% $ 6,598 82%Maintenance, support and
service . . . . . . . . . . . . . . . . . . . . 2,951 24 1,201 24 1,750 146Total cost of revenue . . . . . . . . . . . . $17,575 21% $ 9,227 26% $ 8,348 90%
Gross Profit:Product. . . . . . . . . . . . . . . . . . . . . . $57,186 80% $23,054 74% $34,132 148%Maintenance, support and
service . . . . . . . . . . . . . . . . . . . . 9,309 76 3,839 76 5,470 142Total gross profit . . . . . . . . . . . . . . . $66,495 79% $26,893 74% $39,602 147%
The $6.6 million increase in product cost of revenue was attributable to the increase in the number ofsystems sold in 2006.
Of the $1.8 million increase in cost of maintenance, support and service revenue, $1.2 million was dueto higher salaries, benefits and overhead associated with increases in support and training personnel,including $49,000 attributable to the effect of stock-based compensation expense.
Product gross margin increased by 6 percentage points, reflecting the increase in the average sellingprice of our systems as a result of the changes in product configuration mix reflecting systems sales with ahigher software content as noted above, as well as reduced costs per system paid to our contractmanufacturers. The reduced cost per system paid to our contract manufacturer was attributable to theability of our contract manufacturer to purchase components at a lower cost due to the increase in thevolume of orders placed with our contract manufacturers as well as labor and overhead efficienciesrealized as a result of increased manufacturing volume. We expect our gross margin in the future todecrease, as we expect to experience increased price pressure on our products as the market for ourproducts continues to develop and grow. We cannot predict our ability to continue to realize reduced persystem costs because we cannot predict the pricing of component parts or the volume of orders to beplaced in the future.

50
Gross margin on maintenance, support and service revenue remained constant. The increase inmaintenance, support and service revenue associated with the growth in our installed product base wasoffset by a corresponding increase in costs.
Operating Expenses
Year Ended December 31,
2006 2005Period-to-Period
Change
Amount
Percentageof TotalRevenue Amount
Percentageof TotalRevenue Amount Percentage
(dollars in thousands)Sales and marketing. . . . . . . . . . . . . . . $23,759 28% $14,969 41% $ 8,790 59%Research and development . . . . . . . . 12,988 15 8,705 24 4,283 49General and administrative . . . . . . . . 6,566 8 3,602 10 2,964 82Total operating expenses . . . . . . . . . . $43,313 51% $27,276 75% $16,037 59%
Of the $8.8 million increase in sales and marketing expense (a) $7.0 million was attributable to highersalaries, commissions and benefits associated with a 54% increase in sales and marketing personnel,primarily sales and technical sales support staff, on a worldwide basis, (b) $337,000 was attributable to theeffect of stock-based compensation expense, (c) $264,000 was attributable to increased third party servicesand (d) $259,000 was attributable to increased expenses associated with expanded marketing programs,including trade shows. We expect sales and marketing expense to continue to increase in absolute dollarsfor the foreseeable future as we expand our sales force to continue to increase our revenue and marketshare, and to increase as a percentage of total revenue over the foreseeable future.
Of the $4.3 million increase in research and development expense, $3.5 million was attributable tohigher salaries and benefits associated with a 47% increase in the number of employees working on thedesign and development of new products and enhancement of existing products, quality assurance andtesting. The increase in research and development expense also reflected an increase in depreciationexpense of $783,000 associated with our investment in equipment to support new product developmentand an increase of $296,000 attributable to the effect of stock-based compensation expense. These factorswere offset in part by a reduction in payments to suppliers for design and consulting services in the amountof $272,000, which reflected our decision to bring certain development activities in-house as well as thetiming of projects. The addition of personnel and our continued investment in research and developmentwere driven by our strategy of maintaining our competitive position by expanding our product offeringsand enhancing our existing products to meet the requirements of our customers and market. We expectresearch and development expense to increase in absolute dollars and to increase as a percentage of totalrevenue for the foreseeable future.
Of the $3.0 million increase in general and administrative expense, (a) $909,000 was attributable tohigher salaries and benefits related to a 58% increase in general and administrative headcount,(b) $920,000 was attributable to increased legal, accounting and professional fees, (c) $269,000 wasattributable to an increase in facilities costs, including rent, utilities and depreciation expense, associatedwith the overall increase in our employee headcount, and (d) $219,000 was attributable to higher insurancepremiums associated with being a publicly traded company. The increase in general and administrativeexpense also reflected an increase of $158,000 attributable to the effect of stock-based compensationexpense. We expect general and administrative expense to continue to increase in absolute dollars and as apercentage of total revenue for the foreseeable future as we invest in infrastructure to support continuedgrowth and incur additional expenses related to being a publicly traded company, including increased auditand legal fees, costs of compliance with securities and other regulations, investor relations expense, andhigher insurance premiums.
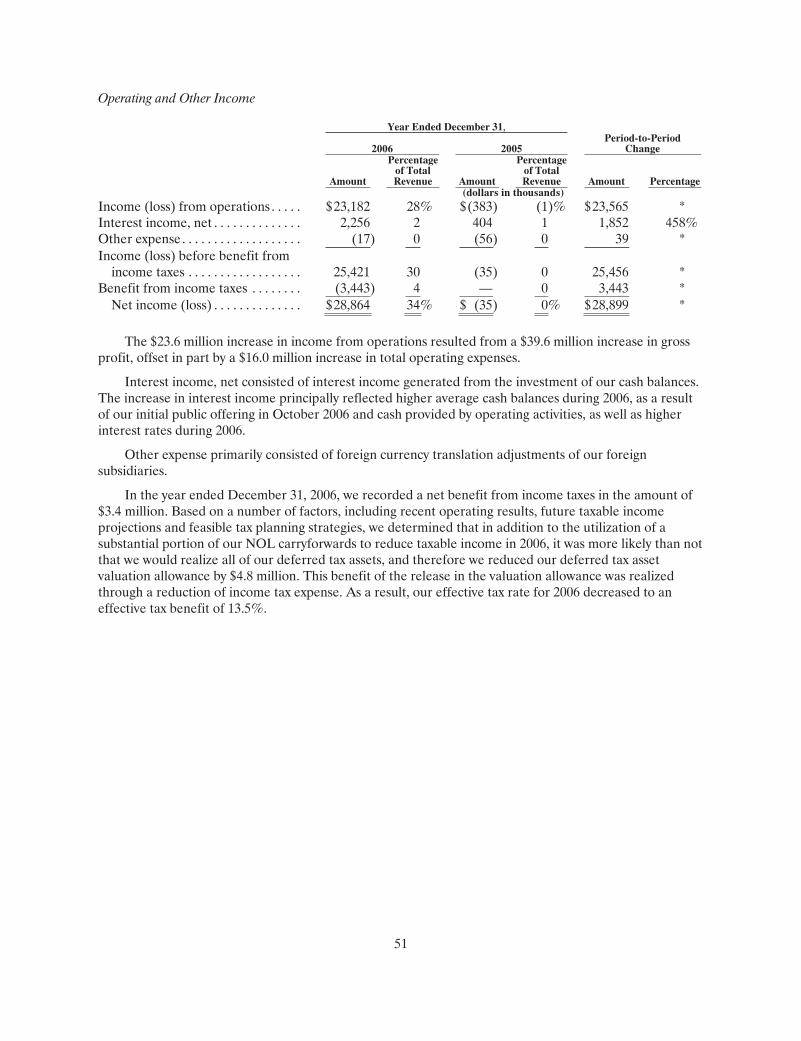
51
Operating and Other Income
Year Ended December 31,
2006 2005Period-to-Period
Change
Amount
Percentageof TotalRevenue Amount
Percentageof TotalRevenue Amount Percentage
(dollars in thousands)Income (loss) from operations . . . . . $23,182 28% $(383) (1)% $23,565 *Interest income, net . . . . . . . . . . . . . . 2,256 2 404 1 1,852 458%Other expense . . . . . . . . . . . . . . . . . . . (17) 0 (56) 0 39 *Income (loss) before benefit from
income taxes . . . . . . . . . . . . . . . . . . 25,421 30 (35) 0 25,456 *Benefit from income taxes . . . . . . . . (3,443) 4 — 0 3,443 *
Net income (loss) . . . . . . . . . . . . . . $28,864 34% $ (35) 0% $28,899 *
The $23.6 million increase in income from operations resulted from a $39.6 million increase in grossprofit, offset in part by a $16.0 million increase in total operating expenses.
Interest income, net consisted of interest income generated from the investment of our cash balances.The increase in interest income principally reflected higher average cash balances during 2006, as a resultof our initial public offering in October 2006 and cash provided by operating activities, as well as higherinterest rates during 2006.
Other expense primarily consisted of foreign currency translation adjustments of our foreignsubsidiaries.
In the year ended December 31, 2006, we recorded a net benefit from income taxes in the amount of$3.4 million. Based on a number of factors, including recent operating results, future taxable incomeprojections and feasible tax planning strategies, we determined that in addition to the utilization of asubstantial portion of our NOL carryforwards to reduce taxable income in 2006, it was more likely than notthat we would realize all of our deferred tax assets, and therefore we reduced our deferred tax assetvaluation allowance by $4.8 million. This benefit of the release in the valuation allowance was realizedthrough a reduction of income tax expense. As a result, our effective tax rate for 2006 decreased to aneffective tax benefit of 13.5%.

52
Comparison of Years Ended December 31, 2005 and 2004
Revenue
Year Ended December 31,
2005 2004Period-to-Period
Change
Amount
Percentageof TotalRevenue Amount
Percentageof TotalRevenue Amount Percentage
(dollars in thousands)Revenue by Type:Product revenue . . . . . . . . . . . . . . . . . . $31,080 86% $14,641 92% $16,439 112%Maintenance, support and service
revenue . . . . . . . . . . . . . . . . . . . . . . . 5,040 14 1,352 8 3,688 273Total revenue . . . . . . . . . . . . . . . . . . . . $36,120 100% $15,993 100% $20,127 126%
Revenue by Geography:United States and Canada . . . . . . . . . $21,357 59% $ 8,045 50% $13,312 165%International . . . . . . . . . . . . . . . . . . . . . 14,763 41 7,948 50 6,815 86Total revenue . . . . . . . . . . . . . . . . . . . . $36,120 100% $15,993 100% $20,127 126%
Revenue by Sales Channel:Direct . . . . . . . . . . . . . . . . . . . . . . . . . . . $17,324 48% $ 7,160 45% $10,164 142%Indirect . . . . . . . . . . . . . . . . . . . . . . . . . 18,796 52 8,833 55 9,963 113Total revenue . . . . . . . . . . . . . . . . . . . . $36,120 100% $15,993 100% $20,127 126%
During 2005, we substantially increased our revenue in the United States and Canada and othercountries as the market for our products began to develop, allowing us to diversify the individual foreigncountries from which we generate our revenue. Direct product revenues increased $8.1 million, all of whichwas attributable to United States and Canadian customers. Indirect product revenues increased$8.3 million, of which $2.8 million was attributable to United States and Canadian customers and$5.5 million was attributable to international customers.
The $16.4 million increase in product revenue was a result of an increase in the number of systemssold in 2005 which reflected the growth in the worldwide market for our products. We generated increasedproduct revenue in the United States and Canada and internationally and through both direct and indirectsales channels. An increase in the average selling price of our systems due to changes in our productsoftware configuration mix also contributed to the increase in product revenue for this period. The productconfiguration, which reflects the mix of session capacity and requested features, determines the price foreach SBC sold. Customers can license our software in various configurations, depending on the customers’requirements for session capacity, feature groups and protocols. The product software configuration mixwill have a direct impact on the average selling price of the system sold. Systems with a higher softwarecontent (higher session capacity and a larger number of feature groups) will generally have a higheraverage selling price that those systems sold with a lower software content.
The $3.7 million increase in maintenance, support and service revenue was attributable primarily tothe $2.8 million increase in maintenance and support fees associated with the growth in our installedproduct base and the $815,000 increase in installation and training revenue.

53
Cost of Revenue and Gross Profit
Year Ended December 31,
2005 2004Period-to-Period
Change
Amount
Percentageof RelatedRevenue Amount
Percentageof RelatedRevenue Amount Percentage
(dollars in thousands)Cost of Revenue:
Product. . . . . . . . . . . . . . . . . . . . . . . . $ 8,026 26% $ 5,212 36% $ 2,814 54%Maintenance, support and service. 1,201 24 583 43 618 106
Total cost of revenue . . . . . . . . . . . . . . $ 9,227 26% $ 5,795 36% $ 3,432 59%
Gross Profit:Product. . . . . . . . . . . . . . . . . . . . . . . . $23,054 74% $ 9,429 64% $13,625 144%Maintenance, support and service. 3,839 76 769 57 3,070 400
Total gross profit . . . . . . . . . . . . . . . . . $26,893 74% $10,198 64% $16,695 164%
The $2.8 million increase in product cost of revenue was attributable to the increase in the number ofsystems sold in 2005.
Of the $618,000 increase in cost of maintenance, support and service revenue, $606,000 was due tohigher salaries, benefits and overhead associated with increases in support and training personnel.
Product gross margin increased by 10 percentage points, reflecting the increase in the average sellingprice of our systems as a result of the changes in product configuration mix reflecting systems sales with ahigher software content as noted above, as well as reduced costs per system paid to our contractmanufacturer. The reduced cost per system paid to our contract manufacturer was attributable to theability of our contract manufacturer to purchase components at a lower cost due to the increase in thevolume of orders placed with our contract manufacturers as well as labor and overhead efficienciesrealized as a result of increased manufacturing volume. The increased percentage of revenue generated byour direct sales channel was also a factor in the increase in gross margin. Generally, our direct sales incurmore selling expenses and generate a higher average selling price than our indirect sales from ourdistribution channels.
Gross margin on maintenance, support and service revenue increased by 19 percentage points as aresult of a substantial increase in maintenance, support and service revenue associated with the growth inour installed product base without a corresponding increase in costs.
Operating ExpensesYear Ended December 31,
2005 2004Period-to-Period
Change
Amount
Percentageof TotalRevenue Amount
Percentageof TotalRevenue Amount Percentage
(dollars in thousands)Sales and marketing. . . . . . . . . . . . . $14,969 41% $ 8,558 53% $6,411 75%Research and development . . . . . . 8,705 24 5,552 35 3,153 57General and administrative . . . . . . 3,602 10 2,341 15 1,261 54Lease abandonment. . . . . . . . . . . . . — — 848 5 (848) 100
Total operating expenses . . . . . . $27,276 75% $17,299 108% $9,977 58%

54
Of the $6.4 million increase in sales and marketing expense (a) $3.9 million was attributable to highersalaries, commissions and benefits associated with a 76% increase in sales and marketing personnel,primarily sales and technical sales support staff, on a worldwide basis (b) $1.2 million was attributable to anincrease in travel expense resulting from the growth in the number of sales personnel, and (c) the balancewas primarily attributable to increased expenses associated with expanded marketing programs, includingtrade shows.
Of the $3.2 million increase in research and development expense, $2.2 million was attributable tohigher salaries and benefits associated with a 45% increase in the number of employees working on thedesign and development of new products and enhancement of existing products, quality assurance andtesting. The increase in research and development expense also reflected an increase in payments tosuppliers for design and consulting services of $692,000. The addition of personnel and our continuedinvestment in research and development were driven by our strategy of maintaining our competitiveposition by expanding our product offerings and enhancing our existing products to meet the requirementsof our customers and market.
Of the $1.3 million increase in general and administrative expense, (a) $429,000 was attributable tohigher salaries and benefits related to a 50% increase in general and administrative headcount,(b) $312,000 was attributable to an increase in facilities costs, including rent, utilities and depreciationexpense, associated with the overall increase in our employee headcount, and (c) $165,000 was attributableto increased legal and accounting fees.
During 2004, we recorded a lease abandonment loss of $848,000 related to the relocation of ourcorporate headquarters in January 2005. Of this charge, $760,000 represented a loss on the prior facility’slease and $88,000 related to the abandonment of related fixed assets and leasehold improvements.
Operating and Other IncomeYear Ended December 31,
2005 2004Period-to-Period
Change
Amount
Percentageof TotalRevenue Amount
Percentageof TotalRevenue Amount Percentage
(dollars in thousands)Loss from operations . . . . . . . . . . . $(383) (1)% $(7,101) (44)% $6,718 95%Interest income. . . . . . . . . . . . . . . . 410 1 177 1 233 132Interest expense . . . . . . . . . . . . . . . (6) 0 (33) 0 27 82Other expense . . . . . . . . . . . . . . . . . (56) 0 — — (56) *Net (loss) income . . . . . . . . . . . . . . $ (35) 0% $(6,957) (43)% $6,922 99%
* Not meaningful.
The $6.7 million decrease in loss from operations resulted from a $16.7 million increase in grossprofit, offset in part by a $10.0 million increase in total operating expenses.
Interest income, net consisted of interest income generated from the investment of our cash balances.The increase in interest income principally reflected higher average cash balances during 2005, in partfrom our sale of Series C convertible preferred stock in June 2004 and in part from operating activities, aswell as higher interest rates during 2005.
The reduction in interest expense reflected lower outstanding balances in 2005 under our equipmentline of credit facility.
Other expense primarily consisted of foreign currency translation adjustments of our foreignsubsidiaries.

55
Liquidity and Capital Resources
Resources
Since 2005, we have funded our operations principally with cash provided by operations, which wasdriven by growth in revenue. In October 2006, we completed an IPO of our common stock in which we soldand issued 9.7 million shares of our common stock, including 1.7 million shares sold by us pursuant to theunderwriters’ full exercise of their over-allotment option, at an issue price of $9.50 per share. We raised atotal of $92.4 million in gross proceeds from the IPO, or $83.2 million in net proceeds after deductingunderwriting discounts and commissions of $6.5 million and other offering costs of $2.7 million.
Key measures of our liquidity are as follows:As of and for the Year Ended
December 31,2006 2005 2004
(in thousands)Cash and cash equivalents . . . . . . . . . . . . . . . . . . . . . . . . . . . . . . . . . . . . . . . . $118,714 $15,369 $16,748Accounts receivable, net . . . . . . . . . . . . . . . . . . . . . . . . . . . . . . . . . . . . . . . . . . 14,337 6,959 4,195Working capital . . . . . . . . . . . . . . . . . . . . . . . . . . . . . . . . . . . . . . . . . . . . . . . . . 122,844 13,783 15,134Cash provided by (used in) operating activities . . . . . . . . . . . . . . . . . . . . . . 26,331 2,326 (4,657)Cash provided by (used in) financing activities . . . . . . . . . . . . . . . . . . . . . . . 83,483 (86) 14,106
Cash and cash equivalents. Our cash and cash equivalents at December 31, 2006 were held forworking capital purposes and were invested primarily in money market funds. We do not enter intoinvestments for trading or speculative purposes. Restricted cash, which totaled $479,000 at December 31,2006 and $432,000 at December 31, 2005, and is not included in cash and cash equivalents, was held incertificates of deposit as collateral for letters of credit related to the lease agreements for our corporateheadquarters in Burlington, Massachusetts, our sales office in Madrid, Spain, and our former headquartersin Woburn, Massachusetts.
Accounts receivable, net. Our accounts receivable balance fluctuates from period to period, whichaffects our cash flow from operating activities. The fluctuations vary depending on the timing of ourshipping and billing activity, cash collections, and changes to our allowance for doubtful accounts. In somesituations we receive cash payment from a customer prior to the time we are able to recognize revenue ona transaction. We record these payments as deferred revenue, which has a positive effect on our accountsreceivable balances. We use days sales outstanding, or DSO, calculated on a quarterly basis, as ameasurement of the quality and status of our receivables. We define DSO as (a) accounts receivable, net ofallowance for doubtful accounts, divided by total revenue for the most recent quarter, multiplied by (b) 90days. DSO was 54 days at December 31, 2006, 50 days at December 31, 2005 and 60 days at December 31,2004.
Operating activities. Cash provided by (used in) operating activities primarily consists of net income(loss) adjusted for certain non-cash items including depreciation and amortization, deferred income taxes,the provision for bad debts, stock-based compensation expense, and the effect of changes in workingcapital and other activities. Cash provided by operating activities in 2006 was $26.3 million and consisted of$28.9 million of net income, negative non-cash adjustments of $89,000 (primarily deferred income taxes of$4.8 million offset by depreciation and amortization of $3.5 million, $867,000 of stock-based compensationexpense, and $343,000 for provision for bad debts), and $2.4 million used in working capital and otheractivities. Cash used in working capital and other activities primarily reflected a $7.7 million increase inaccounts receivable, a $3.9 million increase in inventory, and a $1.1 million increase in other assets,reflecting an overall increase in business activity, partially offset by a $6.6 million increase in accountspayable and accrued expenses and a $3.9 million increase in deferred revenue. This increase in deferred

56
revenue was primarily attributable to an increase in deferred revenue from our support service contracts,which will be recognized as revenue over the twelve-month term of the support service period.
Cash provided by operating activities in 2005 was $2.3 million and consisted of $35,000 of net loss andpositive non-cash adjustments of $2.4 million (primarily depreciation and amortization). Working capitaland other activities remained flat during 2005 but the net activity consisted of a $3.2 million increase inaccounts receivable as a result of increased revenues in 2005 and a $1.3 million increase in inventory tosupport the overall increase in business activity, offset by a $2.5 million increase in accounts payable andaccrued expenses. Working capital also reflected a $2.2 million increase in deferred revenue resulting froman increase in payments received from customers prior to the time revenue could be recognized and anincrease in deferred support revenue which will be recognized as revenue over the term of the supportperiods.
Cash used in operating activities in 2004 was $4.7 million and consisted of $7.0 million of net loss,positive non-cash adjustments of $1.4 million (primarily depreciation and amortization) and $899,000provided by working capital and other activities. Cash provided by working capital and other activitiesprimarily reflected a $3.5 million increase in accounts payable and accrued expenses and a $2.9 millionincrease in deferred revenue, offset in part by a $3.7 million increase in accounts receivable as a result ofincreased revenues in 2004 and a $1.6 million increase in inventory to support the overall increase inbusiness activity.
Equity financing activities. In October 2006, we completed an initial public offering of our commonstock in which we sold and issued 9.7 million shares of our common stock, including 1.7 million shares soldby us pursuant to the underwriters’ full exercise of their over-allotment option, at an issue price of $9.50per share. We raised a total of $92.4 million in gross proceeds from the IPO, or $83.2 million in netproceeds after deducting underwriting discounts and commissions of $6.5 million and other offering costsof $2.7 million. We raised an additional $14.4 million of net proceeds through sales of our Series Cconvertible preferred stock in June 2004. In addition, we received proceeds from the issuance of restrictedcommon stock and exercises of common stock options, net of the amount paid for the repurchase ofcommon stock, in the amounts of $159,000 in 2004, $64,000 in 2005 and $213,000 in 2006.
Credit facility borrowings. We previously maintained an equipment line of credit facility with acommercial bank under which we made borrowings of $1.8 million in 2001 and 2002. This equipment lineof credit expired in 2003 and was converted into a term loan which was repaid in 2005. Additionally, during2003, 2004 and 2005 we maintained two lines of credit with a commercial bank in the amount of$2.0 million. We did not draw against these lines of credit and they expired unused in July 2005. Based oninformation currently available to us, we believe that we will be able to enter into such an arrangementwith a commercial bank on terms acceptable to us in the event we subsequently determine that such anarrangement is necessary or desirable to provide us with additional working capital.
We believe our existing cash and cash equivalents and our cash flow from operating activities will besufficient to meet our anticipated cash needs for at least the next twelve months. Our future workingcapital requirements will depend on many factors, including the rate of our revenue growth, ourintroduction of new products and enhancements, and our expansion of sales and marketing and productdevelopment activities. To the extent that our cash and cash equivalents and cash flow from operatingactivities are insufficient to fund our future activities, we may need to raise additional funds through bankcredit arrangements or public or private equity or debt financings. We also may need to raise additionalfunds in the event we determine in the future to effect one or more acquisitions of businesses, technologiesand products that will complement our existing operations. In the event additional funding is required, wemay not be able to obtain bank credit arrangements or effect an equity or debt financing on termsacceptable to us or at all.

57
Requirements
Capital expenditures. We have made capital expenditures primarily for evaluation systems forcustomer sales opportunities and equipment to support product development, as well as for leaseholdimprovements and other general purposes to support our growth. Our capital expenditures totaled$6.4 million in 2006, $3.6 million in 2005, and $2.1 million in 2004. We are not currently party to anypurchase contracts related to future capital expenditures.
Contractual obligations and requirements. We generally do not enter into long-term purchasearrangements, and do not have any such commitments outstanding as of December 31, 2006. Our onlysignificant contractual obligation relates to the leases of our corporate headquarters in Burlington,Massachusetts and our office in Madrid Spain. The following table sets forth our commitments to settlecontractual obligations in cash after December 31, 2006:
2007 2008 2009 2010 2011 Total(in thousands)
Operating leases as of December 31, 2006 $1,218 $1,264 $1,327 $706 $38 $4,553
Off-Balance-Sheet Arrangements
As of December 31, 2006, we did not have any significant off-balance-sheet arrangements, as definedin Item 303(a)(4)(ii) of Regulation S-K of the SEC.
Recent Accounting Pronouncements
In July 2006, the Financial Accounting Standards Board (“FASB”) issued Financial AccountingStandards Interpretation (FIN) No. 48, Accounting for Uncertainty in Income Taxes, which is aninterpretation of SFAS No. 109. FIN 48 clarifies the accounting for income taxes by prescribing theminimum recognition threshold a tax position is required to meet before being recognized in the financialstatements. FIN 48 also provides guidance on derecognition, measurement, classification, interest andpenalties, accounting in interim periods, disclosure and transition. In addition, FIN 48 clearly scopes outincome taxes from SFAS No. 5, Accounting for Contingencies. FIN 48 is effective for fiscal years beginningafter December 15, 2006. We will implement this interpretation in the fiscal year starting January 1, 2007.We are currently analyzing the effect, if any, FIN 48 will have on our consolidated financial position andour results of operations.
In September 2006, the FASB issued SFAS No. 157, Fair Value Measurements, which defines fairvalue, establishes a framework for measuring fair value under generally accepted accounting principles,and expands disclosures about fair value measurements. SFAS No. 157 applies to other accountingpronouncements that require or permit fair value measurements. The new guidance is effective forfinancial statements issued for fiscal years beginning after November 15, 2007, and for interim periodswithin those fiscal years. We are currently analyzing the effect, if any, SFAS No. 157 will have on ourconsolidated financial position and results of operations.
In September 2006, the United States Securities and Exchange Commission issued Staff AccountingBulletin (SAB) No. 108, Considering the Effects of Prior Year Misstatements when Quantifying Misstatementsin Current Year Financial Statements. SAB 108 provides guidance on the consideration of the effects ofprior year misstatements in quantifying current year misstatements for the purpose of a materialityassessment. SAB 108 establishes an approach that requires quantification of financial statement errorsbased on the effects of each of the company’s balance sheet and statement of operations financialstatements and the related financial statement disclosures. The SAB permits existing public companies torecord the cumulative effect of initially applying this approach in the first year ending after November 15,2006 by recording the necessary correcting adjustments to the carrying values of assets and liabilities as ofthe beginning of that year with the offsetting adjustment recorded to the opening balance of retained

58
earnings. Additionally, the use of the cumulative effect transition method requires detailed disclosure ofthe nature and amount of each individual error being corrected through the cumulative adjustment andhow and when it arose. The adoption of SAB 108 did not have a material impact on our consolidatedfinancial position, results of operations or liquidity.
Item 7A. Quantitative and Qualitative Disclosures About Market Risk
Market risk represents the risk of loss that may impact our financial position due to adverse changesin financial market prices and rates. Our market risk exposure is primarily a result of fluctuations inforeign exchange rates and interest rates. We do not hold or issue financial instruments for tradingpurposes.
Foreign Currency Exchange Risk
To date, substantially all of our international customer agreements have been denominated inU.S. dollars. Accordingly, we have limited exposure to foreign currency exchange rates and do not enterinto foreign currency hedging transactions. The functional currency of our foreign operations in Europeand Asia is the U.S. dollar. Accordingly, all assets and liabilities of these foreign subsidiaries areremeasured into U.S. dollars using the exchange rates in effect at the balance sheet date. Revenue andexpenses of these foreign subsidiaries are remeasured into U.S. dollars at the average rates in effect duringthe year. Any differences resulting from the remeasurement of assets, liabilities and operations of theEuropean and Asian subsidiaries are recorded within other income in the consolidated statements ofoperations. If the foreign currency exchange rates fluctuated by 10% as of December 31, 2006, our foreignexchange exposure would have fluctuated by less than $10,000.
Interest Rate Risk
At December 31, 2006, we had unrestricted cash and cash equivalents totaling $118.7 million. Theseamounts were invested primarily in money market funds. The unrestricted cash and cash equivalents wereheld for working capital purposes. We do not enter into investments for trading or speculative purposes.Due to the short-term nature of these investments, we believe that we do not have any material exposureto changes in the fair value of our investment portfolio as a result of changes in interest rates. Declines ininterest rates, however, would reduce future investment income.

59
Item 8. Financial Statement and Supplementary Data
ACME PACKET, INC.INDEX TO CONSOLIDATED FINANCIAL STATEMENTS
Page No.Report of Independent Registered Public Accounting Firm . . . . . . . . . . . . . . . . . . . . . . . . . . . . . . . . 60
Consolidated Balance Sheets as of December 31, 2006 and 2005 . . . . . . . . . . . . . . . . . . . . . . . . . . . . 61
Consolidated Statements of Operations for the Years Ended December 31, 2006, 2005 and 2004 . 62
Consolidated Statements of Stockholders’ Equity for the Years Ended December 31, 2006, 2005and 2004. . . . . . . . . . . . . . . . . . . . . . . . . . . . . . . . . . . . . . . . . . . . . . . . . . . . . . . . . . . . . . . . . . . . . . . . . . . 63
Consolidated Statements of Cash Flows for the Years Ended December 31, 2006, 2005 and 2004 64
Notes to Consolidated Financial Statements. . . . . . . . . . . . . . . . . . . . . . . . . . . . . . . . . . . . . . . . . . . . . . 65
60
REPORT OF INDEPENDENT REGISTERED PUBLIC ACCOUNTING FIRM
The Board of Directors and Stockholders ofAcme Packet, Inc.
We have audited the accompanying consolidated balance sheets of Acme Packet, Inc. and subsidiaries(the “Company”) as of December 31, 2006 and 2005, and the related consolidated statements ofoperations, stockholders’ equity, and cash flows for each of the three years in the period endedDecember 31, 2006. These financial statements are the responsibility of the Company’s management. Ourresponsibility is to express an opinion on these financial statements based on our audits.
We conducted our audits in accordance with the standards of the Public Company AccountingOversight Board (United States). Those standards require that we plan and perform the audit to obtainreasonable assurance about whether the financial statements are free of material misstatement. We werenot engaged to perform an audit of the Company’s internal control over financial reporting. Our auditsincluded consideration of internal control over financial reporting as a basis for designing auditprocedures that are appropriate in the circumstances, but not for the purpose of expressing an opinion onthe effectiveness of the Company’s internal control over financial reporting. Accordingly, we express nosuch opinion. An audit also includes examining, on a test basis, evidence supporting the amounts anddisclosures in the financial statements, assessing the accounting principles used and significant estimatesmade by management, and evaluating the overall financial statement presentation. We believe that ouraudits provide a reasonable basis for our opinion.
In our opinion, the financial statements referred to above present fairly, in all material respects, theconsolidated financial position of Acme Packet, Inc. and subsidiaries at December 31, 2006 and 2005, andthe consolidated results of their operations and their cash flows for each of the three years in the periodended December 31, 2006, in conformity with U.S. generally accepted accounting principles.
As discussed in Note 2 to the consolidated financial statements, on January 1, 2006, the Companyadopted the provisions of Statement of Financial Accounting Standards No. 123(R), Share-Based Payment.
/s/ Ernst & Young LLP
Boston, MassachusettsMarch 7, 2007

See accompanying notes.
61
ACME PACKET, INC.CONSOLIDATED BALANCE SHEETS
(in thousands, except share and per share data)
December 31,2006 2005
ASSETSCurrent assets:
Cash and cash equivalents . . . . . . . . . . . . . . . . . . . . . . . . . . . . . . . . . . . . . . . . . . . . . . . . . . . . . $118,714 $ 15,369Accounts receivable, net of allowance of $695 and $433, respectively . . . . . . . . . . . . . . . . . 14,337 6,959Inventory . . . . . . . . . . . . . . . . . . . . . . . . . . . . . . . . . . . . . . . . . . . . . . . . . . . . . . . . . . . . . . . . . . . 7,211 3,281Restricted cash . . . . . . . . . . . . . . . . . . . . . . . . . . . . . . . . . . . . . . . . . . . . . . . . . . . . . . . . . . . . . . 150 132Deferred tax asset. . . . . . . . . . . . . . . . . . . . . . . . . . . . . . . . . . . . . . . . . . . . . . . . . . . . . . . . . . . . 3,515 —Other current assets . . . . . . . . . . . . . . . . . . . . . . . . . . . . . . . . . . . . . . . . . . . . . . . . . . . . . . . . . . 1,531 428
Total current assets . . . . . . . . . . . . . . . . . . . . . . . . . . . . . . . . . . . . . . . . . . . . . . . . . . . . . . . . 145,458 26,169Property and equipment, net. . . . . . . . . . . . . . . . . . . . . . . . . . . . . . . . . . . . . . . . . . . . . . . . . . . . . 6,857 3,926Restricted cash . . . . . . . . . . . . . . . . . . . . . . . . . . . . . . . . . . . . . . . . . . . . . . . . . . . . . . . . . . . . . . . . 329 300Deferred tax asset. . . . . . . . . . . . . . . . . . . . . . . . . . . . . . . . . . . . . . . . . . . . . . . . . . . . . . . . . . . . . . 1,265 —Other assets. . . . . . . . . . . . . . . . . . . . . . . . . . . . . . . . . . . . . . . . . . . . . . . . . . . . . . . . . . . . . . . . . . . 14 4
Total assets . . . . . . . . . . . . . . . . . . . . . . . . . . . . . . . . . . . . . . . . . . . . . . . . . . . . . . . . . . . . . . . $153,923 $ 30,399
LIABILITIES AND STOCKHOLDERS’ EQUITYCurrent liabilities:
Accounts payable . . . . . . . . . . . . . . . . . . . . . . . . . . . . . . . . . . . . . . . . . . . . . . . . . . . . . . . . . . . . $ 5,354 $ 2,623Accrued expenses and other current liabilities . . . . . . . . . . . . . . . . . . . . . . . . . . . . . . . . . . . . 7,859 4,222Deferred revenue . . . . . . . . . . . . . . . . . . . . . . . . . . . . . . . . . . . . . . . . . . . . . . . . . . . . . . . . . . . . 9,401 5,541
Total current liabilities. . . . . . . . . . . . . . . . . . . . . . . . . . . . . . . . . . . . . . . . . . . . . . . . . . . . . . 22,614 12,386Deferred rent . . . . . . . . . . . . . . . . . . . . . . . . . . . . . . . . . . . . . . . . . . . . . . . . . . . . . . . . . . . . . . . . . 372 290
Commitments and contingencies (Note 7)
Stockholders’ equity:Series A convertible preferred stock, $0.001 par value:
Authorized—0 and 3,759,531 shares at December 31, 2006 and 2005, respectivelyIssued and outstanding—0 and 3,759,531 shares at December 31, 2006 and 2005,
respectively . . . . . . . . . . . . . . . . . . . . . . . . . . . . . . . . . . . . . . . . . . . . . . . . . . . . . . . . . . . . . — 4Series B convertible preferred stock, $0.001 par value:
Authorized—0 and 21,467,931 shares at December 31, 2006 and 2005, respectivelyIssued and outstanding—0 and 20,676,816 shares at December 31, 2006 and 2005,
respectively . . . . . . . . . . . . . . . . . . . . . . . . . . . . . . . . . . . . . . . . . . . . . . . . . . . . . . . . . . . . . — 21Series C convertible preferred stock, $0.001 par value:
Authorized—0 and 8,021,390 shares at December 31, 2006 and 2005, respectivelyIssued and outstanding—0 and 7,754,012 shares at December 31, 2006 and 2005,
respectively . . . . . . . . . . . . . . . . . . . . . . . . . . . . . . . . . . . . . . . . . . . . . . . . . . . . . . . . . . . . . — 8Undesignated preferred stock, $0.001 par value:
Authorized—5,000,000 and 0 shares at December 31, 2006 and 2005, respectivelyIssued and outstanding—0 shares at December 31, 2006 and 2005 . . . . . . . . . . . . . . . . . — —
Common stock, $0.001 par value:Authorized—150,000,000 and 61,000,000 shares at December 31, 2006 and 2005,
respectivelyIssued and outstanding—58,565,985 and 15,853,171 shares at December 31, 2006 and
2005, respectively . . . . . . . . . . . . . . . . . . . . . . . . . . . . . . . . . . . . . . . . . . . . . . . . . . . . . . . . 59 16Additional paid-in capital . . . . . . . . . . . . . . . . . . . . . . . . . . . . . . . . . . . . . . . . . . . . . . . . . . . . . 130,306 45,966Retained earnings (deficit) . . . . . . . . . . . . . . . . . . . . . . . . . . . . . . . . . . . . . . . . . . . . . . . . . . . . 572 (28,292)
Total stockholders’ equity . . . . . . . . . . . . . . . . . . . . . . . . . . . . . . . . . . . . . . . . . . . . . . . . . . . 130,937 17,723Total liabilities and stockholders’ equity . . . . . . . . . . . . . . . . . . . . . . . . . . . . . . . . . . . . . . . . . . . $153,923 $ 30,399

See accompanying notes.
62
ACME PACKET, INC.CONSOLIDATED STATEMENTS OF OPERATIONS
(in thousands, except share and per share data)
Years Ended December 31,2006 2005 2004
Revenue:Product. . . . . . . . . . . . . . . . . . . . . . . . . . . . . . . . . . . . . . . . . . . . $ 71,810 $ 31,080 $ 14,641Maintenance, support and service. . . . . . . . . . . . . . . . . . . . . 12,260 5,040 1,352
Total revenue . . . . . . . . . . . . . . . . . . . . . . . . . . . . . . . . . . . . 84,070 36,120 15,993Cost of revenue(1):
Product. . . . . . . . . . . . . . . . . . . . . . . . . . . . . . . . . . . . . . . . . . . . 14,624 8,026 5,212Maintenance, support and service. . . . . . . . . . . . . . . . . . . . . 2,951 1,201 583
Total cost of revenue. . . . . . . . . . . . . . . . . . . . . . . . . . . . . . 17,575 9,227 5,795Gross profit . . . . . . . . . . . . . . . . . . . . . . . . . . . . . . . . . . . . . . . . . . 66,495 26,893 10,198Operating expenses(1):
Sales and marketing. . . . . . . . . . . . . . . . . . . . . . . . . . . . . . . . . 23,759 14,969 8,558Research and development . . . . . . . . . . . . . . . . . . . . . . . . . . 12,988 8,705 5,552General and administrative . . . . . . . . . . . . . . . . . . . . . . . . . . 6,566 3,602 2,341Lease abandonment. . . . . . . . . . . . . . . . . . . . . . . . . . . . . . . . . — — 848
Total operating expenses . . . . . . . . . . . . . . . . . . . . . . . . . . 43,313 27,276 17,299Income (loss) from operations . . . . . . . . . . . . . . . . . . . . . . . . . . 23,182 (383) (7,101)Other income (expense):
Interest income. . . . . . . . . . . . . . . . . . . . . . . . . . . . . . . . . . . . . 2,256 410 177Interest expense . . . . . . . . . . . . . . . . . . . . . . . . . . . . . . . . . . . . — (6) (33)Other expense. . . . . . . . . . . . . . . . . . . . . . . . . . . . . . . . . . . . . . (17) (56) —
Total other income, net. . . . . . . . . . . . . . . . . . . . . . . . . . . . 2,239 348 144Income (loss) before benefit from income taxes. . . . . . . . . . . 25,421 (35) (6,957)Benefit from income taxes . . . . . . . . . . . . . . . . . . . . . . . . . . . . . (3,443) — —Net income (loss) . . . . . . . . . . . . . . . . . . . . . . . . . . . . . . . . . . . . . $ 28,864 $ (35) $ (6,957)Net income (loss) per share applicable to common
stockholders (Note 2):Basic . . . . . . . . . . . . . . . . . . . . . . . . . . . . . . . . . . . . . . . . . . . . . . $ 0.57 $ — $ (0.47)Diluted . . . . . . . . . . . . . . . . . . . . . . . . . . . . . . . . . . . . . . . . . . . . $ 0.50 $ — $ (0.47)
Weighted average number of common shares used in netincome (loss) per common share calculation:Basic . . . . . . . . . . . . . . . . . . . . . . . . . . . . . . . . . . . . . . . . . . . . . . 50,437,801 15,240,890 14,732,597Diluted . . . . . . . . . . . . . . . . . . . . . . . . . . . . . . . . . . . . . . . . . . . . 57,418,796 15,240,890 14,732,597
(1) Amounts include stock-based compensation expense as follows:Cost of product revenue . . . . . . . . . . . . . . . . . . . . . . . . . . . $ 27 $ — $ —Cost of maintenance, support and service revenue . . . . 49 — —Sales and marketing. . . . . . . . . . . . . . . . . . . . . . . . . . . . . . . 337 — 2Research and development . . . . . . . . . . . . . . . . . . . . . . . . 296 — —General and administrative . . . . . . . . . . . . . . . . . . . . . . . . 158 — —

63
ACMEPACKET,INC.
CONSOLIDATEDSTATEMENTSOFSTOCKHOLDERS’EQUITY
(inthousands,exceptsharedata)
SeriesAConvertible
PreferredStock
SeriesBConvertible
PreferredStock
SeriesCConvertible
PreferredStock
CommonStock
Numberof
Shares
$0.001
Par
Value
Numberof
Shares
$0.001
Par
Value
Numberof
Shares
$0.001
Par
Value
Numberof
Shares
$0.001
Par
Value
Additional
Paid-in
Capital
Notes
Receivable
From
Employees
Retained
Earnings
(Deficit)
Total
Stockholders’
Equity
Bal
ance
atD
ecem
ber
31,2
003
..3,
759,
531
$4
20,6
76,8
16$
21—
$—15
,088
,636
$15
$31
,317
$(6
0)$(
21,3
00)
$9,
997
Issu
ance
ofre
stri
cted
com
mon
stoc
k...
....
....
....
....
..—
——
——
—45
4,00
01
139
——
140
Issu
ance
ofSe
ries
Cco
nver
tible
pref
erre
dst
ock,
neto
foff
erin
gco
sts
of$6
7..
....
....
....
.—
——
—7,
754,
012
8—
—14
,425
——
14,4
33R
epur
chas
ean
dre
tirem
ento
fco
mm
onst
ock
....
....
....
.—
——
——
—(7
,813
)—
(1)
——
(1)
Exe
rcis
eof
stoc
kop
tions
....
...
——
——
——
100,
008
—20
——
20Is
suan
ceof
com
mon
stoc
kfo
rpr
ofes
sion
alse
rvic
es..
....
..—
——
——
—8,
237
—2
——
2N
etlo
ss..
....
....
....
....
..—
——
——
——
——
—(6
,957
)(6
,957
)B
alan
ceat
Dec
embe
r31
,200
4..
3,75
9,53
14
20,6
76,8
1621
7,75
4,01
28
15,6
43,0
6816
45,9
02(6
0)(2
8,25
7)17
,634
Issu
ance
ofre
stri
cted
com
mon
stoc
k...
....
....
....
....
..—
——
——
—45
,500
—30
——
30R
epur
chas
ean
dre
tirem
ento
fco
mm
onst
ock
....
....
....
.—
——
——
—(1
,021
)—
——
——
Exe
rcis
eof
stoc
kop
tions
....
...
——
——
——
165,
624
—34
——
34P
roce
eds
from
the
repa
ymen
tof
empl
oyee
note
sre
ceiv
able
....
——
——
——
——
—60
—60
Net
loss
....
....
....
....
....
——
——
——
——
——
(35)
(35)
Bal
ance
atD
ecem
ber
31,2
005
..3,
759,
531
420
,676
,816
217,
754,
012
815
,853
,171
1645
,966
—(2
8,29
2)17
,723
Con
vers
ion
ofpr
efer
red
stoc
kin
conn
ectio
nw
ithth
eC
ompa
ny’s
initi
alpu
blic
offe
ring
....
....
(3,7
59,5
31)
(4)
(20,
676,
816)
(21)
(7,7
54,0
12)
(8)
32,1
90,3
5933
——
——
Issu
ance
ofco
mm
onst
ock
inco
nnec
tion
with
the
Com
pany
’sin
itial
publ
icof
feri
ng,n
etof
issu
ance
cost
sof
$2,7
27..
....
——
——
——
9,72
1,17
99
83,1
50—
—83
,159
Exe
rcis
eof
stoc
kop
tions
....
...
——
——
——
801,
276
121
2—
—21
3St
ock-
base
dco
mpe
nsat
ion
expe
nse
....
....
....
....
..—
——
——
——
—86
7—
—86
7T
axbe
nefit
rela
ted
toex
erci
seof
stoc
kop
tions
....
....
....
..—
——
——
——
—11
1—
—11
1N
etin
com
e..
....
....
....
...
——
——
——
——
——
28,8
6428
,864
Bal
ance
atD
ecem
ber
31,2
006
..—
$——
$—
—$—
58,5
65,9
85$
59$
130,
306
$—
$57
2$
130,
937
See
acco
mpa
nyin
gno
tes.

See accompanying notes.
64
ACME PACKET, INC.CONSOLIDATED STATEMENTS OF CASH FLOWS
(in thousands)
Years Ended December 31,2006 2005 2004
Operating activitiesNet income (loss) . . . . . . . . . . . . . . . . . . . . . . . . . . . . . . . . . . . . . . . . . . . . . . . $ 28,864 $ (35) $ (6,957)Adjustments to reconcile net income (loss) to net cash provided by
(used in) operating activities:Depreciation and amortization . . . . . . . . . . . . . . . . . . . . . . . . . . . . . . . . . 3,481 1,966 1,217Provision for bad debts . . . . . . . . . . . . . . . . . . . . . . . . . . . . . . . . . . . . . . . . 343 410 94
Stock-based compensation expense . . . . . . . . . . . . . . . . . . . . . . . . . . . . . 867 — 2Deferred income taxes . . . . . . . . . . . . . . . . . . . . . . . . . . . . . . . . . . . . . . . . (4,780) — —Tax benefit related to the exercise of stock options . . . . . . . . . . . . . . . . (111) — —Loss on disposal of property and equipment in connection with the
restructuring . . . . . . . . . . . . . . . . . . . . . . . . . . . . . . . . . . . . . . . . . . . . . . . — — 88Change in operating assets and liabilities:
Accounts receivable. . . . . . . . . . . . . . . . . . . . . . . . . . . . . . . . . . . . . . . . . (7,721) (3,216) (3,679)Inventory . . . . . . . . . . . . . . . . . . . . . . . . . . . . . . . . . . . . . . . . . . . . . . . . . . (3,930) (1,302) (1,641)Other current assets. . . . . . . . . . . . . . . . . . . . . . . . . . . . . . . . . . . . . . . . . (1,103) (116) (102)Accounts payable . . . . . . . . . . . . . . . . . . . . . . . . . . . . . . . . . . . . . . . . . . . 2,731 1,046 1,136Accrued expenses, other current liabilities and deferred rent . . . . . 3,830 1,404 2,316Deferred revenue. . . . . . . . . . . . . . . . . . . . . . . . . . . . . . . . . . . . . . . . . . . 3,860 2,169 2,869
Net cash provided by (used in) operating activities . . . . . . . . . . . . 26,331 2,326 (4,657)
Investing activitiesPurchases of property and equipment . . . . . . . . . . . . . . . . . . . . . . . . . . . . . (6,412) (3,615) (2,125)Increase in other assets . . . . . . . . . . . . . . . . . . . . . . . . . . . . . . . . . . . . . . . . . . (57) (4) (136)
Net cash used in investing activities . . . . . . . . . . . . . . . . . . . . . . . . . (6,469) (3,619) (2,261)
Financing activitiesProceeds from sale of preferred stock, net of issuance costs . . . . . . . . . . — — 14,433Proceeds from sale of common stock in connection with the Company’s
initial public offering, net of issuance costs . . . . . . . . . . . . . . . . . . . . . . . 83,159 — —Proceeds from sale of common stock . . . . . . . . . . . . . . . . . . . . . . . . . . . . . . — 30 140Payments made for repurchase of common stock . . . . . . . . . . . . . . . . . . . — — (1)Proceeds from exercise of stock options. . . . . . . . . . . . . . . . . . . . . . . . . . . . 213 34 20Proceeds from repayment of employee notes receivable . . . . . . . . . . . . . — 60 —Tax benefit related to the exercise of stock options . . . . . . . . . . . . . . . . . . 111 — —Payments on long-term debt. . . . . . . . . . . . . . . . . . . . . . . . . . . . . . . . . . . . . . — (210) (486)
Net cash provided by (used in) financing activities . . . . . . . . . . . . 83,483 (86) 14,106
Net increase (decrease) in cash and cash equivalents . . . . . . . . . . . . . . . . 103,345 (1,379) 7,188Cash and cash equivalents at beginning of year . . . . . . . . . . . . . . . . . . . . . 15,369 16,748 9,560
Cash and cash equivalents at end of year . . . . . . . . . . . . . . . . . . . . . . . . . . . $118,714 $15,369 $16,748
Supplemental disclosure of cash flow informationCash paid for interest . . . . . . . . . . . . . . . . . . . . . . . . . . . . . . . . . . . . . . . . . . . $ — $ 7 $ 36
Cash paid for income taxes. . . . . . . . . . . . . . . . . . . . . . . . . . . . . . . . . . . . . . . $ 345 $ 2 $ 2

65
ACME PACKET, INC.NOTES TO CONSOLIDATED FINANCIAL STATEMENTS
Years Ended December 31, 2006, 2005 and 2004(in thousands, except share and per share data)
1. Organization and Operations
Acme Packet, Inc. (the Company) was incorporated in the State of Delaware on August 3, 2000. TheCompany provides session border controllers that enable service providers to deliver secure and highquality interactive communications—voice, video and other real-time multimedia sessions—across InternetProtocol network borders. The Company is headquartered in Burlington, Massachusetts and has salesoffices there, as well as in Europe and Asia.
2. Summary of Significant Accounting Policies
The accompanying consolidated financial statements reflect the application of certain significantaccounting policies as described below and elsewhere in these notes to the consolidated financialstatements.
Principles of Consolidation
The accompanying consolidated financial statements include the accounts of the Company and itswholly owned subsidiaries. All significant intercompany accounts and transactions have been eliminated inconsolidation.
Management’s Estimates and Uncertainties
The preparation of financial statements in conformity with accounting principles generally accepted inthe United States requires management to make estimates and assumptions that affect the reportedamounts of assets and liabilities and the disclosure of contingent assets and liabilities at the date of thefinancial statements and the reported amounts of revenue and expenses during the reporting period.
Significant estimates and judgments relied upon by management in preparing these financialstatements include revenue recognition, allowances for doubtful accounts, inventory allowances, expensingand capitalization of research and development costs for software, the determination of the fair value ofstock awards issued, warranty allowances, and the recoverability of the Company’s net deferred tax assetsand related valuation allowance.
Although the Company regularly assesses these estimates, actual results could differ materially fromthese estimates. Changes in estimates are recorded in the period in which they become known. TheCompany bases its estimates on historical experience and various other assumptions that it believes to bereasonable under the circumstances. Actual results may differ from management’s estimates if theseresults differ from historical experience or other assumptions prove not to be substantially accurate, even ifsuch assumptions are reasonable when made.
The Company is subject to a number of risks similar to those of other companies of similar size in itsindustry, including, but not limited to, rapid technological changes, competition from substitute productsand services from larger companies, limited number of suppliers, customer concentration, governmentregulations, management of international activities, protection of proprietary rights, patent litigation, anddependence on key individuals.

66
Cash and Cash Equivalents and Restricted Cash
Cash equivalents consist of highly liquid investments with original maturities of 90 days or less. Cashequivalents are carried at cost, which approximate their fair market value. Cash and cash equivalentsconsisted of the following:
December 31,2006 2005
Cash . . . . . . . . . . . . . . . . . . . . . . . . . . . . . . . . . . . . . . . . . . . . . . . . . . . . $ 4,378 $ 1,111Money market funds . . . . . . . . . . . . . . . . . . . . . . . . . . . . . . . . . . . . . . 114,336 14,258Total cash and cash equivalents . . . . . . . . . . . . . . . . . . . . . . . . . . . . $118,714 $15,369
As of December 31, 2005, the Company had restricted cash in the amount of $432 as collateral relatedto its facility leases. On May 31, 2006, the restriction on cash in the amount of $132 expired in connectionwith the expiration of the Company’s operating lease for the Woburn, Massachusetts facility. Theremaining $300 of restricted cash as of December 31, 2005 is used to collateralize a standby letter of creditrelated to the lease of the Company’s facility in Burlington, Massachusetts. The Company’s restriction withrespect to $150 of this amount expires in June 2007, while the remaining amount expires in June 2010.
In July 2006, the Company entered into two operating leases for office facilities in Burlington,Massachusetts and Madrid, Spain. As of December 31, 2006, $479 of restricted cash is used to collateralizestandby letters of credit related to the Burlington, Massachusetts leases and the Madrid, Spain lease. TheCompany’s restrictions with respect to the restricted cash amounts expire in June 2010 for the Burlington,Massachusetts leases and July 2011 for the Madrid, Spain lease, respectively.
Revenue Recognition
The Company recognizes revenue in accordance with the American Institute of Certified PublicAccountants (AICPA) Statement of Position (SOP) 97-2, Software Revenue Recognition , SOP 98-9,Software Revenue Recognition With Respect to Certain Transactions, and the Emerging Issues Task Force(EITF) Issue No. 03-5,Applicability of AICPA Statement of Position 97-2 to Nonsoftware Deliverables in anArrangement Containing More-Than-Incidental Software. The Company has determined that the softwareelement of its product is “more than incidental” to its products as a whole. As a result, in accordance withEITF Issue No. 03-5, the Company is required to recognize revenue under SOP 97-2 and SOP 98-9.
In accordance with these standards, revenue is recognized when persuasive evidence of anarrangement exists, delivery has occurred, the fee is fixed or determinable, and collection of the relatedaccounts receivable is deemed probable. In making these judgments, management evaluates these criteriaas follows:
• Persuasive evidence of an arrangement. The Company considers a noncancelable agreement signedby the Company and the customer to be representative of pervasive evidence of an arrangement.
• Delivery has occurred. The Company considers delivery to have occurred when the product has beendelivered to the customer and no postdelivery obligations exist. In instances where customeracceptance is required, delivery is deemed to have occurred when customer acceptance has beenachieved. Certain of the Company’s agreements contain products that might not conform topublished specifications or contain a requirement to deliver additional elements which are essentialto the functionality of the delivered elements. Revenue associated with these agreements isrecognized when the customer specifications have been met or delivery of the additional elementshas occurred.
• Fees are fixed or determinable. The Company considers the fee to be fixed or determinable unless thefee is subject to refund or adjustment or is not payable within normal payment terms. If the fee is

67
subject to refund or adjustment, the Company recognizes revenue when the refund or adjustmentright lapses. If offered payment terms exceed the Company’s normal terms, the Companyrecognizes revenue as the amounts become due and payable or upon the receipt of cash.
• Collection is deemed probable. The Company conducts a credit review for all transactions at theinception of an arrangement to determine the creditworthiness of the customer. Collection isdeemed probable if, based upon the Company’s evaluation, the Company expects that the customerwill be able to pay amounts under the arrangement as payments become due. If the Companydetermines that collection is not probable, revenue is deferred and recognized upon the receipt ofcash.
A substantial amount of the Company’s sales involve multiple element arrangements, such asproducts, maintenance, professional services, and training. When arrangements include multiple elements,the Company allocates the total fee among the various elements using the residual method. Under theresidual method, revenue is recognized when vendor specific objective evidence (VSOE) of fair valueexists for all of the undelivered elements of the arrangement, but does not exist for one or more of thedelivered elements of the arrangement. Each arrangement requires the Company to analyze the individualelements in the transaction and to estimate the fair value of each undelivered element, which typicallyrepresents maintenance and services. Revenue is allocated to each of the undelivered elements based onits respective fair value, with the fair value determined by the price charged when that element is soldseparately.
Maintenance, support, and service revenue include sales of maintenance and other services, includingprofessional services, training, and reimbursable travel.
Maintenance and support services include telephone support, return and repair services, andunspecified rights to product upgrades and enhancements, and are recognized ratably over the term of theservice period, which is generally 12 months. Maintenance and support revenue is generally deferred untilthe related product has been accepted and all other revenue recognition criteria have been met.
Professional services and training revenue is recognized as the related service has been performed.
The Company’s products and services are distributed indirectly through distribution partners anddirectly through the Company’s sales force. Revenue arrangements with distribution partners arerecognized when the above criteria are met and only when the Company receives evidence that thedistribution partner has an order from an end-user customer. The Company typically does not offercontractual rights of return, stock balancing or price protection to its distribution partners, and actualproduct returns from them have been insignificant to date. As a result, the Company does not maintainreserves for product returns and related allowances.
In accordance with EITF Issue No. 00-10, Accounting for Shipping and Handling Fees, the Companyhas classified the reimbursement by customers of shipping and handling costs as revenue and theassociated cost as cost of revenue. Reimbursed shipping and handling costs, included in service revenueand costs of service revenue totaled approximately $82, $32 and $29 for the years ended December 31,2006, 2005 and 2004, respectively.
In accordance with EITF Issue No. 01-14, Income Statement Characterization of ReimbursementsReceived for “Out-of-Pocket” Expenses Incurred, the Company included approximately $516, $165 and $44of out-of-pocket expenses in service revenue and cost of service revenue in the years ended December 31,2006, 2005 and 2004, respectively.

68
Allowance for Doubtful Accounts
The Company reduces gross trade accounts receivable by an allowance for doubtful accounts. Theallowance for doubtful accounts is the Company’s best estimate of the amount of probable credit losses inthe Company’s existing accounts receivable. The Company reviews its allowance for doubtful accounts on aregular basis and all past due balances are reviewed individually for collectibility. Account balances arecharged off against the allowance after all means of collection have been exhausted and the potential forrecovery is considered remote. Provisions for allowance for doubtful accounts are recorded in general andadministrative expenses.
Below is a summary of the changes in the Company’s allowance for doubtful accounts for the yearsended December 31, 2006, 2005 and 2004.
Balance atBeginning of
Period Provision Write-offs
Balance atEnd ofPeriod
Year Ended December 31, 2006 . . . . . . . . . . . . . . . . . . . . . . . $433 $343 $ (81) $695Year Ended December 31, 2005 . . . . . . . . . . . . . . . . . . . . . . . 131 410 (108) 433Year Ended December 31, 2004 . . . . . . . . . . . . . . . . . . . . . . . 51 94 (14) 131
Inventory
Inventory is stated at the lower of cost, determined on a first-in, first-out basis, or market, and consistsprimarily of finished products.
The Company provides for inventory losses based on obsolescence and levels in excess of forecasteddemand. In these cases, inventory is reduced to estimated realizable value based on historical usage andexpected demand. Inherent in the Company’s estimates of market value in determining inventory valuationare estimates related to economic trends, future demand for the Company’s products, and technicalobsolescence of products.
When products have been delivered, but the product revenue associated with the arrangement hasbeen deferred as a result of not meeting the revenue recognition criteria required by SOP 97-2, theCompany includes the costs for the delivered items in inventory until recognition of the related revenueoccurs.
Property and Equipment
Property and equipment is stated at cost. Depreciation and amortization is expensed using thestraight-line method over the estimated useful lives of the assets as follows:
Assets Classification Estimated Useful LifeComputer hardware and software 3 years
Furniture and fixtures 3 years
Office and engineering equipment 3 years
Evaluation systems 2 years
Leasehold improvements Shorter of asset’s useful life orremaining life of the lease
Evaluation systems are carried at the lower of their depreciated value or their net realizable value.
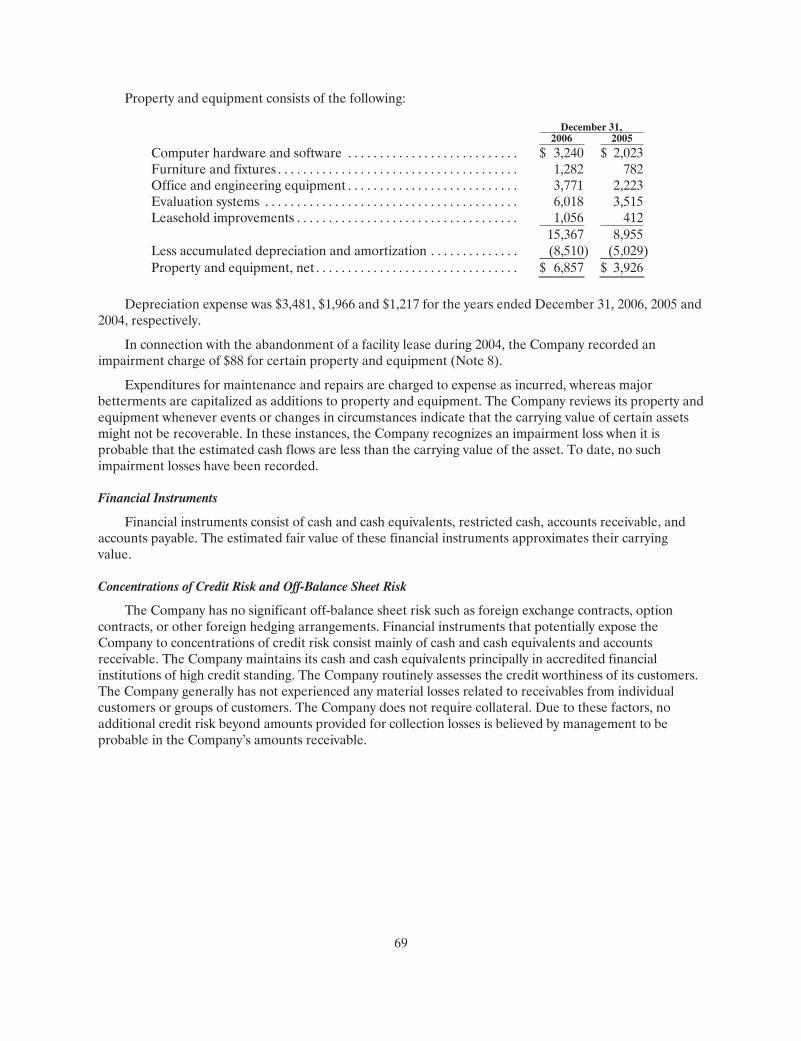
69
Property and equipment consists of the following:
December 31,2006 2005
Computer hardware and software . . . . . . . . . . . . . . . . . . . . . . . . . . . $ 3,240 $ 2,023Furniture and fixtures . . . . . . . . . . . . . . . . . . . . . . . . . . . . . . . . . . . . . . 1,282 782Office and engineering equipment . . . . . . . . . . . . . . . . . . . . . . . . . . . 3,771 2,223Evaluation systems . . . . . . . . . . . . . . . . . . . . . . . . . . . . . . . . . . . . . . . . 6,018 3,515Leasehold improvements . . . . . . . . . . . . . . . . . . . . . . . . . . . . . . . . . . . 1,056 412
15,367 8,955Less accumulated depreciation and amortization . . . . . . . . . . . . . . (8,510) (5,029)Property and equipment, net . . . . . . . . . . . . . . . . . . . . . . . . . . . . . . . . $ 6,857 $ 3,926
Depreciation expense was $3,481, $1,966 and $1,217 for the years ended December 31, 2006, 2005 and2004, respectively.
In connection with the abandonment of a facility lease during 2004, the Company recorded animpairment charge of $88 for certain property and equipment (Note 8).
Expenditures for maintenance and repairs are charged to expense as incurred, whereas majorbetterments are capitalized as additions to property and equipment. The Company reviews its property andequipment whenever events or changes in circumstances indicate that the carrying value of certain assetsmight not be recoverable. In these instances, the Company recognizes an impairment loss when it isprobable that the estimated cash flows are less than the carrying value of the asset. To date, no suchimpairment losses have been recorded.
Financial Instruments
Financial instruments consist of cash and cash equivalents, restricted cash, accounts receivable, andaccounts payable. The estimated fair value of these financial instruments approximates their carryingvalue.
Concentrations of Credit Risk and Off-Balance Sheet Risk
The Company has no significant off-balance sheet risk such as foreign exchange contracts, optioncontracts, or other foreign hedging arrangements. Financial instruments that potentially expose theCompany to concentrations of credit risk consist mainly of cash and cash equivalents and accountsreceivable. The Company maintains its cash and cash equivalents principally in accredited financialinstitutions of high credit standing. The Company routinely assesses the credit worthiness of its customers.The Company generally has not experienced any material losses related to receivables from individualcustomers or groups of customers. The Company does not require collateral. Due to these factors, noadditional credit risk beyond amounts provided for collection losses is believed by management to beprobable in the Company’s amounts receivable.
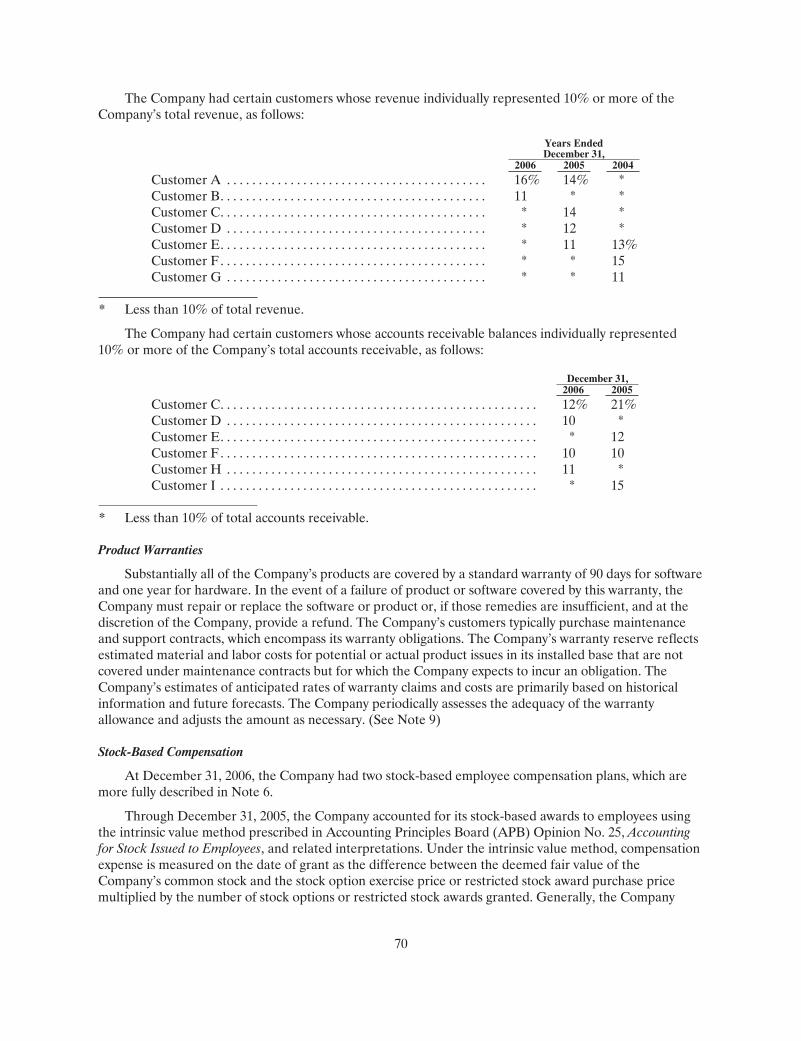
70
The Company had certain customers whose revenue individually represented 10% or more of theCompany’s total revenue, as follows:
Years EndedDecember 31,
2006 2005 2004Customer A . . . . . . . . . . . . . . . . . . . . . . . . . . . . . . . . . . . . . . . . . 16% 14% *Customer B. . . . . . . . . . . . . . . . . . . . . . . . . . . . . . . . . . . . . . . . . . 11 * *Customer C. . . . . . . . . . . . . . . . . . . . . . . . . . . . . . . . . . . . . . . . . . * 14 *Customer D . . . . . . . . . . . . . . . . . . . . . . . . . . . . . . . . . . . . . . . . . * 12 *Customer E. . . . . . . . . . . . . . . . . . . . . . . . . . . . . . . . . . . . . . . . . . * 11 13%Customer F . . . . . . . . . . . . . . . . . . . . . . . . . . . . . . . . . . . . . . . . . . * * 15Customer G . . . . . . . . . . . . . . . . . . . . . . . . . . . . . . . . . . . . . . . . . * * 11
* Less than 10% of total revenue.
The Company had certain customers whose accounts receivable balances individually represented10% or more of the Company’s total accounts receivable, as follows:
December 31,2006 2005
Customer C. . . . . . . . . . . . . . . . . . . . . . . . . . . . . . . . . . . . . . . . . . . . . . . . . . 12% 21%Customer D . . . . . . . . . . . . . . . . . . . . . . . . . . . . . . . . . . . . . . . . . . . . . . . . . 10 *Customer E. . . . . . . . . . . . . . . . . . . . . . . . . . . . . . . . . . . . . . . . . . . . . . . . . . * 12Customer F . . . . . . . . . . . . . . . . . . . . . . . . . . . . . . . . . . . . . . . . . . . . . . . . . . 10 10Customer H . . . . . . . . . . . . . . . . . . . . . . . . . . . . . . . . . . . . . . . . . . . . . . . . . 11 *Customer I . . . . . . . . . . . . . . . . . . . . . . . . . . . . . . . . . . . . . . . . . . . . . . . . . . * 15
* Less than 10% of total accounts receivable.
Product Warranties
Substantially all of the Company’s products are covered by a standard warranty of 90 days for softwareand one year for hardware. In the event of a failure of product or software covered by this warranty, theCompany must repair or replace the software or product or, if those remedies are insufficient, and at thediscretion of the Company, provide a refund. The Company’s customers typically purchase maintenanceand support contracts, which encompass its warranty obligations. The Company’s warranty reserve reflectsestimated material and labor costs for potential or actual product issues in its installed base that are notcovered under maintenance contracts but for which the Company expects to incur an obligation. TheCompany’s estimates of anticipated rates of warranty claims and costs are primarily based on historicalinformation and future forecasts. The Company periodically assesses the adequacy of the warrantyallowance and adjusts the amount as necessary. (See Note 9)
Stock-Based Compensation
At December 31, 2006, the Company had two stock-based employee compensation plans, which aremore fully described in Note 6.
Through December 31, 2005, the Company accounted for its stock-based awards to employees usingthe intrinsic value method prescribed in Accounting Principles Board (APB) Opinion No. 25, Accountingfor Stock Issued to Employees, and related interpretations. Under the intrinsic value method, compensationexpense is measured on the date of grant as the difference between the deemed fair value of theCompany’s common stock and the stock option exercise price or restricted stock award purchase pricemultiplied by the number of stock options or restricted stock awards granted. Generally, the Company

71
grants stock-based awards with exercise prices equal to the estimated fair value of its common stock;however, to the extent that the deemed fair value of the common stock exceeds the exercise or purchaseprice of stock-based awards granted to employees on the date of grant, the Company amortizes theexpense over the vesting schedule of the awards, generally four years. The fair value of the Company’scommon stock is determined by the Company’s Board of Directors (the Board).
Given the absence of a public market for the Company’s common stock prior to the completion of theCompany’s initial public offering (IPO), the fair value for the Company’s common stock was estimated bythe Board, with input from management. The Board exercised judgment in determining the estimated fairvalue of the Company’s common stock on the date of grant based on several factors, including theliquidation preferences, dividend rights and voting control attributable to the Company’s then-outstandingconvertible preferred stock and, primarily, the likelihood of achieving a liquidity event such as an initialpublic offering or sale of the Company. In the absence of a public trading market for the Company’scommon stock, the Board considered objective and subjective factors in determining the fair value of theCompany’s common stock. The Company believes this to have been a reasonable methodology based uponthe Company’s internal peer company analyses and based on several arm’s-length transactions involvingthe Company’s common stock supportive of the results produced by this valuation methodology.
On December 16, 2004 the Financial Accounting Standards Board (FASB) issued Statement ofFinancial Accounting Standards (SFAS) No. 123(R), Share-Based Payment, which is a revision of SFASNo. 123, Accounting for Stock-Based Compensation. SFAS No. 123(R) supersedes APB Opinion No. 25,and amends SFAS No. 95, Statement of Cash Flows. Generally, the approach under SFAS No. 123(R) issimilar to the approach described in SFAS No. 123. However, SFAS No. 123(R) requires all share-basedpayments to employees, including grants of employee stock options, to be recognized in the incomestatement based on their fair values. Pro forma disclosure is no longer an alternative.
SFAS No. 123(R) must be adopted for fiscal years starting after June 15, 2005. As a result, theCompany adopted SFAS No. 123(R) starting in its fiscal first quarter of 2006, which began on January 1,2006.
SFAS No. 123(R) requires nonpublic companies that used the minimum value method under SFASNo. 123 for either recognition or pro forma disclosures to apply SFAS No. 123(R) using the prospective-transition method. As such, the Company will continue to apply APB Opinion No. 25 in future periods toequity awards outstanding at the date of SFAS No. 123(R)’s adoption that were measured using theminimum value method. In accordance with the requirements of SFAS No. 123(R), the Company will notpresent pro forma disclosures for periods prior to the adoption of SFAS No. 123(R) as the estimated fairvalue of the Company’s stock options granted through December 31, 2005 was determined using theminimum value method.
Effective with the adoption of SFAS No. 123(R), the Company has elected to use the Black-Scholesoption pricing model to determine the weighted average fair value of stock options granted. In accordancewith SFAS No. 123(R), the Company will recognize the compensation cost of stock-based awards on astraight-line basis over the vesting period of the award.
As there was no public market for its common stock prior to October 13, 2006, the effective date ofthe Company’s IPO, the Company determined the volatility for options granted in 2006 based on ananalysis of reported data for a peer group of companies that issued options with substantially similar terms.The expected volatility of options granted has been determined using an average of the historical volatilitymeasures of this peer group of companies. The expected life of options has been determined utilizing the“simplified” method as prescribed by the SEC’s Staff Accounting Bulletin No. 107, Share-Based Payment.The risk-free interest rate is based on a treasury instrument whose term is consistent with the expected lifeof the stock options. The Company has not paid and does not anticipate paying cash dividends on itscommon stock; therefore, the expected dividend yield is assumed to be zero. In addition, SFAS

72
No. 123(R) requires companies to utilize an estimated forfeiture rate when calculating the expense for theperiod, whereas, SFAS No. 123 permitted companies to record forfeitures based on actual forfeitures,which was the Company’s historical policy under SFAS No. 123. As a result, the Company applied anestimated forfeiture rate of 11.25% for the year ended December 31, 2006 in determining the expenserecorded in the accompanying consolidated statement of operations. The weighted-average assumptionsutilized to determine such values are presented in the following table:
Year EndedDecember 31, 2006
Risk-free interest rate . . . . . . . . . . . . . . . . . . . . . . . . . . . . . . . . . . . . . . . . . 4.79%Expected volatility . . . . . . . . . . . . . . . . . . . . . . . . . . . . . . . . . . . . . . . . . . . . 81.44%Expected life. . . . . . . . . . . . . . . . . . . . . . . . . . . . . . . . . . . . . . . . . . . . . . . . . 6.25 yearsDividend yield . . . . . . . . . . . . . . . . . . . . . . . . . . . . . . . . . . . . . . . . . . . . . . . —
The weighted-average fair value of options granted during the year ended December 31, 2006 was$5.43.
In connection with the preparation for the Company’s IPO, the Company reassessed the valuations ofits common stock during 2006 and 2005, in light of the AICPA’s Practice Aid, Valuation of Privately-Held-Company Equity Securities Issued as Compensation. As a result, the Company reassessed the fair value of itscommon stock as of December 14, 2005, December 23, 2005, February 7, 2006 and March 15, 2006.
Based on these reassessments, the Company is required to recognize compensation expense of $821 toreflect the difference between the reassessed fair value of the Company’s common stock and the grantprice for the stock-based awards granted on December 14, 2005 and December 23, 2005 and an amountequal to the difference between the value calculated using the Black-Scholes option pricing model with theinitial assessment of fair value of common stock and the value calculated using the Black-Scholes optionpricing model with the reassessed fair value of common stock for the stock-based awards granted onFebruary 7, 2006 and March 22, 2006. The compensation expense is being recognized over the vestingschedule of the awards commencing in the three month period ended September 30, 2006. As a result ofthese reassessments, the Company recognized compensation expense of $202 during the year endedDecember 31, 2006.
Including stock-based compensation expense related to the reassessment of the fair value of theCompany’s common stock, for the year ended December 31, 2006, the Company recorded stock-basedcompensation expense of approximately $867 in connection with stock-based payment awards. As ofDecember 31 2006, there was $6.9 million of unrecognized compensation expense related to non-vestedstock option awards that is expected to be recognized over a weighted-average period of 3.45 years.
The Company accounts for transactions in which services are received from nonemployees inexchange for equity instruments based on the fair value of such services received or of the equityinstruments issued, whichever is more reliably measured, in accordance with SFAS No. 123(R), and EITFIssue No. 96-18, Accounting for Equity Instruments That Are Issued to Other Than Employees for Acquiring,or in Conjunction With Selling, Goods or Services. During 2004, the Company granted 8,237 shares ofrestricted common stock to nonemployees which, using the Black-Scholes valuation model, resulted incharges of $2 for the year ended December 31, 2004. There were no stock-based awards made to non-employees in the years ended December 31, 2006 or 2005.
See Note 6 for a summary of the stock option activity under the Company’s stock-based employeecompensation plans for the years ended December 31, 2006, 2005 and 2004.

73
Research and Development
Research and development expense includes costs incurred to develop intellectual property and arecharged to expense as incurred. The costs for the development of new software and substantialenhancements to existing software are expensed as incurred until technological feasibility has beenestablished, at which time any additional costs would be capitalized. The Company has determined thattechnological feasibility is established at the time a working model of software is completed. Because theCompany believes its current process for developing software will be essentially completed concurrentlywith the establishment of technological feasibility, no costs have been capitalized to date.
Comprehensive Income (Loss)
SFAS No. 130, Reporting Comprehensive Income, establishes standards for reporting and displayingcomprehensive income (loss) and its components in financial statements. Comprehensive income (loss) isdefined as the change in stockholders’ equity of a business enterprise during a period from transactionsand other events and circumstances from nonowner sources. The comprehensive income (loss) for allperiods presented does not differ from the net reported income (loss).
Net Income (Loss) Per Share
The Company calculates net income (loss) per share in accordance with SFAS No. 128, Earnings PerShare, as clarified by EITF Issue No. 03-6, Participating Securities and the Two-Class Method Under FASBStatement No. 128, Earnings Per Share. EITF Issue No. 03-6 clarifies the use of the “two-class” method ofcalculating earnings per share as originally prescribed in SFAS No. 128. Effective for periods beginningafter March 31, 2004, EITF Issue No. 03-6 provides guidance on how to determine whether a securityshould be considered a “participating security” for purposes of computing earnings per share and howearnings should be allocated to a participating security when using the two-class method for computingbasic earnings per share. The Company has determined that its convertible preferred stock represents aparticipating security and therefore has adopted the provisions of EITF Issue No. 03-6 retroactively for allperiods presented.
Under the two-class method, basic net income (loss) per share is computed by dividing the net income(loss) applicable to common stockholders by the weighted-average number of common shares outstandingfor the fiscal period. Diluted net income (loss) per share is computed using the more dilutive of (a) thetwo-class method or (b) the if-converted method. The Company allocates net income first to preferredstockholders based on dividend rights under the Company’s charter and then to common stockholdersbased on ownership interests. Net losses are not allocated to preferred stockholders. Diluted net income(loss) per share gives effect to all potentially dilutive securities, including stock options using the treasurystock method. For the years ended December 31, 2005 and 2004, the Company incurred net losses. Assuch, the two-class method was not applicable. For the year ended December 31, 2006, the Company hasused the if-converted method to compute net income per share as the effect was more dilutive than thetwo-class method. Accordingly, the Company has not allocated net income to the preferred stockholdersfor purposes of the net income per share calculation for the year ended December 31, 2006.

74
A reconciliation of the denominator used in the calculation of basic and diluted net income (loss) pershare is as follows:
Years Ended December 31,2006 2005 2004
Numerator:Net income (loss) . . . . . . . . . . . . . . . . . . . . . . . . . . . . . . . . . . . $ 28,864 $ (35) $ (6,957)
Denominator:Weighted-average shares of common stock outstanding. . 50,734,071 15,751,142 15,331,381Less: Weighted-average number of unvested restricted
common shares outstanding. . . . . . . . . . . . . . . . . . . . . . . . (296,270) (510,252) (598,784)Weighted-average number of common shares used in
calculating basic net income (loss) per common share . 50,437,801 15,240,890 14,732,597Weighted-average number of common shares issuable
upon exercise of outstanding stock options, based ontreasury stock method . . . . . . . . . . . . . . . . . . . . . . . . . . . . . 6,559,725 — —
Weighted-average number of unvested restricted commonshares outstanding . . . . . . . . . . . . . . . . . . . . . . . . . . . . . . . . 296,270 — —
Weighted-average number of common shares issuableupon exercise of common stock warrant . . . . . . . . . . . . . 125,000 — —
Weighted-average number of common shares used incomputing diluted net income (loss) per common share. . 57,418,796 15,240,890 14,732,597
Net income (loss) per common share:Basic . . . . . . . . . . . . . . . . . . . . . . . . . . . . . . . . . . . . . . . . . . . . . . $ 0.57 (0.00) (0.47)
Diluted: . . . . . . . . . . . . . . . . . . . . . . . . . . . . . . . . . . . . . . . . . . . $ 0.50 (0.00) (0.47)
The following weighted-average common share equivalents have been excluded from the computationof diluted weighted-average shares outstanding as of December 31, 2006, 2005 and 2004, respectively, astheir effect would have been be antidilutive:
As of December 31,2006 2005 2004
Participating convertible preferred stock . . . . . . . — 32,190,359 28,663,877Options outstanding, based on treasury stock
method . . . . . . . . . . . . . . . . . . . . . . . . . . . . . . . . . . 260,753 1,775,672 511,472Warrants . . . . . . . . . . . . . . . . . . . . . . . . . . . . . . . . . . . — 125,000 125,000
Impairment of Long-Lived Assets
The Company accounts for its long-lived assets in accordance with SFAS No. 144, Accounting for theImpairment or Disposal of Long-Lived Assets. This statement requires that long-lived assets and certainidentifiable intangible assets be reviewed for impairment whenever events or changes in circumstancesindicate that the carrying amount of the asset may not be recoverable. Any write-downs are treated aspermanent reductions in the carrying amount of the assets. Based on this evaluation, the Company believesthat, as of each of the balance sheet dates presented, none of the Company’s long-lived assets wereimpaired.
Capitalized Internal-Use Software
The Company capitalizes certain costs incurred to purchase or create internal-use software inaccordance with SOP 98-1, Accounting for the Costs of Computer Software Developed or Obtained for
75
Internal Use. To date, such costs have included external direct costs of materials and services consumed inobtaining internal-use software and are included within computer hardware and software. Once thecapitalization criteria of SOP 98-1 have been met, such costs are classified as software and are amortizedon a straight-line basis over three years once the software has been put into use. Subsequent additions,modifications, or upgrades to internal-use software are capitalized only to the extent that they allow thesoftware to perform a task it previously did not perform. Software maintenance and training costs areexpensed in the period in which they are incurred.
Foreign Currency Translation
The financial statements of the Company’s foreign subsidiaries are translated in accordance withSFAS No. 52, Foreign Currency Translation. The functional currency of the Company’s foreign subsidiariesin the United Kingdom, Japan, and Hong Kong is the U.S. dollar. Accordingly, all assets and liabilities ofthese foreign subsidiaries are remeasured into U.S. dollars using the exchange rates in effect at the balancesheet date. Revenue and expenses of these foreign subsidiaries are remeasured into U.S. dollars at theaverage rates in effect during the year. Any differences resulting from the remeasurement of assets,liabilities, and operations of the United Kingdom, Japan, and Hong Kong subsidiaries are recorded withinother income (expense) in the consolidated statements of operations. During the years endedDecember 31, 2006 and 2005 the Company recorded foreign currency losses of $17, and $36, respectively,in other income (expense). During the year ended December 31, 2004, foreign currency gains (losses) werenot material.
Income Taxes
The Company accounts for income taxes in accordance with SFAS No. 109, Accounting for IncomeTaxes, which is the asset and liability method for accounting and reporting for income taxes. Under SFASNo. 109, deferred tax assets and liabilities are recognized based on temporary differences between thefinancial reporting and income tax bases of assets and liabilities using statutory rates. In addition, SFASNo. 109 requires a valuation allowance against net deferred tax assets if, based upon the availableevidence, it is more likely than not that some or all of the deferred tax assets will not be realized.
Advertising Expense
Advertising expense primarily includes promotional expenditures and is expensed as incurred, as suchefforts have not met the direct-response criteria required for capitalization. Amounts incurred foradvertising expense were not material for the years ended December 31, 2006, 2005, and 2004.
Recent Accounting Pronouncements
In July 2006, the FASB issued Financial Accounting Standards Interpretation (FIN) No. 48,Accounting for Uncertainty in Income Taxes, which is an interpretation of SFAS No. 109. FIN 48 clarifiesthe accounting for income taxes by prescribing the minimum recognition threshold a tax position isrequired to meet before being recognized in the financial statements. FIN 48 also provides guidance onderecognition, measurement, classification, interest and penalties, accounting in interim periods,disclosure and transition. In addition, FIN 48 clearly scopes out income taxes from SFAS No. 5, Accountingfor Contingencies. FIN 48 is effective for fiscal years beginning after December 15, 2006. The Company willimplement this interpretation in the fiscal year starting January 1, 2007. The Company is currentlyanalyzing the effect, if any, FIN 48 will have on its consolidated financial position and our results ofoperations
In September 2006, FASB issued SFAS No. 157, Fair Value Measurements, which defines fair value,establishes a framework for measuring fair value under generally accepted accounting principles, and

76
expands disclosures about fair value measurements. SFAS No. 157 applies to other accountingpronouncements that require or permit fair value measurements. The new guidance is effective forfinancial statements issued for fiscal years beginning after November 15, 2007, and for interim periodswithin those fiscal years. The Company is currently analyzing the effect, if any, SFAS No. 157 will have onits consolidated financial position and results of operations.
In September 2006, the United States Securities and Exchange Commission issued Staff AccountingBulletin (SAB) No. 108, Considering the Effects of Prior Year Misstatements when Quantifying Misstatementsin Current Year Financial Statements. SAB 108 provides guidance on the consideration of the effects ofprior year misstatements in quantifying current year misstatements for the purpose of a materialityassessment. SAB 108 establishes an approach that requires quantification of financial statement errorsbased on the effects of each of the company’s balance sheet and statement of operations financialstatements and the related financial statement disclosures. The SAB permits existing public companies torecord the cumulative effect of initially applying this approach in the first year ending after November 15,2006 by recording the necessary correcting adjustments to the carrying values of assets and liabilities as ofthe beginning of that year with the offsetting adjustment recorded to the opening balance of retainedearnings. Additionally, the use of the cumulative effect transition method requires detailed disclosure ofthe nature and amount of each individual error being corrected through the cumulative adjustment andhow and when it arose. The adoption of SAB 108 did not have a material impact on the Company’sconsolidated financial position, results of operations or liquidity.
3. Debt
On June 22, 2001, the Company entered into a $1,000 capital expenditure line of credit (the CapitalEquipment Line). The Capital Equipment Line was modified in August 2002, to increase the amountavailable to $1,750. Outstanding amounts under the Capital Equipment Line accrued interest at the bank’sprime rate plus 3.25% - 3.50% at the funding date of each advance. Any advances from the CapitalEquipment Line were payable in equal payments over 36-consecutive months commencing on the fundingday. The Capital Equipment Line was collateralized by all business assets of the Company and expired onMarch 31, 2003, at which time the amounts outstanding converted into a term loan payable. During theyear ended December 31, 2005, the Company paid all amounts owed under the Capital Equipment Line.There were no amounts outstanding as of December 31, 2006 or 2005.
4. Income Taxes
Income before the benefit from income taxes consists of the following:
Years Ended December 31,2006 2005 2004
Domestic . . . . . . . . . . . . . . . . . . . . . . . . . . . . . . . . . . . . . . . . . $25,185 $(60) $(6,957)Foreign . . . . . . . . . . . . . . . . . . . . . . . . . . . . . . . . . . . . . . . . . . 236 25 —Total. . . . . . . . . . . . . . . . . . . . . . . . . . . . . . . . . . . . . . . . . . . . . $25,421 $(35) $(6,957)

77
The benefit from income taxes in the accompanying consolidated financial statements consists of thefollowing:
Years Ended December 31,2006 2005 2004
Current provision:Federal . . . . . . . . . . . . . . . . . . . . . . . . . . . . . . . . . . . . . . . . . . . . $ 1,115 $— $—State. . . . . . . . . . . . . . . . . . . . . . . . . . . . . . . . . . . . . . . . . . . . . . . 159 — —Foreign . . . . . . . . . . . . . . . . . . . . . . . . . . . . . . . . . . . . . . . . . . . . 63 — —
Total . . . . . . . . . . . . . . . . . . . . . . . . . . . . . . . . . . . . . . . . . . . . $ 1,337 $— $—
Deferred benefit:Federal . . . . . . . . . . . . . . . . . . . . . . . . . . . . . . . . . . . . . . . . . . . . $(3,361) $— $—State. . . . . . . . . . . . . . . . . . . . . . . . . . . . . . . . . . . . . . . . . . . . . . . (1,419) — —Foreign . . . . . . . . . . . . . . . . . . . . . . . . . . . . . . . . . . . . . . . . . . . . — — —
Total . . . . . . . . . . . . . . . . . . . . . . . . . . . . . . . . . . . . . . . . . . . . $(4,780) $— $—Total benefit: . . . . . . . . . . . . . . . . . . . . . . . . . . . . . . . . . . . . . $(3,443) $— $—
A reconciliation of the U.S. federal statutory rate to the Company’s effective tax rate is as follows:
Years Ended December 31,2006 2005 2004
U.S. federal statutory rate . . . . . . . . . . . . . . . . . . . . . . . . . . . . 35.0% (34.0)% (34.0)%State taxes, net . . . . . . . . . . . . . . . . . . . . . . . . . . . . . . . . . . . . . . 0.4 (6.3) (6.3)Permanent differences . . . . . . . . . . . . . . . . . . . . . . . . . . . . . . . 1.4 — 0.5Research and development tax credits. . . . . . . . . . . . . . . . . . (2.8) — —Change in valuation allowance . . . . . . . . . . . . . . . . . . . . . . . . (47.5) 40.3 39.8Effective tax rate . . . . . . . . . . . . . . . . . . . . . . . . . . . . . . . . . . . . (13.5)% 0.0% 0.0%
Significant components of the Company’s deferred tax assets and liabilities for income taxes consistedof the following at December 31, 2006 and 2005:
December 31,2006 2005
Net operating loss and credit carryforwards . . . . . . . . . . . . . . . . . . . $1,543 $ 9,410Start-up costs, net of amortization . . . . . . . . . . . . . . . . . . . . . . . . . . . 654 1,339Other temporary differences . . . . . . . . . . . . . . . . . . . . . . . . . . . . . . . . 1,258 756Sales tax accrual . . . . . . . . . . . . . . . . . . . . . . . . . . . . . . . . . . . . . . . . . . . 587 426Inventory and warranty allowances . . . . . . . . . . . . . . . . . . . . . . . . . . 738 491Restructuring loss provisions. . . . . . . . . . . . . . . . . . . . . . . . . . . . . . . . — 84Valuation allowance . . . . . . . . . . . . . . . . . . . . . . . . . . . . . . . . . . . . . . . — (12,506)Net deferred tax asset . . . . . . . . . . . . . . . . . . . . . . . . . . . . . . . . . . . . . . $4,780 $ —
The Company is required to compute income tax expense in each jurisdiction in which it operates.This process requires the Company to project its current tax liability and estimate its deferred tax assetsand liabilities, including net operating loss (NOL) and tax credit carryforwards. In assessing the need for avaluation allowance, the Company considered its recent operating results, future taxable incomeprojections and feasible tax planning strategies. In the year ended December 31, 2005, due to uncertaintysurrounding the Company’s ability to utilize its remaining NOL and credit carryforwards and otherdeferred tax assets, the Company provided a full valuation allowance against its otherwise remainingrecognizable deferred tax assets. In the year ended December 31, 2006, the Company utilized a substantial

78
portion of its NOL carryforwards to reduce income taxes currently payable and determined that it wasmore likely than not that the Company would realize all of its remaining deferred tax assets. Therefore, theCompany reduced the valuation allowance related to these deferred tax assets of $4,780 in December 2006.The benefit of the release of the valuation allowance was realized through a reduction of income taxexpense.
As of December 31, 2006, the Company had U.S. federal research and development tax credits of$979 that expire beginning in 2023, and state research and development tax credits of $868 that expirebeginning in 2019, and are both subject to review and possible adjustment by the taxing authorities. TheInternal Revenue Code contains provisions that limit the net operating losses and tax credit carryforwardsavailable to be used in any given year in the event of certain circumstances, including significant changes inownership interests, as defined.
The Company’s current intention is to reinvest the total amount of its unremitted earnings in the localjurisdiction or to repatriate the earnings only when tax-effective. As such, the Company has not providedfor U.S. taxes on the unremitted earnings of its foreign subsidiaries.
5. Stockholders’ Equity
As of December 31, 2005, the authorized capital stock of the Company was 61,000,000 shares ofcommon stock, $0.001 par value per share, and 33,248,852 shares of convertible preferred stock, $0.001 parvalue per share, of which 3,759,531 shares are designated Series A convertible preferred stock (Series APreferred Stock), 21,467,931 shares are designated Series B convertible preferred stock (Series B PreferredStock), and 8,021,390 shares are designated Series C convertible preferred stock (Series C PreferredStock).
In September 2006, the Board of Directors approved an amendment and restatement of theCompany’s Certificate of Incorporation to increase the authorized number of shares of common stockfrom 61,000,000 to 150,000,000, to authorize 5,000,000 shares of undesignated preferred stock, par value$0.001 per share, and to eliminate all reference to the designated Series Preferred Stock.
On October 13, 2006, the Company completed its IPO of common stock in which the Company soldand issued 9,721,179 shares of the Company’s common stock, including 1,721,179 shares sold by theCompany pursuant to the underwriters’ full exercise of their over-allotment option, at an issue price of$9.50 per share. The Company raised a total of $92.4 million in gross proceeds from the IPO, or $83.2million in net proceeds after deducting underwriting discounts and commissions of $6.5 million and otherestimated offering costs of approximately $2.7 million. Upon the closing of the IPO, all shares ofconvertible preferred stock outstanding automatically converted into 32,190,359 shares of common stock.
Restricted Stock
During 2001, the Board established a Stock Restriction and Repurchase Agreement for keyemployees and consultants to the Company. Under the terms of the agreement, shares of common stockissued or sold to an employee or consultant are subject to a vesting schedule commencing on the dateshares are distributed to the employee. Vesting occurs periodically at specified time intervals and specifiedpercentages. All shares of common stock become fully vested within four years of the date of distribution.As of December 31, 2006, the Company had issued and outstanding 1,800,151 shares of common stockunder the Stock Restriction and Repurchase Agreement. As of December 31, 2006, 1,582,886 of theseshares were vested.

79
Warrants
In connection with the Capital Equipment Line, the Company issued a warrant to the lender topurchase up to 125,000 shares of Series B Preferred Stock at an exercise price of $1.39 per share. Uponcompletion of the Company’s IPO in October 2006, these warrants automatically converted into warrantsto purchase shares of the Company’s common stock. Upon their issuance, the Company valued the warrantusing the Black-Scholes option-pricing model and recorded the value of the warrant of $14 as interestexpense for the year ended December 31, 2003. At December 31, 2006, there were 125,000 shares of theCompany’s common stock reserved for the exercise of the warrant. The warrant expires on June 22, 2011.
6. Stock Option Plans
In August 2000, the Company adopted the Acme Packet, Inc. 2000 Equity Incentive Plan (the 2000Plan) under which it may grant incentive stock options (ISOs), nonqualified stock options (NSOs),restricted stock, and stock grants to purchase up to 3,000,000 shares of common stock. Under the2000 Plan, ISOs may not be granted at less than fair market value on the date of the grant and all optionsgenerally vest over a four-year period and certain options are subject to accelerated vesting based oncertain future events. These options expire ten years after the grant date. Employees are allowed toexercise their unvested options in exchange for restricted stock subject to repurchase by the Company. Therepurchase rights lapse on the same vesting schedule as the original options. In 2006, 2005, 2004 and 2003,the Company increased the number of shares available under the 2000 Plan by an additional 1,200,000,4,000,000, 2,000,000 and 2,000,000 shares, respectively, to a total of 12,200,000 shares. In September 2006,the Board approved the amended and restated 2000 Equity Incentive Plan, which was approved by thestockholders on September 19, 2006 and became effective upon the consummation of the IPO. Effectiveupon the consummation of the IPO, no further awards will be made pursuant to the 2000 Plan, but anyoutstanding awards under the 2000 Plan will remain in effect and will continue to be subject to the terms ofthe 2000 Plan.
In September 2006, the Company’s Board of Directors (the Board) approved the 2006 EquityIncentive Plan, which was approved by the stockholders on September 19, 2006 and became effective uponthe consummation of the Company’s IPO. The 2006 Equity Incentive Plan allows the Company to grantISOs, NSOs, restricted stock, and stock grants to employees, consultants, and directors of the Company.Under the 2006 Equity Incentive Plan, stock options may not be granted at less than fair market value onthe date of grant, and all options generally vest over a four-year period. These options expire ten yearsafter the grant date. The Company has reserved for issuance an aggregate of 3,000,000 shares of commonstock under the 2006 Equity Incentive Plan plus an additional annual increase to be added automaticallyon January 1 of each year, from 2006 and until 2016, equal to the lesser of (i) 3,000,000 shares of commonstock or (ii) five percent of the Company’s outstanding equity on a fully diluted basis as of the end of theimmediately preceding fiscal year. As of December 31, 2006, 2,672,500 shares were available for futureissuance under the 2006 Equity Incentive Plan.
In September 2006, the Board approved the 2006 Director Option Plan, which was approved by thestockholders on September 19, 2006 and became effective upon the consummation of the Company’s IPO.Under the 2006 Director Plan, no options may be granted to eligible directors at less than fair market valueon the date of grant, and all options will vest over a one year period from the grant date. These optionsexpire ten years after the grant date. The Company has reserved for issuance an aggregate of 300,000shares of common stock under the 2006 Director Plan plus an additional annual increase to be addedautomatically on January 1 of each year of 75,000 shares of common stock. The Board may waive theannual increases, in whole or in part. As of December 31, 2006, 300,000 shares were available for futureissuance under the 2006 Director Option Plan.

80
The Company’s stock option activity for the three years ended December 31, 2006 is as follows:
Numberof Shares
Exercise PricePer Share
Weighted-AverageExercise Price
Per Share
Weighted-AverageRemaining
ContracturalLife (Years)
AggregateIntrinsicValue(2)
Outstanding at December 31,2003 . . . . . . . . . . . . . . . . . . . . . . 1,501,747 $ 0.20 $0.20Granted . . . . . . . . . . . . . . . . . . . 1,757,500 0.20 - 0.50 0.32Canceled . . . . . . . . . . . . . . . . . . (37,813) 0.20 0.20Exercised. . . . . . . . . . . . . . . . . . (100,008) 0.20 0.20
Outstanding at December 31,2004 . . . . . . . . . . . . . . . . . . . . . . 3,121,426 0.20 - 0.50 0.27Granted . . . . . . . . . . . . . . . . . . . 4,786,000 0.55 - 1.10 0.87Canceled . . . . . . . . . . . . . . . . . . (210,417) 0.30 - 0.65 0.43Exercised. . . . . . . . . . . . . . . . . . (165,624) 0.20 - 0.30 0.21
Outstanding at December 31,2005 . . . . . . . . . . . . . . . . . . . . . . 7,531,385 0.20 - 1.10 0.65Granted . . . . . . . . . . . . . . . . . . . 2,263,000 1.10 - 18.36 5.43Canceled . . . . . . . . . . . . . . . . . . (170,415) 0.50 - 4.50 1.50Exercised. . . . . . . . . . . . . . . . . . (801,276) 0.20 - 0.65 0.26 $ 3,209
Outstanding at December 31,2006 . . . . . . . . . . . . . . . . . . . . . . 8,822,694 $0.20 - 18.36 $1.89 8.51 $165,403
Exercisable at December 31, 2004 981,006 $ 0.20 $0.20
Exercisable at December 31, 2005 1,588,644 $0.20 - $0.55 $0.24
Exercisable at December 31, 2006 2,768,587 $ 0.20 - 1.10 $0.55 7.64 $ 55,621
Vested or expected to vest atDecember 31, 2006(1) . . . . . . . 7,436,164 $0.20 - 18.36 $1.81 8.43 $140,045
(1) This represents the number of vested options as of December 31, 2006 plus the number of unvestedoptions expected to vest as of December 31, 2006 based on the unvested options outstanding atDecember 31, 2006, adjusted for the estimated forfeiture rate of 11.25%.
(2) The aggregate intrinsic value was calculated based on the positive difference between the fair value ofthe Company’s common stock on December 31, 2006 or the date of exercise, as appropriate and theexercise price of the underlying options.
The ranges of exercise prices for options outstanding and options exercisable at December 31, 2006were as follows:
Options Outstanding Options Exercisable
Range of Exercise PricesNumber of
Shares
Weighted-AverageExercise
Price
Weighted-Average
RemainingContractualLife (Years)
Number ofShares
Weighted-AverageExercise
Price$0.20 to 0.30. . . . . . . . . . . . . . . . . . . . . . . . . . . . . 1,649,756 $ 0.24 6.68 1,178,103 $0.23
0.33 to 0.65. . . . . . . . . . . . . . . . . . . . . . . . . . . . . 1,749,438 0.57 8.19 732,125 0.560.85 to 0.85. . . . . . . . . . . . . . . . . . . . . . . . . . . . . 753,000 0.85 8.90 205,858 0.851.00 to 1.00. . . . . . . . . . . . . . . . . . . . . . . . . . . . . 1,937,500 1.00 8.98 490,001 1.001.10 to 3.40. . . . . . . . . . . . . . . . . . . . . . . . . . . . . 1,758,000 2.01 9.18 162,500 1.104.50 to 14.45 . . . . . . . . . . . . . . . . . . . . . . . . . . . 797,500 7.42 9.69 — —
18.36 to 18.36 . . . . . . . . . . . . . . . . . . . . . . . . . . . 177,500 18.36 9.97 — —Total . . . . . . . . . . . . . . . . . . . . . . . . . . . . . . . . . . . 8,822,694 $ 1.89 8.51 2,768,587 $0.55
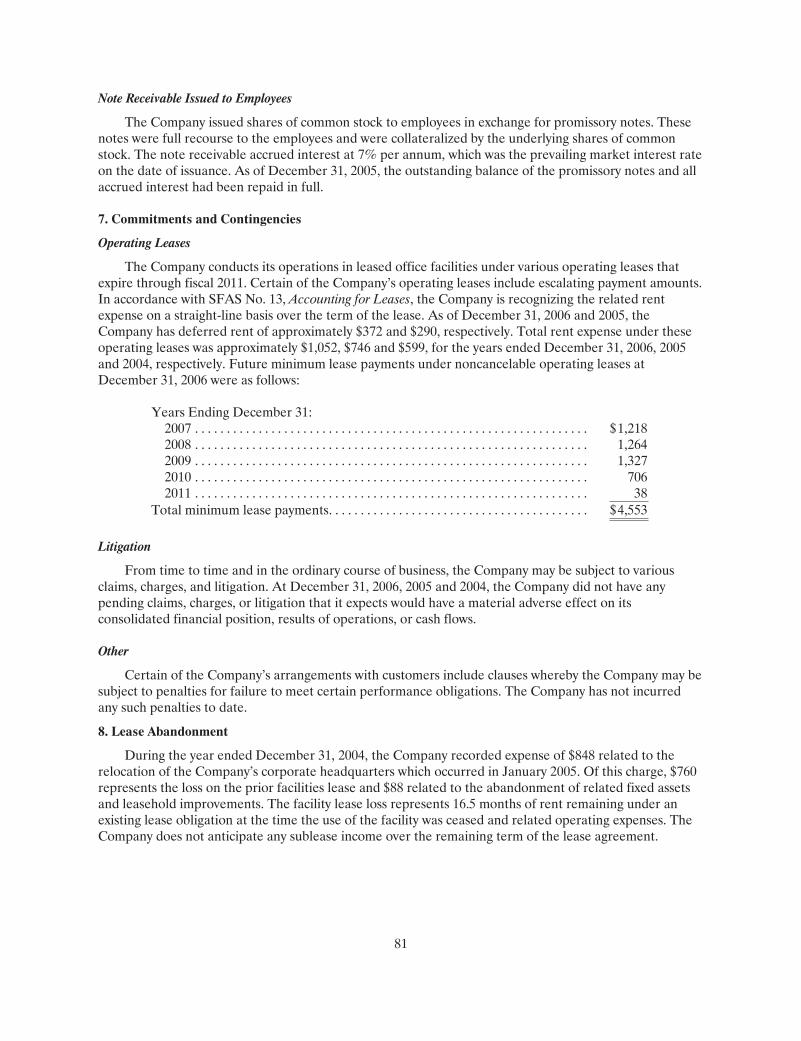
81
Note Receivable Issued to Employees
The Company issued shares of common stock to employees in exchange for promissory notes. Thesenotes were full recourse to the employees and were collateralized by the underlying shares of commonstock. The note receivable accrued interest at 7% per annum, which was the prevailing market interest rateon the date of issuance. As of December 31, 2005, the outstanding balance of the promissory notes and allaccrued interest had been repaid in full.
7. Commitments and Contingencies
Operating Leases
The Company conducts its operations in leased office facilities under various operating leases thatexpire through fiscal 2011. Certain of the Company’s operating leases include escalating payment amounts.In accordance with SFAS No. 13, Accounting for Leases, the Company is recognizing the related rentexpense on a straight-line basis over the term of the lease. As of December 31, 2006 and 2005, theCompany has deferred rent of approximately $372 and $290, respectively. Total rent expense under theseoperating leases was approximately $1,052, $746 and $599, for the years ended December 31, 2006, 2005and 2004, respectively. Future minimum lease payments under noncancelable operating leases atDecember 31, 2006 were as follows:
Years Ending December 31:2007 . . . . . . . . . . . . . . . . . . . . . . . . . . . . . . . . . . . . . . . . . . . . . . . . . . . . . . . . . . . . . . $1,2182008 . . . . . . . . . . . . . . . . . . . . . . . . . . . . . . . . . . . . . . . . . . . . . . . . . . . . . . . . . . . . . . 1,2642009 . . . . . . . . . . . . . . . . . . . . . . . . . . . . . . . . . . . . . . . . . . . . . . . . . . . . . . . . . . . . . . 1,3272010 . . . . . . . . . . . . . . . . . . . . . . . . . . . . . . . . . . . . . . . . . . . . . . . . . . . . . . . . . . . . . . 7062011 . . . . . . . . . . . . . . . . . . . . . . . . . . . . . . . . . . . . . . . . . . . . . . . . . . . . . . . . . . . . . . 38
Total minimum lease payments. . . . . . . . . . . . . . . . . . . . . . . . . . . . . . . . . . . . . . . . . $4,553
Litigation
From time to time and in the ordinary course of business, the Company may be subject to variousclaims, charges, and litigation. At December 31, 2006, 2005 and 2004, the Company did not have anypending claims, charges, or litigation that it expects would have a material adverse effect on itsconsolidated financial position, results of operations, or cash flows.
Other
Certain of the Company’s arrangements with customers include clauses whereby the Company may besubject to penalties for failure to meet certain performance obligations. The Company has not incurredany such penalties to date.
8. Lease Abandonment
During the year ended December 31, 2004, the Company recorded expense of $848 related to therelocation of the Company’s corporate headquarters which occurred in January 2005. Of this charge, $760represents the loss on the prior facilities lease and $88 related to the abandonment of related fixed assetsand leasehold improvements. The facility lease loss represents 16.5 months of rent remaining under anexisting lease obligation at the time the use of the facility was ceased and related operating expenses. TheCompany does not anticipate any sublease income over the remaining term of the lease agreement.

82
The following table summarizes the lease abandonment reserve balance and activity during the yearsended December 31, 2006, 2005 and 2004:
Long-LivedAsset
ImpairmentExisting Lease
Obligations TotalBalance as of December 31, 2003 . . . . . . . . . . . . . . . . . . . . . . . . . . . . . . . $ — $ — $ —
Lease loss provision . . . . . . . . . . . . . . . . . . . . . . . . . . . . . . . . . . . . . . . . . 88 760 848Asset write-downs . . . . . . . . . . . . . . . . . . . . . . . . . . . . . . . . . . . . . . . . . . (88) — (88)
Balance as of December 31, 2004 . . . . . . . . . . . . . . . . . . . . . . . . . . . . . . . — 760 760Cash payments . . . . . . . . . . . . . . . . . . . . . . . . . . . . . . . . . . . . . . . . . . . . . — (551) (551)
Balance as of December 31, 2005 . . . . . . . . . . . . . . . . . . . . . . . . . . . . . . . — 209 209Cash payments . . . . . . . . . . . . . . . . . . . . . . . . . . . . . . . . . . . . . . . . . . . . . — (209) (209)
Balance as of December 31, 2006 . . . . . . . . . . . . . . . . . . . . . . . . . . . . . . . $ — $ — $ —
As of December 31, 2005, the remaining lease loss reserve balance is classified as current and isincluded in accrued expenses in the accompanying consolidated balance sheet.
9. Accrued Expenses and Other Current Liabilities
Accrued expenses and other current liabilities consist of the following:
December 31,2006 2005
Accrued compensation and related benefits . . . . . . . . . . . . . . . . . . . . . . . . . . . . . . . . . . 3,339 $2,297Accrued sales and use taxes . . . . . . . . . . . . . . . . . . . . . . . . . . . . . . . . . . . . . . . . . . . . . . . . 2,293 1,057Accrued income taxes . . . . . . . . . . . . . . . . . . . . . . . . . . . . . . . . . . . . . . . . . . . . . . . . . . . . . 925 —Lease abandonment, current portion . . . . . . . . . . . . . . . . . . . . . . . . . . . . . . . . . . . . . . . . — 209Accrued warranty . . . . . . . . . . . . . . . . . . . . . . . . . . . . . . . . . . . . . . . . . . . . . . . . . . . . . . . . . 461 392Other accrued liabilities . . . . . . . . . . . . . . . . . . . . . . . . . . . . . . . . . . . . . . . . . . . . . . . . . . . 841 267
Total . . . . . . . . . . . . . . . . . . . . . . . . . . . . . . . . . . . . . . . . . . . . . . . . . . . . . . . . . . . . . . . . . . . . $7,859 $4,222
10. Segment Information
SFAS No. 131, Disclosures About Segments of an Enterprise and Related Information, establishesstandards for reporting information about operating segments in annual financial statements and requiresselected information of these segments be presented in interim financial reports issued to stockholders.Operating segments are defined as components of an enterprise about which separate financialinformation is available that is evaluated regularly by the chief operating decision maker, or decisionmaking group, in making decisions on how to allocate resources and assess performance. The Company’schief decision maker, as defined under SFAS No. 131, is the chief executive officer. The Company views itsoperations and manages its business as one operating segment.
For the years ended December 31, 2006, 2005 and 2004, operations related to the Company’s foreignsubsidiaries are not material to the accompanying consolidated financial statements taken as a whole.

83
Geographic Data
Net sales to unaffiliated customers by geographic area were as follows:
Years Ended December 31,2006 2005 2004
United States and Canada . . . . . . . . . . . . . . . . . $47,965 $21,357 $ 8,045International . . . . . . . . . . . . . . . . . . . . . . . . . . . . 36,105 14,763 7,948
$84,070 $36,120 $15,993
11. 401(k) Plan
The Company maintains the Acme Packet, Inc. 401(k) Pension and Profit Sharing Plan (the401(k) Plan) under Section 401(k) of the Internal Revenue Code covering all eligible employees.Employees of the Company may participate in the 401(k) Plan after reaching the age of 21. The Companymay make discretionary matching contributions and profit sharing contributions, as determined annuallyby the Board. Employee contributions vest immediately, while Company matching contributions vestratably over four years. To date, the Company has not made any discretionary contributions to the401(k) Plan.
12. Quarterly Financial Data (unaudited)
Three Months EndedMarch 31,
2005June 30,
2005Sept. 30,
2005Dec. 31,
2005Total revenue . . . . . . . . . . . . . . . . . . . . . . . . . . . . . . . . . . . . . . . . . $8,407 $8,270 $ 6,768 $12,675Gross profit . . . . . . . . . . . . . . . . . . . . . . . . . . . . . . . . . . . . . . . . . . . 6,092 6,025 4,539 10,237Income (loss) from operations . . . . . . . . . . . . . . . . . . . . . . . . . . . 267 (365) (2,586) 2,301Net income (loss) . . . . . . . . . . . . . . . . . . . . . . . . . . . . . . . . . . . . . . 357 (274) (2,501) 2,383
Net income (loss) per share applicable to commonstockholders(1):Basic . . . . . . . . . . . . . . . . . . . . . . . . . . . . . . . . . . . . . . . . . . . . . . . $ — $ (0.02) $ (0.16) $ —
Diluted . . . . . . . . . . . . . . . . . . . . . . . . . . . . . . . . . . . . . . . . . . . . . $ — $ (0.02) $ (0.16) $ —
Three Months EndedMarch 31,
2006June 30,
2006Sept. 30,
2006Dec. 31,
2006Total revenue . . . . . . . . . . . . . . . . . . . . . . . . . . . . . . . . . . . . . . . . . $18,925 $19,154 $22,295 $23,696Gross profit . . . . . . . . . . . . . . . . . . . . . . . . . . . . . . . . . . . . . . . . . . . 14,634 15,353 17,745 18,763Income from operations . . . . . . . . . . . . . . . . . . . . . . . . . . . . . . . . 6,016 5,053 6,712 5,401Net income . . . . . . . . . . . . . . . . . . . . . . . . . . . . . . . . . . . . . . . . . . . 6,021 5,229 6,813 10,801
Net income per share applicable to common stockholders(1):Basic . . . . . . . . . . . . . . . . . . . . . . . . . . . . . . . . . . . . . . . . . . . . . . . $ 0.12 $ 0.11 $ 0.14 $ 0.20
Diluted . . . . . . . . . . . . . . . . . . . . . . . . . . . . . . . . . . . . . . . . . . . . . $ 0.11 $ 0.09 $ 0.12 $ 0.18
(1) Net income (loss) per share for all periods presented has been calculated in accordance with SFASNo. 128, as clarified by EITF Issue No. 03-6. See Note 2 for further detail.
84
Item 9. Changes in and Disagreements with Accountants on Accounting and Financial Disclosure
None.
Item 9A. Controls and Procedures
Our management, with the participation of our chief executive officer and chief financial officer,evaluated the effectiveness of our disclosure controls and procedures as of December 31, 2006. The term“disclosure controls and procedures,” as defined in Rules 13a-15(e) and 15d-15(e) under the ExchangeAct, means controls and other procedures of a company that are designed to ensure that informationrequired to be disclosed by a company in the reports that it files or submits under the Exchange Act isrecorded, processed, summarized and reported, within the time periods specified in the SEC’s rules andforms. Disclosure controls and procedures include, without limitation, controls and procedures designed toensure that information required to be disclosed by a company in the reports that it files or submits underthe Exchange Act is accumulated and communicated to the company’s management, including its principalexecutive and principal financial officers, as appropriate to allow timely decisions regarding requireddisclosure. Management recognizes that any controls and procedures, no matter how well designed andoperated, can provide only reasonable assurance of achieving their objectives and management necessarilyapplies its judgment in evaluating the cost-benefit relationship of possible controls and procedures. Basedon the evaluation of our disclosure controls and procedures as of December 31, 2006, our chief executiveofficer and chief financial officer concluded that, as of such date, our disclosure controls and procedureswere effective at the reasonable assurance level.
No change in our internal control over financial reporting occurred during the fiscal quarter endedDecember 31, 2006 that has materially affected, or is reasonably likely to materially affect, our internalcontrol over financial reporting.
Item 9B. Other Information
None.

85
PART III
Item 10. Directors and Executive Officers of the Registrant
Incorporated by reference from the information in our proxy statement for the 2007 Annual Meetingof Stockholders, which we will file with the Securities and Exchange Commission within 120 days of theend of the fiscal year to which this report relates.
Item 11. Executive Compensation
Incorporated by reference from the information in our proxy statement for the 2007 Annual Meetingof Stockholders, which we will file with the Securities and Exchange Commission within 120 days of theend of the fiscal year to which this report relates.
Item 12. Security Ownership of Certain Beneficial Owners and Management and Related Stockholder
Matters
Incorporated by reference from the information in our proxy statement for the 2007 Annual Meetingof Stockholders, which we will file with the Securities and Exchange Commission within 120 days of theend of the fiscal year to which this report relates.
Item 13. Certain Relationships and Related Transactions and Director Independence
Incorporated by reference from the information in our proxy statement for the 2007 Annual Meetingof Stockholders, which we will file with the Securities and Exchange Commission within 120 days of theend of the fiscal year to which this report relates.
Item 14. Principal Accounting Fees and Services
Incorporated by reference from the information in our proxy statement for the 2007 Annual Meetingof Stockholders, which we will file with the Securities and Exchange Commission within 120 days of theend of the fiscal year to which this report relates.

86
PART IV
Item 15. Exhibits, Financial Statement Schedules
(a)(1) Financial Statements.
The response to this portion of Item 15 is set forth under Item 8 above.
(a)(2) Financial Statement Schedules.
All schedules have been omitted because they are not required or because the required information isgiven in the Consolidated Financial Statements or Notes thereto.
(a)(3) Exhibits
EXHIBIT INDEXExhibit No. Description
3.1* Eighth Amended and Restated Certificate of Incorporation of the Registrant
3.2* Bylaws of the Registrant
3.3* Amended and Restated Certificate of Incorporation of the Registrant
3.4* Amended and Restated Bylaws of the Registrant
4.1* Specimen certificate evidencing shares of common stock
10.1* Northwest Park Lease, dated August 9, 2004, by and between Seventy One Limited LiabilityCompany and the Registrant
10.2* Northwest Park Lease, dated July 10, 2006, by and between the Registrant and MTP LimitedPartnership
10.3* Amended and Restated 2000 Equity Incentive Plan
10.4* Amended and Restated Registration Rights Agreement, dated June 8, 2004, by and betweenthe Registrant and the shareholders named therein
10.5* Incentive Stock Option Agreement, dated December 23, 2005, by and between the Registrantand Patrick MeLampy
10.6* Incentive Stock Option Agreement, dated May 19, 2004, by and between the Registrant andPatrick MeLampy
10.7* Incentive Stock Option Agreement, dated December 23, 2005, by and between the Registrantand Dino DiPalma
10.8* Incentive Stock Option Agreement, dated November 23, 2005, by and between the Registrantand Dino DiPalma
10.9* Incentive Stock Option Agreement, dated January 19, 2005, by and between the Registrantand Dino DiPalma
10.10* Incentive Stock Option Agreement, dated August 16, 2004, by and between the Registrantand Dino DiPalma
10.11* Incentive Stock Option Agreement, dated January 14, 2004, by and between the Registrantand Dino DiPalma
10.12* Incentive Stock Option Agreement, dated September 17, 2002, by and between the Registrantand Dino DiPalma

87
Exhibit No. Description
10.13* Employee Stock Purchase Agreement, dated September 15, 2004, by and among theRegistrant, Seamus Hourihan and Robert G. Ory, in his capacity as escrow holder
10.14* Employee Stock Purchase Agreement, dated January 29, 2004, by and among the Registrant,Seamus Hourihan and Robert G. Ory, in his capacity as escrow holder
10.15* Incentive Stock Option Agreement, dated September 17, 2002, between the Registrant andSeamus Hourihan
10.16* Incentive Stock Option Agreement, dated December 23, 2005, by and between the Registrantand Andrew Ory
10.17* Incentive Stock Option Agreement, dated May 19, 2004, by and between the Registrant andAndrew Ory
10.18* Incentive Stock Option Agreement, dated December 23, 2005, by and between the Registrantand Keith Seidman
10.19* Incentive Stock Option Agreement, dated November 23, 2005, by and between the Registrantand Keith Seidman
10.20* Incentive Stock Option Agreement, dated August 16, 2004, by and between the Registrantand Keith Seidman
10.21* Incentive Stock Option Agreement, dated September 18, 2003, by and between the Registrantand Keith Seidman
10.22* 2006 Equity Incentive Plan
10.23* 2006 Director Stock Option Plan
14.1 Code of Ethics
21.1* Subsidiaries of the Registrant
23.1 Consent of Enst & Young LLP, Independent Registered Public Accounting Firm
31.1 Certification of the Chief Executive Officer pursuant to Section 302 of the Sarbanes-OxleyAct
31.2 Certification of the Chief Financial Officer pursuant to Section 302 of the Sarbanes-Oxley Act
32.1 Certification of the Chief Executive Officer and Chief Financial Officer pursuant toSection 906 of the Sarbanes-Oxley Act
* Incorporated by reference to Registrant’s Form S-1 Registration No. 333-134683

88
SIGNATURES
Pursuant to the requirements of the Section 13 or 15(d) of the Securities Exchange Act of 1934, theregistrant has duly caused this report to be signed on its behalf by the undersigned, thereunto dulyauthorized.
ACME PACKET, INC.(Registrant)
Date: March 15, 2007 By: /s/ ANDREW D. ORY
Andrew D. OryPresident and Chief Executive Officer
Date: March 15, 2007 By: /s/ KEITH SEIDMAN
Keith SeidmanChief Financial Officer and Treasurer
Pursuant to the requirements of the Securities Act of 1934, this report has been signed below by thefollowing persons in the capacities and dates indicated.
Signature Title Date
/s/ ANDREW D. ORY President and Chief Executive Officer; Director March 15, 2007Andrew D. Ory (Principal Executive Officer)
/s/ KEITH SEIDMAN Chief Financial Officer March 15, 2007Keith Seidman (Principal Accounting and Financial Officer)
/s/ GARY J. BOWEN Director March 15, 2007Gary J. Bowen
/s/ DAVID ELSBREE Director March 15, 2007David Elsbree
/s/ ROBERT HOWER Director March 15, 2007Robert Hower
/s/ PATRICK J. MELAMPY Director March 15, 2007Patrick J. MeLampy
/s/ ROBERT G. ORY Director March 15, 2007Robert G. Ory
/s/ SONJA HOEL PERKINS Director March 15, 2007Sonja Hoel Perkins

Exhibit 23.1
Consent of Independent Registered Public Accounting Firm
We consent to the reference to our firm under the caption “Selected Consolidated Financial Data”and to the incorporation by reference in the Registration Statement (Form S-8, No. 333-138541)pertaining to the Amended and Restated 2000 Equity Incentive Plan, the 2006 Equity Incentive Plan andthe 2006 Director Option Plan of Acme Packet, Inc., of our report dated March 7, 2007, with respect to theconsolidated financial statements of Acme Packet, Inc., included in the Annual Report (Form 10-K) forthe year ended December 31, 2006.
/s/ Ernst & Young LLP
Boston, MassachusettsMarch 13, 2007

Exhibit 31.1
CERTIFICATION OF CHIEF EXECUTIVE OFFICER PURSUANT TOSECURITIES EXCHANGE ACT RULES 13a-14(a) AND 15d-14(a), AS ADOPTED PURSUANT TO
SECTION 302 OF THE SARBANES-OXLEY ACT OF 2002
I, Andrew D. Ory, as President and Chief Executive Officer of Acme Packet, Inc., certify that:
1. I have reviewed this Annual Report on Form 10-K of Acme Packet, Inc.;
2. Based on my knowledge, this report does not contain any untrue statement of a material fact oromit to state a material fact necessary to make the statements made, in light of the circumstances underwhich such statements were made, not misleading with respect to the period covered by this report;
3. Based on my knowledge, the financial statements, and other financial information included in thisreport, fairly present in all material respects the financial condition, results of operations and cash flows ofthe registrant as of, and for, the periods presented in this report;
4. The registrant’s other certifying officer and I are responsible for establishing and maintainingdisclosure controls and procedures (as defined in Exchange Act Rules 13a-15(e) and 15d-15(e)) for theregistrant and have:
(a) Designed such disclosure controls and procedures, or caused such disclosure controlsand procedures to be designed under our supervision, to ensure that material informationrelating to the registrant, including its consolidated subsidiaries, is made known to us by otherswithin those entities, particularly during the period in which this report is being prepared;
(b) Evaluated the effectiveness of the registrant’s disclosure controls and procedures andpresented in this report our conclusions about the effectiveness of the disclosure controls andprocedures, as of the end of the period covered by this report based on such evaluation; and
(c) Disclosed in this report any change in the registrant’s internal control over financialreporting that occurred during the registrant’s most recent fiscal quarter (the registrant’s fourthfiscal quarter in the case of an annual report) that has materially affected, or is reasonably likelyto materially affect, the registrant’s internal control over financial reporting; and
5. The registrant’s other certifying officer and I have disclosed, based on our most recent evaluation ofinternal control over financial reporting, to the registrant’s auditors and the audit committee of theregistrant’s board of directors (or persons performing the equivalent functions):
(a) All significant deficiencies and material weaknesses in the design or operation ofinternal control over financial reporting which are reasonably likely to adversely affect theregistrant’s ability to record, process, summarize and report financial information; and
(b) Any fraud, whether or not material, that involves management or other employees whohave a significant role in the registrant’s internal control over financial reporting.
Date: March 15, 2007 /s/ ANDREW D. ORY
Andrew D. OryPresident and Chief Executive Officer

Exhibit 31.2
CERTIFICATION OF CHIEF FINANCIAL OFFICER PURSUANT TOSECURITIES EXCHANGE ACT RULES 13a-14(a) AND 15d-14(a), AS ADOPTED PURSUANT TO
SECTION 302 OF THE SARBANES-OXLEY ACT OF 2002
I, Keith Seidman, as Chief Financial Officer and Treasurer of Acme Packet, Inc., certify that:
1. I have reviewed this annual report on Form 10-K of Acme Packet, Inc.;
2. Based on my knowledge, this report does not contain any untrue statement of a material fact oromit to state a material fact necessary to make the statements made, in light of the circumstances underwhich such statements were made, not misleading with respect to the period covered by this report;
3. Based on my knowledge, the financial statements, and other financial information included in thisreport, fairly present in all material respects the financial condition, results of operations and cash flows ofthe registrant as of, and for, the periods presented in this report;
4. The registrant’s other certifying officer and I are responsible for establishing and maintainingdisclosure controls and procedures (as defined in Exchange Act Rules 13a-15(e) and 15d-15(e)) for theregistrant and have:
(a) Designed such disclosure controls and procedures, or caused such disclosure controlsand procedures to be designed under our supervision, to ensure that material informationrelating to the registrant, including its consolidated subsidiaries, is made known to us by otherswithin those entities, particularly during the period in which this report is being prepared;
(b) Evaluated the effectiveness of the registrant’s disclosure controls and procedures andpresented in this report our conclusions about the effectiveness of the disclosure controls andprocedures, as of the end of the period covered by this report based on such evaluation; and
(c) Disclosed in this report any change in the registrant’s internal control over financialreporting that occurred during the registrant’s most recent fiscal quarter (the registrant’s fourthfiscal quarter in the case of an annual report) that has materially affected, or is reasonably likelyto materially affect, the registrant’s internal control over financial reporting; and
5. The registrant’s other certifying officer and I have disclosed, based on our most recent evaluationof internal control over financial reporting, to the registrant’s auditors and the audit committee of theregistrant’s board of directors (or persons performing the equivalent functions):
(a) All significant deficiencies and material weaknesses in the design or operation ofinternal control over financial reporting which are reasonably likely to adversely affect theregistrant’s ability to record, process, summarize and report financial information; and
(b) Any fraud, whether or not material, that involves management or other employees whohave a significant role in the registrant’s internal control over financial reporting.
Date: March 15, 2007 /s/ KEITH SEIDMAN
Keith SeidmanChief Financial Officer and Treasurer

Exhibit 32.1
CERTIFICATION OF CHIEF EXECUTIVE OFFICER ANDCHIEF FINANCIAL OFFICER PURSUANT TO
18 U.S.C. SECTION 1350, AS ADOPTED PURSUANT TOSECTION 906 OF THE SARBANES-OXLEY ACT OF 2002
Each of Andrew D. Ory and Keith Seidman hereby certifies, pursuant to 18 U.S.C. Section 1350, asadopted pursuant to Section 906 of the Sarbanes-Oxley Act of 2002, in his capacity as President and ChiefExecutive Officer and Chief Financial Officer and Treasurer, respectively of Acme Packet, Inc. (the“Company”), that, to his knowledge, the Annual Report of the Company on Form 10-K for the year endedDecember 31, 2006, fully complies with the requirements of Section 13(a) or 15(d) of the SecuritiesExchange Act of 1934 as filed with the Securities and Exchange Commission (the “Report”) and that theinformation contained in the Report fairly presents, in all material respects, the financial condition andresults of operations of the Company.
Date: March 15, 2007 By: /s/ ANDREW D. ORY
Andrew D. OryPresident and Chief Executive Officer
Date: March 15, 2007 By: /s/ KEITH SEIDMAN
Keith SeidmanChief Financial Officer and Treasurer
This written statement is being furnished to the Securities and Exchange Commission as an exhibit tothe Form 10-K, and “accompanies” such Form 10-K to which it relates, is not deemed filed with theSecurities and Exchange Commission and is not to be incorporated by reference into any filing of theCompany under the Securities Act of 1933, as amended, or the Securities Exchange Act of 1934, asamended (whether made before or after the date of the Form 10-K to which it relates), notwithstandingany general incorporation language contained in such filing. A signed original of this statement has beenprovided to the Company and will be retained by the Company and furnished to the Securities andExchange Commission or its staff upon request.

(This page has been left blank intentionally.)

(This page has been left blank intentionally.)

Acme Packet, I
tivenetwork borproviders in 75 cregulatory r
pro– from VoIPfix
and data centervisit www
$15,993
T OTA L R E(in thousands)
(in thousands)
Fiscal YearStTotal revenueGross profitToN
Balance S
Total assetsTo
Directors
Andrew D. OryPresident, Chief Executive Officer and Co-FounderAcme Packet, Inc.
Gary J. BowenTechnology Investments
David B. ElsbreeRetired PartnerDeloitte & Touche LLP
Robert C. HowerAdvanced Technology Ventures
Patrick J. MeLampyChief Technology Officer and Co-FounderAcme Packet, Inc.
Robert G. OryAcme Packet, Inc.
Sonja Hoel Perkins Menlo Ventures
Executive Officers
Andrew D. OryPresident, Chief Executive Officer and Co-Founder
Patrick J. MeLampyChief Technology Officer and Co-Founder
Dino Di Palma Vice President of Sales and Business Development
Seamus HourihanVice President of Marketing and Product Management
David C. HunterVice President of Engineering
Erin MedeirosVice President of Professional Services
Keith SeidmanVice President of Finance, Chief Financial Officer and Treasurer
Financial InformationThe accompanying Annual Report on Form10-K for the fiscal year ended December 31,2006 does not contain exhibits. These exhibits have been filed with the Securitiesand Exchange Commission. Upon request to our Office of Investor Relations, the Company will furnish, without charge, anysuch exhibits, as well as copies of periodicreports filed with the Securities and Exchange Commission and additional information about the Company, its products, and the markets it serves.
Transfer Agent and RegistrarComputershare Trust Company, N.A. is the transfer agent and registrar for the Company’s common stock and maintainsstockholder accounting records. The TransferAgent will respond to questions regardingchanges in address, name, or ownership;lost certificates; and consolidation of accounts. A change of address should be reported promptly by sending a signedand dated letter to Computershare TrustCompany, N.A.
Stockholders should state the name inwhich the stock is registered, account number, social security number, certificatenumber, and the new address. Please mailcorrespondence to:
Computershare Trust Company, N.A. P.O. Box 43023Providence, RI 02940www.computershare.com(781) 575-4238
Stock ListingNASDAQ Global Market Trading Symbol: APKT
Investor RelationsAcme Packet, Inc.71 Third AvenueBurlington, MA [email protected](781) 328-4790
Annual MeetingThe Annual Meeting of Stockholders will be held at 10:00 a.m. on May 22, 2007, atthe law offices of Bingham McCutchen LLPlocated at 150 Federal Street in Boston, MA.
Independent AuditorsErnst & Young LLPBoston, MA
Legal CounselBingham McCutchen LLP Boston, MA
Safe Harbor LanguageStatements contained herein that are nothistorical fact may be forward-looking state-ments within the meaning of Section 27A ofthe Securities Act of 1933 and Section 21Eof the Securities Exchange Act of 1934. Suchforward-looking statements may relate,among other things, to the Company’s po-sition in the session border controller mar-ket; its expected financial and operatingresults; its ability to establish and maintainintellectual property rights; its ability tobuild and grow; the benefits or advantagesof its products, services, or programs; itsability to achieve its goals, plans and objec-tives; its ability to attract and retain cus-tomers; its development activities; its abilityto hire and retain necessary employees andappropriately staff its operations; thespending of the proceeds of its capital rais-ing activities; its cash needs; and the im-pact of new accounting pronouncements.Such forward-looking statements do notconstitute guarantees of future performanceand are subject to a variety of risks and un-certainties that could cause actual results todiffer materially from those anticipated.These include, but are not limited to: diffi-culties growing its customer base; difficul-ties leveraging market opportunities;difficulties providing solutions that meet theneeds of customers; poor product sales;long sales cycles; difficulty developing newproducts; difficulty in relationships with ven-dors and partners; higher risk in interna-tional operations; difficulty managing rapidgrowth, financial performance, and in-creased competition. Additional factors thatcould cause actual results to differ materi-ally from those projected or suggested inany forward-looking statements are con-tained in the Company’s recent filings withthe Securities and Exchange Commission,including those factors discussed under thecaption “Risk Factors” in such filings.
Acme Packet is a registered trademark of AcmePacket, Inc. All other trademarks and servicemarks are the property of their respective owners.©2007 Acme Packet, Inc.
A N N U A L R E P O R T T O S T O C K H O L D E R S 2 0 0 6
AC
ME
P
AC
KE
T,
I
NC
.• A
NN
UA
L
RE
PO
RT
T
O
ST
OC
KH
OL
DE
RS
2
00
6
Corporate Office
Acme Packet, Inc.
71 Third Avenue
Burlington, MA 01803
Corporate Telephone (781) 328-4400
Corporate Fax (781) 425-5077
Investor Relations Telephone: (781) 328-4790
www.acmepacket.com
278279_Acme.cover.final:Layout 1 3/21/07 5:43 PM Page 1


