53
Active Distribution System Management A key tool for the smooth integration of distributed generation full discussion paper A EURELECTRIC paper, FEBRUARY 2013
Active Distribution System ManagementA key tool for the smooth integration of distributed generationfull discussion paper
A EURELECTRIC paper, FEBRUARY 2013

The Union of the Electricity Industry–EURELECTRIC is the sector association representing the common interests of
the electricity industry at pan-European level, plus its affiliates and associates on several other continents.
In line with its mission, EURELECTRIC seeks to contribute to the competitiveness of the electricity industry, to
provide effective representation for the industry in public affairs, and to promote the role of electricity both in the
advancement of society and in helping provide solutions to the challenges of sustainable development.
EURELECTRIC’s formal opinions, policy positions and reports are formulated in Working Groups, composed of
experts from the electricity industry, supervised by five Committees. This “structure of expertise” ensures that
EURELECTRIC’s published documents are based on high-quality input with up-to-date information.
For further information on EURELECTRIC activities, visit our website, which provides general information on the
association and on policy issues relevant to the electricity industry; latest news of our activities; EURELECTRIC
positions and statements; a publications catalogue listing EURELECTRIC reports; and information on our events and
conferences.
Dépôt légal: D/2013/12.105/7
EURELECTRIC pursues in all its activities the application ofthe following sustainable development values:
Economic Development
Growth, added-value, efficiency
Environmental Leadership
Commitment, innovation, pro-activeness
Social Responsibility
Transparency, ethics, accountability

Active Distribution System ManagementA key tool for the smooth integration of distributedgeneration--------------------------------------------------------------------------------------------------
TF Active System ManagementPer HALLBERG (SE) ChairJuan Jose ALBA RIOS (ES); Christer BERGERLAND (SE); Aurelio BLANQUET (PT); Marcel CAILLIAU (BE); ConorCLIFFORD (SE); Paul DE WIT (NL); Ellen DISKIN (IE); Håkan FEUK (SE); Bruno GOUVERNEUR (BE); Mike KAY(GB); Pauline LAWSON (GB); Marina LOMBARDI (IT); Pavla MANDATOVA (EURELECTRIC Secretariat); RuudOTTER (NL); Pablo SIMON CABALLERO (ES); Jorge TELLO GUIJARRO (ES); Walter TENSCHERT (AT); DavidTREBOLLE (ES); Siegfried WANZEK (DE)
Contact:Gunnar LORENZ, Head of Networks Unit – [email protected] MANDATOVA, Adviser Networks Unit - [email protected]

Contents
INTRODUCTION ................................................................................................................................1
1. INTEGRATION OF DISTRIBUTED GENERATION: A KEY CHALLENGE FOR DSOS..............................................2
1.1. Distributed Generation: Facts and Figures.....................................................................................2
1.2. Key Challenges for Current Distribution Networks ........................................................................41.2.1. Network Reinforcement .................................................................................................41.2.2. Distribution Network Operation ....................................................................................61.2.3. Traditional Design of Distribution Networks .................................................................9
2. ACTIVE DISTRIBUTION NETWORKS................................................................................................10
2.1. Key Building Blocks.......................................................................................................................10
2.2. Distribution Network Development, Planning, Access & Connection .........................................142.2.1. Coordinated Network Development ............................................................................142.2.2. Network Capacity Management..................................................................................152.2.3. Connection ...................................................................................................................17
2.3. Active Distribution Network Operation .......................................................................................182.3.1. DSO System Services & ‘Traffic Lights’ Approach ........................................................192.3.2. Information Exchange..................................................................................................232.3.3. Voltage Control ............................................................................................................24
2.4. Technical Development: Towards Flexible Distribution Systems ................................................27
3. IMPLICATIONS FOR REGULATION AND MARKET DESIGN......................................................................28
KEY CONCLUSIONS ..........................................................................................................................30
POLICY RECOMMENDATIONS .............................................................................................................31
ANNEX 1 – EXAMPLE OF A POSITIVE CBA, THE IMPROGRESS PROJECT ......................................................33
ANNEX 2 – CASE STUDIES .................................................................................................................34
A. Demonstration of active power effect in voltage control – Networks 2025 Project, Spain........34
B. Active voltage management using wind generation voltage control and reactive capabilities –ESB Networks, Ireland ..................................................................................................................36
C. Technical Control Strategy for Active System Management – EDP Distribuicão, Portugal .........38
D. Protection and Automation Strategies in MV Networks – Enel Distribuzione, Italy ...................39
E. Integration of RENEWABLES in MV and LV Networks – E.ON Bayern, Germany ........................40
ANNEX 3 – SURVEY RESULTS .............................................................................................................42
A. Automation and Control in MV & LV Distribution Networks.......................................................42
B. Curtailment of Distributed Generation ........................................................................................45
GLOSSARY.....................................................................................................................................46
REFERENCES & BIBLIOGRAPHY............................................................................................................47
List of Figures
Figure 1 Common voltage connection levels for different types of DG/RES .....................................................2Figure 2 Distributed generation installed capacity and peak demand in Galicia, Spain ....................................3Figure 3 Installed capacity of photovoltaic installations in the E.ON Bayern grid (Source: E.ON).....................3Figure 4 Power flows between transmission and distribution network in Italy, 2010-2012 (Source: EnelDistribuzione) .....................................................................................................................................................4Figure 5 Relation between the degree of DG penetration and grid losses (Source: van Gerwent)...................5Figure 6 Instability in distribution system (Source: Mainova)............................................................................6Figure 7 Reverse power flows at a substation in northwest Ireland (Source: ESB Networks)...........................7Figure 8 Current DSO networks..........................................................................................................................9Figure 9 Three-Step Evolution of Distribution Systems....................................................................................11Figure 10 DSO interactions with markets & TSO at different time frames ......................................................12Figure 11 Variable access approach (Source: EWE Netz) .................................................................................16Figure 12 Extension of network capacity for peak load versus a load management solution (Source: EWENetz) .................................................................................................................................................................17Figure 13 Market and network operations ......................................................................................................19Figure 14 Instability in the distribution system................................................................................................21Figure 15 Information Exchange Today and in the Future ...............................................................................23Figure 16 An illustrative example of a traditional approach to voltage control ..............................................24Figure 17 Comparison of BAU distribution Investments and maintenance costs (WP4) and costs whenapplying ANM solutions (WP5) for the Spanish network.................................................................................33Figure 18 R/X ratio effect in voltage control ....................................................................................................34Figure 19 Extra reactive power contribution to maintain a voltage setpoint ..................................................34Figure 20 DG effect in the voltage triangle design ...........................................................................................35Figure 21 Wind farm active and reactive capabilities as demonstrated in ESB Networks Volt / VAr trials .....36Figure 22 Test network for field demonstration of coordinated Volt / VAr Control........................................37Figure 23 Active and reactive power where wind farms connect to substation - as active export increases,reactive power is imported to control PCC voltage .........................................................................................37Figure 24 Hot spots areas in E.ON Bayern (installed RES capacity in EBY grid areas) ......................................40
List of Tables
Table 1 Three-Step Evolution of Distribution Systems in detail .......................................................................13Table 2 New System Services at Distribution Level..........................................................................................20Table 3 Voltage control in current distribution networks ................................................................................25Table 4 Technology options for distribution network development ...............................................................28Table 5 DG Contribution to voltage control by voltage level ...........................................................................35

1
IntroductionThe expansion of decentralised and intermittent renewable generation capacities introduces newchallenges to ensuring the reliability and quality of power supply. Most of these new generators(both in number and capacity) are being connected to distribution networks – a trend that is set tocontinue in the coming years.
This development has profound implications for distribution system operators (DSOs). Untilrecently, DSOs designed and operated distribution networks through a top-down approach.Predictable flows in the electricity network did not require extensive management and monitoringtools.
But this model is changing. Higher shares of distributed energy sources lead to unpredictablenetwork flows, greater variations in voltage, and different network reactive power characteristics.Local grid constraints will occur more frequently, adversely affecting the quality of supply. YetDSOs are nevertheless expected to continue to operate their networks in a secure way and toprovide high-quality service to their customers.
This EURELECTRIC report addresses a number of fundamental questions that arise from theintegration of distributed generation (DG) and other distributed energy resources (DER) into theenergy system:
How can DSOs make the most efficient use of the existing network? When are new infrastructure and changes in system architecture needed to better
integrate DG and DER? Which types of system services are needed and how can they be procured? How can renewable energy sources (RES), DG, and DER contribute to system security? How should the regulatory framework develop?
Active distribution system management may provide some answers to these questions. Indeed,distribution management will allow grids to integrate DER efficiently by leveraging the inherentcharacteristics of this type of generation. The growth of DER requires changes to how distributionnetworks are planned and operated. Bi-directional flows need to be taken into account: they mustbe monitored, simulated and managed.
The report sets out implications for the tasks of system operators (TSOs and DSOs) and DG/RESoperators and outlines options for system planning and development, system operation, andinformation exchange, thereby opening the door for further analysis. It focuses on outstandingtechnical issues and necessary operational requirements and calls for adequate regulatorymechanisms that would pave the way for these solutions.
The paper focuses largely on distributed generation – a challenge many DSOs are already facingtoday. However, the presented possible solutions will generally also be applicable to otherflexibility providers like loads and electric vehicles, which fall under the umbrella of flexibilityoffered by DER.
2
1. Integration of Distributed Generation: A Key Challenge for DSOsDistributed energy resources (DER) include distributed/decentralised generation (DG) and distributedenergy storage (DS)1. With the EU on its way to meeting a 20% target for RES in total energy consumptionby 2020, the share of electricity supply from RES is on the rise. Intermittent RES like solar and wind add anadditional variable to the system that will require more flexibility from generation (including RES) anddemand and investments in network infrastructure. Such intermittent RES will be connected largely toEuropean distribution systems. At the same time, electrification of transport will be needed to furtherdecarbonise the economy. For a significant deployment of electric vehicles by 2050, Europe needs to targeta 10% share of electric vehicles by 2020. These vehicles will need to be charged through the electricalsystem. Together with the electrification of heating and cooling, these trends will contribute to furtherevolution of European power systems.
1.1. Distributed Generation: Facts and Figures
Distributed/decentralised generation (DG) are generating plants connected to the distribution network,
often with small to medium installed capacities, as well as medium to larger renewable generation units.
Due to high “numbers”, they are important compared to the “size” of the distribution network. In addition
to meeting on-site needs, they export the excess electricity to the market via the local distribution network.
DG is often operated by smaller power producers or so-called prosumers.
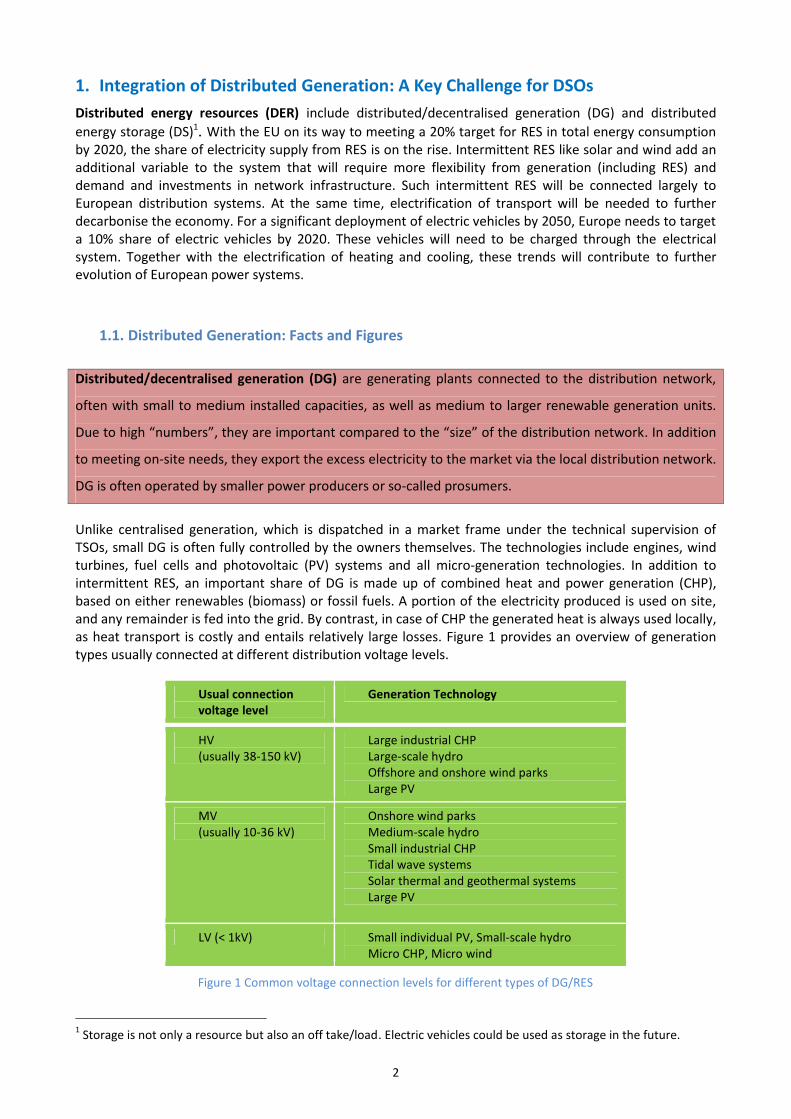
Unlike centralised generation, which is dispatched in a market frame under the technical supervision ofTSOs, small DG is often fully controlled by the owners themselves. The technologies include engines, windturbines, fuel cells and photovoltaic (PV) systems and all micro-generation technologies. In addition tointermittent RES, an important share of DG is made up of combined heat and power generation (CHP),based on either renewables (biomass) or fossil fuels. A portion of the electricity produced is used on site,and any remainder is fed into the grid. By contrast, in case of CHP the generated heat is always used locally,as heat transport is costly and entails relatively large losses. Figure 1 provides an overview of generationtypes usually connected at different distribution voltage levels.
Usual connectionvoltage level
Generation Technology
HV(usually 38-150 kV)
Large industrial CHPLarge-scale hydroOffshore and onshore wind parksLarge PV
MV(usually 10-36 kV)
Onshore wind parksMedium-scale hydroSmall industrial CHPTidal wave systemsSolar thermal and geothermal systemsLarge PV
LV (< 1kV) Small individual PV, Small-scale hydroMicro CHP, Micro wind
Figure 1 Common voltage connection levels for different types of DG/RES
1 Storage is not only a resource but also an off take/load. Electric vehicles could be used as storage in the future.

3
The following examples demonstrate that a move from mere DG connection to DG integration is a mustalready today in some countries. As illustrated in Figure 2, in Galicia, Spain, the installed capacity of DGconnected to the distribution networks of Union Fenosa Distribución (2,203 MW) represents 120% of thearea’s total peak demand (1,842 MW).2
Figure 2 Distributed generation installed capacity and peak demand in Galicia, Spain
(Source: Union Fenosa Distribución)
In the regional distribution network in the south of Germany (see Figure 3), the installed capacity ofintermittent renewable DG already represents a large percentage of the peak load. In many places, theDG output of distribution networks already exceeds local load – sometimes by multiple times. From theTSO point of view, the DSO network then looks like ‘a large generator’ in periods with high RES production.
*status for 31 December 2012
Figure 3 Installed capacity of photovoltaic installations in the E.ON Bayern grid (Source: E.ON)
2 Overall, DG covers more than 30% of Union Fenosa Distribución regional energy (MWh) demand already today.
Max. Hourly Averagecapacity (MW)
GaliciaDemand 1.842
InstalledCapacity
(MW)
Percentage(%)
CHP (Natural Gas) 166,9 7,6
Rest CHP 319,4 14,5
Wind Power 1.369,5 62,1
Photovoltaic (PV) 10,3 0,5
Hydro 306,1 13,9
Other Renewables 31,4 1,4
TOTAL Generation 2.203,6 100
Natural GasCHP 7,6%
Rest CHP14,5%
Wind power62,1%
PV0,5%
Hydro13,9%
OtherRenewables
1,4%

4
In 2011, 10 GW of PV were newly connected to Italian distribution grids (Enel Distribuzione), the highestyearly increase in distributed generation connected to the grid worldwide.
In northwest Ireland with a peak demand of 160 MW, 307.75 MW of distributed wind generation arealready connected to the distribution system, and a further 186 MW are contracted or planned. Beyondthis, another 640 MW of applications have been submitted.
1.2. Key Challenges for Current Distribution Networks
In theory, due to its proximity to the loads, distributed generation should contribute to the security ofsupply, power quality, reduction of transmission and distribution peak load and congestion, reduced needfor long distance transmission, avoidance of network overcapacity, deferral of network investments andreduction in distribution grid losses (via supplying active power to the load and managing voltage andreactive power in the grid).
In reality, integrating distributed generation into DSO grids represents a capacity challenge due to DGproduction profiles, location and firmness. DG is not always located close to load and DG production ismostly non-dispatchable (cannot control its own output). Therefore, production does not always coincidewith demand (stochastic regime) and DG does not necessarily generate when the distribution network isconstrained. In addition, power injections to higher voltage levels need to be considered where the localcapacity exceeds local load. This poses important challenges for both distribution network developmentand operation.
1.2.1. Network Reinforcement
The ability of DG to produce electricity close to the point of consumption alleviates the need to usenetwork capacity for transport over longer distances during certain hours. However, the need to designthe distribution networks for peak load remains undiminished and the overall network cost may evenincrease. For example, peak residential demand frequently corresponds to moments of no PV production.Figure 4 shows the situation in the southern Italian region of Puglia. It indicates the incredible increase inthe power installed and energy produced from PVs in recent years and the subsequent evolution of powerflows at the connection point between the transmission network and the distribution network. As the peakload corresponds to literally zero PV production, there is no reduction in investment (“netting” generationand demand).
Figure 4 Power flows between transmission and distribution network in Italy, 2010-2012 (Source: Enel Distribuzione)

5
Generally speaking, distribution networks have to be prepared for all possible combinations ofproduction and load situations. They are designed for a peak load that often only occurs for a few hoursper year, in what this paper refers to as the fit-and-forget approach. Even constraints of short durationtrigger grid adaptations (e.g. reinforcement).3 Distribution networks have always been designed in thisway, but with DG the utilisation rate of network assets declines even more.
Network connection studies and schemes for generators are designed to guarantee that under normaloperation all capacity can be injected at any time of the year.4 The current European regulatory frameworkprovides for priority and guaranteed network access for electricity from RES (Art. 16 of RES Directive2009/28/EC) and RES-based CHP (Art. 14 of the new Energy Efficiency Directive 2012/27/EC). RES-E ismostly connected on a firm/permanent network access basis (but cannot be considered as firm for suchdesign purposes). Generation and load of equivalent sizes imply different design criteria as e.g. wind and PVhas lower diversity than load. In addition, wider cables to lower the voltage might be needed. Overall, thiscan lead to higher reinforcement cost and thus a rise in CAPEX for DSOs and/or higher connection costsfor DG developers. The contribution of DG to the deferral of network investments holds true only for arelatively small amount and size of DG and for predictable and controllable primary sources.
The lead time needed to realise generation investment is usually shorter than that for gridreinforcement. Article 25.7 of Directive 2009/72/EC requires DSOs to take into account distributed energyresources and conventional assets when planning their networks. This may be complicated whenapplications for connection are submitted at short notice and DSOs receive no information on connectionto private networks. Situations will occur when DSOs have large amounts of DER connected to theirnetwork and the resulting net demand seen further up the system hierarchy is lowered. Virtual saturation –a situation when the entire capacity is reserved by plants queuing for connection that may not eventuallymaterialise – may also occur as generator plans cannot be firm before the final investment decision.However, even in the cases when the project is not built, it occupies an idle capacity which may lead newgrid capacity requests to face increased costs in case network reinforcements are needed. Temporary lackof network capacity may result in ‘queuing’ and long waiting times, delaying grid connection of newgenerators.
The situation is similar in case of grid losses (related costs are part of DSOs’ OPEX). Figure 5 demonstratesthat with a low share of DG these losses drop, but once there are large injections of DG into the DSOnetwork and load flows over the network, grid losses tend to increase. DG can reduce network costs intransport levels but entails higher costs in the level to which it is connected.
Figure 5 Relation between the degree of DG penetration and grid losses (Source: van Gerwent)
3 In some countries, this regulation is part of the regulation for feed-in of renewable energy or other preferentialpower production and remuneration.4 In some countries this is also the case for the N-1 contingency state which is typically considered in a meshednetwork and represents the fail of a grid element. Many MV networks are meshed even when they are operatedradially, so some N-1 is also possible in MV.

6
1.2.2. Distribution Network Operation
In addition, distributed generation, in particular intermittent RES, poses a challenge not only for systembalancing, but also for local network operation. The security and hosting capacity of the distributionsystem is determined by voltage (statutory limits for the maximum and minimum voltage ensure thatvoltage is kept within the proper margins and is never close to the technical limits of the grid) and thephysical current limits of the network (thermal rates of lines, cables, transformers that determine thepossible power flow).
A distribution system can be driven out of its defined legal and or physical operating boundaries due to oneor both of the following:
Voltage variations: Injection of active power leads to voltage profile modifications. Voltage increase(overvoltage) is the most common issue at the connection point for DG units and the relevant gridarea. Reversed power flows (flows from distribution to transmission) occur when DG productionexceeds local load. The more local production exceeds local demand, the stronger the impact onvoltage profiles. Figure 6 illustrates such situations.
DSOs may have difficulties in maintaining the voltage profile at the customer connection points, inparticular on LV level, as active voltage control is not in place. In most countries, monitoring of gridvalues is missing and most distributed generators are not equipped to participate in systemmanagement – no active contribution of generation to network operation is expected.5 As a result,operational system security may be endangered and security of facilities (both customers’ installationsand the network as such) put at risk.
Figure 6 Instability in distribution system (Source: Mainova)
Congestions: When excessive DG feed-in pushes the system beyond its physical capacity limits (PG
- PL>
Pmax
), congestions may occur in distribution networks. This may lead to necessary emergency actions tointerrupt/constrain off generation feed-in or supply. A similar situation can occur in case of excessivedemand on the system (P
L- P
G> P
max). This could apply to high load incurred e.g. by charging of electric
vehicles, heat pumps and electrical HVAC (heating ventilation and air-conditioning).
5 Where DSOs are already in the ‘reactive DSO’ phase (see section 2.1), these solutions have been implemented.

7
Generation curtailment is used in cases of system security related events (i.e. congestion or voltagerise). The regulatory basis for generation curtailment in such emergency situations differs acrossEurope.6 In some countries (e.g. in Italy, Spain, Ireland), the control of DG curtailment is de facto in TSOhands: the DSO can ask the TSO, who is able to control active power of DG above a certain installedcapacity, to constrain DG if there is a local problem.7 As the TSO is not able to monitor distributionnetwork conditions (voltage, flows), DSOs can only react to DG actions. This can result in deterioratingcontinuity on the distribution system which will impact both demand customers and DG. Annex 3.Bprovides an overview of the situation in different countries.
In systems with a high penetration of DG, both types of unsecure situations already occur today. As aresult, DSOs with high shares of DG in their grids already face challenges in meeting some of theirresponsibilities8. These challenges are expected to become more frequent, depending on the differenttypes of connected resources, their geographic location and the voltage level of the connection.
Figure 7 shows the reverse power flows on an Irish substation in an area with high wind penetration.
Figure 7 Reverse power flows at a substation in northwest Ireland (Source: ESB Networks)
6 Curtailment/feed-in management rules are either not defined by law at all (e.g. Austria), defined at the TSO levelonly (e.g. Spain or Italy) or defined at both the TSO and the DSO level (e.g. UK or Germany according to the revisedfeed-in law).7 The TSO might even issue V, Q or pf set points to DG on the distribution system.8 DSOs are responsible for ensuring the long-term ability of the system to meet reasonable demands for thedistribution of electricity and for operating, maintaining and developing under economic conditions a secure, reliableand efficient electricity distribution system in their area with due regard for the environment and energy efficiency(Article 25(1) of Directive 2009/72/EC).

8
In sum, the key challenges for DSOs include Increased need for network reinforcement to accommodate new DG connections:
Network operators are expected to provide an unconditional firm connection which may
cause delays or increase costs for connecting embedded generation;
Increased complexity for extension (including permitting procedures) and maintenance of the
grid may require temporary limitation for connection of end customers.
Problems with operation of the distribution grid:
Local power quality/operational problems, in particular variations in voltage but also fault
levels and system perturbations like harmonics or flickers;
Rising local congestions when flows exceed the existing maximum capacity, which may result
in interruptions of generation feed-in or supply;
Longer restoration times after network failure due to an increased number and severity of
such faults.
BOX 1: Current DSO responsibilities
Distribution planning, system development, connection & provision of network capacityDSOs are in charge of developing their network. They design new lines and substations and ensurethat they are delivered or that existing ones are reinforced to enable connection of load anddecentralised power production. Depending on the size of a DG/RES & DER system, DSOs may requirea new connection at a particular voltage level. They are obliged to provide third party access to all endcustomers and provide network users with all information they need for efficient access and use ofthe distribution system. They may refuse access to the grid only when they can prove that they lackthe necessary network capacity (Art. 32 of Directive 2009/72/EC).
Distribution network operation/ management and support in system operationDSOs maintain the system security and quality of service in distribution networks. This includescontrol, monitoring and supervision, as well as scheduled and non-scheduled outage management.DSOs are responsible for operations directly involving their own customers. They support the TSOs,who are typically in charge of overall system security, when necessary in a predefined manner, eitherautomatically or manually (e.g. via load shedding in emergency situations). Such systems ofcooperation for intervention in generation and demand in cases of system security events are definedin detail in national regulations. A common basis for these rules is now being set in the EU-widenetwork codes (operational security, balancing, congestion management, etc.).
Power flow management: Ensuring high reliability and quality in their networks Continuity and capacity: DSOs are subject to technical performance requirements for quality of
service including continuity of supply (commonly assessed by zonal indexes such as averageduration of interruptions per customer per year (SAIDI) and average number of interruptions percustomer per yea (SAIFI) or individual indexes like number and duration of interruptions) andpower quality laid out in national law, standards and grid codes.9 They are also responsible forvoltage quality in distribution networks (maintaining voltage fluctuations on the system withingiven limits). In planning, the DSO ensures that networks are designed to maintain these standardsregardless of power flow conditions. However in cases of network faults, planned outages or other
9 National regulatory authorities (NRA) have the duty of setting or approving standards and requirements for qualityof supply or contributing thereto together with other competent authorities (Article 37(1h) of Directive 2009/72/EC).

9
anomalous events, the DSO must undertake switching actions so that adequate supply quality ismaintained. While to date this has been rather static, increasingly automation or remote switchingwill need to be undertaken to ensure near real-time fault isolation and restoration of supply.
Voltage and reactive power: Voltage quality is impacted by the electrical installations of connectednetwork users. Thus the task of the DSO in ensuring voltage quality must account also for theactions of network users, adding complexity and the need for both real-time measurement andmitigating resources (i.e. on-load voltage control) and strict network connection criteria. Europeanstandard EN 50160 specifies that the maximum and minimum voltage at each service connectionpoint must allow an undisturbed operation of all connected devices. Voltage at each connectionshould thus be in the range of ± 10% of the rated voltage under normal operating conditions. Insome countries, compliance with these or other specified national voltage quality requirementsthat can be even more restrictive represents part of DSOs’ contractual obligations and qualityregulation. In some countries, network operators are required to compensate customers in casethe overall voltage quality limits are breached.10
1.2.3. Traditional Design of Distribution Networks
The fundamental topological design of traditional distribution grids has not changed much over the pastdecades. Up until recently, DSOs have distributed energy and designed their grids on a top-down basis.Under the paradigm “networks follow demand”, their primary role was to deliver energy flowing in onedirection, from the transmission substation down to end users. This approach makes use of very fewmonitoring tools and is suitable for distribution networks with predictable flows.
Because of the different development of electrification, distribution networks characteristics differ fromcountry to country. Voltage rate levels are usually distinguished as LV, MV or HV.11 As illustrated in Figure 8the level of supervision, control and simulation in HV distribution networks is close to that of TSOs in theirnetworks. MV and LV networks are mostly rather passive – here DSOs lack network visibility and control.The lower the monitoring level, the lower the operational flexibility. For more detailed information onautomation and control see results of a survey conducted among EURELECTRIC members in Annex 3.A.
Figure 8 Current DSO networks
10 CEER Benchmarking report, 2011.11 CENELEC standard EN 50160 (2010) uses following the classification: LV < 1 kV, MV 1 kV – 36 kV, HV 36 - 150 kV.

10
BOX 2: Traditional distribution networksTraditional distribution networks have different characteristics in topology (meshed or radial), operationtype (meshed or radial), number of assets and customers, operational flexibility and monitoring level:
HV networks (also called sub-transmission) are quite similar to transmission networks. The topologicaldesign of the grid is meshed and may be operated as radial or meshed depending on the situation. HVnetworks are operated in a similar way all around Europe: N-1 or N-2 contingency criteria12 are usuallyin place for rural and urban areas, respectively. The monitoring level at HV is very high. DSOs operatingHV grids are able to supervise and control the HV network from the control room centres.
MV distribution networks significantly differ in their characteristics with respect to urban and ruralgrids. Mostly, meshed topology is used that can be operated either as meshed (closed loop) or radial(open loop). In some countries or depending on the network type in a region, MV operation mayalways be radial. A high density of loads and relatively high demand typically causes high equipmentload factors (transformers, cables) for urban areas. Rural areas are characterised by larger geographicalcoverage and lower load density and thus longer lines, high network impedances and lower equipmentload factors. The proportion of European MV networks with remote monitoring, control andautomated protection/fault sectionalisation is currently low but increasing by necessity.
LV networks are usually radially operated. Similar to MV networks, urban and rural LV networks havedifferent characteristics. The proportion of LV monitoring and control is typically even lower than inMV. Measurements usually rely on aggregated information from substations and are only availablewith a significant time lag. Profile information will not be available.
2. Active Distribution NetworksOnce DG in distribution networks surpasses a particular level, building distribution networks able to supplyall load & DG within the existing quality of service requirements will frequently be too expensive andinefficient. For example, in many places the network would only be constrained for few hours per year. Inaddition, the security of supply and quality of service problems will no longer be limited to specificsituations.
Integrating the high amount of existing and projected DG and, later, other DER will require new ICTsolutions and an evolution of the regulatory framework for both network operators and users. Networkplanning and operation methodologies need to be revised to take the new solutions into account.
2.1. Key Building Blocks
There is no one-size-fits-all solution because distribution networks are rather heterogeneous in terms ofgrid equipment and DG density at different voltage levels. Every distribution network should be assessedindividually in terms of its network structure (e.g. customers and connected generators) and publicinfrastructures (e.g. load and population density). Nevertheless, the needed development towards futuredistribution systems which meet the needs of all customers can be described in the three schematic stepspictured below: from (1) passive network via (2) reactive network integration to (3) active systemmanagement.
12 Rule according to which elements remaining in operation after a fault of a distribution system element must becapable of accommodating the new operational situation without violating the operational limits.

11
Figure 9 Three-Step Evolution of Distribution Systems
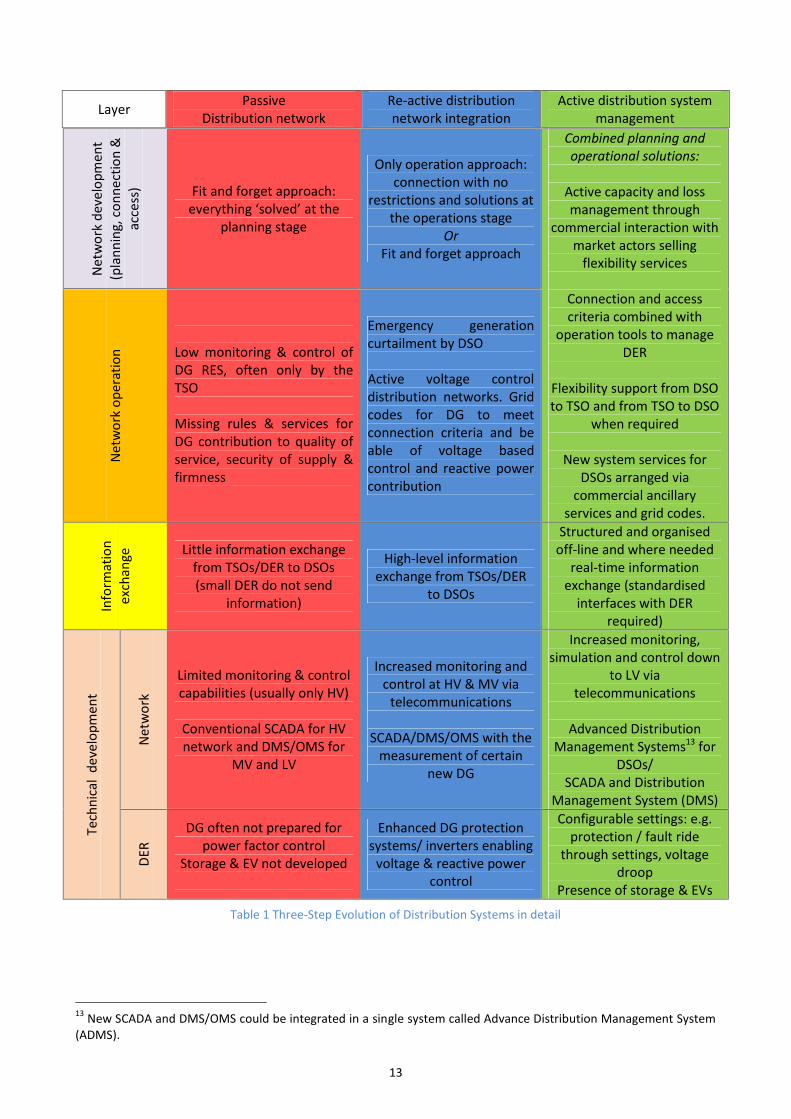
(1) Passive distribution networks make use of the so-called ‘fit and forget’ approach. This approachimplies resolving all issues at the planning stage, which may lead to an oversized network. DSOsprovide firm capacity (firm grid connection and access) that may not be fully used anymore due tolocal consumption of the electricity produced by DG. This approach has the advantage of requiringlow flexibility, control and supervision, but is only possible for a network with very low DERpenetration. Once DER penetration rises, the system cannot be designed to cater for allcontingencies without very significant investment in basic network infrastructure, making thisapproach less economical.
(2) Reactive network integration is often characterised by the ‘only operation’ approach. Thisapproach is used today in some countries with a high share of DG. The regulation requiresconnecting as much DG as possible with no restrictions. Congestions (or other grid problems) aresolved at the operation stage by restricting both load and generation. This solution could restrictDG injections during many hours per year and lead to negative business case for DG if they are notremunerated for the restrictions. Already today, some ‘front-runner’ countries with high DGpenetration levels can be considered as having reached the interim ‘reactive network integration’stage at which DSOs solve problems once they occur (largely only in operation).
(3) The active approach would allow for interaction between planning, access & connection andoperational timeframes. Different levels of connection firmness and real-time flexibility canreduce investment needs. The existing hosting capacity of the distribution network can be usedmore optimally if other options including ICT, connection & operational requirements guaranteeingadequate performance of DER towards the system (i.e. via grid codes) and market-basedprocurement of ancillary services from DER are considered. Operational planning of distributionnetworks (similar to that at transmission level) would be in place in networks with high DER sharesin order to incentivise dispatch in a way that is compatible with the network. Improved networkcapacity planning and congestion management at distribution level at different times and locationswill be required to maximise the level of generation which is injected in the most economical wayfor all parties, while maintaining network stability. DSOs must have tools for overseeingmaintenance of network standards. Additionally they should have the possibility to buy flexibilityfrom DG and load in order to optimise network availability in the most economic manner or tomanage network conditions which are beyond the contracted connection of the customers. DSOsshould have the possibility to buy flexibility from DG and load on so-called ‘flexibility platforms’ inorder to solve grid constraints. The network reinforcement could be deferred until the momentwhen it becomes more cost-effective than the on-going cost of procuring services from DER.Interactions between DSOs, TSOs and market actors at different stages are depicted in Figure 10.

12
Figure 10 DSO interactions with markets & TSO at different time frames
Using the active system management approach would allow maximal integration of DER, making themost of the existing grid while enabling DSOs to fulfil the security standards and enabling DER to find theright conditions for their business plan in the most cost-effective way.
Table 1 highlights the key features of each phase, broken down into the different ‘layers’: development &planning, operations, information exchange and technical development. The subsequent sections of thereport discuss the active system management approach within the individual layers in detail.
13
Net
wor
k de
velo
pmen
t(p
lann
ing,
con
nect
ion
&ac
cess
) Fit and forget approach:everything ‘solved’ at the
planning stage
Only operation approach:connection with no
restrictions and solutions atthe operations stage
OrFit and forget approach
Combined planning andoperational solutions:
Active capacity and lossmanagement through
commercial interaction withmarket actors selling
flexibility services
Connection and accesscriteria combined with
operation tools to manageDER
Flexibility support from DSOto TSO and from TSO to DSO
when required
New system services forDSOs arranged via
commercial ancillaryservices and grid codes.
Net
wor
k op
erat
ion Low monitoring & control of
DG RES, often only by theTSO
Missing rules & services forDG contribution to quality ofservice, security of supply &firmness
Emergency generationcurtailment by DSO
Active voltage controldistribution networks. Gridcodes for DG to meetconnection criteria and beable of voltage basedcontrol and reactive powercontribution
Info
rmat
ion
exch
ange Little information exchange
from TSOs/DER to DSOs(small DER do not send
information)
High-level informationexchange from TSOs/DER
to DSOs
Structured and organisedoff-line and where needed
real-time informationexchange (standardised
interfaces with DERrequired)
Tech
nica
l de
velo
pmen
t
Net
wor
k
Limited monitoring & controlcapabilities (usually only HV)
Conventional SCADA for HVnetwork and DMS/OMS for
MV and LV
Increased monitoring andcontrol at HV & MV via
telecommunications
SCADA/DMS/OMS with themeasurement of certain
new DG
Increased monitoring,simulation and control down
to LV viatelecommunications
Advanced DistributionManagement Systems13 for
DSOs/SCADA and Distribution
Management System (DMS)
DER
DG often not prepared forpower factor control
Storage & EV not developed
Enhanced DG protectionsystems/ inverters enabling
voltage & reactive powercontrol
Configurable settings: e.g.protection / fault ride
through settings, voltagedroop
Presence of storage & EVs
Table 1 Three-Step Evolution of Distribution Systems in detail
13 New SCADA and DMS/OMS could be integrated in a single system called Advance Distribution Management System(ADMS).
Layer PassiveDistribution network
Re-active distributionnetwork integration
Active distribution systemmanagement

14
2.2. Distribution Network Development, Planning, Access & Connection
2.2.1. Coordinated Network Development
DSOs should be able to plan their grids well in advance to prevent bottlenecks in the most cost-effectiveway. Data acquired within distribution network monitoring and information exchange with TSOs anddistributed energy resources (see sections 3.4 & 3.5) could be very beneficial in this respect.
In addition, every connection request should be analysed and considered in the planning process in orderto make the best of the existing network. According to the traditional regulatory approach to connectionrequests analysis currently applied in most countries, the network operator performs an individual analysisand provides an individual solution to each connection. The first connections may make use of the availablecapacity of the existent network. But once there is an increased demand for new DG connections in thesame area and the available network capacity is limited this approach is not always optimal from theoverall cost and network development perspective.14
One way to tackle this issue is to allow for coordination of all relevant actors, including networkoperators, investors and local authorities in the analysis of connection requests (see Box 3 for Spanishexample).
BOX 3: Coordination for efficient RES and network development: Spanish “Evacuation Boards” approach
To rationalise the RES expansion and optimise the available energy resources, some Spanish regionscreated so-called "Evacuation Boards". They are characterised by a coordinated grid connection requestprocess. RES installation plans are deployed and coordinated between the administration, RES investorsand transmission and distribution system operators. In these evacuation boards the TSO or DSO do notreceive individual requests; they are collected by the Regional Administration and after a validation processsubmitted for an aggregated analysis to be made together by the DSO & TSO. The positive impact of thenew networks for consumption (extra capacity for consumers) is also considered. In addition to the cost-sharing mechanism (proportionally to the capacity assigned to each RES project), the covenants for thedevelopment of such infrastructures contain the necessary guarantees, payment and execution terms.Benefits of this approach include overall minimised network development and project cost, reduction ofproject risks thanks to the possibility to correctly analyse both the costs and timetables needed for thedifferent RES penetration scenarios, and reduced time for acquiring all necessary administrative permits.
Coordination between TSOs and DSOs is likely to play a particular role. Whilst in some cases modificationsrequired by DSOs from TSOs or vice versa do not considerably affect the capabilities of one or the other tomaintain their network performance, the impact may be substantial in other cases. For example, when theHV or UHV (ultra high voltage) network is saturated, connection of generation to the MV network cannotbe planned without taking into account the conditions at HV network. An optimal network development isalso key to minimise losses in the electrical system. Transmission or distribution network conditions whichrequire regular (or conditional) exchange of information between TSOs and DSOs should be defined.Standard reciprocal data exchange arrangements about the expected development of generation/loadat the different voltage levels and about the network reinforcements needed at the TSO level, notdirectly related to the lower voltage planning activities, should be put in place.
14 First requests for connection get the available capacity of the existent network at a low cost, but as they increasethey require more complex and expensive network development solutions. In countries where generators bear gridconnection as well as grid reinforcement/extension costs (deep connection charges), this may make the individualprojects economically unviable. In countries where generators bear grid connection cost but not the gridreinforcement cost (shallow connection charges) and do not pay any use of system charge, those reinforcementnetwork costs are socialized.

15
Coordinated planning as per the Irish “Gate” process (see box below), batch planning of DG connectionapplications at TSO and DSO level as appropriate, may see the most economical net cost of connection.Coordination between the TSO and DSO in Schleswig-Holstein (northern Germany), where 9,000 MW ofwind should be connected by 2015, are another example in this respect.
BOX 4: Coordination in planning between TSO & DSO - The Group Processing Approach in Ireland
Up to 2003, applications to system operators for connection of wind were processed sequentially. Since2004, following a moratorium on wind connections, DG is planned in ‘Groups’ based on their networklocation and capacity and processed in batches known as ‘Gates’. This system was introduced to deal withthe massive number of applications. The queue for connection comprises both DSO and TSO applicants.Applications are processed by the system operator (TSO or DSO) most suited to their group connectionirrespective of which system operator they originally applied to. The connection method is determined bythe Least Cost Technically Acceptable (LCTA) method for the defined sub-group. The cost of the networkreinforcement for the group is shared by the different wind farms proportionally to their capacity.Connections below 500 MW have a different planning process and are treated as individuals with a quickerprocess, reflecting their connection generally being less onerous and costly. The regulator (with input fromboth system operators and wind industry) determines criteria for eligibility for inclusion of “Gate”. Thismethod facilitates large quantities of RES being processed in a structured manner and rationalisesallocation of scarce capacity. Transmission and distribution systems are developed in co-ordinated fashion.
2.2.2. Network Capacity Management
Network capacity management would encompass optimisation of network capacity via improvedconsideration of DERs in network planning. The DSO ability to identify areas with possible overloadproblems well in advance as described within the active approach is a precondition for this.
The options that should be further investigated include:
New network access options such as variable network access contracts; and Alternatives involving close to real-time operation solution such as DSO tendering for a flexibility
service.
Variable access contracts
DG developers could have a possibility to select firm or variable access contracts based on their ownbusiness plan. Variable network access rights could be offered as a discounted connection contract forgeneration customers, with pre-defined mechanisms for DG to reduce their output to a predefined limit ininfrequent situations, expected only for few hours per year. If only several hours of re-dispatching per yearare needed to limit peaks of production and use network capacity more efficiently, those would be morethan offset by an additional DG output in all other hours due to a higher installed DG capacity up to acertain point where the cost of net losses and curtailed generation become relevant to justify networkreinforcement.
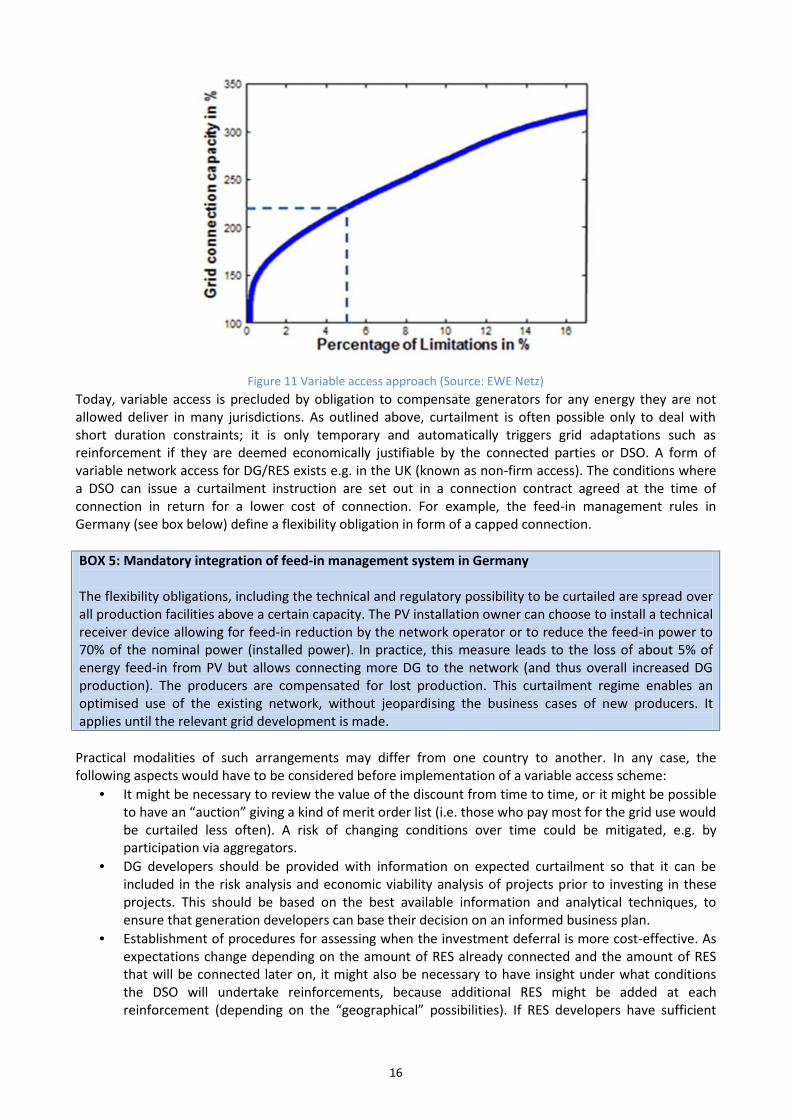
A model example in Figure 11 illustrates that limiting peak power in-feed of e.g. 5% of the time would givean opportunity to connect 220% more DG. In these cases, generation operators should be incentivised tochoose this option, e.g. by reduced connection cost (cheaper but with limited guarantee of injection withina clearly defined framework) or other form of compensation. This could be executed either via directcontracts between DSOs and generators/load or indirectly between DSOs and aggregators who would pay ayearly option premium to DG/load and then offer flexibility to the DSO.
16
Figure 11 Variable access approach (Source: EWE Netz)Today, variable access is precluded by obligation to compensate generators for any energy they are notallowed deliver in many jurisdictions. As outlined above, curtailment is often possible only to deal withshort duration constraints; it is only temporary and automatically triggers grid adaptations such asreinforcement if they are deemed economically justifiable by the connected parties or DSO. A form ofvariable network access for DG/RES exists e.g. in the UK (known as non-firm access). The conditions wherea DSO can issue a curtailment instruction are set out in a connection contract agreed at the time ofconnection in return for a lower cost of connection. For example, the feed-in management rules inGermany (see box below) define a flexibility obligation in form of a capped connection.
BOX 5: Mandatory integration of feed-in management system in Germany
The flexibility obligations, including the technical and regulatory possibility to be curtailed are spread overall production facilities above a certain capacity. The PV installation owner can choose to install a technicalreceiver device allowing for feed-in reduction by the network operator or to reduce the feed-in power to70% of the nominal power (installed power). In practice, this measure leads to the loss of about 5% ofenergy feed-in from PV but allows connecting more DG to the network (and thus overall increased DGproduction). The producers are compensated for lost production. This curtailment regime enables anoptimised use of the existing network, without jeopardising the business cases of new producers. Itapplies until the relevant grid development is made.
Practical modalities of such arrangements may differ from one country to another. In any case, thefollowing aspects would have to be considered before implementation of a variable access scheme:
It might be necessary to review the value of the discount from time to time, or it might be possibleto have an “auction” giving a kind of merit order list (i.e. those who pay most for the grid use wouldbe curtailed less often). A risk of changing conditions over time could be mitigated, e.g. byparticipation via aggregators.
DG developers should be provided with information on expected curtailment so that it can beincluded in the risk analysis and economic viability analysis of projects prior to investing in theseprojects. This should be based on the best available information and analytical techniques, toensure that generation developers can base their decision on an informed business plan.
Establishment of procedures for assessing when the investment deferral is more cost-effective. Asexpectations change depending on the amount of RES already connected and the amount of RESthat will be connected later on, it might also be necessary to have insight under what conditionsthe DSO will undertake reinforcements, because additional RES might be added at eachreinforcement (depending on the “geographical” possibilities). If RES developers have sufficient

17
transparency, they will take possible interruptions into account, as well as the value they need toearn back on a flexibility platform.
The manner in which to curtail generators (pro rata, market based etc.) and the operational rulesfor the constraint location where more than one generator contribute to the constraint would haveto be specified.
‘Firm DG production and load off take management’ via ahead tendering for commercial services
Assessment of firm capacity is important for network operators to foresee how much generation cancontribute to peak consumption. A mechanism incentivising DG to generate or the consumption to stopconsuming when the peak on the network takes place would enable more efficient use of the existingdistribution assets and deferral of grid reinforcement, as illustrated in Figure 12. Provision of certain firmcapacity would be rewarded as an extra service for the system. Remuneration for this service could bedetermined through an open commercial tendering process organised by DSOs, e.g. via a local auction fornecessary services (DG to bid certain amount of capacity reliably available). In any such cases, the party (DGor other commercial operator) deemed reliable and contracted to deliver certain firm capacity must beheld financially responsible for its delivery.
Figure 12 Extension of network capacity for peak load versus a load management solution (Source: EWE Netz)All in all, due to various generation mixes, distribution of generation over different voltage levels andgeographic distribution of the resources, a one-size-fits-all approach may not be adequate from the socialwelfare point of view. The option of giving network customers a choice between firm injection and higherconnection charges and non-firm injection and considerably lower connection charges should be assessedagainst other solutions.
2.2.3. Connection
For proper integration into the network, distributed generation needs to fulfil minimum technical criteria:the equipment and its protective relays must be able to resist voltage dips and prevent islanding and thereshould be separate metering for production and consumption. DG should also bear the same costs as othergenerators, including adequate connection fees. DSOs must know what is on-line when they are working toprevent accidents. Therefore, they should have a possibility to verify compliance with requirements.Distributed generation should thus ‘be registered’ with the DSO, and remote disconnection by the DSO toprevent damage to facilities of other clients while manoeuvring should be technically possible underconditions defined by regulation. To secure safe operation of the distribution grid, DSOs should also be ableto define control schemes and settings for generators connected to their grids, in coordination with theTSO where necessary in order to ensure compliance with overall system requirements.

18
Recommendations: In order to make the best of the existing network, all relevant actors should be involved in the
analysis of connection requests. Network development coordination between TSOs and DSOs shouldbe enhanced. Practical modalities of these arrangements may differ from one country to another.
Future production on DSO level should be taken into consideration when developing the ENTSO-E TenYear Network Development Plan and the relevant national plans. DSOs should be consultedaccordingly.
Market-based network capacity management options such as open commercial tendering processesor optional variable access contracts should be further investigated as an initial tool foraccommodating large amount of DG in situations when it is proven to be more cost-effective thanwaiting for provision of connection and access to the grid until any curtailment is ruled out.
Distributed generation needs to fulfil minimum connection criteria.
2.3. Active Distribution Network Operation
Distributed generation should be incentivised to sell their production into the electricity market15.Aggregation of DG in form of so-called Virtual Power Plants (VPPs) or of distributed generation, flexibleloads and possibly decentralised storage is expected to play an important role in facilitating access of smallcustomers to the market and addressing the uncertainty of availability and providing enhanced capability tomanage the risk of not being able to meet the contracted scheduled output. The aggregator role could alsobe taken up by electricity service companies (ESCO) or suppliers. The aggregator would provide an interfacebetween DER and other market actors and system operators. In addition, DG should be obliged to meetscheduling, nomination and balancing obligations as other power generators do, including payment ofbalancing charges. DG should also be responsible for their imbalances on equal terms with other BalancingResponsible Parties. It is highly beneficial for system stability and cost reduction if variable RES technologiesare incentivised to reduce forecast errors and to minimise imbalances in the market and take up necessaryresponsibilities towards the system as other generation technologies do.16
The network plays an important service role of supporting the market. Operational barriers may arise,characterised by one or more violations of the physical, operational, or policy constraints under which thegrid operates in the normal state or under contingency cases. They are transient – associated with aspecified point in time. As such, they may be detected before or during the day-ahead, the hour-aheadmarkets or during real-time system operation. In order to facilitate secure network operation and smoothfunctioning of the future market with high DER penetration, DSOs need to become active operators oftheir networks. This means that they need adequate tools to operate their networks. In addition, networkusers need to actively participate in network usage optimisation. In this way, the possible abovementionedviolations can be eliminated.
15 Today, small DG typically sells their electricity output at fixed prices to the TSO, an electricity supplier or other thirdparty market participant. Different economic support schemes for the production of electricity from RES andcombined heat and power (CHP) have been implemented at national level. Where fixed feed-in tariffs are in place,generators are exempted from market signals & prices. Support schemes shall be made more market-oriented, basedon production rather than investment. Support schemes which expose RES generators to market prices are morecompatible with well-functioning of electricity markets, thus providing the correct price signals.16 These obligations can mean new costs (which should be taken into account in adjustment of the supportmechanism), but can also mean new sources of revenues. See EURELECTRIC report RES Integration and MarketDesign: Are Remuneration Mechanisms Needed to Ensure Generation Adequacy? May 2011.
19
2.3.1. DSO System Services & ‘Traffic Lights’ Approach
Active DSOs should be allowed to coordinate the offering of new system services, as required by the newEnergy Efficiency Directive (Art 15.1 of 2012/27/EC) while ensuring the security, integrity and quality ofsupply in their networks. The DSO is best placed to facilitate this mechanism as the data need to begathered at substation level and in-depth knowledge of the grid layout and its behaviour is required.Moreover, the DSO has a legal responsibility to ensure that such technical constraints are mitigated.
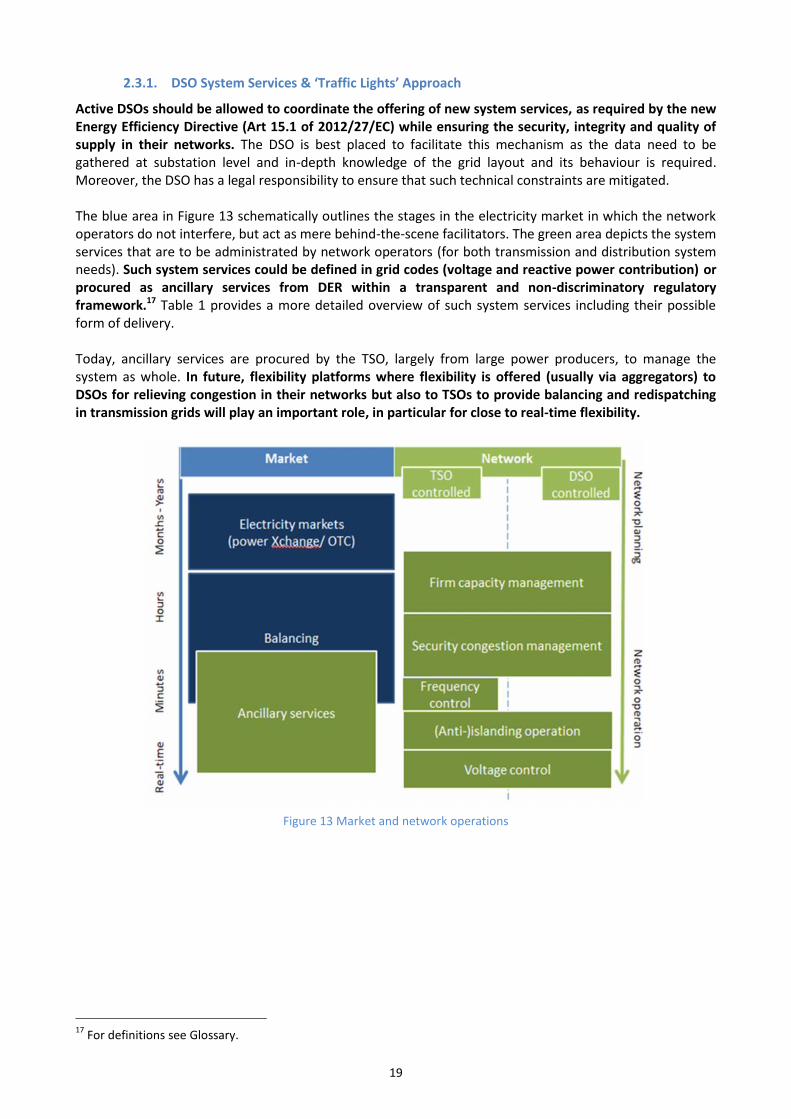
The blue area in Figure 13 schematically outlines the stages in the electricity market in which the networkoperators do not interfere, but act as mere behind-the-scene facilitators. The green area depicts the systemservices that are to be administrated by network operators (for both transmission and distribution systemneeds). Such system services could be defined in grid codes (voltage and reactive power contribution) orprocured as ancillary services from DER within a transparent and non-discriminatory regulatoryframework.17 Table 1 provides a more detailed overview of such system services including their possibleform of delivery.
Today, ancillary services are procured by the TSO, largely from large power producers, to manage thesystem as whole. In future, flexibility platforms where flexibility is offered (usually via aggregators) toDSOs for relieving congestion in their networks but also to TSOs to provide balancing and redispatchingin transmission grids will play an important role, in particular for close to real-time flexibility.
Figure 13 Market and network operations
17 For definitions see Glossary.

System service Purpose Provision by which typeof DER
Information exchanges Form of delivery
Firm capacitymanagement (long-term)
DSO planning purposes;optimize of network capacityutilisation DG with a view tousing assets most efficiently
CHP, small hydro,stochastic RES withintegrated storageAggregated demandproviders, DSM
DG outage programs and availabilities information (DG->DSO) Real time generation output (DG->DSO) Real time demand flexibility information (DER->DSO) Firmness periods (DSO->DER)
Commercial
Losses compensation Increased system efficiency DSO, DG, demandcustomers
Real time load and network voltage or fault conditions (DSO->DSO) Real time generation output (DG->DSO) V, Q, pf setpoints (DSO->DG) Demand reduction signals (DSO->Aggregators)
Commercial
Security congestionmanagement (short-term)
Operate the grid within thesecurity standards
RES, CHP, distributedstorage, DSM
Real time load and network voltage or fault conditions (DSO -> DSO) Real time generation output & load flexibility (DG -> DSO) Reduced setpoint/ reduction signal (DSO -> DG) DG outage programs and availabilities information (DG->DSO)
Mandatory with compensation or bycommercial arrangement (non-firmaccess contracts)
Anti-islanding operation Avoid unsafe, unbalanced andpoor quality distributionelectric islands
DG, storage, DSO (localnetwork controls)
Local automatic signal generated in case of fault or triggering conditions -> all local DG, storage, network control points
Local signal generator -> DSO SCADA or central control (and local /regional control depot), notification signal by DSO
Mandatory without compensation (gridconnection rules defined in grid codes)
20 Frequency control Under extreme situations ofsystem strain, TSO to call uponDSO to deliver support – DSOas a conduit but needs to seewhat is happening
DG & load to TSO via DSO Real time active and reactive power flows information exchange at theT/D interface (DG & load -> DSO ->TSO)
Load/generation to adapt (TSO-> DSO -> DG & load)
Commercial (at TSO level)
Islanding operation Improve continuity of supplywhen higher voltage source isunavailable
DG, storage, DSO (localnetwork controls), DSM
Real time active and reactive power flows information exchange (DER ->DSO)
V, P, Q setpoints (DSO->DER)
Mandatory with compensation
DSO Voltage control Local supply quality securityand increasing amount of DGpower that could be injected inthe grid
PV, Wind power, CHP,distributed storage, DSM
Reactive requirement (amount and electrical or geographical deliverylocation) (TSO -> DSO)
Real time load and network voltage or fault conditions (DSO -> DSO) Real time generation output (DG -> DSO) V, Q, pf setpoints (DSO -> DG)
Mandatory without compensation tomaintain defined limits for distributionsystem stability. Commercial forpurposes beyond maintenance ofnetwork stability or outside the scopeof the customer’s own connection
Information exchange Optimise DSO and TSO controlsupervision, and scheduling
DER, TSO TSO Real time and off-line measurements and topology information(TSO -> DSO)
Real time generation output (DG->DSO) DG and TSO outage programs and availabilities information (TSO->DSO). DG generation forecasting (DG-> DSO-> TSO)
Mandatory with compensation
Table 2 New System Services at Distribution Level

21
To manage the operation of distribution systems, similarly to the usual practice in transmission networks,basic system states should be defined, e.g. within security standards or grid codes. A “traffic light scheme”could be used to distinguish between system states and selecting appropriate type of actions (see Figure 14and the box below):
The ‘secure operating region’ (1) results from overlaying the stable operating points on anillustrative power-voltage curve for abstracted two-bus system. It represents an area where thenetwork is secure and the power can flow either towards the consumer (because demand isgreater than generation) or back to the system (when generation exceeds demand). If the system isat the secure operating point 1, the market operates and the DSO has clear visibility of this. Theboundaries of this secure operating region depend on the physical characteristics of the networkand system dynamics.
‘Unsecure operating points 2 and 4’ illustrate the situations hampering secure operation of thedistribution system: voltage increase and congestion (the plane has been rotated to align it with atime-varying load profile).
‘Operating points 3’ indicate alert network states in which congestion management should beconducted in order to keep the grid from entering the red emergency state. When possible the DSOactively engages with the market (DG or load) to procure flexibility to relieve grid constraints.
All in all, market principles should work in the first place when the system is in the ‘green’ and ‘yellow’states. That should be the case most of the time. DSOs should override control (directly or indirectly) ofsupply or demand only in strictly defined emergency cases (when the system enters into the red state).Actions in this state must be specific and well defined by e.g. regulation or contracts and be temporary innature. Transparency is needed (each time of occurrence and reasons); and analysis should be made ifindeed DG/load were not able to offer sufficient services.
Figure 14 Instability in the distribution system

22
The Traffic Light Concept
1. Green: Normal operating state
2. Yellow: Alert state – DSO has an emerging congestion. DSO actively engages with the market (DGor load) to procure flexibility to relieve grid constraints:
a) Via flexibility platform: a methodology has to be developed which links the offers ofaggregators with identification for the location. For example, aggregators could divide theirVirtual Power Network capacity into local pools. A DSO can contract an aggregator fordelivering local generated electricity or load from the local capacity pool. This can befacilitated by the DSO data hub.
b) Directly: A DSO could contract the customer (including DER) in order to maximise theutilisation of distribution assets in planning and operational timescales where locallyneeded with ensuring transparency and non-discrimination for example via tenders.
3. Red: Unsecure operation – Emergency cases
In strictly defined emergency cases, the DSO would be able to manage distributed renewablegeneration, to implement grid efficiency improvement measures, and to control the isolation andrestoration of outages. This is the last measure taken by the DSO when every other option hasfailed to restore system integrity.
18
Distribution congestion
Security congestion management would be used to solve the technical constraints at distribution levelclose to real-time in the alert state (‘yellow light’). In these defined cases, the DSO could deviate from themerit order, but ex-post justification and compensation should be provided. This could be executed by pre-agreed contracts for instance. The DSO should then pay the “up regulating” cost elsewhere in the system,and should remunerate the downward cost to the local generator that is constrained off in his grid(including the missed income from the support scheme and the costs of keeping balanced position).
18 For definitions of CLS and DMS see glossary.
23
Emergencies
Emergency tools including direct load management (load shedding) and emergency DG curtailmentshould be used only in well-defined emergency states/once the contracted options are exhausted. Whenthe grid stability is at risk, DSOs should be able to act physically to control and constrain off both localconsumption and production (as is already the case in some countries – e.g. Germany or Sweden). Priorityaccess rules should not restrict network operators’ ability to flexibly respond to emergency situations.
Any action on distribution network users requested by the TSO should be agreed with the DSO as systemoperators. TSOs should not act on any individual DER connected to the distribution system. Any directorder from the TSO to DER embedded in distribution networks targeted to safeguard operation of thesystem will be executed by the DSO, not the TSO.
2.3.2. Information Exchange
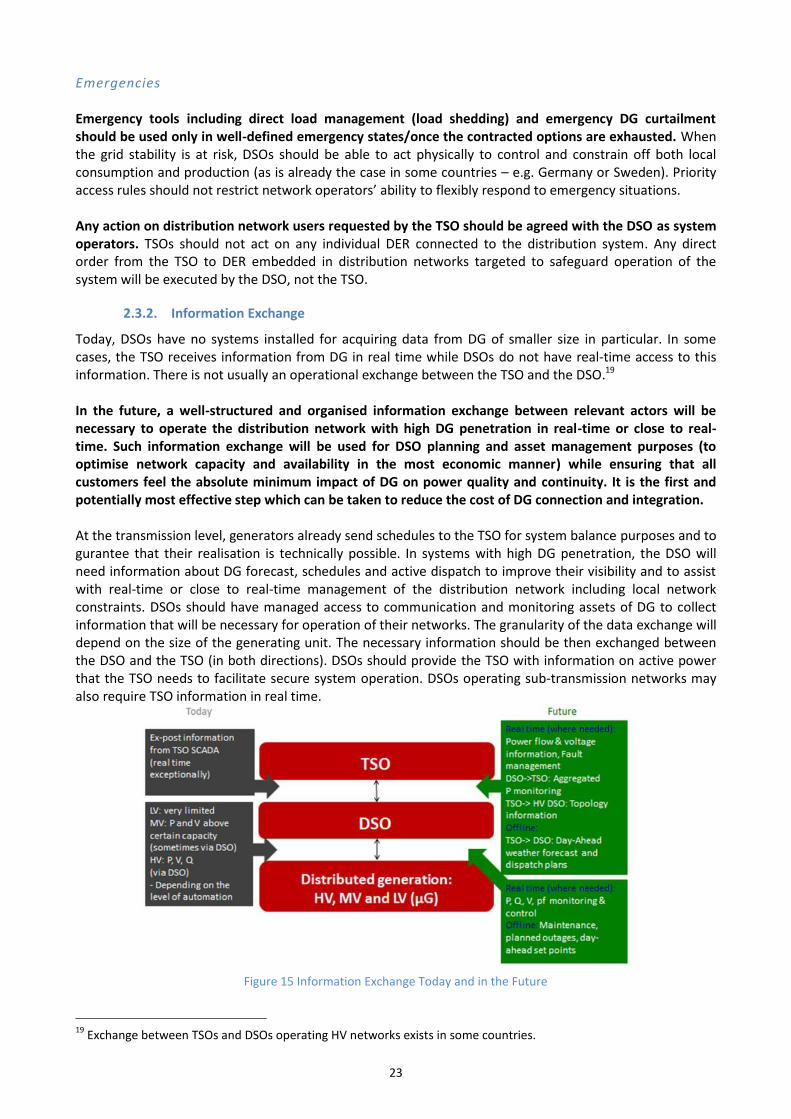
Today, DSOs have no systems installed for acquiring data from DG of smaller size in particular. In somecases, the TSO receives information from DG in real time while DSOs do not have real-time access to thisinformation. There is not usually an operational exchange between the TSO and the DSO.19
In the future, a well-structured and organised information exchange between relevant actors will benecessary to operate the distribution network with high DG penetration in real-time or close to real-time. Such information exchange will be used for DSO planning and asset management purposes (tooptimise network capacity and availability in the most economic manner) while ensuring that allcustomers feel the absolute minimum impact of DG on power quality and continuity. It is the first andpotentially most effective step which can be taken to reduce the cost of DG connection and integration.
At the transmission level, generators already send schedules to the TSO for system balance purposes and togurantee that their realisation is technically possible. In systems with high DG penetration, the DSO willneed information about DG forecast, schedules and active dispatch to improve their visibility and to assistwith real-time or close to real-time management of the distribution network including local networkconstraints. DSOs should have managed access to communication and monitoring assets of DG to collectinformation that will be necessary for operation of their networks. The granularity of the data exchange willdepend on the size of the generating unit. The necessary information should be then exchanged betweenthe DSO and the TSO (in both directions). DSOs should provide the TSO with information on active powerthat the TSO needs to facilitate secure system operation. DSOs operating sub-transmission networks mayalso require TSO information in real time.
Figure 15 Information Exchange Today and in the Future
19 Exchange between TSOs and DSOs operating HV networks exists in some countries.
24
In addition the fact that the participation of DG and load connected to the distribution grid in TSObalancing markets could create constraints in the distribution grid should be taken into account.Generators and flexible loads connected to the distribution grid should be able to also provide theseancillary services for system balancing and transmission system congestion management purposes.Aggregators may be able to achieve certain modifications in the demand and in the generation of theconsumers and producers in their portfolio, in order to offer services to system operators. However, theissue that an area managed by an aggregator may not correspond to the distribution network responsibilityarea (forecasts and schedules are delivered at a portfolio level for a bidding zone) needs to be addressed. Inthese situations, the DSO needs to have adequate visibility to ensure that this activation does not impedesecurity of supply in its own network. Similarly, actions by the DSO to solve constraints could affect thesystem balance.
Appropriate methodologies and processes should be defined in order to ensure that market schedulesare not in conflict with network operation or that transmission and distribution network operation arenot in conflict with one another (e.g. TSO asking for a modification which would violate distribution systemsecurity standards). Enhanced monitoring and control strategies for distribution networks will need to bedeployed (see section 2.4).
2.3.3. Voltage Control
As outlined earlier, voltage in the system needs to be maintained within a range defined by securitystandards. Voltage control is a system service managed by network operators in order to maintain voltagein their networks within limits and to minimise the reactive power flows and consequently, technical losses.While generation/load balance is carried out at system level by the TSO, voltage control of the distributiongrid requires the involvement of the DSO.
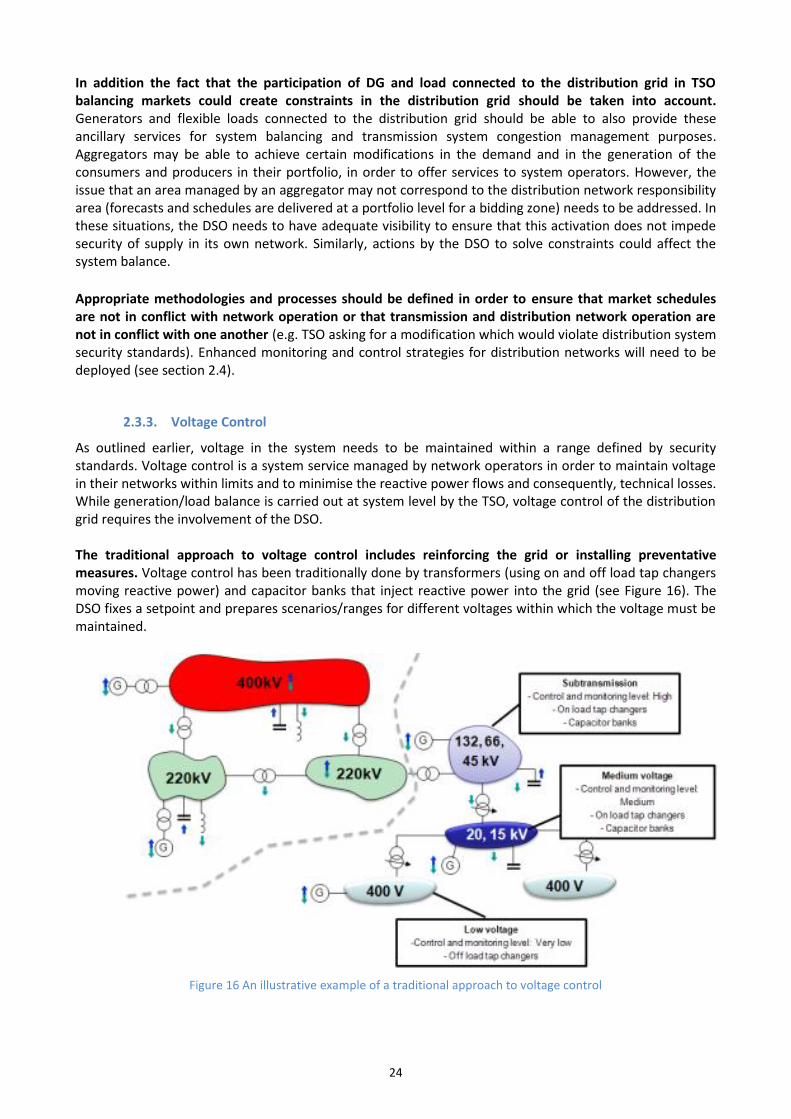
The traditional approach to voltage control includes reinforcing the grid or installing preventativemeasures. Voltage control has been traditionally done by transformers (using on and off load tap changersmoving reactive power) and capacitor banks that inject reactive power into the grid (see Figure 16). TheDSO fixes a setpoint and prepares scenarios/ranges for different voltages within which the voltage must bemaintained.
Figure 16 An illustrative example of a traditional approach to voltage control

25
HV Usually power transformers with on-load tap changers Capacitors frequently used to control the voltage
MV No analogue values in secondary substations obtained in real time (typically analoguevalues only at MV feeders)
MV networks connected to HV through a power transformer with on-load tap changerCapacitors can be commonly found also in these substations to improve the power factor
Voltage setpoints specified at MV substation busbarsLV MV/LV transformers may be fixed ratio (i.e. have not tap changers) or have off-load tap
changers, manually controlled. Taps selected to compensate the effect of MV voltagedrops at LV levels (passive approach).
These tap-changers operate only a few times during transformers lifetime. Sometimes capacitors are installed in consumer facilities to meet power factor
regulations New controllable MV/LV transformers are emerging but expensive
Table 3 Voltage control in current distribution networks
As the penetration of DG in networks increases, it is no longer possible to ensure sustained systemsecurity without some dynamic resources, including reactive power compensation and active voltagecontrol. The DSO’s role in ensuring not only that adequate network capacity is available for all connectedcustomers (demand and load) under all conditions, but also in managing voltage and reactive powerflows on distribution networks is becoming more complex.
Two technical considerations for voltage control in distribution networks include:
With high DG penetration, active power becomes a significant driver for voltages changes in MV andLV networks (the kW-V effect is more significant than the kVAr-V effect). The lower the distributionvoltage level, the higher this effect.
In MV and LV networks, the active power effect may not be always neutralised by the reactivepower injections/withdrawals available in the system. To regulate voltage, DSO should be able tocontrol reactive power and in some cases also active power.
In high-voltage networks, DSOs will be able to maintain the voltage within the security standards if theyhave the means to manage reactive power flows.20 Active power will not cause voltage deviation undernormal operation. On the other hand, at medium and low voltage levels, active power changes due to DGfeed-in cause voltage rises (especially in cables).21 Distributed generation changes voltage triangle designand as a result, both scenarios with and without DG have to be considered. Reactive power may helpcompensate the active power effect but may not be sufficient to neutralise it.
As reactive power cannot be transported over long distances and as many regions with high DG penetration(thus voltage control challenges) have no conventional sources of reactive power, managing voltage on alocal or sub-regional basis could be the most economically viable solution for the entire electricity system.For these purposes, the DSO should be able to sectionalise its networks, to actively interact with DG torequest supply voltage control and reactive dispatch or to exploit active demand services over thedistribution network to solve operational problems. Clear interface conditions and an agreed operationalframework at the interface between TSO and DSO are also necessary (including parameters for TSO-DSOinterface nodes).
20 Through issuing suitable voltage set points and operating power factors to DG and operating network reactivepower or voltage installed resources.21 The R/X ratio (ratio between the resistance and the reactance of overhead lines or cables) explains the relationshipbetween active and reactive power and the voltage level. See Case study A in Annex 2.
26
Innovative approaches to voltage control should be explored. Experiences from several Europeancountries show that compensation at the TSO-DSO connection point may not be flexible enough in case ofemergency. The increasing DG penetration requires continuous adaption of the capacities at theconnection points. Voltage control requires a system approach that would include minimising systemlosses, optimising network investments and coordinating the necessary operational windows and controlactions between the individual TSO and DSO, with particular attention to cases of emergency.
Solutions on the network side and on the network users’ side should be considered:
Network users’ contribution
Generators could contribute to voltage based control. This is already the case in some countries and isbeing tested in others, as shown in case study B in Annex 2. The best generation technologies for voltagecontrol are those that are able to absorb and deliver reactive power. These include modern wind turbines,small hydro and power electronics. Inverters originally supported neither active or reactive power buttoday address reactive power and have also elements for frequency support. For example DERs would reactto voltage changes/disturbances or faults by altering real or reactive power based on pre-defined anddynamically configurable set-points (similarly to how frequency control operates at TSO level today).
Network contribution
There are cases where HV voltage control cannot be achieved in a manner which maintains bothtransmission and distribution security without additional reactive power resources on the network.Investments in new analytical, control and monitoring expertise and facilities in MV and LV (like powerelectronics, real time supervision) may be required. For example, satellite cables with large diameters coulddrastically reduce voltage rise within the grid.22 Alternatively, voltage controlled MV/LV transformers canbe installed in order to decouple the voltage rise within the MV and the LV networks caused by RES feed-in.23 These innovative network techniques would need to be considered and allowed within regulation.
Combination of both solutions
A combination of both solutions may be used. Studies show that in some situations even a contributionby distributed generation will not be able to maintain the voltage within limits. Case study A in Annex 2demonstrates that situations when the required reactive power exceeds the installed active power capacitymay occur. Both to minimise any impact (active power generation) on DG and to ensure that TSO-DSOinterface standards can be maintained for system stability, it may thus be necessary that additional reactiveresources are installed on distribution networks. The contribution of the system operators or DG to theseresources must be reflective of the particular network issue being addressed and the beneficiaries of theinstallation. It may also be necessary in future for DG which will displace reactive power resources to alsocontribute to the reactive power facilities on its hosting networks so as to maximise its potential to deliveractive power.24 This is already the case with larger (industrial) demand facilities that are required to meetstrict power factor regulations. Where this solution is deemed the most cost-effective, generators shouldbe required to comply with minimum connection & operational requirements necessary for managingdistribution network stability. On the other hand, DG contribution to loss minimisation may becompensated on a commercial basis.
22 Werther, Becker, Schmiesing, Wehrmann: Voltage control in low voltage systems with controlled low voltagetransformer (CLVT); CIRED Workshop - Lisbon 29-30 May 2012.23 Thies, Zdrallek, Schmiesing, Schneider: Future structure of rural medium-voltage grids for sustainable energy supply,CIRED Workshop - Lisbon 29-30 May 2012.24 Traditionally reactive power was supplied, rather than absorbed, by generation. As DG displaced conventionalgeneration, reactive power resources are reduced.
27
Reduction of active power that might be technically necessary to manage the network voltage and avoidcomplete generation disconnection should be used only when other solutions have been exhausted.Congestion management would apply in this case, with emergency DG curtailment only if necessary.
Recommendations: Active DSOs should be allowed to coordinate the offering of new system services. Such system
services could be procured as ancillary services from DER or defined in grid codes (voltage andreactive power contribution).
Flexibility platforms where flexibility is offered (either directly by larger DG/load or viaaggregators which group a large number of DG and loads) to DSOs (but also to TSOs to providebalancing and redispatching in transmission grids) could play an important role for close to real-time flexibility in particular.
DSOs should be included in the information exchange abouto planned location / connection / clustering of contracted customers (aggregators)o forecasts and schedules necessary for dealing with local grid constraints.
Appropriate methodologies and tools for these purposes should be developed. Voltage control requires a system approach considering transmission and distribution networks.
Coordination between DSO and TSO at the interface point should aim at reactive poweroptimisation and minimising system investments and losses.
DG contribution to voltage control, probably in combination with network solutions, is likely toplay an important role in keeping distribution networks stable. Where this solution proves to bethe most cost-effective one, generators connected to the distribution network above a certaincapacity should be required to have reactive power capabilities in line with those for transmissionconnected RES, adapted to the connection level and capacity. Where it goes beyond maintaininglocal system security as impacted by the generation connection, a market-based approach shouldbe adopted for procuring additional amounts of reactive power such as DG contribution tominimise losses.
2.4. Technical Development: Towards Flexible Distribution Systems
With a rising share of DER, monitoring, control strategies and advanced protection systems in MV and LVdistribution networks will have to develop to enable DSOs to:
Determine and forecast grid capacity and bottlenecks; Supervise and control power flows and voltage in their networks; Enable the new operations at the distribution level (including non-discrimination and effective
real-time grid capacity monitoring and management of injections/withdrawals); Enable market-based congestion management and voltage control in distribution networks; Enhance the distribution grid hosting capability.
This solution should not to be taken up in isolation from other options such as services from DERs to helpmanage the distribution system mentioned above. The route to the future energy system will incorporateboth aspects. The most economically efficient solution will depend on the topology, load and generationprofiles within a given distribution system. A two-level approach might be adopted: larger DG (with adefined installed capacity and level of connection) could be monitored and telecontrolled while other DERmay not be dispatchable should be forecast and monitored by the DSO on an aggregated basis at thesubstation level.
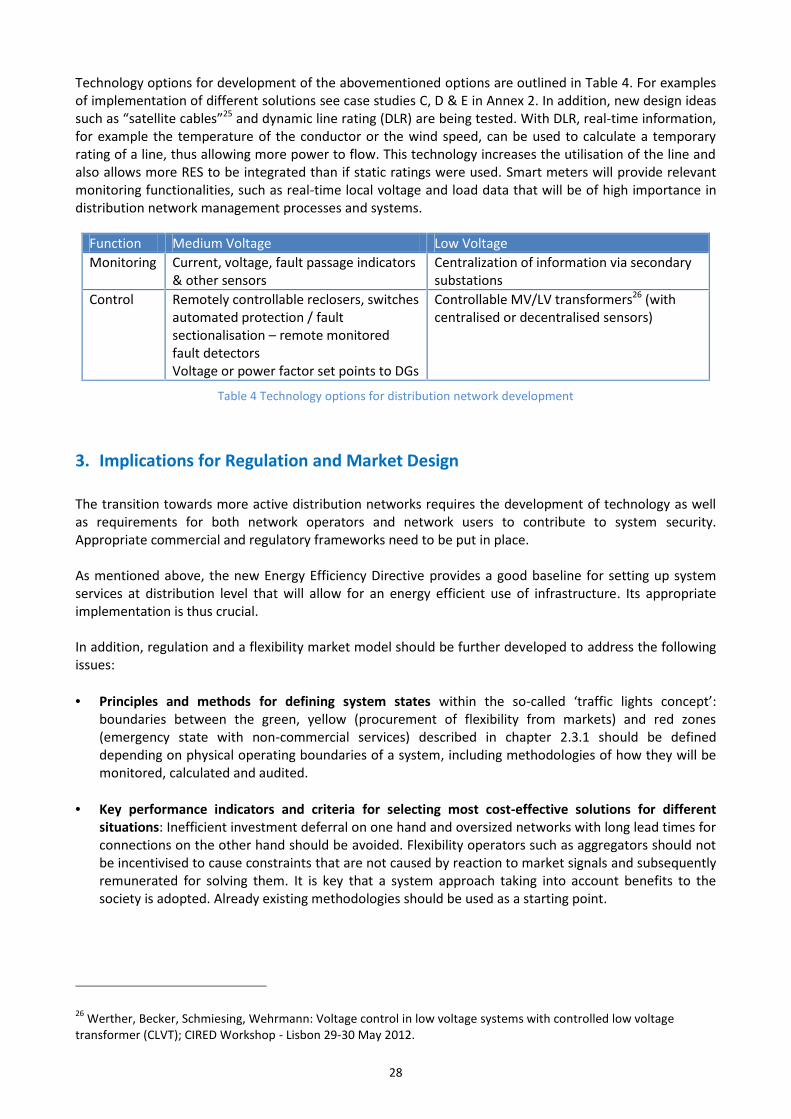
28
Technology options for development of the abovementioned options are outlined in Table 4. For examplesof implementation of different solutions see case studies C, D & E in Annex 2. In addition, new design ideassuch as “satellite cables”25 and dynamic line rating (DLR) are being tested. With DLR, real-time information,for example the temperature of the conductor or the wind speed, can be used to calculate a temporaryrating of a line, thus allowing more power to flow. This technology increases the utilisation of the line andalso allows more RES to be integrated than if static ratings were used. Smart meters will provide relevantmonitoring functionalities, such as real-time local voltage and load data that will be of high importance indistribution network management processes and systems.
Function Medium Voltage Low VoltageMonitoring Current, voltage, fault passage indicators
& other sensorsCentralization of information via secondarysubstations
Control Remotely controllable reclosers, switchesautomated protection / faultsectionalisation – remote monitoredfault detectorsVoltage or power factor set points to DGs
Controllable MV/LV transformers26 (withcentralised or decentralised sensors)
Table 4 Technology options for distribution network development
3. Implications for Regulation and Market Design
The transition towards more active distribution networks requires the development of technology as wellas requirements for both network operators and network users to contribute to system security.Appropriate commercial and regulatory frameworks need to be put in place.
As mentioned above, the new Energy Efficiency Directive provides a good baseline for setting up systemservices at distribution level that will allow for an energy efficient use of infrastructure. Its appropriateimplementation is thus crucial.
In addition, regulation and a flexibility market model should be further developed to address the followingissues:
Principles and methods for defining system states within the so-called ‘traffic lights concept’:boundaries between the green, yellow (procurement of flexibility from markets) and red zones(emergency state with non-commercial services) described in chapter 2.3.1 should be defineddepending on physical operating boundaries of a system, including methodologies of how they will bemonitored, calculated and audited.
Key performance indicators and criteria for selecting most cost-effective solutions for differentsituations: Inefficient investment deferral on one hand and oversized networks with long lead times forconnections on the other hand should be avoided. Flexibility operators such as aggregators should notbe incentivised to cause constraints that are not caused by reaction to market signals and subsequentlyremunerated for solving them. It is key that a system approach taking into account benefits to thesociety is adopted. Already existing methodologies should be used as a starting point.
26 Werther, Becker, Schmiesing, Wehrmann: Voltage control in low voltage systems with controlled low voltagetransformer (CLVT); CIRED Workshop - Lisbon 29-30 May 2012.
29
Regulations for steering the most cost-efficient solutions: Regulatory mechanisms for steering whenthe investment deferral is more cost-effective than active distribution approach should be elaborated,for example in order to ensure that network development occurs when excursions to the yellow andred operating states become too frequent (what is ‘frequent’ is also to be defined).27 Active systemmanagement will affect the amount and structure of operational expenditure and would replace someCAPEX with OPEX.28 DSOs should be able to look at the business case for both the investment solution(CAPEX) and the service-based solution (OPEX), or a mixture of the two, and decide which is preferable.Adoption of a regulatory mechanism is necessary to integrate this approach in the grid fee calculation.DSOs need to be provided with adequate remuneration for the most adequate solution: investment oractive system management tools including procurement of flexibility services from network users.
DG raises the need to review the suitability of the existing distribution network charging structures(current network tariffs are largely volumetric). EURELECTRIC will present its proposals on this issuelater this year.
New roles and relationships between different actors in the market: In particular, the role of flexibilityproviders (to be taken up by aggregators/suppliers/ESCOs) and the relationship between theseflexibility providers and network operators, suppliers, the BRP (balance responsible party) and the localcustomer/local producer should be addressed.
Interaction between the DSO and the market: How will the DSO have visibility of what is happening onthe market side that may impact on the DSO network and cause constraints in the short or long term?For example, a flexibility provider may have a contract to provide reserves to the TSO, but needs to usethe distribution system to which its resources are connected to deliver this service. However, abottleneck on the distribution system may prevent this delivery. These technical aspects of flexibilitymarkets require further investigation.
Measurement/determination of “non-produced” and “non-consumed” energy is an importantrelated issue: unlike consumed and produced energy, saying how much a generator has “notproduced” when he reduced his production on demand of e.g. an aggregator is rather difficult, andappropriate methodologies have to be developed and implemented. Knowledge of the initial scheduleis important in this respect.
Revision of planning guidelines for distribution network development: Revision of these rules shouldbe reconsidered in order to account for ancillary services that the DSO can procure. Are deterministicsecurity standards such as the N-1 criterion appropriate or should they move to being moreprobabilistic and based on reasonable risk of expected energy not served in order to maintain highreliability while minimising over-investment in redundant capacity?
Establishment of contingency assessment and outage management (organisation and coordination ofoutages) rules for distribution networks and their users.
27 The intervention frequency on the customer side is registered – this parameter can be used as an indicator for thenecessary grid reinforcement or extension.28 See EURELECTRIC report Regulation for Smart Grids, February 2011.

30
Key Conclusions
1. Secure and cost-effective integration of DER requires a rethink of how distribution grids areplanned and operated
Distribution networks are currently coping with the rapid increases in decentralised RES feed-in that Europeis experiencing. Decentralised feed-in of RES has already started to outstrip local demand in some Europeanregions. This growth can be quite rapid, as the increased feed-in often occurs in rural areas with littledemand. Building sources of production close to consumption does not reduce distribution network cost.The network still has to be designed to supply maximum demand for situations when there is no DGproduction. In addition, operation of such a system becomes more complex. Once the share ofdecentralised RES passes a certain point, it overburdens the local distribution grid. DSOs are thereforeincreasingly facing voltage problems and grid congestions.
2. DSOs need tools that allow them to become real system operators
DSOs are responsible for developing their grids efficiently and providing quality of service for endcustomers. But in order to satisfy these responsibilities in the changing context of DER/DG, DSOs needadequate new tools. System services at the distribution level are key in this respect. Such services includethe participation of decentralised generators in voltage and reactive power management, distributionnetwork capacity management and congestion management, and information exchange between TSOs,DSOs and DER.
Distribution network capacity management involves taking services from DER into account in the planningstage to optimise investments and ensure that infrastructure is only extended when it is more cost-efficientthan procuring services from DER. To support congestion management, a ‘traffic light’ concept could beintroduced to denote different system states.
3. Optimising DER management through flexibility services should be explored
Traditional methods of grid expansion reinforce the network so that it may bear maximum feed-in fromdistributed generation. However, such maximum capacity is only required for a short period of time eachyear. While this approach will remain important, it may therefore not always be the most optimal and cost-effective solution – not least because new lines often face problems of public acceptance.
New solutions must be developed to enhance the hosting capacity of the distribution grid, minimisingsituations when DG feed-in has to be reduced or new connections have to be denied. Such solutionsinclude new network technologies and design concepts, the contribution of generation to systemperformance, and access to flexibility services provided by DG operators, storage and demand response.Their flexibility could be procured on a competitive basis via flexibility platforms and be offered to DSOs,but also to TSOs as a way of managing redispatching issues in transmission grids. They should be usedwhenever it is most efficient.
4. One-size-does-not-fit-all: different distribution networks require different solutions
While best practice sharing is desirable, the most economically efficient solution will depend on thetopology, demand and generation profiles within a given distribution system. The route to the futureenergy system will probably incorporate aspects of each of the abovementioned solutions. The regulatoryframework should grant DSOs enough flexibility to determine the most appropriate solution for theirnetwork. Methods of prioritising and selecting the most cost-effective solutions should be furtherinvestigated.

31
5. Coordination among all relevant stakeholders is key
A system-wide approach to DG and network development is needed. For instance, all stakeholders must beinvolved in analysing grid connection requests. This will lower the costs of network development andconnection while reducing connection waiting times for new users compared to business as usual.
Policy Recommendations
1. Properly implement existing legislation and adapt it to the new environment
The regulatory framework should enable the creation of new system services at distribution level, as ameans of contributing to local grid stability and security of supply – a requirement of the new EnergyEfficiency Directive (Art 15.1 of 2012/27/EC). Such system services could be defined in grid codes (voltageand reactive power contribution) and/or procured as ancillary services from DER within a transparentand non-discriminatory regulatory framework. While the role of EU-wide network codes is limited in thisrespect,29 national grid codes and market arrangements backed up by European standardisation (inparticular within the mandate M490 for smart grids) should set out inter alia appropriate connectionrequirements for these network users.
Full implementation of the so-called Second and Third Energy Packages is important to ensure fair,transparent and non-discriminatory network connection and access.
2. Take into account lessons learnt from smart grid demonstration projects
Europe already has experience of smart grid demonstration projects worth more than €5.5 billion.30 Thefuture large-scale deployment of smart grids should reflect best practices from these projects and alreadyimplemented solutions. European network codes are currently being designed and will includerequirements for distribution network users. They should take into account latest improvements on theground and not close the door to the implementation of new, proven innovation in distributionnetworks. Standardisation plays a key role in facilitating these solutions.
3. Tap into the potential of aggregation
Aggregators will act as possible middlemen for many small DG and load customers, offering the flexibilityoptions they buy from their clients to TSOs and DSOs. A market model should be developed to unlock thepotential of such aggregation and new roles and relationships between new and existing actors shouldbe defined. This will enable demand, distributed generation and storage resources to participate in themarkets for energy and ancillary services.
4. Equip DSOs with the tools they need to ensure quality of service and to facilitate the market
Establishment of system services at distribution level calls for adequate supporting tools that allow DSOs tooperate their networks in a ‘more active’ way. Such tools should include access to technical data andfurther development of the ICT systems essential for operational control of the grid.
29 Network codes shall be developed for cross-border network issues and market integration issues (Art. 8(7) ofRegulation (EC) 714/2009).30 Smart Grid projects in Europe: lessons learned and current developments. Joint Research Centre, 2012.
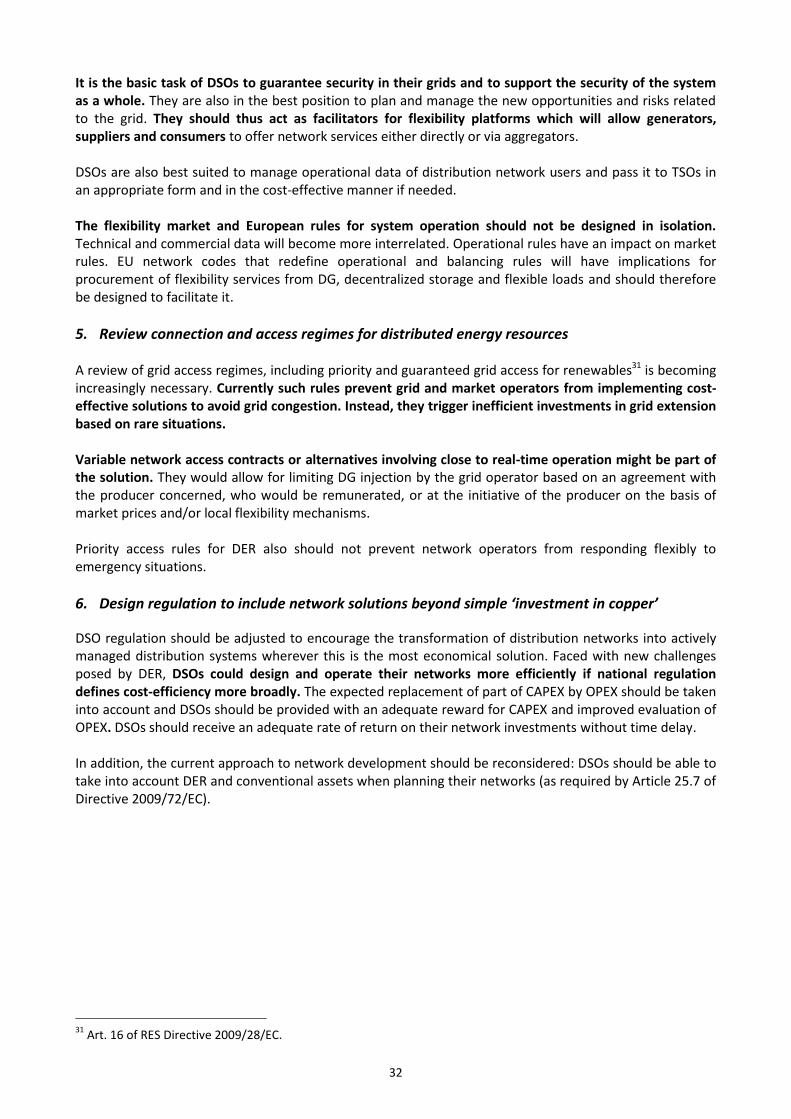
32
It is the basic task of DSOs to guarantee security in their grids and to support the security of the systemas a whole. They are also in the best position to plan and manage the new opportunities and risks relatedto the grid. They should thus act as facilitators for flexibility platforms which will allow generators,suppliers and consumers to offer network services either directly or via aggregators.
DSOs are also best suited to manage operational data of distribution network users and pass it to TSOs inan appropriate form and in the cost-effective manner if needed.
The flexibility market and European rules for system operation should not be designed in isolation.Technical and commercial data will become more interrelated. Operational rules have an impact on marketrules. EU network codes that redefine operational and balancing rules will have implications forprocurement of flexibility services from DG, decentralized storage and flexible loads and should thereforebe designed to facilitate it.
5. Review connection and access regimes for distributed energy resources
A review of grid access regimes, including priority and guaranteed grid access for renewables31 is becomingincreasingly necessary. Currently such rules prevent grid and market operators from implementing cost-effective solutions to avoid grid congestion. Instead, they trigger inefficient investments in grid extensionbased on rare situations.
Variable network access contracts or alternatives involving close to real-time operation might be part ofthe solution. They would allow for limiting DG injection by the grid operator based on an agreement withthe producer concerned, who would be remunerated, or at the initiative of the producer on the basis ofmarket prices and/or local flexibility mechanisms.
Priority access rules for DER also should not prevent network operators from responding flexibly toemergency situations.
6. Design regulation to include network solutions beyond simple ‘investment in copper’
DSO regulation should be adjusted to encourage the transformation of distribution networks into activelymanaged distribution systems wherever this is the most economical solution. Faced with new challengesposed by DER, DSOs could design and operate their networks more efficiently if national regulationdefines cost-efficiency more broadly. The expected replacement of part of CAPEX by OPEX should be takeninto account and DSOs should be provided with an adequate reward for CAPEX and improved evaluation ofOPEX. DSOs should receive an adequate rate of return on their network investments without time delay.
In addition, the current approach to network development should be reconsidered: DSOs should be able totake into account DER and conventional assets when planning their networks (as required by Article 25.7 ofDirective 2009/72/EC).
31 Art. 16 of RES Directive 2009/28/EC.
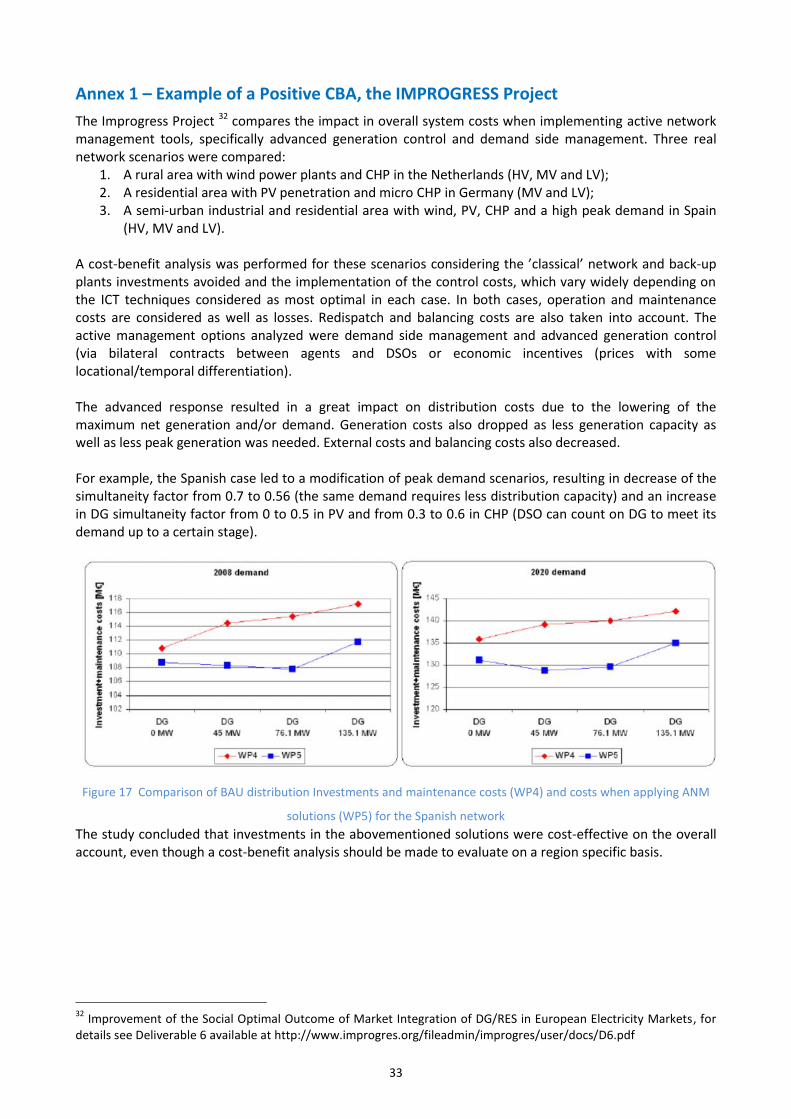
33
Annex 1 – Example of a Positive CBA, the IMPROGRESS ProjectThe Improgress Project 32 compares the impact in overall system costs when implementing active networkmanagement tools, specifically advanced generation control and demand side management. Three realnetwork scenarios were compared:
1. A rural area with wind power plants and CHP in the Netherlands (HV, MV and LV);2. A residential area with PV penetration and micro CHP in Germany (MV and LV);3. A semi-urban industrial and residential area with wind, PV, CHP and a high peak demand in Spain
(HV, MV and LV).
A cost-benefit analysis was performed for these scenarios considering the ’classical’ network and back-upplants investments avoided and the implementation of the control costs, which vary widely depending onthe ICT techniques considered as most optimal in each case. In both cases, operation and maintenancecosts are considered as well as losses. Redispatch and balancing costs are also taken into account. Theactive management options analyzed were demand side management and advanced generation control(via bilateral contracts between agents and DSOs or economic incentives (prices with somelocational/temporal differentiation).
The advanced response resulted in a great impact on distribution costs due to the lowering of themaximum net generation and/or demand. Generation costs also dropped as less generation capacity aswell as less peak generation was needed. External costs and balancing costs also decreased.
For example, the Spanish case led to a modification of peak demand scenarios, resulting in decrease of thesimultaneity factor from 0.7 to 0.56 (the same demand requires less distribution capacity) and an increasein DG simultaneity factor from 0 to 0.5 in PV and from 0.3 to 0.6 in CHP (DSO can count on DG to meet itsdemand up to a certain stage).
Figure 17 Comparison of BAU distribution Investments and maintenance costs (WP4) and costs when applying ANM
solutions (WP5) for the Spanish networkThe study concluded that investments in the abovementioned solutions were cost-effective on the overallaccount, even though a cost-benefit analysis should be made to evaluate on a region specific basis.
32 Improvement of the Social Optimal Outcome of Market Integration of DG/RES in European Electricity Markets, fordetails see Deliverable 6 available at http://www.improgres.org/fileadmin/improgres/user/docs/D6.pdf

34
Annex 2 – Case Studies
A. Demonstration of active power effect in voltage control – Networks 2025 Project, Spain33
In Spanish medium and low voltage levels the R/X ratio (the ratio between the resistance and the reactanceof overhead lines or cables) is quite significant, in the range of 1-4. For this reason voltage changes due toactive power cannot be neglected. Figure 18 states that when the R/X ratio is very low (blue curves), activepower changes are not affecting voltage levels. But when the R/X ratio increases (red curves), active powerchanges cause voltage rises.
Figure 18 R/X ratio effect in voltage control
The key question is if by controlling reactive power injections or abortions by DG’s/DSO’s, the active powereffect can be neutralized. Figure 19 shows the extra reactive power compensation required by DGtechnologies classified in voltage levels. The voltage control contribution by DG technologies is perfectlyadapted in sub-transmission levels, where no extra reactive power compensation is needed. Nevertheless,in MV and LV networks voltage control requires extra high reactive power compensation from DGtechnologies, so that new investments might be assessed.
Figure 19 Extra reactive power contribution to maintain a voltage setpoint
These results demonstrate that DG contribution to voltage control may be limited in MV and LV levels.Table 5 shows that DG is ready to contribute to voltage control in distribution networks when the powerfactor control is needed. The power factor control is the DG ability to maintain the power factor at aspecified setpoint at the DG connection point to the distribution network. The voltage set point control isthe DG ability to maintain the voltage setpoint at the DG connection point to the distribution network.
33 All the figures below are results of this project.
00,10,20,30,40,50,60,70,80,9
11,11,21,31,41,5
0 0,1 0,2 0,3 0,4 0,5
Ve/ V
r
P (normalized respect static capacity)
------- R/X = 0------- R/X = 0.5------- R/X = 1
Ratio S/P
0.00
0.50
1.00
1.50
2.00
2.50
3.00
400 V 20 kVsubterráneo
20 kV aéreo 66 kV 132 kV 220 kV
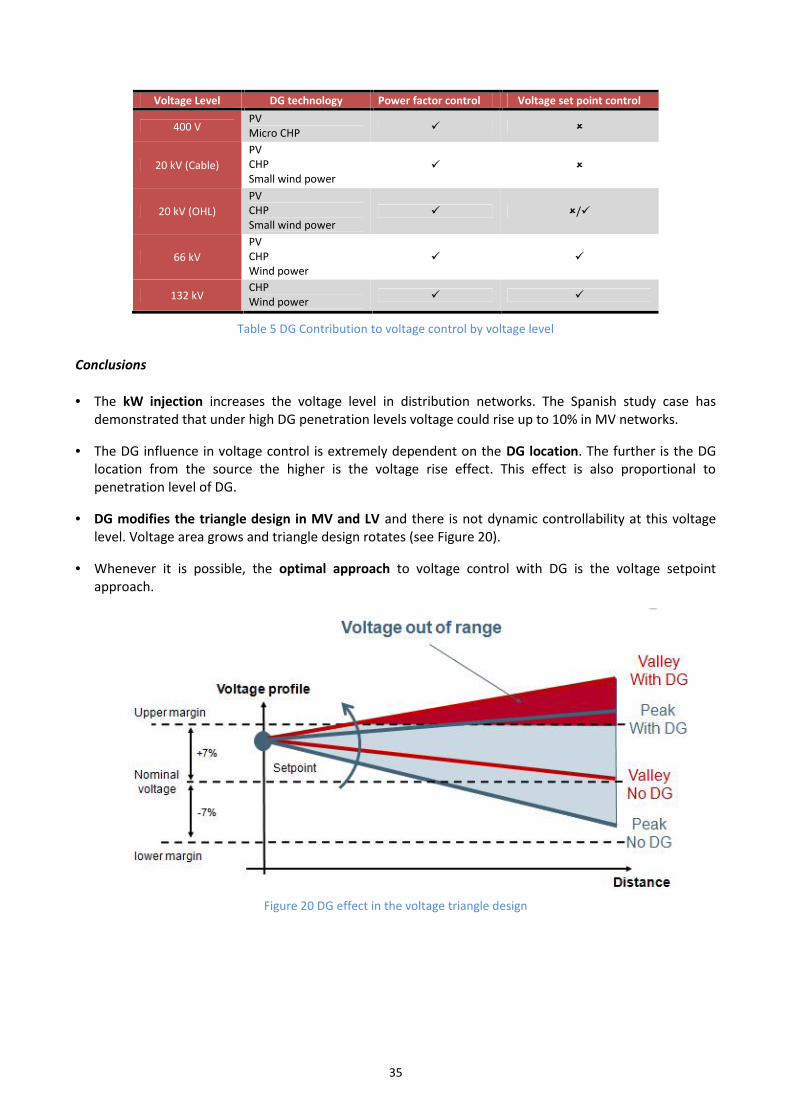
35
Voltage Level DG technology Power factor control Voltage set point control
400 VPVMicro CHP
20 kV (Cable)PVCHPSmall wind power
20 kV (OHL)PVCHPSmall wind power
/
66 kVPVCHPWind power
132 kVCHPWind power
Table 5 DG Contribution to voltage control by voltage level
Conclusions
The kW injection increases the voltage level in distribution networks. The Spanish study case hasdemonstrated that under high DG penetration levels voltage could rise up to 10% in MV networks.
The DG influence in voltage control is extremely dependent on the DG location. The further is the DGlocation from the source the higher is the voltage rise effect. This effect is also proportional topenetration level of DG.
DG modifies the triangle design in MV and LV and there is not dynamic controllability at this voltagelevel. Voltage area grows and triangle design rotates (see Figure 20).
Whenever it is possible, the optimal approach to voltage control with DG is the voltage setpointapproach.
Figure 20 DG effect in the voltage triangle design

36
B. Active voltage management using wind generation voltage control and reactivecapabilities – ESB Networks, Ireland
By 2020 Ireland will have the highest penetration of wind generation in Europe.34 Already there is 1.8 GWinstalled and by the end of the current licensing, contracting and connection gate, there will be nearly 7GW, well above Irish demand peak which is just in excess of 5 GW. Over half of this generation is connectedto the distribution network, leading to challenges managing network voltages due to reverse power flows.The current policy to mitigate both thermal and voltage constraints is for full reinforcement of the networkto meet all generation and loading conditions. Current operational policy, incorporated into reinforcementplanning, is for all DG to operate at a constant power factor of 0.95 lagging unless otherwise specified.However this leads to reactive demands of the transmission network and may not make optimal use ofavailable network capacity. Ultimately this static control may not always ensure voltage conditions aremaintained, particularly in the absence of clearly predefined interface conditions at the TSO-DSO interface.Supplying the required reactive power required across the highly dispersed distribution network, with windthe highest wind resources in remote areas in the west of the country where there is little load, has leadthe TSO to call for distributed sources of reactive power to be made available.35
A solution investigated by the DSO, ESB Networks, is for coordinated Volt / VAr control of clusters of windfarms on distribution networks, leveraging the decoupled active and reactive performance of modern DFIGwind turbines as are now deployed. This functional capability is as illustrated in Figure 21. The designprinciple is that the DSO issues voltage set points and operational sensitivity parameters (“droop” settings)to the wind farms, such that the wind farm controllers then regulate the voltage at network connectionpoint (PCC) through varying their reactive power import or export.
Figure 21 Wind farm active and reactive capabilities as demonstrated in ESB Networks Volt / VAr trials
The test network for these trials is as illustrated in Figure 22. To mitigate project risk, the initial field trialswere on a 38 kW circuit dedicated to two wind farms, connected to a distribution substation on a dedicatedtransformer, isolated from the load of the substation. Initially each of the wind farms operated in constantvoltage mode in isolation for a period of weeks, before the two wind farms operated in this dynamiccontrol mode simultaneously.
The actions of the wind farm controllers, with reactive power varying to ensure that the PCC voltage isregulated were successful. During the field trials significant reactive capabilities were demonstrated.Voltage set points maintained and there was no hunting between the controllers and on-load tap changerat the substation transformer.
34 Wind capacity according to NREAPs as a percentage of average minimum overnight summer demand plusinterconnectivity in 2020 (Source: Pöyry).35 Eirgrid, SONI, All Island TSO Facilitation of Renewables Studies, June 2010.
0
0.2
0.4
0.6
0.8
1
-0.7 -0.5 -0.3 -0.1 0.1 0.3 0.5
ActivePower (pu)
Reactive Power (pu)

37
Figure 22 Test network for field demonstration of coordinated Volt / VAr Control
Analysis of the results illustrated that operating in this mode in itself can make additional capacity availableon the existing networks without reinforcement, or that at times reactive power could be supplied to thetransmission system or neighbouring networks if required. However, these pursuits may be mutuallyexclusive. Figure 23 illustrates the reactive power exported from the wind farms at a low active generationperiod and its unavailability when active generation is high as wind farms must operate at unity or laggingpower factors for local voltage control.
Figure 23 Active and reactive power where wind farms connect to substation - as active export increases, reactive
power is imported to control PCC voltageTechnical trials continue. Going forward it will be vital to establish the role of wind farm reactive power andvoltage control for network planning and operational purposes. Issues which require address are therelative merit of constant power factor, constant voltage or operator controlled active powerimplementations and the integration of any new operational framework into connection planning and DSOpolicy for wind integration. Additionally, establishing the operational framework between the TSO and DSOwhich best reflects their areas of control and responsibility and realising the operational resources requiredto deliver more active management of network voltage and reactive power with distributed windgeneration is vital to the integration of these resources.
~ ~
Load
110 kV busbar
19 km38kV cable
Wind Farm A 22.5 MW
63 MVA
4 km38kV cable
4 km38kV cable
Wind Farm B 17.2 MW

38
C. Technical Control Strategy for Active System Management – EDP Distribuicão, Portugal
A modern electric grid can be viewed as a large complex and distributed system which contains manysubsystems. In a conventional electric grid, control strategies are accomplished by Distributed ManagementSystem (DMS - SCADA). However, with DMS, as a centralised control strategy, it is hard to achieve aplatform-independent control for distributed generation and LV microgrids.
Therefore, besides DMS, EDP’s approach introduces two new control levels:i) Central Autonomous Management System (CAMS) andii) MicroGrid Control Centre (MGCC).
DMS, CAMS and MGCC systems communicate hierarchically to exchange information related to DG currentstate and to make the required adjustments/ tuning, based on a setpoint strategy.
DMS: Distributed Management System
The future DMS is crucial to coordinate energy flow between DSO and TSO grid. The biggest difference tothe future DMS is the fact that it does not need to have direct access to the data relative to the (possiblynumerous) microsources in every microgrid connected to the MV or LV network. The DMS is representedby DMS network elements that stand alone at the top level of the hierarchy. Its purpose is to guaranteesystem robustness by analysing data received from network elements positioned at the hierarchical levelimmediately below (CAMS – primary substation HV/MV). It also enforces the actions resulted from theanalysis.
CAMS: Central Autonomous Management System
The CAMS answers to the DMS, under the responsibility of the DSO. Each primary substation HV/MV is aCAMS network element that is responsible for controlling and monitoring the running operations of eachfeeder from the primary substation and to report the overall status to the DMS and others CAMS networkelements. At this level it’s essential to have an overall schedule formed and the decision-making processincludes the management of Distributed Generation (DG). CAMS is responsible for:
Critical but not so time-sensitive decisions;Handle a large amount of data communication;Coordinate with secondary substation level (MGCC) to achieve specific functions for a common goal;Coordinate with DMS in order to control the amount of DG DER injected that can is necessary to maintaingrid stability;
The decisions taken in CAMS level can give rise to a series of effects to sub-level (MGCC).

39
MGCC: Micro Grid Control Centre
MGCC controls and monitors all the microgrids (LV feeder) connected to a common secondary substation. Acentralised control (MGCC) is a MGCC network element that is responsible for evaluating the data receivedfrom end-devices (such as smart meters). MGCC analyse the current status of microgrids and take actions inorder to guarantee grid connection. Additionally, they report their overall status to the CAMS at the upperlevel.There are two major smart meters type/ features for monitoring and controlling:(i) DG smart meters: Collects information, as well as monitoring and controlling DG DER power levels and
its connect/disconnect status;(ii) Load smart meters: Aggregates all the resistive and inductive loads. It can also act over specific loads.
For example, a MGCC network element monitors the operation state of secondary substation and sendscontrol instructions to open or close secondary substation breakers for switching between island-mode andgrid-connected mode. The decisions taken in MGCC level need the most time-sensitive operations toachieve real time control of the microgrids and enhance the robustness of the power supply.
The study concludes that hierarchical control provides a flexible and cost effective way to efficiently controlnetworks with multiple microgrids and high penetration levels of DG.
D. Protection and Automation Strategies in MV Networks – Enel Distribuzione, Italy
The objective of Isernia project (Molise region of Italy) is to test, on the field, an innovative model for theprotection, automation and management of power generation in the distribution network. It aims atefficient integration of renewable energy sources into the distribution network (the geography andclimate of Isernia offers the perfect setting to fully exploit solar, hydroelectric and biogas) whilemaintaining a reliable and safe management of the system under real operating conditions. The Iserniaproject has recently won a competition-based procedure launched by the Italian regulator (AEEG) grantingincentives to innovative smart grids pilot projects. The project offers a new approach to distributedgeneration management which monitors the active involvement of both distributors and customers,recognized as prosumers (producer-consumers) of energy.
Monitoring occurs through a broadband connection, based on a Wi-Max communication protocol and afibre optics communications infrastructure which depend on the remote management systemimplemented in the territory with the electronic meter.
The project will be developed around the primary cabin in Carpinone and will include the installation ofnearly 8.000 ‘Smart Info’ devices for customers connected to the low voltage grid. The devices will supplyinformation about changes in the price of energy based on time slots, promoting efficient use andincreasing active customer participation in the management of the system. The project also includes theinstallation of a charging station to power a fleet of five electric vehicles, integrated with a photovoltaicplant and a multi-functional storage system. The storage system may also be used for the management ofmedium voltage lines, or peak shavings and load profiling, and will be able to replace the charging systemor receive energy directly from the photovoltaic plant.
Project period: 3 years, from 2011 to 2014 Investment: nearly 7 million euro.

40
E. Integration of RENEWABLES in MV and LV Networks – E.ON Bayern, Germany
As shown already in the beginning of this report Bavaria features an extensive amount of renewable energygeneration, esp. small-scale PV. These renewable generators are mainly (ca. 80%) directly connected to theLV grid. In Figure 24 the vast amount of renewable installations in the E.ON Bayern grid is shown.
Figure 24 Hot spots areas in E.ON Bayern (installed RES capacity in EBY grid areas)
E.ON has selected one of the most affected networks areas in lower Bavaria with high amounts of PVinstallations to analyse the effects on the network, develop and test new grid solutions, the E.ON BayernSmart Grid project. More than 100 power quality measurements were installed and more than 500 loadprofile meters were equipped with an additional power quality module. This setup was used to first of allcreate the basis for real-life analysis of PV integration, as currently all research activities in that field oftechnology are based on network simulations. Another project looks into what it means to have not only PVconnected, but also heat pumps, e-vehicles, small-scale batteries etc. and how load curves are changingand what this means to currently existing network tariff system and planning standards.
New power grid technologies enhances grid utilisation
The new power grid technologies being developed, meaning controllable substation transformers, reactivepower management (Power Factor – Voltage and Reactive Power – Voltage), inline voltage controllers,power quality measurements for LV networks and new load and generation profiles are enhancing theutilisation of the existing network and therefore reducing the grid reinforcement need. Controllablesubstation transformers (rONTs) help to minimise issues with voltage band violations. It is especially inrural networks with long radials and RES feed-in that higher than allowed voltage band violations can occur.In the past the generators connected to this radial would just shut-off due to too high voltages. Thecontrollable substation transformer equipped with an on-load tap changer is now capable to stepwiseincrease the transformation ratio and thus lower the voltage along the radial. In case of lower generation orhigher consumption the transformation ratio is automatically modulated and thus the voltage bandstabilised. Within this Smart Grid project the use cases and control concepts for such transformers have
0 to 2500 kW
2500 to 5000 kW
5000 to 7500 kW
7500 to 10000 kW
> 10000 kW

41
been developed with special focus on autonomous single-type installations. A further project is looking atIntegration of wind into grids investigating the differences between the integration of wind and of PV intothe MV/LV networks (i.e. where do we need to have control over the voltage band and what is thecoincidence factor for the different renewable sources).
Test of reactive power control service
Along this Smart Grid project E.ON investigated the use of reactive power management to lower thevoltage lift in the LV network. A study analysing the reactive power – voltage control of inverters wasperformed, and E.ON is now analysing the results in real-life together with customers providing a reactivepower control service with their PV installations. This real-life test is also taking into account any reciprocaleffect on the rONTs. Currently the use of reactive power is limited to bi-lateral contracts as no market placefor such provision exists. A further project is looking at reactive power management towards upstream gridoperator (with the increasing feed-in of reactive power into the LV grid the limit between DSO andupstream grid operator is also experiencing more reactive power flow).
German feed-in-management regulation
Furthermore the recent adoption of the German renewable law allows the DSO to curtail generation as ofcertain capacity (CHP >100kW; PV >30kW) in case of congestions in the grid as a first step before gridenhancement. The generators are compensated with 95 % of lost income (loss for generators limited to 1 %of annual income).
Currently mainly voltage band violations caused by PV feed-in are occurring. With the implementation ofsophisticated measures like rONTs and reactive power management it is foreseen that voltage bandviolations will be minimised, however overloads at substations will still occur. As the grid extension worksare not as fast as the RES increase, intermediate measures are taken. One example is feed-in management.Here all customers with PV installations are by law asked to install remote control systems or generallycurtail their production to 70% installed capacity. In case of PV the remote control is mainly executed by atraditional ripple control system at smaller installations or a telecontrol solution at larger generators. Incase of a grid congestion the DSO will first curtail all non-renewable generation, then it is possible to curtailthe renewable feed-in via e.g. a ripple control signal to small-scale generators in the vicinity of thecongestion. Larger generators are controlled directly using telecontrol signals and the impact is directlymeasured via read-back signals.
Key conclusions
All of these technologies as well as the increased visibility of the LV network lead to new ways for detailedmodelling of feed-in and load behaviour as basis for grid simulation and grid design, more feed-in of RESinto not only the Bavarian networks, but throughout E.ON in Germany, refined specifications for generatorcapabilities (i. e. PV inverters) as well as requirements for internal data quality and the systems handlingnetwork connection data. A cost optimal solution is in most cases a mixture of traditional gridreinforcement measures together with intelligent power grid technologies like e. g. the rONT, and activemanagement of the PV generation with reactive power control as well as active power feed-inmanagement as a PV generator service to the DSO. Provision of these services shall be unbundling-compliant and may be provided via a smart market where the DSO is able to purchase such services.

Annex 3 – Survey Results
A. Automation and Control in MV & LV Distribution Networks
Proportion 0% 0-25 % 26-50 % 51-100%Implementation level 0 Low Medium High
MV
Country Company
Proportion ofsubstations with
monitoring and controlto MV busbar
Proportion of MV networks with remote down line monitoringProportion of MV
networks with remotedown line control
Proportion of MV networks withautomated protection / fault
sectionalisation
2010 Projectionfor 2020 2010 Projection
for 2020 All phases? Time Granularity?Real-time update or onlyreports to SCADA whenset criteria breached?
2010 Projectionfor 2020 2010 Projection for 2020
Belgium Synergrid High High Low N.A. Yes N.A. Real time Low N.A. Low N.A.
France ERDF Very high Very high Very high Very high No A few seconds Real Time Very high Very high Very high Very high
Ireland ESBNetworks Very high 100% High Very high
Not yet butbecoming apriority
A few secondsReal time update (subjectto variation in excess ofpre-set dead band)
Low /medium(approx. 20%)
Very high Low / medium(approx. 20%) High
42 Italy Enel High High High High On call and at everychange of state. Real time update High High High High
Portugal EDP High High Low Medium Yes real time at primarysubstation level
Only reports to SCADAwhen set criteria breached High High Low High
SpainUnionFenosaDistribution
High High Medium High Yes, in secondarysubstations, at LV
Less than onesecond on demand.Every hour, batchprocess
Not decided yet Medium Medium Low Medium
Sweden Fortum High High Low Medium Yes On line Only reports to SCADAwhen set criteria breached Low Medium Low Medium
UK ElectricityNorth West High High Low Low Yes for newer
installations
Sub one second ondemand; 30 minsnormally
To be decided. Currentlycontinuous SCADAreporting
Low Medium Low Medium

MV/LV Transformers
Country Company Tap changer in astandard model?
Do only some models have a tapchanger? In what situation?(urban/rural deployment)
Proportion of MV/LV substations with remotemonitoring
Proportion of MV/LV substationswith remote control
2010 Projection for 2020 2010 Projection for2020
Belgium Synergrid Yes but offloadoperation only no low low
France ERDF Very high(off load operation)
All MV/LV transformers have atap changer (3 taps, 5 for someold models)
Low High Low Medium
Ireland ESB Networks No None that are currentlydeployed.
None (except forpotential pilot projectunder development)
Depends ondeveloping needs andcost benefit
None
Low unless clearnecessity orcost benefitarises.
Portugal EDP Yes but off loadoperation only All Low Medium Low (< 10%) Medium
43 Spain Union FenosaDistribution
Yes but off loadoperation only
All MV/LV transformers have tapchanger (5 taps) Low Medium Medium Medium
Sweden Fortum Yes but off loadoperation only Low Medium Low Low
UK Electricity North West Yes but off loadoperation only
All distribution TXs havetapchanger. 33 kV/11 kV andhigher voltages are on load andautomatic
Low Low Low Medium

LV
Country Company
Proportion of LV Monitoring or Control
2010 Projection for 2020Only on Circuitswith Load andGeneration?
What Communication Media is in Use?RTU, Fibre, Polling Radio, GPRS etc.
Are the networks controlledlocally with decentralised
intelligence (by use of localautomation systems) or
centrally by SCADA system?
Who owns communications RTU atDG site at each connection level
(trans / dist / HV / MV / LV) –generator, TSO or DSO?
Belgium Synergrid 0 (negligible) N.A. N.A. N.A. N.A. N.A.
France ERDFLow (only intest areas withsmart meters)
High No PLC + GPRS Neither at LVHV : TSO
MV : GeneratorLV : no RTU
Ireland ESBNetworks
R&Ddeploymentsonly
Medium depending onframework for specificsmart meterintegration
NoAt present GPRS, though trials of PLC,meshed radio and WiMax under wayor completed.
Neither at LV
HV transmission TSOHV distribution – code definesthis should be DSOMV – code defines this should beDSOLV – no RTU. Only monitoring iswith meter (DSO owned)
Italy Enel
High (if youinclude thesmart meters)otherwise low
N.A. No GPRS, PLC centrally MV - DSOLV no RTU
44 Portugal EDP Low
Low for most of thegrid. However, EDP isdeploying smart gridsinitiatives with highmonitoring capabilities
All kinds of circuitsincluded in thegeographical areasinvolved in smartgrids initiatives
PLC + GPRS (and RF Mesh pilots) Objective: Decentralised atsecondary substation
HV: EDP; FlexNet (IP/ MPLSproject with an telecomoperator);MV and LV: GPRS from a publiccarries
SpainUnionFenosaDistribution
Low Low No
At primary substations, fibre (52%),carrier (39%), VSAT (5%), radio (4%)At secondary substations, Carrier(72%), Carrier (3%), GSM (25%)
Centralised by SCADAsystems
A combination. DNO owns some,and where not, use public 3Gservice
Sweden Fortum High High
Primary Substation: RTU, fibre, satellitepolling radio, copper cableSecondary Substation: Copper cableSmart Meters: 90 % GPRS; 10 % PLCPrimary Substation: RTU, fibre, satellitepolling radio, copper cableSecondary Substation: Copper cableSmart Meters: 90 % GPRS; 10 % PLC
Centrally by SCADA -primary substation,decentralised intelligence inStockholm area
DSO
UK ElectricityNorth West Low Low No Mainly GPRS, 3G Centrally by SCADA Mixture. DNO owns some, and
where not, use public 3G service

B. Curtailment of Distributed Generation
Country Curtailment for DG RES connected to distribution* Who is allowed to curtail? As of which capacity? Compensation of curtailment
Austria Not allowed Not defined x N.A.
Belgium
Yes for all plants in case of security issues. Currently nolegislation on curtailment in case of congestion – but there aresome pilot projects : when the producer acceptedcontractually to be curtailed (current alternative to a deny ofcontract)
Only DSO (or TSO if DG connected to transmission).If congestion at TSO network level, the TSO will sendthe order through the DSO via SCADA
Under discussion – legallypossible as of 250 kW
Under discussion – currently nocompensation
France
All plants in case of system security events (transmissionlevel).Only some plants in case of congestion on the distributiongrid.
Curtailment orders are always sent by DSO > 1MW and case by casefor plants < 1MW
No compensation for curtailment due tosystem security needs.
GermanyYes, plants above certain size can be curtailed in normaloperation, all plants in emergency at both transmission ordistribution level
DSOs have the control for events of congestion ontheir grid, TSO for congestions on their grid CHP > 100kW; PV > 30kW Yes, compensation with 95 %of lost income
in case of congestion in DSO grid
Ireland Only in case of system security events (transmission level),not distribution
Only TSO is allowed to curtail the relevant DG RES(SCADA signal from TSO control centre to wind farm) > 5MW
Yes as though delivering their full availablecapacity at the time (at market price at thetime)
45 Italy Only in case of system security events (transmission level), notdistribution events Only TSO is allowed to curtail the relevant DG RES > 10MW
Wind Farms yes as though delivering theenergy which has been curtailed, at marketprice (excluding incentives/certificates).
Portugal
Only in case of system security events at both transmission ordistribution level; Micro generation: If voltage deviates morethan 10% a protection at injection point actuates.Reconnection is done after some time if voltage level ayinjection point is normal
DSO has control over protection settings (automaticcurtailment in case of deviation from defined ranges) x Yes as though delivering their full available
capacity at the time
Spain Only in case of system security events at either transmission ordistribution level
Only TSO is allowed to curtail the relevant DG RES;DSO to ask TSO in case of constraints in distributiongrid
x
Constrained wind generators are paid 15% ofthe wholesale electricity price.There’s no compensation for the curtailedgenerator.The curtailment should be justified.
Sweden Only in case of system security events (transmission level), notdistribution (?)
DSO has control over protection settings (automaticcurtailment in case of need) DSO has control overprotection settings (automatic curtailment in case ofdeviation from defined ranges)
x No compensation for curtailment due tosystem needs.
UK Only in case of system security events at both transmission ordistribution level
TSO has commercial agreements with larger DG.DNO can curtail if in connection contract TSO > 100MW
Yes if subject to TSO constraints, through thenational balancing mechanism. Nocompensation for DNO constraints.
* Curtailment compensation scheme: Contract or agreement in place to compensate lost generation from RES, because of curtailments. This contract or agreement might refer both tothe level of compensation received (how much) and the identification the parties involved (who receives the money and who pays).

46
GlossaryAncillary services are commercial services procured by system operators (the TSOs and the DSOs) fromnetwork users. Ancillary services procurement is one of the tools that enable system operators to ensurethe security of supply and quality of service of the electric system.
CLS – Controllable Load Systems are connected to the electricity grid and can be used as either energysource or drain in order to balance supply and demand. Therefore CLS can be disconnected andreconnected to the grid or their load can be increased or decreased. Preferably the CLS reacts automaticallyto price signals. Examples are electric vehicles (EV) and Renewable Energy Sources (RES) like photovoltaicsor wind generators.
Demand Response includes the changes in electric usage by end-use customers from their normalconsumption patterns in response to changes in the price of electricity over time. Demand response canalso be defined as the incentive payments designed to induce lower electricity use at times of highwholesale market prices or when system reliability is jeopardised. Demand response includes all intentionalmodifications to consumption patterns of electricity of end-use customers that are intended to alter thetiming, level of instantaneous demand or the total electricity consumption.
Demand Side Management (DSM) is used with the aim to reduce energy consumption and improve overallelectricity usage efficiency through the implementation of policies and methods that control electricitydemand. DSM is usually a task of power companies to reduce or remove peak load, hence deferring theinstallation of new capacities and distribution facilities. The commonly used methods for demand-sidemanagement are: combination of high-efficiency generation units, peak-load shaving, load shifting, andoperating practices facilitating efficient usage of electricity.
Distributed energy resources (DER) include distributed/decentralised generation (DG) and distributedenergy storage (DS)36.
Distributed/decentralised generation (DG) are generating plants connected to the distribution network,often with small to medium installed capacity, but important due to high numbers compared to the “size”of the distribution network. In addition to meeting on-site needs, DG exports the excess electricity to themarket via the distribution network. It is often operated by smaller power producers or so-calledprosumers.
DMS – Distribution Management System typically enables the DSO to supervise and control MV and LVnetworks. This allows the DSO to be able manage distributed renewable generation, to implement gridefficiency improvement measures, and to control the isolation and restoration of outages. With DMS, real-time information about the distribution grid and connected users is available. It is an important componentfor the DSO to guarantee distribution grid reliability.
Distribution system services are services provided by network operators to users connected to the systemin order to ensure required power quality (and the stability of the distribution grid). They are paid by thegrid users, in most cases via the tariffs.
Network access is the ability to make use of that physical connection in a non-discriminatory way.
Network connection is used in a technical context and relates to the physical connection to the system.
36 Distributed energy storage is not only a resource but also an “off take/load”.
47
References & BibliographyAncillary services. EURELECTRIC, 2004
CEER Benchmarking report. CEER, 2011
Currie, R. et al.: Commercial arrangements to facilitate active network management. CIRED, 2011
DG-GRID project: Regulatory Review and International Comparison of EU-15 Member States, DG-GridReport D1, October 2005.
Durieux, O. et al.: Smart grid technologies feasibility study: increase decentralised generation powerinjection using global active network management. CIRED, 2011
EURELECTRIC views on Demand-Side Participation. EURELECTRIC, 2011
The Smartness Barometer – How to quantify smart grid projects and interpret results. EURELECTRIC,February 2012
P. Sioshansi, Fereidoon: Smart Grid: Integrating Renewable, Distributed & Efficient Energy
Giordano, V.; Onyeji, I.; Fulli, G.; Sanchez Jimenez, M.; Filou, C.: Guidelines for conducting a cost-benefitanalysis of smart grid projects. Joint Research Centre, 2012
Improgres project: Market and regulatory incentives for cost efficient integration of DG in the electricitysystem, WP 6, Deliverable 7. May 2010.
Marano, Alejandro; Maza Ortega, José M.; Martínez Ramos, José L.; Trebolle, David: Voltage control ofactive distribution networks by means of dispersed generation. CIRED 2012 (paper 248)
Pudjianto, D., Ramsay, C. & Strbac, G.: Virtual power plant and system integration of distributed energyresources. The Institution of Engineering and Technology, 2007
Regulation for Smart Grids. EURELECTRIC, 2011
RES Integration and Market Design: Are Remuneration Mechanisms Needed to Ensure GenerationAdequacy? EURELECTRIC, 2011
Smart Grids in Germany – Fields of action for distribution system operators on the way to Smart Grids.ZVEI/BDEW 2012
Thies, Zdrallek, Schmiesing, Schneider: Future structure of rural medium-voltage grids for sustainableenergy supply. CIRED, 2012
Trebolle, D. et al.: Distribution planning with reliability options for distributed generation. Electric PowerSystem Research, 2009
van Gerwent, R.: Distributed generation and renewables: introduction. Leonardo Energy, 2006
Werther, Becker, Schmiesing, Wehrmann: Voltage control in low voltage systems with controlled lowvoltage transformer (CLVT). CIRED, 2012

Des
ign
by w
ww
.gen
eris
.be
/ ©
pho
tos:
ww
w.d
ream
stim
e.co
m, w
ww
.shu
tter
stoc
k.co
m
Union of the Electricity Industry - EURELECTRIC
Boulevard de l’Impératrice, 66 boîte 2 T.: + 32 (0)2 515 10 00 - F.: + 32 (0)2 515 10 101000 Brussels website: www.eurelectric.orgBelgium twitter.com/EURELECTRIC Belgium twitter.com/EURELECTRIC


