ACTIVE WELFARE STATE POLICIES AND WOMEN LABOUR PARTICIPATION IN SPAIN Xisco Oliver and Amedeo Spadaro University of the Balearic Islands 2nd Microsimulation Research Workshop – Bucharest 11-12 October 2012
Transcript
ACTIVE WELFARE STATE POLICIES AND WOMEN LABOUR PARTICIPATION IN SPAIN
Xisco Oliverand
Amedeo SpadaroUniversity of the Balearic Islands
2nd Microsimulation Research Workshop – Bucharest
11-12 October 2012
Some trends…… trend toward active welfare state• Several European countries have implemented
some sort of an in-work benefits or tax credits:– In UK: Working family tax credit (WFTC, 2000)– In Belgium (Crédit d’impôt sur les bas revenus de
l’activité professionnelle, in 2001)– In France: Prime pour l’emploi or, more recently, the
Revenu de Solidarité Active (RSA) replaced the RMI. RSA tries to avoid some of the labour disincentives of the previous system
– In Sweden– Etc.
• In Spain 2003 they introduced a very modest tax credit for working mothers
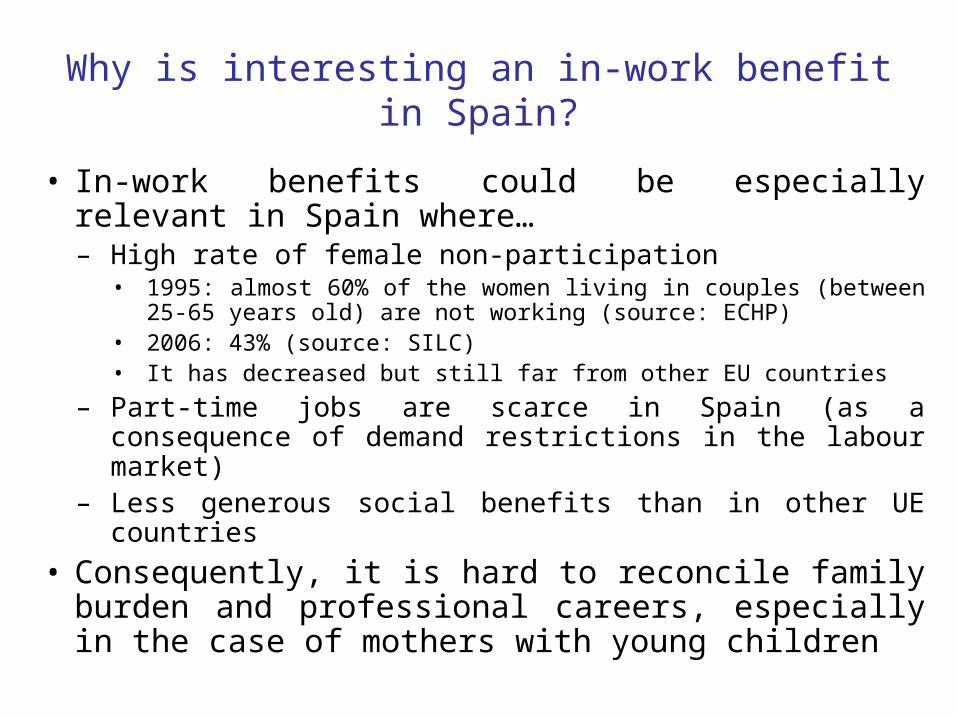
Why is interesting an in-work benefit in Spain?
• In-work benefits could be especially relevant in Spain where…– High rate of female non-participation
• 1995: almost 60% of the women living in couples (between 25-65 years old) are not working (source: ECHP)
• 2006: 43% (source: SILC)• It has decreased but still far from other EU countries
– Part-time jobs are scarce in Spain (as a consequence of demand restrictions in the labour market)
– Less generous social benefits than in other UE countries
• Consequently, it is hard to reconcile family burden and professional careers, especially in the case of mothers with young children
Hours of workSpain
010
2030
4050
Per
cent
0 20 40 60_1 horas
Weekly hours of work - Men in couples
010
2030
40P
erce
nt
0 20 40 60_2 horas
Weekly hours of work - Women in couples
Working hours of Women living in couples in other countries
Source: Bargain (2006) Source: Blundell et. al (2002)
France UK
Data from the early nineties
with 30% of no-participationData from 1995
Aim of the work
• Construct a behavioural microsimulation model to evaluate public policies ex ante
• Structural estimation of a discrete labour supply model
• Compute elasticities (on participation and working hours)
• Simulate the effect of hypothetical reforms of the in-work benefit
Results:
• An increase of the generosity of the system can encourage mothers to work without a big disincentive to their partners, but the cost of the reform can be high
Related workUK• Working family tax credit (WFTC, 2000)
– Deeply analyzed by people from the IFS– Duncan & McCrae (1999) or Blundell et al. (2002)
US• Earned Income Tax Credit (EITC)
– Hoynes (1996)– Keane & Moffitt (1998)
France, Germany and Finland• Bargain & Orsini (2006) analyze hypothetical in-work
benefits in those countries using EUROMODSweden: Aaberge & Flood (2009) - Recent reformItaly: Figari (2009) – Hypothetical reformEtc…
Outline
1. Simulated scenarios
2. Discrete labour supply model
3. Data
4. Microsimulation model: NITSIM
5. Econometric Results
6. Elasticities
7. Policy simulations
8. Conclusions
1. Simulated scenarios
Baseline: 2007 PIT and SS contributionsMain characteristics of the PIT:
– Capital income taxed at a flat rate (18%)– Rest of income taxed progressively
Table 2: Tax schedule 2006 2007
Up to Tax rate Up to Tax rate 4,162 15% 17,360 24%
14,357.52 24% 32,360 28% 26,842.32 28% 52,360 37%
46,818 37% Over 52,360 43% Over 46,818 45%
Table 1: Personal and family allowances 2006 2007 Change
Personal allowance 3,400 5,050 49% Age >65 800 900 13% Increase for >75 +1,000 +1,100 10% Children allowance: 1st child 1,400 1,800 29% 2nd children 1,500 2,000 33% 3rd children 2,200 3,600 64% 4th children (or more) 2,300 4,100 78% Increase for <3-year-old +1,200 +1,400 17%
1. Simulated scenarios (2)Reform: working mother tax credit
Actual• 100 euros/month per
child for working mothers
• Bounds:– Social security
contributions paid by the employee and employer
– Having children <3 years old
Simulated reforms1. Without Tax Credit2. 100 euros/month per
children for working mothers for each children below 15 years old*
3. Idem below 6*4. 400€ tax credit per
worker
* Aid independent of the social contributions
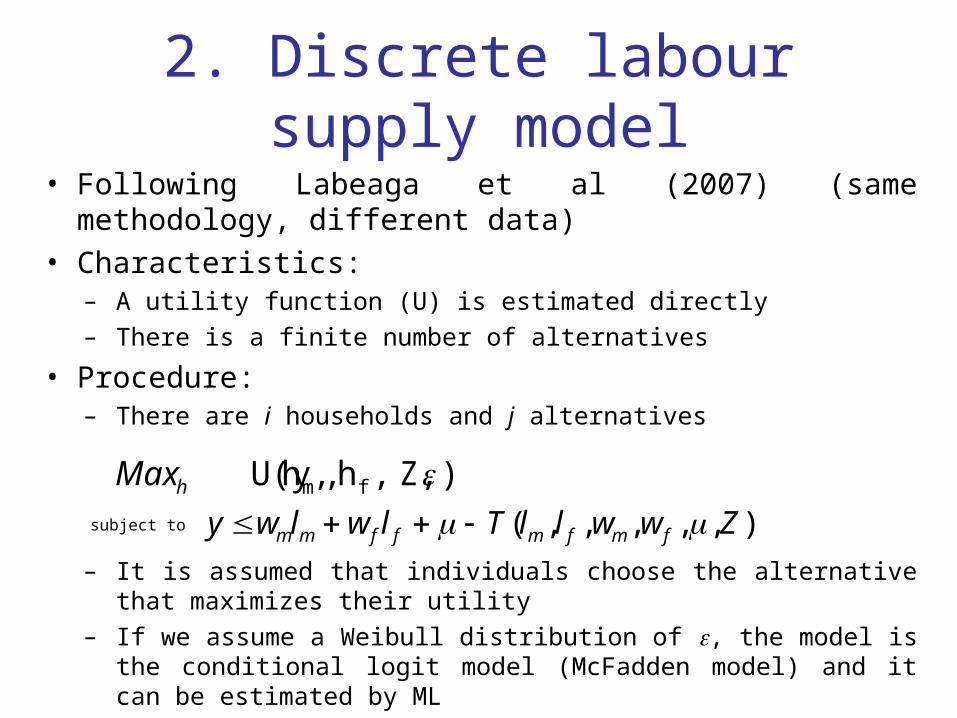
2. Discrete labour supply model
• Following Labeaga et al (2007) (same methodology, different data)
• Characteristics:– A utility function (U) is estimated directly– There is a finite number of alternatives
• Procedure:– There are i households and j alternatives
– It is assumed that individuals choose the alternative that maximizes their utility
– If we assume a Weibull distribution of , the model is the conditional logit model (McFadden model) and it can be estimated by ML
) Z,,h ,h U(y, fm hMaxsubject to ),,,,,( ZwwllTlwlwy fmfmffmm
2. Discrete labour supply model (3)Specification
• We use a quadratic utility function:
with observed heterogeneity in the betas
And fixed costs which are subtracted from the disposable income (for women who are working)
fmfmfhf
mffmm
hhfhmhyfmhhfyh
myhfhhmhhyyfmfm
hhyhhyh
yhhhyZZZhhyU
222),,,,,(*
fcfcZFC
fhhh Zfff
'0
0 'y y y Z mhhh Z
mmm'0
3. Data
• EU-SILC (Statistics on Income and Living Conditions)– We use the 2006 Spanish cross-sectional
sample: more than 12000 households– We select couples which are between 25 and 65
years old which are potential workers: 3607 observations
4. Microsimulation model
• Given a wage rate, we compute the gross income of each household under each alternative– Men: not-working (0 hours), full-time worker (40 hours)
and working overtime (50 hours)– Women: not-working (0 hours), part-time worker (25
hours) and full-time worker (40 hours)
9 alternatives per household
• Wage rates are computed as:– Current weekly income / weekly hours of work– For those workers who are not actually working we
predict the wage rate
Hours of workSpain
010
2030
4050
Per
cent
0 20 40 60_1 horas
Weekly hours of work - Men in couples
010
2030
40P
erce
nt
0 20 40 60_2 horas
Weekly hours of work - Women in couples
5. Econometric results: The utility function
Note. The variables have been rescaled as follows: Income = disposable income in euros/20,000; Hours of leisure = (24x7 – weekly hours of work)/160; Age = (age in years – 40)/10.
*parameter significant at 10%, ** parameter significant at 5%, *** parameter significant at 1%
Table 3: Labour Supply Parameters Estimates
Variable Coefficient
Income2 -0.283***
Hours of leisure of the male2 -45.464***
Hours of leisure of the female2 -83.472**
Income x Hours of leisure of the male 1.922*** Income x Hours of leisure of the female 0.929 Hours of leisure of the male x Hours of leisure of the female
-4.049
Income 1.896** x Age of the male 0.039 x Age of the female 0.211* x 1(Children 0-3) -0.278 x 1(Children 3-15) -0.391 Hours of leisure of the male 91.527*** x Age of the male 1.651*** x Age of the male square 0.841*** x 1(Children 0-3) -0.278 x 1(Children 3-15) -0.625*** Hours of leisure of the female 140.225** x Age of the female 0.062 x Age of the female squared 0.968*** x 1(Children 0-3) 2.416 x 1(Children 3-15) 2.941*** Fixed costs 1.418*** x 1(big city) -0.03 n. Children 0.116*** Number of observations 3607 Log likelihood -6347.925
6. Elasticities
Table 4: Elasticities at the intensive at extensive margin. Responses in percentage
points of an increase of 10% (elasticities)
Change in Females Males Participation 2.6 0.24
Females Working hours 5.1 0.23 Participation -0.34 1.76
Males Working hours -0.42 2.12
Note: elasticities are computed using averaged simulated transitions
6. Elasticities by decilesElasticity of unconditional expectation of hours of work in percentage points
without benefit Deduc <16 Deduc <6 Ref400zp Cost Income Tax 10,631,591 3.71% -19.33% -5.00% -21.84% Income Tax -0.29% 1.32% 0.34% -20.86% (excluding in-work benefit)
11,058,095
In-work mother benefit 426,504 -100.00% 515.95% 133.60% 3.51% Social security contributions 7,742,663 -0.21% 1.04% 0.28% 0.84% Tax collection 18,374,254 2.06% -10.74% -2.78% -12.29% Efficiency Gross Income (in millions) 109.7572 -0.22% 0.99% 0.26% 0.77% Note: Data of the simulated couples in annual euros.
Inequality and welfare
The social welfare is measured by μ(1-Gini)
This form is known in the literature as the Sen’s Social Welfare Function. It can also be shown that it is a member of the class of rank-dependent social welfare functions (see Aaberge, 2007).
Pre-reform without benefit Deduc <16 Deduc <6 Ref400zp Mean anual disposable income
1. We construct a behavioural microsimulation model for the Spanish population
2. We estimate a discrete model of labour supply for the couples
3. We analyze the effect of an in-work benefit. More precisely, we relax the bounds of the existing working mother tax credit (ages of the children and maximum amount)
4. In-work benefits can increase female labour supply, but the reform we simulate has a high cost in terms of tax collection