Activity Recognition for Users of Rolling Walker Mobility Aids Mathieu Sinn and Pascal Poupart David R. Cheriton School of Computer Science University of Waterloo Waterloo, ON, Canada N2L 3G1 {msinn,ppoupart}@cs.uwaterloo.ca Abstract We present Smart Walkers, a comprehensive approach to enhancing independent and safe mobility of elderly people. The idea of the Smart Walkers project is to equip rolling walker mobility aids with sensors and actuators. The goal is to assist users, caregivers and clinicians, e.g., by monitoring the physical and mental conditions of the user, detecting risks of falling, assessing the effectiveness of therapeutic interventions, and providing active navigation assistance. The key problem in building the Smart Walkers technology is the ability to recog- nize the user activity from the stream of sensor measurements. In this paper we present supervised and unsupervised machine learning algorithms for this purpose and discuss their performance on real user data. We find that the best results are obtained for Conditional Random Fields with feature functions based on thresh- olding, achieving an accuracy of 85-90%. 1 Introduction Safe and independent mobility is a key factor in the quality of life of elderly people. Independent mobility sustains social interaction and thereby physical and mental activity; on the other hand, injuries caused by falls constitute a major health risk. Mobility aids, such as canes, rolling walkers and wheel chairs, encourage independent mobility, however, improper use can induce additional risks of falling, particularly as the individual motoric capabilities deteriorate. To improve the utility of mobility aids, we are developing a mixed-initiative system, called Smart Walker, which is a customary four-wheel rolling walker equipped with a set of sensors. A pro- totype is shown in Fig. 1. The sensors measure the load on the four wheels, the walked distance and the acceleration in the three spatial dimensions. In our future work, we plan to use the sensor measurements to monitor the user’s physical and mental conditions, and to detect moments of insta- bility. Furthermore, we plan to instrument the Smart Walker with actuators which can immobilize the walker, e.g., while the user is standing, or provide navigation assistance. The key problem in building the Smart Walker technology is to extract high-level information about the user’s activities from the stream of sensor measurements. In [1], we compared supervised and unsupervised machine learning algorithms for this purpose. We found that Conditional Random Fields (CRFs) yielded better results than Hidden Markov Models (HMMs), presumably due to the less restrictive assumptions on the distribution of the observation sequence. The CRFs that we used were based on feature functions which, in order to discriminate between activities, compared the sensor measurements to fixed threshold values. While in [1] we suggested to choose the threshold values manually, in this paper we consider an automatic approach based on Linear Regression mod- els. We also generalize some of the ideas by considering “smooth” thresholding based on sigmoid functions, and using the raw observations to discriminate between activities. 1
Transcript
Activity Recognition for Users of Rolling WalkerMobility Aids
Mathieu Sinn and Pascal PoupartDavid R. Cheriton School of Computer Science
University of WaterlooWaterloo, ON, Canada N2L 3G1
{msinn,ppoupart }@cs.uwaterloo.ca
Abstract
We present Smart Walkers, a comprehensive approach to enhancing independentand safe mobility of elderly people. The idea of the Smart Walkers project isto equip rolling walker mobility aids with sensors and actuators. The goal is toassist users, caregivers and clinicians, e.g., by monitoring the physical and mentalconditions of the user, detecting risks of falling, assessing the effectiveness oftherapeutic interventions, and providing active navigation assistance.The key problem in building the Smart Walkers technology is the ability to recog-nize the user activity from the stream of sensor measurements. In this paper wepresent supervised and unsupervised machine learning algorithms for this purposeand discuss their performance on real user data. We find that the best results areobtained for Conditional Random Fields with feature functions based on thresh-olding, achieving an accuracy of 85-90%.
1 Introduction
Safe and independent mobility is a key factor in the quality of life of elderly people. Independentmobility sustains social interaction and thereby physical and mental activity; on the other hand,injuries caused by falls constitute a major health risk. Mobility aids, such as canes, rolling walkersand wheel chairs, encourage independent mobility, however, improper use can induce additionalrisks of falling, particularly as the individual motoric capabilities deteriorate.
To improve the utility of mobility aids, we are developing a mixed-initiative system, called SmartWalker, which is a customary four-wheel rolling walker equipped with a set of sensors. A pro-totype is shown in Fig. 1. The sensors measure the load on the four wheels, the walked distanceand the acceleration in the three spatial dimensions. In our future work, we plan to use the sensormeasurements to monitor the user’s physical and mental conditions, and to detect moments of insta-bility. Furthermore, we plan to instrument the Smart Walker with actuators which can immobilizethe walker, e.g., while the user is standing, or provide navigation assistance.
The key problem in building the Smart Walker technology is to extract high-level information aboutthe user’s activities from the stream of sensor measurements. In [1], we compared supervised andunsupervised machine learning algorithms for this purpose. We found that Conditional RandomFields (CRFs) yielded better results than Hidden Markov Models (HMMs), presumably due to theless restrictive assumptions on the distribution of the observation sequence. The CRFs that we usedwere based on feature functions which, in order to discriminate between activities, compared thesensor measurements to fixed threshold values. While in [1] we suggested to choose the thresholdvalues manually, in this paper we consider an automatic approach based on Linear Regression mod-els. We also generalize some of the ideas by considering “smooth” thresholding based on sigmoidfunctions, and using the raw observations to discriminate between activities.
1
The paper is structured as follows: Sec. 2 provides some background on the Smart Walker projectand our previous research. In Sec. 3, we describe the problem of activity recognition and presentalgorithms based on Conditional Random Fields. In Sec. 4, we evaluate the algorithms in twoexperimental studies. An outlook on our future work in Sec. 5 concludes the paper.
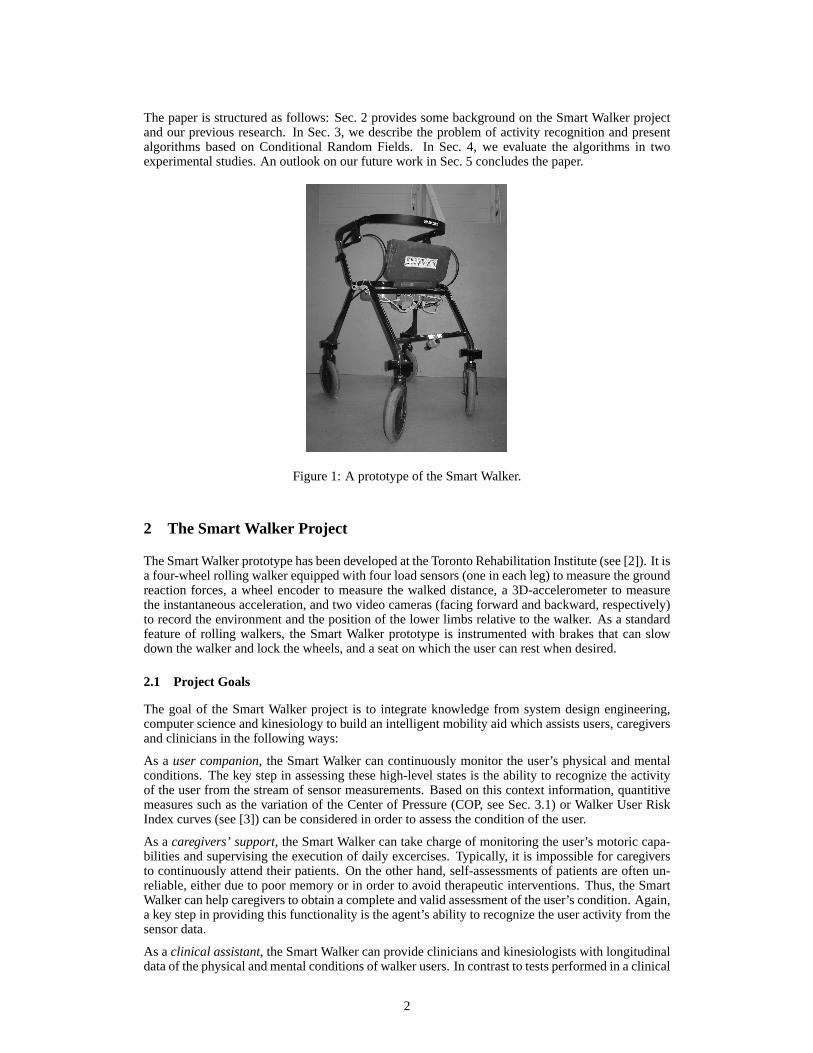
Figure 1: A prototype of the Smart Walker.
2 The Smart Walker Project
The Smart Walker prototype has been developed at the Toronto Rehabilitation Institute (see [2]). It isa four-wheel rolling walker equipped with four load sensors (one in each leg) to measure the groundreaction forces, a wheel encoder to measure the walked distance, a 3D-accelerometer to measurethe instantaneous acceleration, and two video cameras (facing forward and backward, respectively)to record the environment and the position of the lower limbs relative to the walker. As a standardfeature of rolling walkers, the Smart Walker prototype is instrumented with brakes that can slowdown the walker and lock the wheels, and a seat on which the user can rest when desired.
2.1 Project Goals
The goal of the Smart Walker project is to integrate knowledge from system design engineering,computer science and kinesiology to build an intelligent mobility aid which assists users, caregiversand clinicians in the following ways:
As a user companion, the Smart Walker can continuously monitor the user’s physical and mentalconditions. The key step in assessing these high-level states is the ability to recognize the activityof the user from the stream of sensor measurements. Based on this context information, quantitivemeasures such as the variation of the Center of Pressure (COP, see Sec. 3.1) or Walker User RiskIndex curves (see [3]) can be considered in order to assess the condition of the user.
As acaregivers’ support, the Smart Walker can take charge of monitoring the user’s motoric capa-bilities and supervising the execution of daily excercises. Typically, it is impossible for caregiversto continuously attend their patients. On the other hand, self-assessments of patients are often un-reliable, either due to poor memory or in order to avoid therapeutic interventions. Thus, the SmartWalker can help caregivers to obtain a complete and valid assessment of the user’s condition. Again,a key step in providing this functionality is the agent’s ability to recognize the user activity from thesensor data.
As aclinical assistant, the Smart Walker can provide clinicians and kinesiologists with longitudinaldata of the physical and mental conditions of walker users. In contrast to tests performed in a clinical
2
setting, this data is collected in the users’ everyday-life environment and over continuous periodsof time. The data can be used for diagnosis, e.g., whether a non-walker user should be presribed awalker or a walker user should be prescribed a wheel chair; further applications are the evaluationof therapeutic interventions, and the development of future rolling walker designs.
The key problem in implementing these roles is to develop algorithms for the recognition of useractivities from the stream of sensor measurements. We discuss different approaches to this problemin Sec. 3. In our future work, we plan to equip the Smart Walker with actuators and an audio systemto provide active assistance. For example, actuating the brakes can be used to immobilize the walkerwhen the user is sitting on the walker; furthermore, it allows the Smart Walker to influence thesteering by inducing more resistance on one side, which eases turns in that direction. The audiosystem can be used for giving acoustic prompts and alerts, e.g., in case of emergency. Of course, aprecondition for implementing such active roles is that the algorithms for activity recognition are asaccurate and robust as possible.
2.2 Related Work
The idea to instrument rolling walkers with intelligent computer technology has attracted consider-able attention in the past decade. Various research groups have instrumented walkers with sensorsand actuators to support users and caregivers. The walker in [4] provides navigation assistance viaa display for providing directions to the user, and an (optional) active drive mechanism. The walkeruses pre-defined environment maps and learns a hierarchical model of the user’s daily walking rou-tines, hence it is unable to provide assistance in an unknown environment or when the user’s walkingroutines change with time. The walker in [5] is instrumented with laser range finders to measure thedistance between the walker and the user, and with wheel encoders to measure the velocity. It offersnavigation assistance via servo brakes mounted at the rear wheels, however, it can distinguish onlythree different user states (walking, stopping, state of emergency). The walker in [6] is equippedwith load sensors at the handles which allows to detect heel strikes, toe-off events and left/right sin-gle support phases. In contrast to our work, this walker is unable to recognize higher-level activities,such as turning left/right or walking up/down a ramp.
3 Activity Recognition
As we have seen in the previous section, a key step in building the Smart Walker is to developalgorithms for recognizing user activities from the sensor measurements. In this section, we firstgive a description of the sensor measurements and certain statistics derived therefrom, and thenreview algorithms for activity recognition based on Hidden Markov Models. In Sec. 3.3 we explainalgorithms based on Conditional Random Fields; in particular, we present our idea to discriminatebetween activities using feature functions based on thresholding. For examples of activities that wewish to recognize, see the description of our experiments in Sec. 4.
3.1 Sensor Measurements and Derived Statistics
The raw sensor data of the Smart Walker consists of8 measurements at each time point:xdist.t ,
the walked distancemeasured by a wheel encoder;xfr.le.t , xfr.ri.
t , xre.le.t , xre.ri.
t , the load on the fourwheels (front/rear and left/right); xx-acc.
t , xy-acc.t , xz-acc.
t , the accelerationin x-, y-, z-direction. Themeasurements are digitalized with 16-bit resolution and 50-Hz sampling, so we obtain 50 data pointsper second and sensor, where the measurements range between0 and216 − 1. In particular,xdist.
t isthe walked distance modulo216, where walking backwards results in a decrease ofxdist.
t .
From the raw sensor data we compute the following measures: thespeedof the walkerxspeedt =
xdist.t − xdist.
t−1 where we add (substract)216 if an overflow (underflow) ofxdist.t is detected; thetotal
load on the four wheelsxtot. loadt = xfr.le.
t + xfr.ri.t + xre.le.
t + xre.ri.t ; the frontal plane center of pressure
(FCOP), measuring the relative difference between the load on the left and the right wheels:
xFCOPt =
df (xfr.le.t − xfr.ri.
t ) + dr(xre.le.t − xre.ri.
t )xfr.le.
t + xfr.ri.t + xre.le.
t + xre.ri.t
where the constantsdf = 22.25 anddr = 26.6 are the distances of the front/rear load cells to themidline of the walker (in centimeters); thesagittal plane center of pressure(SCOP), measuring the
3
relative difference between the load on the rear and the front wheels:
xSCOPt =
(xfr.le.t − xre.le.
t ) + (xfr.ri.t − xre.ri.
t )xfr.le.
t + xfr.ri.t + xre.le.
t + xre.ri.t
.
For the recognition of the user activity we use the measurementsxspeedt , xtot.load
t , xFCOPt , xSCOP
t , xx-acc.t ,
xy-acc.t , xz-acc.
t . The advantage of using the measures FCOP and SCOP instead of the raw load sensorrecordings is that they take into account therelative difference between the load on the left/rightand rear/front wheels, so they do not depend on the body weight of the user. In order to includeinformation on past measurements, we compute the mean and the variance over the previousw timepoints, for instance,
µspeedt (w) =
1w
w−1∑k=0
xspeedt−k and σspeed
t (w) =1w
w−1∑k=0
(xspeed
t−k − µspeedt (w)
)2.
In our experiments, we chose the time horizonsw = 1, 5, 25, that is, besides the actual measure-ments we consider past information up to half a second. Of course, the variances forw = 1 are equalto 0. After computing the means and variances, we obtain a 35-dimensional vector of observationsat each time pointt, namely, the means and variances ofxspeed
t , xtot.loadt , xFCOP
t , xSCOPt , xx-acc.
t , xy-acc.t ,
xz-acc.t for the time horizonsw = 1, 5, 25 (excluding the zero variances obtained forw = 1).
3.2 Hidden Markov Models
In [1] we compared the performance of various probabilistic models for activity recognition. Whilewe found that Hidden Markov Models (HMMs) were outperformed by Conditional Random Fields,HMMs are still interesting because they allow for unsupervised learning. In an HMM, the sensormeasurements are represented by a sequence of observationsX = (X1, . . . , Xn) with values insome setX , and the user activities by a sequence of hidden statesY = (Y1, . . . , Yn) with values insome finite setY. In [1] we discretized the sensor measurements so thatX was finite. The HMM isparameterized by theinitial distribution π(y), thetransition probabilitiesθ(y′, y), and theemissionprobabilitiesφ(x, y). The joint probability of the observationsx = (x1, . . . , xn) and the hiddenstatesy = (x1, . . . , xn) in this model is given by
P (X = x, Y = y) = π(y1)( n∏
t=2
θ(yt−1, yt))( n∏
t=1
φ(xt, yt)).
If labeled training data(x,y) with x = (x1, . . . , xn) andy = (y1, . . . , yn) is available, then theHMM parameters can be learned using Maximum Likelihood estimation. If the training data isunlabeled, i.e.,y is unavailable, then a common approach is to use the EM algorithm. In [1] wealso considered an alternative method based on Bayesian learning, where we put Dirichlet priors onthe multinomial distributionsπ(y), θ(y′, y) andφ(x, y) and used Gibbs sampling to estimate theposterior over the hidden states and the parameters.
3.3 Conditional Random Fields
In contrast to HMMs, Conditional Random Fields (CRFs) are discriminative and model thecondi-tional distribution ofY givenX (see [7]). An advantage of CRFs is that they do not make condi-tional independence assumptions on the observations. CRFs are parameterized by vectors of real-valuedfeature functionsf andmodel weightsλ. For anyx = (x1, . . . , xn) andy = (y1, . . . , yn),the probability ofY = y conditional onX = x is given by
P (Y = y |X = x) ∝ exp(λT f(x,y)
). (1)
A particularly important class of CRFs arelinear-chain models where the feature functions areallowed to depend on at most two consecutive labels. In that case, the inner product of modelweights and feature functions in (1) can be written as the sum of weighted state and transitionfeature functions, namely,
λT f(x,y) =n∑
t=1
µT f state(xt, yt) +n∑
t=2
νT f trans(xt, yt−1, yt), (2)
4
where we suppose that the transition feature functions are non-constant both inyt−1 andyt, so thereis no overlap with the state features. The assumption that the feature functions only depend on thecurrent observationxt is without loss of generality: if they depended on, say,xt−l, . . . , xt+l, thensimply consider the modified observationsx̃t = (xt−l, . . . , xt+l) instead ofxt.
The feature functions can be used to incorporate domain-specific knowledge. A typical choice arebinary feature functions; depending on whether the associated model weight is positive or negative,the co-occurrence of certain observations and labels then increases or decreases the conditionalprobability of a particular label sequence. Given a fixed set of feature functions, the model weightsare usually learned from labeled training data by maximizing the conditional log-likelihood function.An efficient dynamic programming algorithm is available to compute the marginal distributions ofY givenX. See [8] for more details.
3.4 Feature Functions Based on Discriminant Rules
A crucial step in applying CRFs is the selection of the state and transition feature functions in (2).In [1] we used feature functions based on thresholding in order to discriminate between activities,where we suggested to choose the threshold values manually by a visual inspection of the data. Inthe present paper we consider more generallydiscriminant ruleswhich, besides thresholds, mayalso take into account the raw observations, or “smooth” thresholds based on sigmoid functions. Inthe following, suppose that the set of labels is given byY = {1, . . . , k}.
Let us explain the idea of discriminant rules for the state feature functions in (2). Suppose wewant to computeµT f state(xt, yt) for yt = i. Intuitively, the larger this quantity, the higher is thecompatibility of the eventsXt = xt andYt = i. The idea of discriminant rules is to consider anypotential alternative,Yt = j with j ∈ Y \ {i}, and to evaluate whetherXt = xt is more compatiblewith Yt = i or Yt = j. Mathematically, this procedure can be written as
µT f state(xt, i) =∑
j∈Y\{i}
µTijdij(xt) (3)
wheredij(·) is a vector of functions discriminating betweeni andj, which is associated with themodel weightsµij . Examples will be considered in the sections that follow. Similarly, discriminantrules can be introduced for the transition feature functions in (2). In our experiments in Sec. 4,however, we consider a very simple transition model where
νT f trans(xt, h, i) = ν 1(h = i) (4)
for h, i ∈ Y. Note thatν is a scalar weight and the transition feature function simply reflects whetheror not an activity persists. The reason for using this simplistic model is that we want to avoid a biastowards certain transitions due to the design of the experimental courses.
3.4.1 Binary Threshold Functions
A simple type of discriminant rules, which we have first considered in [1], is obtained by comparingthe observations to fixed threshold values. Suppose that the observations are one-dimensional andreal-valued; in the case of multi-dimensional observations, we consider thresholds separately foreach component ofxt. Let 1(·) denote the function which evaluates to1 if the statement in thebrackets is true, and to0, otherwise. For each pair of labelsi, j ∈ Y with i 6= j, introduce athresholdτij and consider the weighted discriminant rules
µTijdij(xt) = µ
(g)ij 1(xt ≥ τij) + µ
(l)ij 1(xt < τij). (5)
In [1] we suggested to choose the thresholds manually by a visual inspection of the observations.Although the results that we obtained were encouraging, this approach has the disadvantages ofbeing time-consuming (wherefore our observations in [1] did not include the means and variancesover past measurements) and subjective. In this paper, we propose to select the tresholds usingLinear Regression (LR) models.
For the rest of this section, suppose we are given training data(x,y) wherex = (x1, . . . , xn) andy = (y1, . . . , yn). Using a LR model, a standard way for selectingτij is to regress the valuesxt forwhich yt = i on 1, and the valuesxt for which yt = j on−1. Then the resulting LR coefficients
5
αij andβij are used to compute the thresholdτij = −αij/βij (see, e.g., Chapter 4 in [9]). Notethat this threshold implicitly models the a priori probabilities ofYt = i andYt = j. In the presentpaper, we consider thresholds based on normalized numbers to avoid a bias towards labels with ahigh frequency in the training data set. Based on the normalized numbers, the threshold is simplygiven by
τij =12
(1ni
n∑t=1
1(yt = i) xt +1nj
n∑t=1
1(yt = j)xt
)whereni, nj denote the number of points in the training data set for whichyt = i andyt = j,respectively.
3.4.2 Sigmoid Threshold Functions
While a major advantage of binary threshold functions is their computational simplicity, they donot reflect whetherxt exceedsτij only slightly or by a wide margin. A natural way to incorporatethis information is using the sigmoid function sigm(x) = 1/(1 + e−x) which can be regarded as acontinuous analogue of the binary-valued function1(x ≥ 0). The weighted discriminant rules in(3) are then given by
µTijdij(xt) = µ
(g)ij sigm(γij(xt − τij)) + µ
(l)ij sigm(γij(τij − xt))
whereγij is an additional scaling parameter. We propose to determineγij by maximizing
L(γij) =n∑
t=1
1(yt = i) γij(xt − τij)−n∑
t=1
1(yt = i or yt = j) log(1 + exp(γij(xt − τij)
).
Note thatL(γij) is concave, so it has a unique maximum which can be found using Newton’smethod. In a logistic regression model,L(γij) is the log-likelihood of the intercept−γijτij andthe slopeγij (see, e.g., Chapter 4 in [9]). Thus, maximizingL(γij) is equivalent to finding themaximum likelihood estimates of a logistic regression model where not the whole parameter spaceis explored but only a linear subspace.
3.4.3 Using Raw Observations
Finally, let us consider discriminant rules which take the raw observations into account. Byµ andσ we denote the sample mean and standard deviation ofxt. Again, we first suppose thatX isone-dimensional and consider discriminant rules separately for each component ofxt in the multi-dimensional case. Using raw observations, the weighted discriminant rules in (3) become
µTijdij(xt) = µ
(ic)ij + µ
(sl)ij
(σ−1(xt − µ)
).
Note that the standardization ofxt is necessary to avoid large values ofµ(ic)ij andµ
(sl)ij to be penalized
during the training of the CRF.
3.5 Feature Functions Using Data Binning
As an alternative to feature functions based on discriminant rules, we considerdata binning. Sup-pose the domain of observationsX is one-dimensional. Data binning means to partitionX into afinite number of subsetsA1, . . . ,Am. We use the indicators of these subsets as feature functions, sothat
µT f state(xt, i) =m∑
j=1
µij 1(xt ∈ Aj)
for i ∈ Y. WhenX is multi-dimensional, we partition each subdomain separately and sum up thecorresponding weighted features. For our experiments in Sec. 4, we chosem proportional tok, thenumber of different labels. We consider two strategies for selecting the setsA1, . . . , Am: Writingxmin andxmax for the minimum and the maximum value ofxt in the training data set, the first strategyis to divide[xmin, xmax] into k intervals of equal size; the second strategy is to divide[xmin, xmax] intok intervals such that each interval contains the same number of points in the training data set.
6
Table 1: Accuracy for Experiment 1 (in %)NT ST FW LE RI BW TF Total S.E.
In this section, we evaluate the proposed algorithms on real user data. The data was collected in twodifferent experimental settings which we describe in Sec. 4.1. The results are discussed in Sec. 4.2.
4.1 Experimental settings
In the first experiment, 12 healthy young subjects (19-53 years old) were asked to walk twicethrough a predefined course. At the beginning, the participants were sitting on a chair and nottouching the walker (NT); then they were standing and holding the walker (ST); they had to walkforward/backwards (FW/BW) and execute left/right turns (LE /RI ) to navigate through the course;finally, they were asked to release the walker and sit back on the chair. The behavior of gettingup/down and taking/releasing the walker is subsumed under Transferring (TF). In total, the data setconsists of 98,259 time points, corresponding to a duration of approx. 33 minutes.
The participants of the second experiment were 15 older adults (80-97 years old), 8 of which wereresidents of a long term health care facility and regularly using a walker. The participants wereasked to walk through two different courses. In the first course, the participants had to walk forward(FW) and perform left/right turns (LE /RI ); meanwhile, they were asked to execute real-life taskslike picking up objects from the ground, turning in a confined space, or walking fast as if they weretrying to catch a bus. In the second course, the participants had to go up/down a ramp (UR/DR) and acurb (UC/DC). We also recorded some spontaneous activity between the two courses; for example,the participants sat on the walker (SI) after performing the first course and then navigated to thesecond course. In total, the data set consists of 130,195 time points, corresponding to a duration ofapprox. 44 minutes.
The training data collected in the two experiments was labeled manually using the recordings ofa video camera mounted on the walker. We compare six different methods for activity recog-nition: CRF+ManTh uses binary threshold functions as described in Sec. 3.4.1. Same as in[1], we chose the threshold values manually by a visual inspection of the data. As this proce-dure is time-consuming, the model does not include the means and variances over past measure-ments. CRF+BinTh uses binary threshold functions with the thresholds obtained by LR models.CRF+SigmTh uses the sigmoid threshold functions.CRF+Raw uses discriminant rules based onraw observations.CRF+EqBin uses feature functions based on data binning with bins of equal size.CRF+PrBin uses data binning with the bins all containing the same number of observations.
We use leave-one-out cross-validation to evaluate the performance of the methods. The labels arepredicted by maximizing the conditional marginal distributions. Table 1 and 2 show the percentage
7
of time points for which an activity is predicted correctly; the last two columns display the totalaccuracy and the standard error.
4.2 Discussion
As can be seen, CRF+SigmTh achieves the best performance among all six methods with an overallaccuracy of 88.7% in Experiment 1, and 84.9% in Experiment 2. Except for the CRF+EqBin methodin Experiment 2, these differences in the performance are all statistically significant (one-tailedWilcoxon signed-rank test, significance levelα = 0.05). The second-best methods are CRF+BinThin Experiment 1, and CRF+EqBin in Experiment 2. In both experiments, the CRFs with automati-cally chosen thresholds perform significantly better than the CRFs with manually chosen ones.
In Experiment 1, all methods have problems to correctly identify transfers (TF), which is not sur-prising as this is an intermediate activity between not touching the walker (NT) and standing (ST).Turning left and right (LE/RI) is sometimes confused with walking forward (WF), however, evenfor a human observer it is often hard to tell when a turn exactly starts or ends. Overall, the resultsfor Experiment 1 are better than for Experiment 2. A possible explanation is that the participants inExperiment 1 performed the course twice, so the training data set always includes one recording ofthe person for which the activity is currently predicted. Furthermore, some of the activities exhibitedduring Experiment 2 are highly individual; for example, the participants used very different strate-gies to move the walker up and down the curb. Even for simple activities there is a higher variabilityin Experiment 2, as the participants were instructed to walk at different speeds or pick up objectsfrom the ground.
5 Conclusions
In this paper we presented the Smart Walker, a four-wheel rolling walker equipped with sensorsto provide assistance to users, caregivers and clinicians. A key problem in implementing assistivefunctionalities is the recognition of user activities from the sensor measurements. For this purpose,we presented and evaluated different methods based on Conditional Random Fields. Experimentswith real user data showed that these methods can achieve a good accuracy; the best results wereobtained by “smooth” thresholding based on sigmoid functions.
Fundamental questions for our future research are how the accuracy achieved by the algorithmscompares to the agreement among different human labelers. In cooperation with kinesiologists wewill evaluate how much accuracy is actually needed for providing robust measures, e.g., of the user’sstability, and develop strategies to cope with the basic uncertainty about the “true” user activity.Finally, we will consider individualized user models which can incorporate prior information, e.g.,about the user’s body weight, his physical and mental conditions, or whether he is left- or right-handed.
Acknowledgements
The research of Mathieu Sinn was supported by a Postdoctoral Research Fellowship (PDRF) of theCanadian Bureau for International Education (CBIE).
References
[1] Omar, F., Sinn, M., Truszkowski, J., Poupart, P., Tung, J. & Caine, A. (2010). Comparative analysis ofprobabilistic models for activity recognition with an instrumented walker.Proceedings of the 26th Conferenceon Uncertainty in Artificial Intelligence.
[2] Tung, J., Gage, W.H., Zabjek, K., Brooks, D., Maki, B.E., Mihailidis, A., Fernie, G. & McIlroy, W.E. (2007).iWalker: a ‘real-world’ mobility assessment tool.Proceedings of the 30th Canadian Medical & BiologicalEngineering Society.
[3] Pardo, R.D., Deathe, A.B. & Winter, D.A. (1993). Walker user risk index, a method for quantifying stabilityin walker users.American Journal of Physical Medicine and Rehabilitation72(2):301-305.
[4] Glover, J., Thrun, S. & Matthews, J. (2004). Learning user models of mobility-related activities throughinstrumented walking aids.Proceedings of the IEEE International Conference on Robotics and Automation.
8
[5] Hirata, Y., Muraki, A. & Kosuge, K. (2006). Motion control of intelligent walkers based on renew of esti-mation parameters for user state.Proceedings of the IEEE/RSJ Conference on Intelligent Robots and Systems.
[6] Alwan, M., Wasson, G., Sheth, P., Ledoux, A. & Huang, C. (2004). Passive derivation of basic walker-assisted gait characteristics from measured forces and moments.Proceedings of the Annual InternationalConference of the IEEE Engineering in Medicine and Biology Society.
[7] Lafferty, J., McCallum, A. & Pereira, F. (2001). Conditional random fields: Probabilistic models for seg-menting and labeling sequence data.Proceedings ICML01.
[8] Sutton, C. & McCallum, A. (2006). An introduction to conditional random fields for relational learning.In:L. Getoor and B. Taskar (eds.),Introduction to Statistical Relational Learning. Cambridge, MA: MIT Press.
[9] Hastie, T., Tibshirani, R. & Friedman, J. (2009).The Elements of Statistical Learning. Data Mining,Inference, and Prediction. Second Edition.New York, NY: Springer.