AD-A26 4 466 1/ Imll Ii11 Hl!!jII Ijijj NaI*nl Dean" * *~DoW= ra~naI.wf EFFECTS OF IMBALANCES AND DC OFFSETS ON VQ DEMODULATION (U) by Jim P.Y. Lee •, MAY 2 11ss DEFENCE RESEARCH ESTABLISHMENT OITAWA REPORT NO. 1148 Canad=i December 1992 Ottawa 5 20 6 8 93-11370 III II!1II1III111I I! 1
Transcript
AD-A26 4 466 1/Imll Ii11 Hl!!jII Ijijj
NaI*nl Dean"* *~DoW= ra~naI.wf
EFFECTS OF IMBALANCES ANDDC OFFSETS ON VQ DEMODULATION (U)
by
Jim P.Y. Lee
•, MAY 2 11ss
DEFENCE RESEARCH ESTABLISHMENT OITAWAREPORT NO. 1148
Canad=i December 1992
Ottawa
5 20 6 8 93-11370I II II!1II1III111I I! 1
E1~ENadionaI WeneeDefe*c natfonale
EFFECTS OF IMBALANCES ANDDC OFFSETS ON VQ DEMODULATION (U)
by
Jim FM¥. LeeRadar ESM Section
Electronic Warfare Division
DEFENCE RESEARCH ESTABLISHMENT OTTAWAREPORT NO. 1148
PCN December 1992011LB Ottawa
ABSTRACT
The effects of imbalances and DC offsets, in an I/Q demodulator, on thedemodulation of radar signals are addressed in this report. Three normalized parameters,namely the peak-to-peak-ripple to mean ratio, phase error and normalized instantaneousfrequency deviation are used to characterize distortions introduced on the envelope, phaseand instantaneous frequency respectively. The effect on the distortions due to aliasing andan approximation used in deriving the instantaneous frequency in a discrete-timeprocessor, is also analyzed.
When there are imbalances and DC offsets, a bias is produced on both thedemodulated envelope and phase. AC ripples with frequency components which aremultiples of the baseband frequency are also generated on all of the three demodulatedwaveforms. Since the demodulated waveform bandwidth is usually much narrower thanthe instantaneous bandwid;h of Lle I/Q demodulator and at high baseband frequency, thehigh frequency components of the distortions can be effectively reduced by low-passfiltering.
RESUME
Ce rapport contient une analyse des effets des asym~tries et des niveaux decourant continu sur un d~modulateur en quadrature de phase. Les disLorsiors del'enveloppe, de la phase et de la fr~quence instantan~e de signaux radar, sont analysdes,respectivement, & l'aide de trois param~tres normalis~s, soient le rapport, crete- --cr~te,des fluctuations i la moyenne de l'enveloppe, l'erreur de phase et les changements defr@quence instantan~e. On y analyse aussi l'impact sur les distorsions du repliementspectral et des approximations utilis~es dans la d6termination de la frdquence instantan~epar un syst~me de traitement ý 6chantillonnage temporel.
Les asym6tries et les d~calages de courant continu produisent un biais quis'ajoute i. l'enveloppe d~modul~e et ý. la phase. Des fluctuations de courant alternatifcontenant des composantes spectrales situ~es aux multiples de la fondamentale sontg~n~r~es pour les trois signaux d~modul~s. Pour les applications de guerre 6lectronique, labande passante du d~modulateur en quadrature est habituellement beaucoup plus grandeque la bande passante du signal d~modul6. Lorsque la fondamentale du signal est grande etcomparable ý sa largeur de bande de modulation, les composantes h. haute frHquence de ladistorsion peuvent ktre att~nu~es efficacement par un filtre passe-bas.
Acces!?Ion For
N --
Av
j) I
EXECUTIVE SUMMARY
Due to the increasing density and complexity of radar signal waveforms, it isbecoming difficult to sort out and identify each radar emitter uniquely using conventionalsignal parameters such as pulse width, radio frequency (RF), amplitude and pulserepetition frequency. As a result, in electronic warfare applications, there is a requirementfor a radar Electronic Support Measures (ESM) receiver to measure precisely themodulation characteristics of radar signals and to provide additional parameters on themodulation waveform such as envelope, phase and instantaneous frequency which can beused to identify unambiguously each type of radar emitter. With the advent of fast A/Dconverters and high-speed digital signal processing technologies, I/Q demodulators havebeen developed which can measure accurately the modulation characteristics of radarsignals.
There are different approaches in the implementation of an I/Q demodulator. Themost common one is the conventional I/Q demodulator where the generation of thein-phase and quadrature components of a signal is implemented using analog components.The in-phase and quadrature signals are then digitized and processed to extract themodulation characteristics of the signal. The attractive features of this approach are itswide instantaneous bandwidth and simple implementation. However, there are amplitudeand phase imbalances between the two channels and DC offset in each channel, which inturn can introduce systematic errors to the measurement.
Other digital approaches of directly eliminating the mismatches have also beenproposed. In these approaches, the splitting of the input signal into its in-phase andquadrature components is carried out in the digital domain by passing the digital signalthrough digital Hilbert transform filters. However, the computational load of the digitalprocessor is increased due to the requirements of the digital filtering operations and somedistortion is also introduced due to finite word length effects and the finite order of thedigital filters. The magnitude and type of mismatches depend on the particular schemeimplemented. In general, the imbalances and DC offsets can be made much less than theconventional I/Q demodulator implemented using commercial quadrature mixers.
No matter which approach is used, some form of mismatch does exist in thegeneration of the in-phase and quadrature signals. This will inevitably affect the accuracyof the demodulated information.
The purpose of this report is two-fold. The first objective is to analyze the effects ofimbalance errors and DC offsets on the demodulated characteristics. Different cases interms of the imbalances and DC offsets are used to illustrate the distortions introduced.The second objective is to present simple techniques which can be used to reduce thedistortions introduced by the imbalances and DC offsets.
The effects of imbalances and DC offsets, in an I/Q demodulator, on thedemodulation of radar signals are addressed. Three normalized parameters, namely thepeak-to-peak-ripple to mean, phase error and normalized instantaneous frequencydeviation are used to characterize distortions introduced on the envelope, phase andinstantaneous frequency respectively. The effect on the distortions, due to alinsing and anapproximation used in deriving the instantaneous frequency in ai discrete-time processor, isalso analyzed.
v
When there are imbalances and DC offsets, a bias is produced on both thedemodulal.ed envelope and phase. AC ripples with frequency components which aremultiples of the baseband frequency are also generated on all of the three demodulatedwaveforms. In EW applications, the video or modulation bandwidth of the signal is usuallysmall in comparison to the instantaneous frequency bandwidth of the I/Q demodulator. Asa result, when the signal is down-converted to a baseband frequency which is larger thanthe modulation bandwidth, the frequency components of the distortions can be reduced bylow-pass filtering. The technique of using a moving average has been shown to be effectiveto attenuate the ripples caused by the mismatches and with minimal effect or both thedemodulated envelope and instantaneous frequency.
vi
TABLE OF CONTENTS
PAGE
ABSTRACT/RESUME iiiEXECUTIVE SUMMARY vTABLE OF CONTENTS viiLIST OF FIGURES ix
1.0 INTRODUCTION 1.
2.0 I/Q DEMODULATION 3
3.0 AMPLITUDE AND PHASE IMBALANCES AND DC OFFSETS 43.1 Envelope Measurement 53.2 Phase and Instantaneous Freýquency Measurement 6
4.0 AMPLITUDE AND PHASE IMBALANCES ONLY 74.1 Amplitude Imbalance Only 154.2 Phase Imbalance Only 18
5.0 DC OFFSETS ONLY 19
6.0 AMPLITUDE IMBALANCE AND DC OFFSET ONLY 24
7.0 EFFECT OF TIME SAMPLING 26
8.0 REDUCTION OF SYSTEMATIC ERRORS BY LOW-PASSFILTERING 34
9.0 SUMMARY AND CONCLUSIONS 41
10.0 REFERENCES 47
vii
1.0 INTRODUCTION
Due to the increasing density and complexity of radar signal waveforms, it isbecoming very difficult to sort out and identify each radar emitter uniquely usingconventional signal parameters such as pulse width, radio frequency (RF), amplitude andpulse repetition frequency. As a result, in electronic warfare applications, there is arequirement for a radar Electronic Support Measures (ESM) receiver to measure preciselythe modulation characteristics of radar signals and to provide additional parameters on themodulation waveform such as amplitude, phase and frequency W'hich can be used toidentify unambiguously each type of radar emitter. With the advent of fast A/D convertersand high-speed digital signal processing technologies, it is possible to develop digitalmicrowave receivers which can meet this requirement [1].
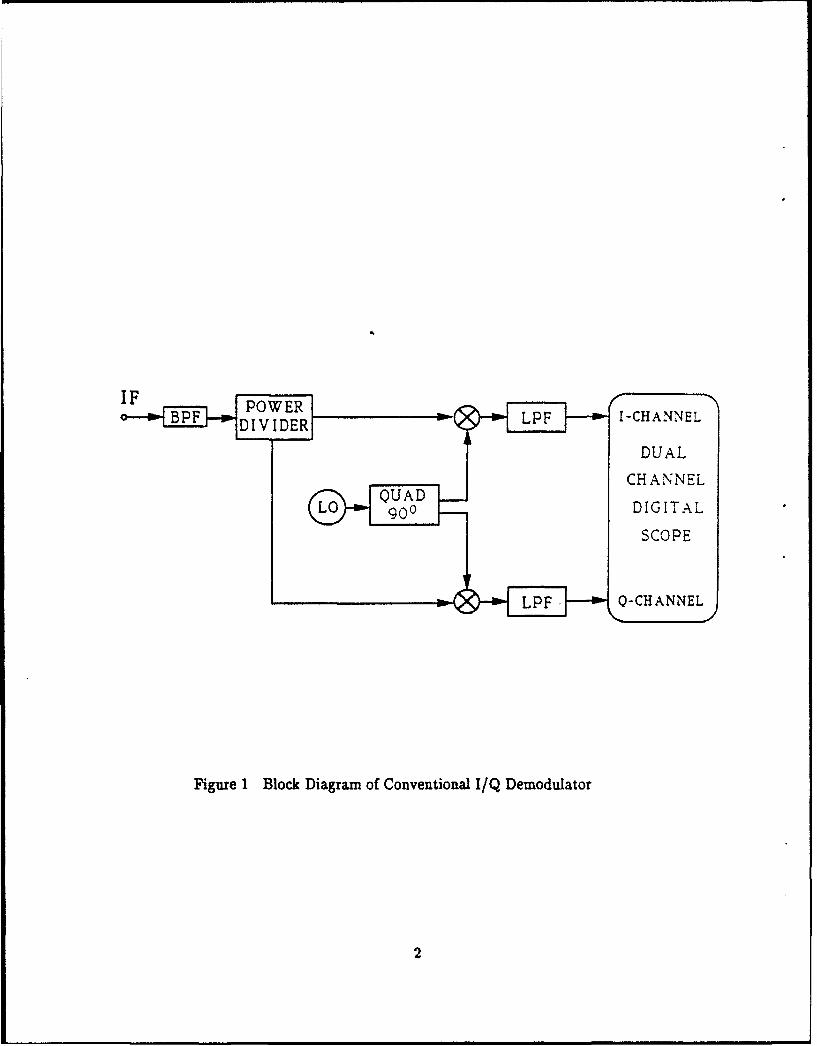
A simple conventional in-phase/quadrature (I/Q) demodulator which can measureaccurately the envelope, phase and instantaneous frequency of radar signals is shown inFig. 1. The attractive features of this architecture for radar ESM applications are: (i) wideinstantaneous bandwidth because the negative and positive frequencies with respect to thelocal oscillator frequency can be distinguished, and (ii) simple algorithms for the extractionof modulation characteristics can be used so that nearly real-time results can bp obtained.
Wide instantaneous bandwidth is important for a number of reasons. In EWapplications, the signal frequency bandwidth can be large and 500 MHz is not uncommon[2]. In addition, if it is required to measure fine modulations of narrow pulses, a wideinstantaneous bandwidth with minimal group delay variations is also needed. Furthermore,the frequencies of the signals of interest are usually unknown and they may scatter in amuch broader frequency band than the bandwidths of the signals. As a result, in this casethe instantaneous bandwidth of an I/Q demodulator is usually designed to be much widerthan the modulation bandwidths of the signals.
The conventional I/Q approach has its own problem. Because the splitting of thesignal into its in-phase and quadrature components is implemented using analogcomponents, there are amplitude and phase imbalances between the two channels and DCoffset in each channel, which in turn can introduce systematic errors to themeasurement[3-6]. Quadrature mixers are commercially available, howcever they exhibitrelatively large amplitude and phase imbalances[6,7]. On the other hand, much bettermatching characteristics can be obtained by using custom-matched quadrature mixers[6].The imbalances and DC offsets of I/Q demodulators can also be reduced in the processingby using calibration and compensation techniques[6,8]
Other approaches of directly eliminating the mismatches have been proposedrecently [9-121. In these approaches, the bandpass signal is either directly sampled or isfirst down converted to a lower intermediate frequency (IF) before it is sampled. Thesplitting of the input signal into its in-phase and quadrature components is carried out inthe digital domain by passing the digital signal through digital Hilbert transform filters.However, the computational load of the digital processor is increased due to the additionalrequirements of the digital filtering operations and some distortion is also introduced dueto finite word length effects and the finite order of the digital filters. The magnitude andtype of mismatches depend on the particular scheme implemented. In general, the
IDLPF P -CHANNEL
Fgure 1DBockDiaRa oCnvtialIQDmdlato
DUALCHANNEL
QUADLO 900 DIGITAL
SCOPE
ý L ýPF QQ -CC HHANNN ELL
Figure 1 Block Diagram of Conventional I/Q Demodulator
imbalances and DC offsets can be made much less than the conventional I/Q demodulatorimplemented using commercial quadrature mixers.
No matter which approach is used, some form of mismatch does exist in thegeneration of the in-phase and quadrature signals. This will inevitably affect the accuracyof the demodulated information.
In EW applications, the envelope, phase and instantaneous frequency of the signalmo)dulation are measured directly, and consequently, the effects of imbalances and DCoffsets on the demodulated waveforms as a function of time are of interest. As a result, theanalysis carried out in this report is focused on the time domain effects which are differentfrom the conventional approach [3--5] where the effects are characterized in the frequencydomain in terms of the relative ratio of the demodulated signal frequency to its imagefrequency. The analysis given in this report is based mainly on the use of the conventionalI/Q demodulator. For other digital approaches, the generation of the in-phase andquadrature components may be different, but the effects of imbalances and DC offsets onthe demodulated signals are equally applicable.
Tl" purpose of this report is two-fold. The first objective is to analyze the effects ofimbalani, errors and DC offsets on the demodulation characteristics. Different cases interms of the imbalances and DC offsets are used to illustrate the distortions introduced.The second objective is to present simple techniques which can be used to reduce thedistortions introduced by the imbalances and DC offsets.
2.0 I/Q DEMODULATION
An incoming RF signal is usually down-converted to an IF signal before it is appliedto the I/Q demodulator. The IF signal applied to the I/Q demodulator can be expressed inthe form of
s(t) = a(t) cos[wot + 0(t)] (1)
where a(t) is the amplitude or envelope, wo is the IF angular carrier frequency and 0(t) is
the phase function of the signal. In a conventional I/Q demodulator as shown in Fig. 1,the signal is first bandpass filtered and then equally power-divided into two paths. Thesignal in each path is then mixed down to baseband by the use of a local oscillator signal.The two local oscillator signals are derived from the same source, but are 90 degrees out of
hase. The resultant in-phase and quadrature baseband signals after the low-pass filter(LPF) are,
respectively, where K is the net gain in each path, w1o is the angular frequency of the localoscillator with initial phase 7, 0(t) is the phase function of the baseband signal and aconstant delay introduced in each path has been neglected. In this ideal case, the two
3
channels have been assumed to be perfectly matched in amplitude, 90 degrees out of phaseand with no DC offsets.
The instantaneous power of the envelope of the input IF signal is simply related toits in-phase and quadrature baseband components by
a2(t) = 4/K 2 [ S(t) + Sq(t)] , (4)
the signal phase function is given by
S= 0 - (W- )t + 7
= tan-' [Sq(t)/Si(t)] - (Wo- W1o)t + ' (5)
and the instantaneous angular frequency is
21f(t) - dt =t [ tan" [Sq(t)/Si(t)]]- (to- W10).
(6)
The in-phase and quadrature baseband signals are usually sampled and quantized attn = nTs + To, where Ts is the sampling interval, To is the initial time and n = 0,1,2,.
In this case, the sampled instantaneous angular frequency is then approximately given by
2rf(tn) - [0(tn) - 0(tn.6)]/Ts (7)
3.0 AMPLITUDE AND PHASE IMBALANCES AND DC OFFSETS
In the implementation of the I/Q demodulator there will be differential gain, DCoffsets and phase deviation from the ideal 90 degrees between the two channels [4].Equations (2) and (3) can then be rewritten in a more general form as
Si(t) = Ki/2 a(t) cos[fi(t) + •j] + aio (8)
and
Sq(t) = Kq/2 a(t) sin•fl(t) + Cq] + aqo (9)
respectively, where aio and aqo are the amplitude DC offsets, Ki and Kq are the gains, andOi and iq are the phases of the in-phase and quadrature channels respectively. aio, aqo, Ki,Kq ,0i and Oq are in general a function of frequency. For narrow-band signals, they can beassumed to be approximately constant.
There are four basic components on the mismatches, namely amplitude imbalance,phase imbalance and DC offsets in the in-phase channel and quadrature channel.Depending on the type of I/Q demodulator or the digital approach used, the relativemagnitude of the four mismatch components can vary. In the conventional I/Q
4
demodulator, if commercial quad:ature mixers are used, all four components can be large.If a ctstom-matched quadrature mixer is used, The imbalances can be quite small. If theDC offsets are stored and subtracted digitally from the in-phase and quadrature signals inthe processing, then DC offsets are negligible as compared to the imbalances. In the digitalapproach, if one Hilbert transformer is used in one of the channels in generating thequadrature component[91, only amplitude imbalance and one DC offset are present. If twolinear-phase FIR bandpass filters with frequency responses identical in amplitude but 90degrees shifted in phase, the DC offsets will be eliminated and the amplitude and phaseimbalances are then determined by the finite number of bits in the A/D converters and thesampling jitter [121.
The general case in which all the imbalances and DC offsets are present is disc'issed.In addition, other specific cases are also analyzed in detail. The specific cases presented inthis report are :
i 4 Amplitude and Phase Imbalances Only,ii) Amplitude Imbalance Only,iii Phase Imbalance Only,
i DC Offsets Only and
1v) Amplitude and DC Offset Only
3.1 Envelope Measurement
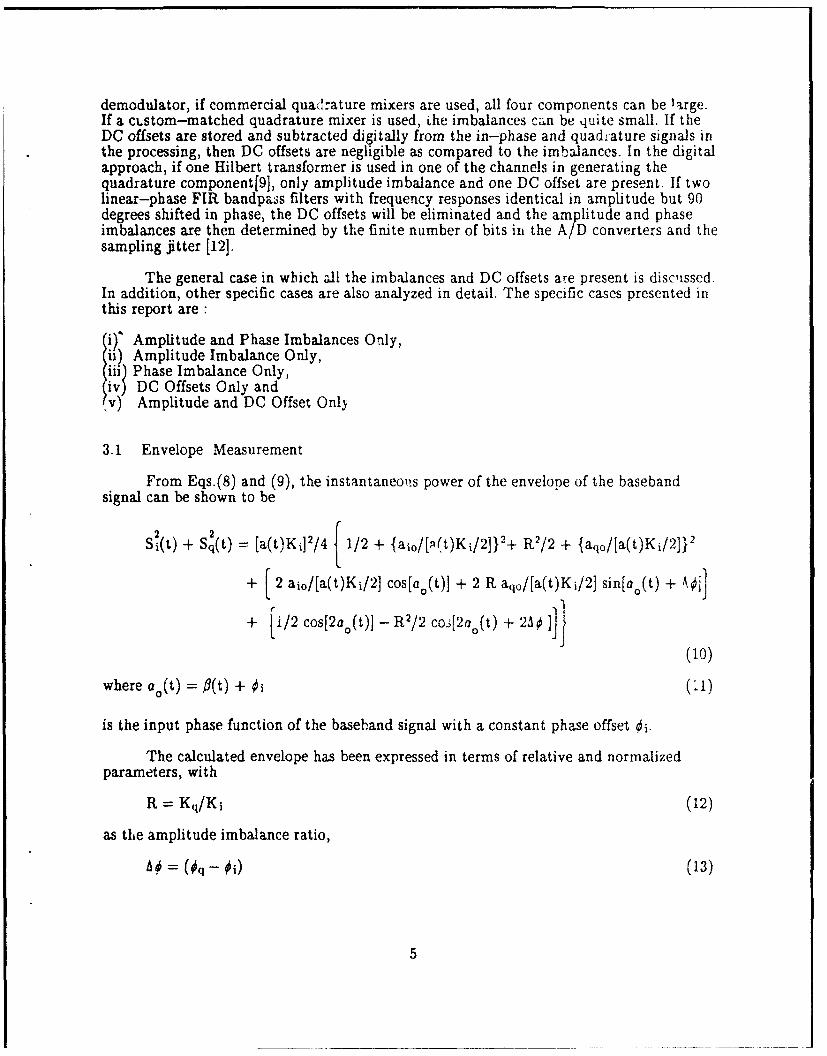
From Eqs.(8) and (9), the instantaneois power of the envelope of the basebandsignal can be shown to be
+ 2 aio/[a(t)Ki/2] cos[an(t)] + 2 R aqo/[a(t)Ki/21 sintao(t) + A ]o
+ [i/2 cos[2a 0 (t)] - 112/2 co3[2a 0(t) + 2AO
where ao(t) = 0l(t) + •i (:1)
is the input phase function of the baseband signal with a constant phase offset €i.
The calculated envelope has been expressed in terms of relative and normalized
parameters, with
R = Kq/Ki (12)
as the amplitude imbalance ratio,
AO = (13)
5
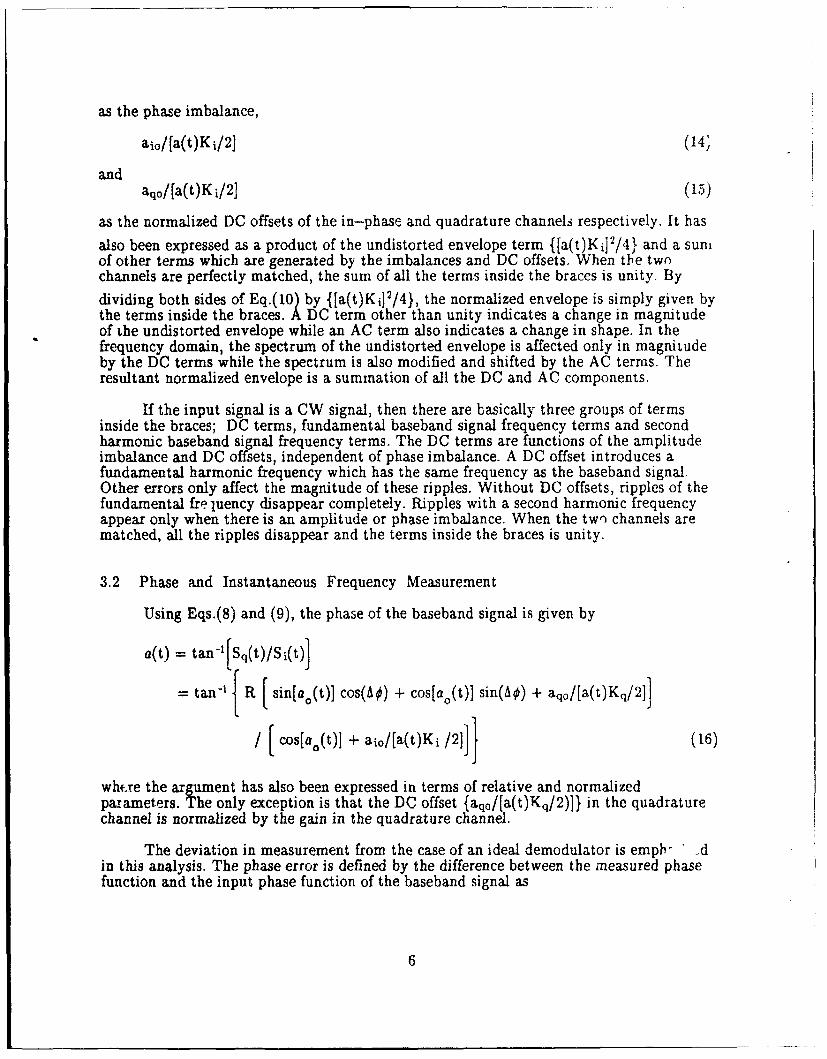
as the phase imbalance,
aio/[a(t)Ki/2] (14/i
and aqo/[a(t)K i/2] (15)
as the normalized DC offsets of the in-phase and quadrature channels respectively. It has
also been expressed as a product of the undistorted envelope term {[a(t)Kj]2/4} and a suniof other terms which are generated by the imbalances and DC offsets. When the twochannels are perfectly matched, the sum of all the terms inside the braces is unity. By
dividing both sides of Eq.(10) by {[a(t)Kj] 2/4}, the normalized envelope is simply given bythe terms inside the braces. A DC term other than unity indicates a change in magnitudeof the undistorted envelope while an AC term also indicates a change in shape. In thefrequency domain, the spectrum of the undistorted envelope is affected only in magnitudeby the DC terms while the spectrum is also modified and shifted by the AC terms. Theresultant normalized envelope is a summation of all the DC and AC components.
If the input signal is a CW signal, then there are basically three groups of termsinside the braces; DC terms, fundamental baseband signal frequency terms and secondharmonic baseband signal frequency terms. The DC terms are functions of the amplitudeimbalance and DC offsets, independent of phase imbalance. A DC offset introduces afundamental harmonic frequency which has the same frequency as the baseband signalOther errors only affect the magnitude of these ripples. Without DC offsets, ripples of thefundamental frejuency disappear completely. Ripples with a second harmonic frequencyappear only when there is an amplitude or phase imbalance. When the two channels arematched, all the ripples disappear and the terms inside the braces is unity.
3.2 Phase and Instantaneous Frequency Measurement
Using Eqs.(8) and (9), the phase of the baseband signal is given by
whf.re the argument has also been expressed in terms of relative and normalizedparameters. The only exception is that the DC offset {aqo/[a(t)Kq/2)]} in the quadraturechannel is normalized by the gain in the quadrature channel.
The deviation in measurement from the case of an ideal demodulator is empb- ' Ain this analysis. The phase error is defined by the difference between the measured phasefunction and the input phase function of the baseband signal as
6
a(t) = 0(t) -o(t) (17)
For a specific set of imbalances and DC offsets, the phase error can be fully characterizedby plotting aa(t) over an input phase change of 2r radians. The measured phase value[a(t)] is then obtained from Eq. (17) once the phase function of the input signal is known. Ifthe input signal is a CW signal, the phase is linearly proportional to time and an inputphase change of 2r radians simply corresponds to one period of the signal. It is to be notedthat the imbalances and DC offsets are usually a function of frequency.
The measured instantaneous frequency deviation from the input baseband signal isthen obtained by differentiating Eq.(17) with respect to time. Hence,
a9[aa(t)] (18)t] ~o~)
•t = • i (18
where a[Aa(t)j/a[a 0 (t)] is the partial derivative of the measured phase change with respect
to the input phase and is dimensionless. It is also a very useful parameter in characterizingthe instantaneous frequency deviation due to the imbalances and DC offsets. Thisparameter is referred to as the normalized instantaneous frequency deviation in this report.By substituting Eq. (16) into Eq.(17) and taking the partial derivative with respect to theinput phase, the general expression for the normalized instantaneous frequency deviationcan be shown as
For a given set of imbalances and DC offsets, the normalized frequency deviation iscompletely determined by a plot of 8faa(t)]/Ofa 0 (t)] over an input phase change of 27
radians. The measured frequency deviation from the input signal is determined bymultiplying the normalized frequency deviations by the instantaneous frequency of theinput signal at the baseband frequency as given in Eq.(18). If the imbalances and DCoffsets are about the same, independent of IF frequency, the measured frequency error dueto the ripples can be minimized by choosing an IF signal which gives the lowest basebandfrequency.
4.0 AMPLITUDE AND PHASE IMBALANCES ONLY
When there are only amplitude and phase imbalances between the in-phase andquadrature channels, the instantaneous power of the envelope of the baseband signal[Eq.(10)], can be simplified to
7
S, 2(t) + S2(t) (a(t) K'i/4 { 1/2 + R 2/2
+ 1/2 cos[2ao(t)] - R2/2 cos{2[ao(t) +- AO]} (20)
Inside the braces, there are DC and AC ripple terms, with the latter having a frequency
twice that of the baseband frequency. Rewriting the AC ripple terms separately, we have
Ripple = 1/2 cos[2ao(t)] - R 2/2 cos{2[ao(t)+ A0]} (21)
The locations of the peak and null of the rippies can be found by taking thederivative of Eq.(21) with respect to ao(t) and equating the result to zero. Therefore,
ao(t) = [tan"'(1/A)]/2 or
= [cos-'[ A /( 1 + A2)1/1]]/2 (22)
where A= 11R2cos(2A )]/[R2sin(2A (23)
The location of the peak or null depends on the sign of A. The peak and nulllocations are separated by 180 degrees. Inserting Eq.(22) into Eq.(21) and making use ofEq.(23), the value of the peak or null ripple is reduced to
The shape of the envelope is distorted by the ripples and the magnitude of theripples is a function of both the amplitude and phase imbalances. The mean of the ripplesis zero and since the magnitude of the peak equals the null, the peak-to--peak variation ofthe ripples is simply twice of that given in Eq.(24). The mean of the envelope [Eq.(20)] is1/2 + R2 /2 which is only a function of the amplitude imbalance. In practice, the amplitudeimbalance is small and R is close to unity. As a result, the mean of the undistortedenvelope is only slightly affected. Therefore, the ratio of the peak-to-peak variation of theripples to the mean of the envelope is given by
Peak-to-peak Ripple/mean
= [ 1+ R4 -2 R2 cos(2A•)] I21 / (1 + R2) (25)
This simple ratio gives a relative measure on the AC ripple distortion introduced bythe imbalances on the signal envelope and can be measured readily. When R is replaced by1/R or when R is expressed in terms of * dB, the ratio of the peak-to-peak ripple to themean remains the same. This ratio is also symmetrical with respect to the phase imbalanceas indicated by the cosine function. This is expected because the magnitude of thesystematic errors should be independent of the choice of the reference channel. A plot ofthe ratio of the peak-to-peak ripple to mean is plotted in Fig.2 as a function of amplitude
8
.20-
.. as -7,-.
P--P RIPPLE R dB)
M EAN - -, .7-
9.0 --- 7S~
-- j• - -
o~ -_.- -- - -
1.5% '' 1-1
0.85 -~ . . ~ ~
AMPLITUDE IMBALANCE R (± dli)
Figure 2 Normalized Peak-to-peak Ripple Versus Amplitudeand Phase Imbalances
9
and phase imbalances. For AO small and as R gets larger, the ratio will eventuallyapproach the maximum limit of 2.
The RMS value of the ripples to the mean can also be obtained directly by using thesimple fact that for a sinusoidal wave, the RMS value is simply equal to the peak valuedivided by the square root of 2.
When there are only imbalances present in the I/Q demodulator, the phase error asdefined by Eq.(17) can be simplified to
aa(t) = tan -[ R cos(AO) {tan[ao(t)] + tan(AS)}] - ao(t) (26)
The argument is characterized by an offset [tan(AO)] and a scaling factor [R cos(A&)].When ao(t) equals - A0, the phase error is AS.
The locations of the zero-crossings in the principal branch a0o(t) • 9001 is
obtained by setting Eq.(26) to zero and then solving for [ao(t)] to yield
[a.(t)] = tan -1 R sin(AO)/ [1 - R cos(AO)]] (27)
For R cos(Ah) # 1, one of the zero-crossings is located in the range of a,(t)I < 9g.
The other zero--crossings can also be found directly from Eq.(26) by letting ao(t) = g 900
for R cos(A4) j 0.
Because the tangent function is periodic and if there are three zero-crossings overthe range of 180 degrees, the period of the phase error as a function of ao(t) must be half
that of the input phase cycle. As a result, for a sinusoidal input signal the phase errorintroduced by the imbalances is not purely sinusoidal, but with a fundamental frequencycomponent which is twice that of the input baseband frequency.
For R cos(AO) = 1, the zero-crossings are located only at a0 (t) = * 900. The phase
error is of the same sign of the phase imbalance and the period of the phase error as afunction of ao(t) is also half that of the input phase cycle.
The normalized instantaneous frequency deviation as given by Eq.(19) can besimplified to
)= R cos(Ao)/I cos 2[ao(t)] + R 2 sin 2[ao(t) + At]] -1 (28)
The maximum and minimum locations of the phase error are obtained by setting thederivative [Eq.(28)] to zero. Hence,
10
tan2[aI(t)][ R cos(A,) - R2 0))
-tanlao(t)] f 2 R2 cos(A,) sin(AC)] + R cos(Ao) - I - R 2 sin 2 (A ) = 0 (29)
which is of quadratic form and the solutions can be found readily. Since the period of thephase error is half that of the input phase cycle, one solution is the maximum locationwhile the other is the minimum.
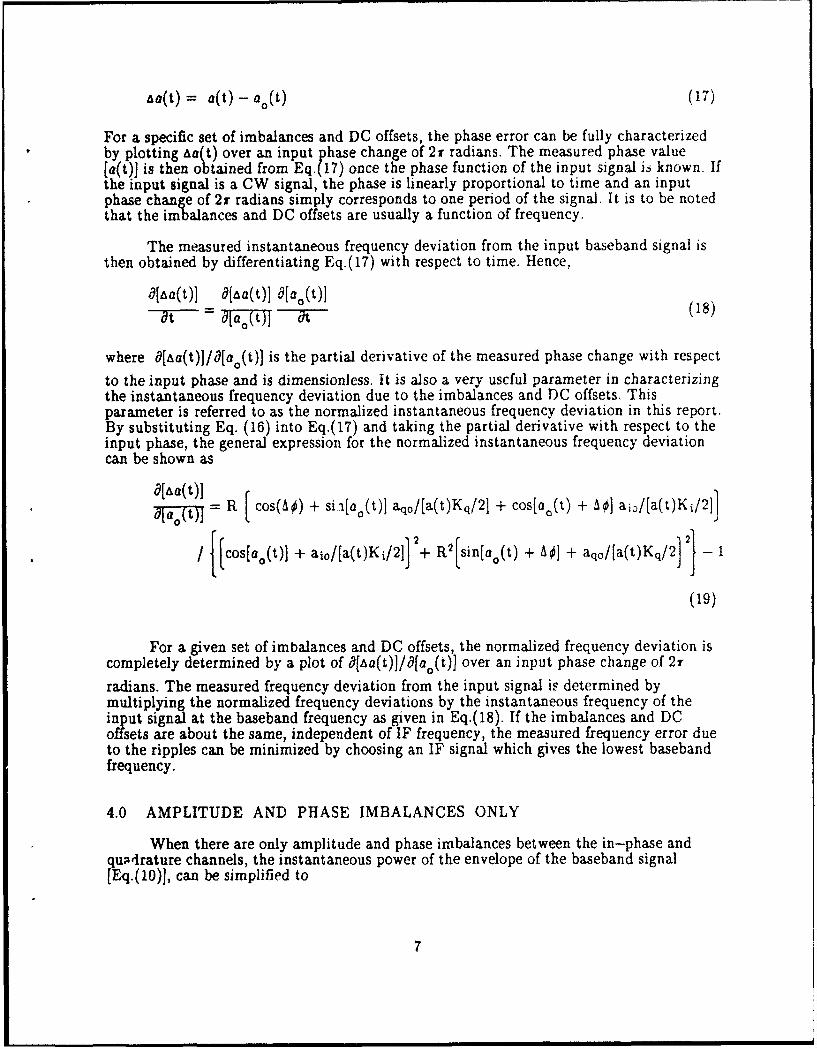
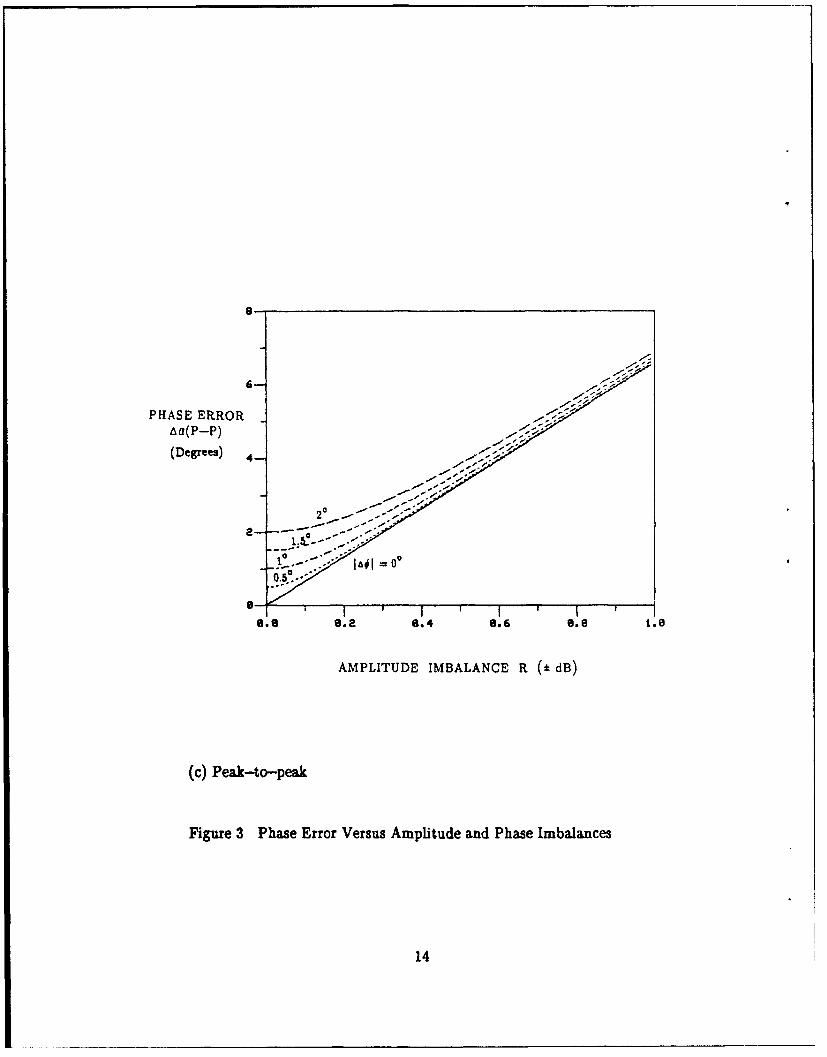
Since the phase error distribution is no longer purely sinusoidal over an input phasechange of 2r radians, its characteristics are more suitably described by the RMS, mean andpeak-to-peak parameters. The three parameters of the phase error as a function ofamplitude and phase imbalances are plotted in Figs. 3(a) to 3(c). The RMS andpeak-to-peak values are only a function of the absolute value of the phase imbalancebecause the sign of the phase imbalance only changes the sign of the offset, not the scalingfactor in Eq.(26). When R is expressed in dB, the peak-to-peak value is also symmetricalto R = 0 because when R is replaced by 1/R, the offset will be changed, but the arctangentfunction is replaced by its cotangent function. This will only change the shape of the phaseerror, not its peak-to-peak value and the mean error is no longer zero. As expected, the
ratio of the RMS value to its peak-to-peak value is no longer equal to 1/(23/2) as for asinusoidal wave.
The locations of the maximum and minimum instantaneous frequency deviations arefound by differentiating Eq.(28) with respect to ao(t) and equating the result to zero.Hence
There are two solutions for the arctangent function over the 360-degree range. Afterdividing by two, one will provide the maximum location and the other the minimum withinthe 180-degree range.
As can be seen from Eq.(28), the relative shape of the normalized instantaneousfrequency deviation is only a function of the absolute phase imbalance because cos(AO) is aneven function of 40. Moreover when R is replaced by 1/R, the relative shape is also notaffected. However, the position of the normalized instantaneous frequency deviation as afunction of a0(t) is a function of both the imbalances. When R # 1 and A0 # 0, the period ofthe normalized instantaneous frequency deviation as a function of ao(t) is also half that of
11
3-l
MA(RMS) <""\ " "" ° .- 20 /
(Degrees) ", - -
-, u Z" . l~ 0~
6-0
-1.6@ -6l.5 8.0 5. 1.8
AMPLITUDE IMBALANCE R (dB)
(a) RMS
Figure 3 Phase Error Versus Amplitude and Phase Imbalances
Figure 3 Phase Error Versus Amplitude and Phase Imbalances
13
PHASE ERROR
aa(P-P)
(Degrees)
e.e 8.2 8.4 8.6 0.8 1.0
AMPLITUDE IMBALANCE R (+ dB)
(c) Peak-to-peak
Figure 3 Phase Error Versus Amplitude and Phase Imbalances
14
the input phase cycle. This period is generated by the squared terms of both the cosine andsine functions. Since the denominator is always positive, the sign of the first term ofEq.(28) is completely determined by cos(Aý). For cos(AO) > 0 or (A0) < 90 degrees,O[•a(t) IO/ao(t)]Ž > - 1. For cos(Ao) < 0 or 180 > (A0) ? 90 degrees, d[e-a(t)]/0[ao(t)j _ - L.
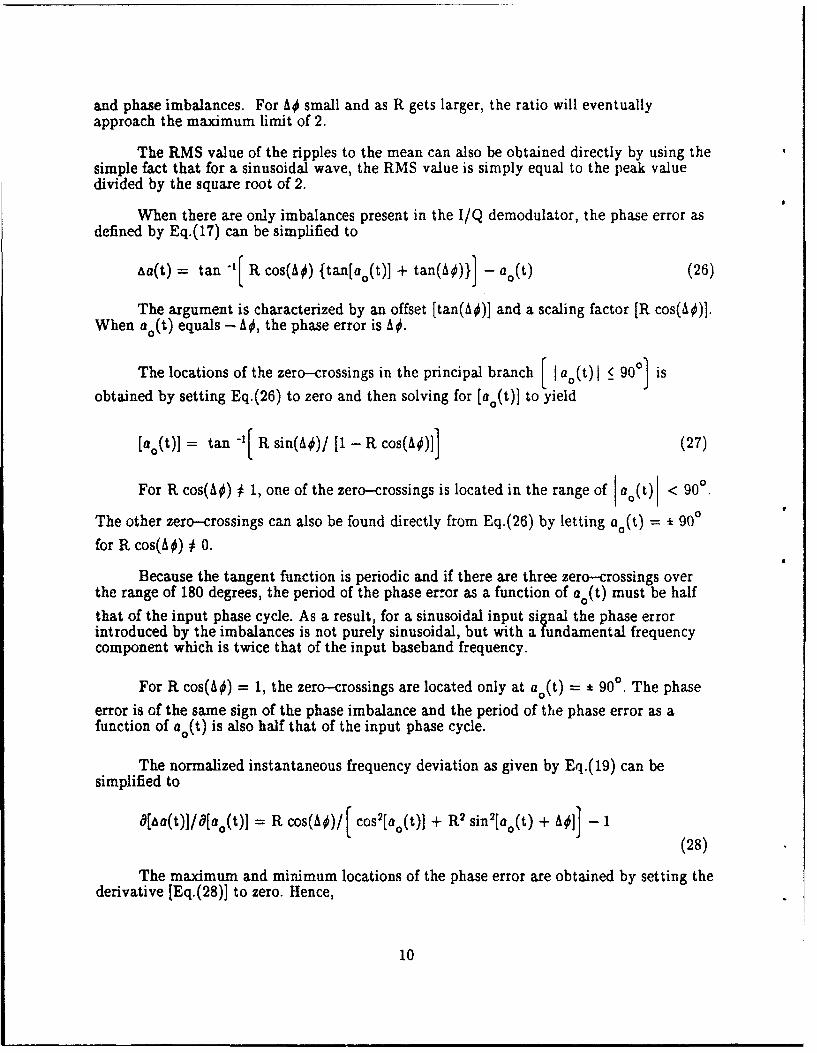
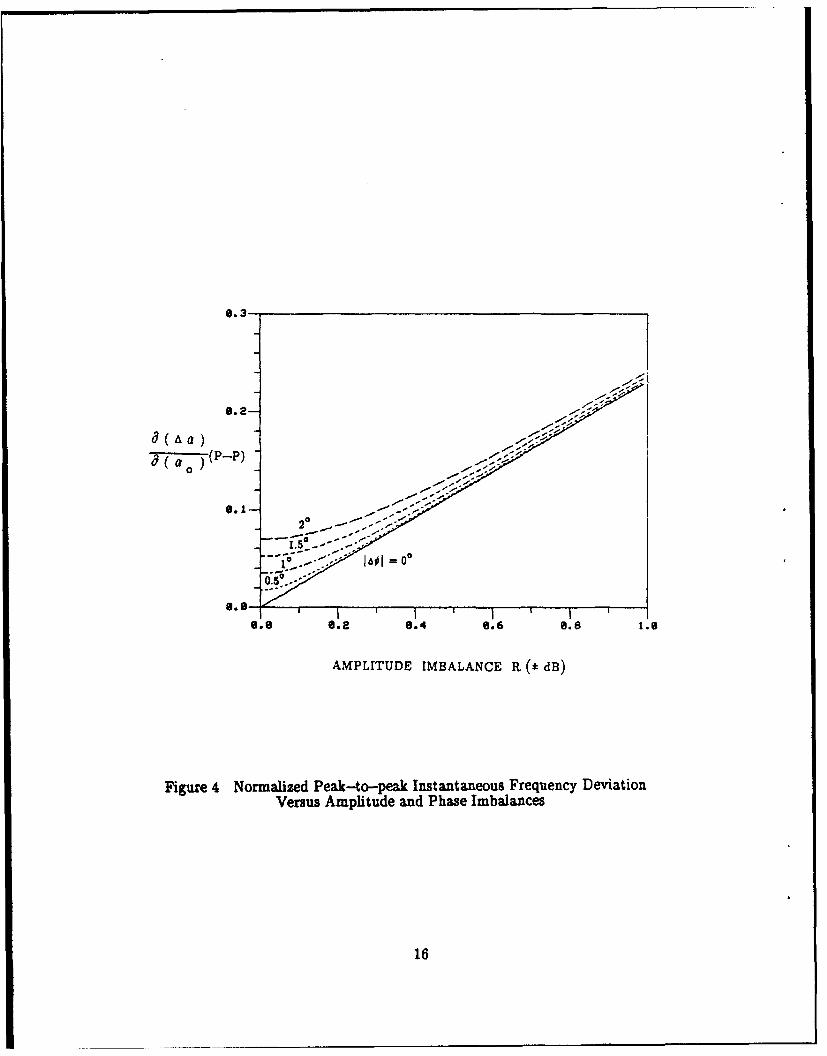
The peak-to-peak normalized instantaneous frequency deviation is plotted in Fig. 4as a function of the imbalances. The ratio of the RMS value to its peak-to--peak value isapproximately equal to 1/(2 /2) when the imbalances are small. However, the normalizedinstantaneous frequency deviation as a function of a0 (t) is not sinusoidal over an inputphase change of 2Y radians, and the positive portion is higher in magnitude than thenegative one. In addition, the mean of the normalized instantaneous frequency deviation isalways equal to zero.
4.1 Amplitude Imbalance Only (A0 = 0)
With amplitude imbalance only, the power of the envelope as given in Eq.(20) can besimplified further to
S 2(t) + S2(t)=- [a(t)K I 2/4 { [1/2 + R /2] + [1/2 - R /2] cos[2 ao(t)]}
(32)
Similar to the general case where there are both amplitu, ! and phase imbalances,there are also DC terms and AC ripple terms which are of twice.. the baseband signal
frequency. The peak-to-peak ripple is simply given by I I - R I. The ratio of thepeak-to-peak ripple to mean of the envelope is then given by
This special case is illustrated in Fig. 2 by the solid curve. For R close to unity, theratio of the peak-to-peak ripple/mean can be shown to be approximately given by 12ARI,where R = 1 + AR. Therefore, when the ratio is plotted as a function of R and expressed indB, it is approximately a straight line with intercept point at the origin as shown. When Ris close to unity, the plot is near the origin along the horizontal axis because R is plotted inlogarithmic scale.
The measured phase error as given by Eq.(26) can be simplified further to
aa(t) = tan -1 1R tanlao(t)I] - 0(t) (34)
Following a similar procedure as given in Section 4.0, the locations of thezero-crossing points are at
15
9.2
6.6 6.2 6.4 0.6 .8. 1.6
AMPLITUDE IMBALANCE R (*dB)
Figure 4 Normalized Peakc-to--peak Instantaneous Frequency DeviationVersus Amplitude and Phase Imbalances
16
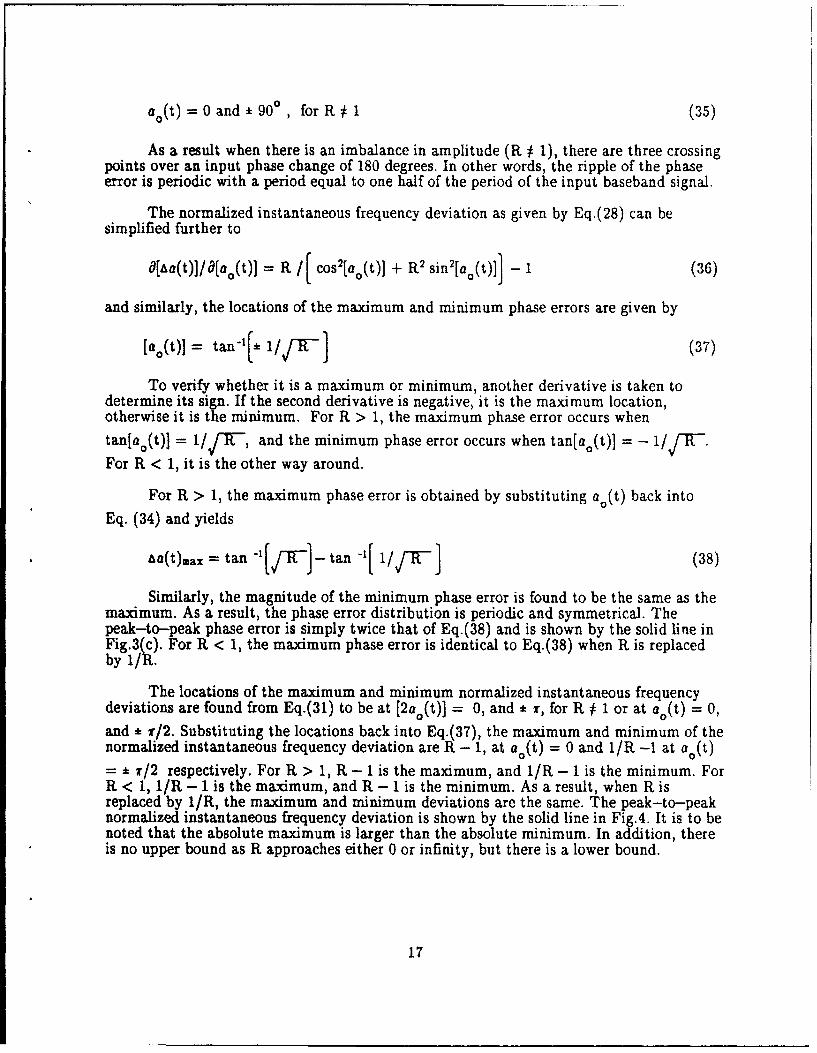
ao(t) 0 and 900, for R #1 (35)
As a result when there is an imbalance in amplitude (R # 1), there are three crossingpoints over an input phase change of 180 degrees. In other words, the ripple of the phaseerror is periodic with a period equal to one half of the period of the input baseband signal.
The normalized instantaneous frequency deviation as given by Eq.(28) can besimplified further to
[ o(t)] = R /[ cos 2[ao(t)] + R2 sinf[ao(t)I] - 1 (36)
and similarly, the locations of the maximum and minimum phase errors are given by
[a.(t)] = tan-'I[k 1/JT- ] (37)
To verify whether it is a maximum or minimum, another derivative is taken todetermine its sign. If the second derivative is negative, it is the maximum location,otherwise it is the minimum. For R > 1, the maximum phase error occurs when
tantao(t)] = 1/)-T-, and the minimum phase error occurs when tan[a0 (t)] = -
For R < 1, it is the other way around.
For R•> 1, the maximum phase error is obtained by substituting a0 (t) back into
Eq. (34) and yields
&a(t)max -=. tan [JFjtan 1[if7 (38)
Similarly, the magnitude of the minimum phase error is found to be the same as themaximum. As a result, the phase error distribution is periodic and symmetrical. Thepeak-to-peak phase error is simply twice that of Eq.(38) and is shown by the solid line inFig.3,(). For R < 1, the maximum phase error is identical to Eq.(38) when R is replacedby 1/1t..
The locations of the maximum and minimum normalized instantaneous frequencydeviations are found from Eq.(31) to be at [2a 0 (t)] = 0, and * r, for R # 1 or at a,(t) = 0,
and * r/2. Substituting the locations back into Eq.(37), the maximum and minimum of thenormalized instantaneous frequency deviation are R - 1, at ao(t) = 0 and 1/R -1 at a0 (t)
= * T/2 respectively. For R > 1, R - 1 is the maximum, and 1/R - 1 is the minimum. ForR < 1, 1/R - 1 is the maximum, and R - 1 is the minimum. As a result, when R isreplaced by 1/R, the maximum and minimum deviations are the same. The peak-to-peaknormalized instantaneous frequency deviation is shown by the solid line in Fig.4. It is to benoted that the absolute maximum is larger than the absolute minimum. In addition, thereis no upper bound as R approaches either 0 or infinity, but there is a lower bound.
17
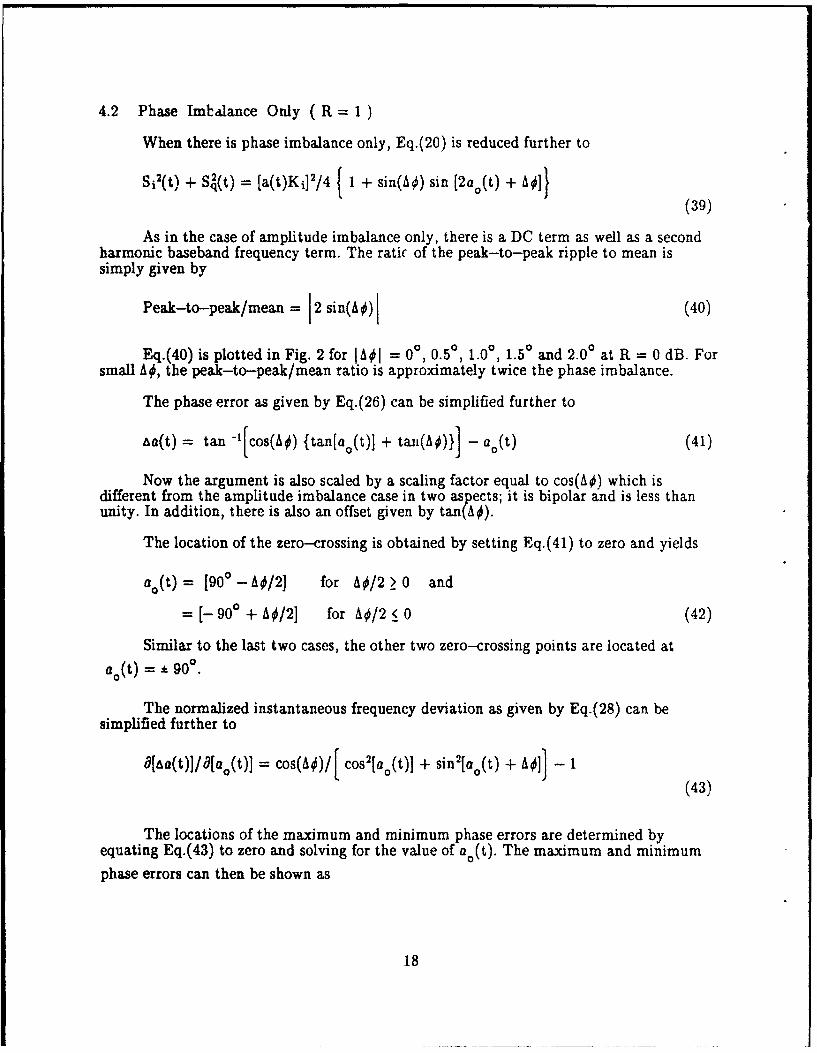
4.2 Phase Imbldance Only ( R = 1 )
When there is phase imbalance only, Eq.(20) is reduced further to
Si 2(t) +- S(t) = [a(t)Ki]2/4 { 1 + sin(Ao) sin [2ao(t) + A4]}(39)
As in the case of amplitude imbalance only, there is a DC term as well as a secondharmonic baseband frequency term. The ratic of the peak-to-peak ripple to mean issimply given by
Peak-to-peak/mean 2 sin(AO) (40)
Eq.(40) is plotted in Fig. 2 for IAOI = 00, 0.50, 1.0', 1.50 and 2.00 at R = 0 dB. Forsmall A0, the peak-to-peak/mean ratio is approximately twice the phase imbalance.
The phase error as given by Eq.(26) can be simplified further to
a(t) = tan -1[cos(AO) {tan[ao(t)] + ta-n(A0)}] - ao(t) (41)
Now the argument is also scaled by a scaling factor equal to cos(Ao) which isdifferent from the amplitude imbalance case in two aspects; it is bipolar and is less thanunity. In addition, there is also an offset given by tan(A&).
The location of the zero-crossing is obtained by setting Eq.(41) to zero and yields
a,(t)= [90 0 -A /2] for AO/2 > 0 and
- [-900 + AO/2] for A /2 < 0 (42)
Similar to the last two cases, the other two zero-crossing points are located at
ao(t) = * 90g.
The normalized instantaneous frequency deviation as given by Eq.(28) can besimplified further to
a[ Aaat)/ dao(t)] = cos(A O)/[ cos 2[ao(t)] + sin 2[ao(t) + A 1]] -1(43)
The locations of the maximum and minimum phase errors are determined byequating Eq.(43) to zero and solving for the value of ao(t). The maximum and minimumphase errors can then be shown as
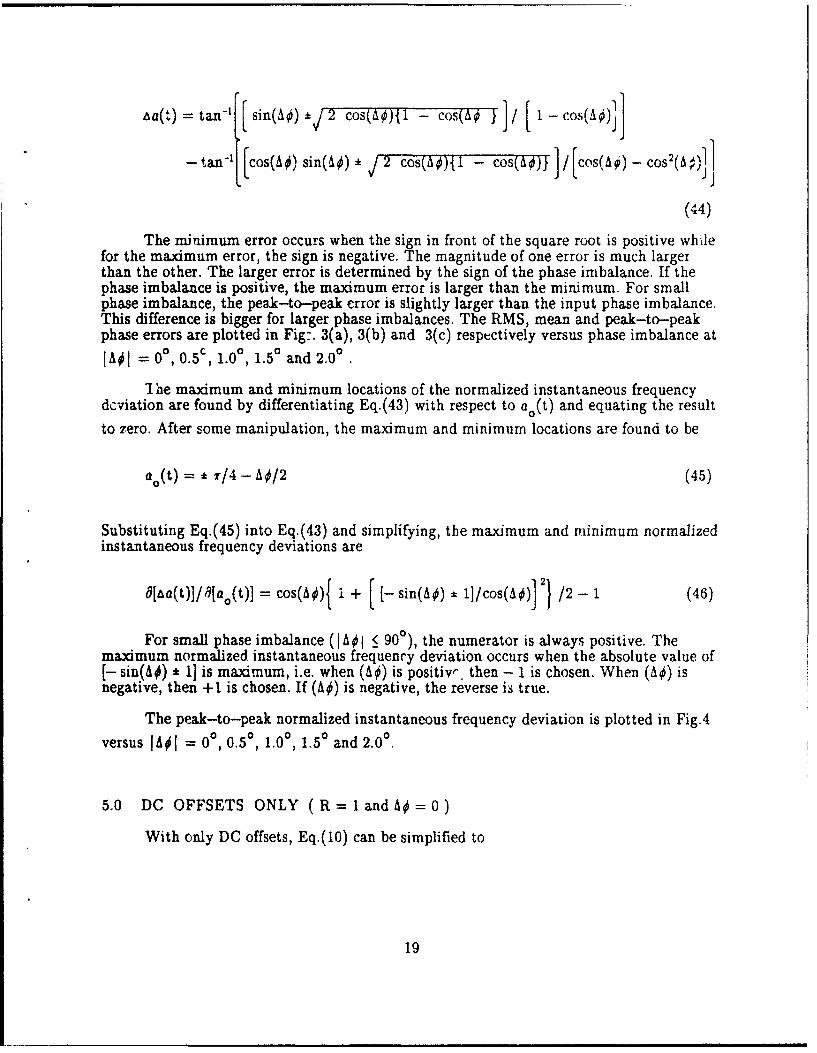
The minimum error occurs when the sign in front of the square root is positive whilefor the maximum error, the sign is negative. The magnitude of one error is much largerthan the other. The larger error is determined by the sign of the phase imbalance. If thephase imbalance is positive, the maximum error is larger than the minimum. For smallphase imbalance, the peak-to-peak error is slightly larger than the input phase imbalance.This difference is bigger for larger phase imbalances. The RMS, mean and peak-to-peakphase errors are plotted in Fig--. 3(a), 3(b) and 3(c) respectively versus phase imbalance at
IA0I = 0', 0.5c, 1.0, 1.50 and 2.00 .
The maximum and minimum locations of the normalized instantaneous frequencydcviation are found by differentiating Eq.(43) with respect to ao(t) and equating the result
to zero. After some manipulation, the maximum and minimum locations are found to be
a(t) = */4 - A¢/2 (45)
Substituting Eq.(45) into Eq.(43) and simplifying, the maximum and minimum normalizedinstantaneous frequency deviations are
8[a(t)]/3[ao(t)]-= cos(AO){ i + sin(A#) * ]/cos(A0)]j2} /2-1 (46)
For small phase imbalance (IA < 90 ), the numerator is always positive. Themaximum normalized instantaneous frequency deviation occurs when the absolute value of[- sin(AO) * 1] is maximum, i.e. when (A) is positiv', then - 1 is chosen. When (A0) isnegative, then +1 is chosen. If (A0) is negative, the reverse is true.
The peak-to-peak normalized instantaneous frequency deviation is plotted in Fig.4
versus IA0= 00, 0.50, 1.00, 1.50 and 2.00.
5.0 DC OFFSETS ONLY (R= 1andA0=0)
With only DC offsets, Eq.(10) can be simplified to
For a CW signal, the terms inside the braces are simply DC terms and fundamentalbaseband frequency terms. The peak or null occurs at
[ao(t)] peak or null = COS-' [ [a2,0 / (a 2io + a2qo)]1/2] (48)
and the peak-to-peak ripple/mean ratio can be shown to be
Peak-to-peak ripple/mean = 4 (a 2 io+ a2qo)/[a(t)Ki/21 2]1
41 + {aio/[a(t)Kg/2]} 2 +f {aqo/la(t)Kij/2]}2
(49).The normalized peak ripple is only a function of the absolute value of the normalized
offsets and is plotted in Fig. 5. For small normalized offsets, the ratio is approximatelyproportional to four times the normalized offsets added on a RMS basis.
From Eqs. (16) and (17), the phase error as a function of DC offsets only issimplified to
cos2[ao(t)] I [aqo/[a(t)Kq/2]] 2+ [aio/[a(t)Ki/2]] 2 } + cos[ao(t)] 2aio/[a(t)Kj/2]
{[aio/[a(t)Ko/2]] 2 + iaqo /[a(t) Kq/2] 2
+ f [ajo/[a(t)KjI2j] 2 + [aqo/[a(t)Kq/21] 2}2 _[aqo,/[a(t)Ki/21]2 = 0
(53)
Now Eq.(53) is in quadratic form and the solution can be obtained readily.One solution will give the location of the minimum while the other will give the maximum.From Eq.(50), if the sign of the DC offset is reversed, the location of a0 (t) = 0 will beshifted by the same amount but on the opposite side. This will only change the relativeposition of the ripples, not its absolute peak amplitude. As a result, the maximum andminimum phase errors are only a function of the magnitude of both the offsets and thusshould be independent of the sign of the offset in each channel.
The zero-crossing point is obtained by equating the phase error of Eq.(50) to zeroand yields
0(t) = tan -[ (aqo/Kq) /(aiolKi)] (54)
There is only one zero-crossing over an input phase change of 180 degrees, and thusthe period of the phase error is the same as the input phase cycle.
The mean of the phase error is found to be zero for a signal with a constant envelopeand over an input phase change of 2r radians. The peak-to-peak phase error as a functionof DC offsets is plotted in Fig. 6. For small DC offsets, the phase error is approximatelysinusoidal in shape and the ratio of the RMS value to its peak-to-peak value isapproximately equal to 1/(23/2). As the DC offsets get bigger, the maximum positive phaseerror is no longer equal to the maximum negative one. However the ratio of the RMS valueto its peak-to-peak value remains approximately equals to 1/(23/2).
The location of the maximum or minimum normalized instantaneous frequencydeviation is determined by taking another derivative of Eq.(50) with respect to the inputphase and equating the result to zero. The solution is found to be the same as given inEq.(54). As a result, the maximum and minimum locations coincide with the zero-crossingpoints. From Eq.(54), we have
22
19-
- -
0.045 _ -" .
0.6 -- - . --- ÷
PHASE ERROR --------------
da(P-P)(Degrees) 4-
2-. ........... aqo/(aKi/2)1 = 0
8.88 0.81 8.82 8.83 0.84 8.95 8.86
DC OFFSET Iaio/(aKi/2) 1
Figure 6 Peak-to-peak Phase Error Versus DC Offsets
The maximum or minimum normalized instantaneous frequency deviation is obtainedby substituting Eqs.(55) and (56) into Eq.(51). The resultant value is found to be only afunction of the square of the DC offsets. Therefore, the maximum and minimum deviationsare only a function of the absolute magnitude of the DC offsets.
The mean of the normalized instantaneous frequency deviation is also fobnd to bezero for a signal with a constant envelope and over an input phase change of 27 radians.The RMS of the normalized instantaneous frequency deviation as a function of DC offsetsis plotted in Fig. 7. For small DC offsets, the normalized instantaneous frequency deviationis also approximately sinusoidal in shape and the ratio of the RMS value to itspeak-to-peak value is approximately equzJ to 1/(23/2). However, the positive and negativehalves are not as symmetrical with respect to the zero axis as for the phase error. Thisnon-symmetry is more pronounced for larger DC offsets.
6.0 AMPTIAtJDE IMBALANCE AND DC OFFSET ONLY
In this special case, we let aqo = 0 and A0 = 0.
With only the amplitude imbalance and in-phase channel DC offset, Eq.(10 ) can besimplified to
+ coS[ao(t)] 2 aio/[a(t)Ki/2] + [1/2 cos [2ao(t)] - R2/2 cos [2ao(t)]
(57)
For an input CW signal, the AC ripple terms consist of the fundamental basebandfrequency as well as its second harmonic terms. By taking the derivative of the AC rippleterms with respect to ao(t) and equating the result to zero, the locations of the maximumand minimum are found to be at
ao(t)peak or null " 0 and -k r (58)or
ao(t) peak or null = cos'[{aio/[a(t)Ki/2]}/(1 - R2)] (59)
By substituting the peak and null locations back into the AC ripple terms, thepeak-to-peak value can be found and thus the peak-to-peak/mean ratio can bedetermined. The AC ripples consist of both the fundamental and second harmonic terms ofthe baseband frequency. As a result, the peak-to-peak and RMS values are no longer
24
6.26-
e(Aa 0.- "_- .o-5.....
_.1 0.046
6.65 0.015
-------- Iaqo/(aKi/2)I = 0
6.68 6.61 0.62 6.63 6.04 0.65 0.86
DC OFFSET laio/(aKi/2)1
Figure 7 Normalized Peak-to-peak Instantaneous FrequencyDeviation Versus DC Offsets
25
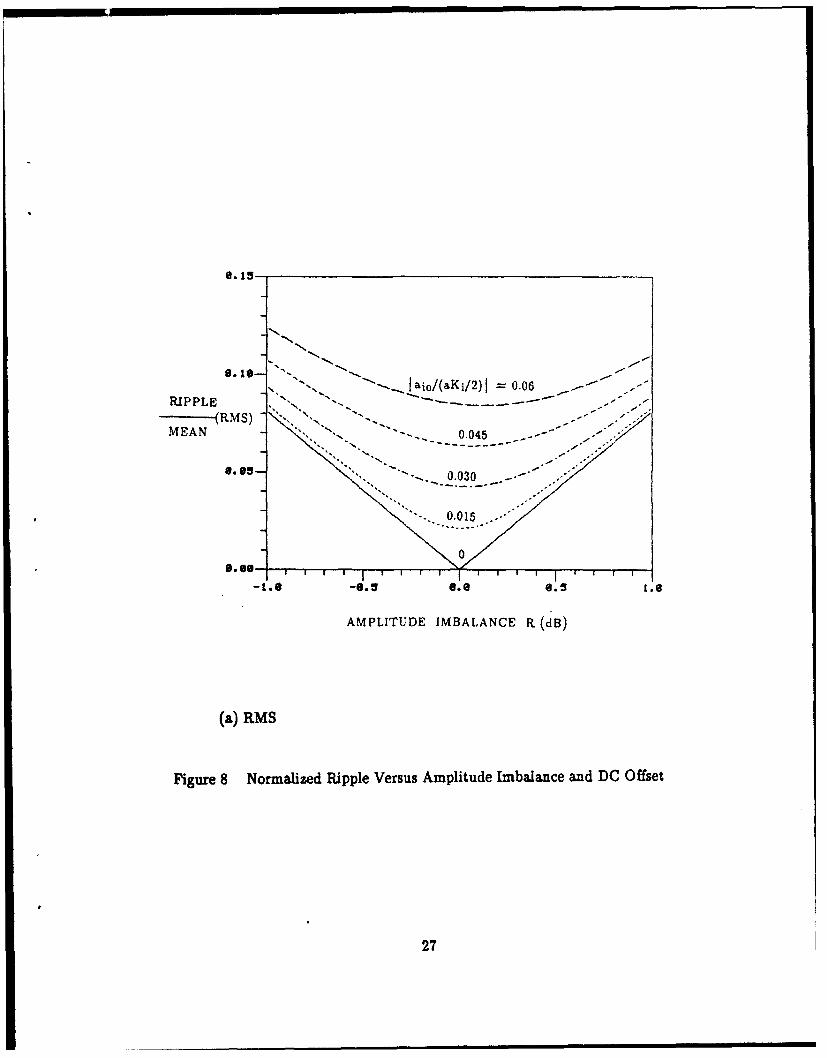
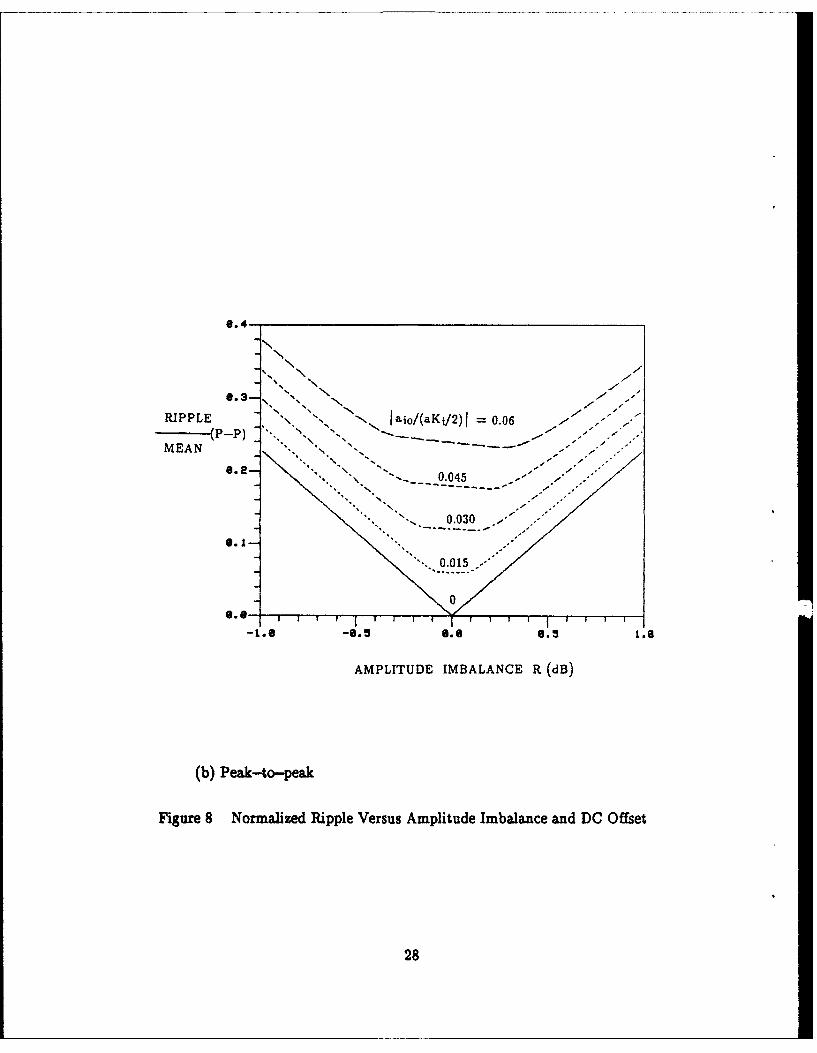
simply related by a constant as in the previous cases. However, the mean value of theripples is zero, and both the RMS and peak-to-peak values of the ripples are functions ofthe absolute value of the offset. The peak-to-peak/mean and RMS/mean values areplotted in Figs. 8(a) and (b) respectively as a function of both offset and amplitudeimbalance.
Using Eq.(17), the phase error is now simplified to
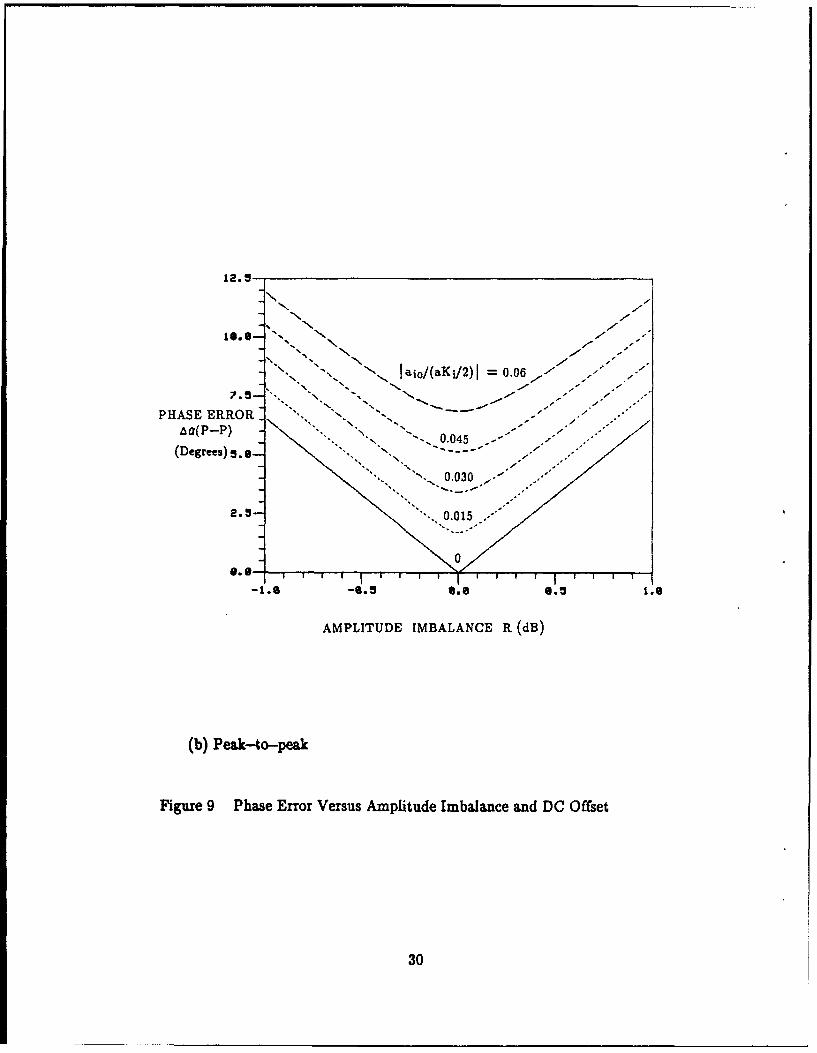
Both the locations of the zero crossing and the maximum and minimum phase errorsare a function of both the amplitude imbalance and the DC offset. If one mismatch is muchgreater than the other, we will have one of the special cases analyzed earlier. As can beseen from Eq.(60) if the sign of the DC offset is reversed, only the relative position of thedistribution will be affected and both the RMS and peak-to-peak phase errors will remainunchanged. The pha3e error is zero at a0 (t) = 0 and is also of odd symmetry with respectto ao(t). The RMS and peak-to-peak of the phase errors as a function of both theamplitude imbalance and DC offset are plotted in Figs. 9(a) and (b) respectively. Asexpected, the ratio of the RMS value to its peak-to-peak value is no longer equal to
1/(23/2) as for a sinusoidal wave.
The normalized instantaneous frequency deviation as given by Eq.(19) can now besimplified to
d[Aa(t)]
Wj7t= R [i1 + cosla,(t)] ajo/[a(t)Ki /21]]B 2 snlt)}-1(1
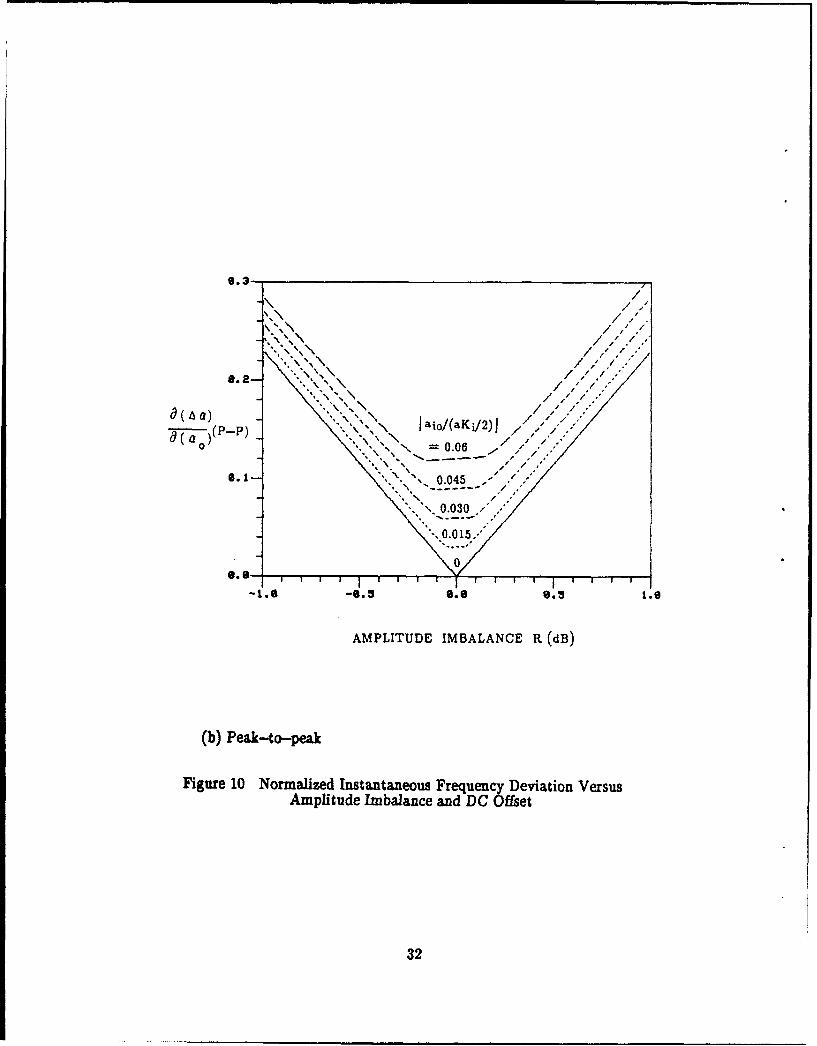
As can be seen from Eq.(61), since the cosine function is periodic, a change in sign of theDC offset will only change the location of the deviation, not its RMS nor peak-to-peakvalues. As a result, both the RMS and peak-to-peak phase errors are only a function ofthe absolute value of the DC offset. The mean value is found to be zero. In addition,because the cosine function is even, the normalized instantaneous frequency deviation issymmetrical with respect to a0 (t) = 0. The RMS and peak-to-peak of the normalizedinstantaneous frequency deviations as a function of both the amplitude imbalance and DCoffset are plotted in Figs. 10(a) and (b) respectively.
7.0 EFFECT OF TIME SAMPLING
So far the analysis has been carried out by assuming both the in-phase andquadrature band-limited signals are processed by a continuous-time processor withunlimited processing bandwidth. However, in practice the input signals are sampled,quantized and processed by a discrete-time processor which has a finite bandwidthdetermined by the Nyquist sampling rate (fs). In a non-ideal I/Q demodulator wherethere are imbalances and DC offsets, frequency components higher than those in the
Figure 8 Normalized Ripple Versus Amplitude Imbalance and DC Offset
27
0.4-
MEAN,
\ " "-._ ~0.045 . " "
\ No
'" "" ~0.030 .,6.3 , N z -
RIPPL N. N ~ Iail~a~i2I0.0.065
-NO-~ e- ~ ~
0
AMPLITUDE IMBALANCE R (dB)
(b) Peak-to-peak
Figure 8 Normalized Ripple Versus Amplitude Imbalance and DC Offset
28
4-
" " N Iaiol(aKi/2) = 0.06 ,
P H A S E E R R O R ' "- - --
Aa(RM S) ", " ..- " -
(Degrees) 2 - '.. "--- 0.045 - .. ,"
"0.030 -
.. 015
0
AMPLITUDE IMBALANCE R (dB)
(a) RMS
Figure 9 Phase Error Versus Amplitude Imbalance and DC Offset
29
12. -
N' -,
NN
N"N i ioj/(aKi/2n =0.06 ,. .
PHASE ERROR " , • , .. ,.•a(P--P) X "\ " "" "/
"0.045.(Degrees) a • g "
., 0.030 ,. .
2.3 K ' 0.015 15
0
AMPLITUDE IMBALANCE R (dB)
(b) Peak-to-peak
Figure 9 Phase Error Versus Amplitude Imbalance and DC Offset
30
S. IS-
SaiI/(aKi/2)1 / =0.06 -
) (R M S) " ' .. .. / ,S -/
N4-•],. 0.045 .- .
Nk - 0 .. 03 . , - "
0.015
0
-I.e -S.! e.g 6.! 1.8
AMPLITUDE IMBALANCE R (dB)
(a) RMS
Figure 10 Normalized Instantaneous Frequency Deviation VersusAmplitude Imbalance and DC Offset
31
6.3
"/2•/)1
0/ '
• \,'
/ ,, 7
.\ ,\
/ , ./ -
.'x'.,\/
/ / /,
"" ,. ~ / ,.," ../
8.23
-
~ / 7," / . 7
o(a )(p~p) \" ',. , , \ I i/ a g ) -
N -.,-,..'.,
/ /, , .,
, 0.030 / ,
,0.015.'"
0.9 06.6-
-t, B - 8. 5 6. 6 6. 5 1. 6
AMPLITUDE IMBALANCE R (dB)
(b) Peak-to-peak
Figure 10 Normalized Instantaneous Frequency Deviation VersusAmplitude Imbalance and DC Offset
32
band-limited baseband signals can be generated. These higher frequency components aregenerated by the non-linear operations of computing the power of the envelope and thephase by taking the sum of the squares of the in-phase and quadrature signals and fromtaking the inverse tangent respectively. As a result, there are differences betw•en the twoprocessors on the demodulated envelope, phase and instantaneous frequency when thesehigher frequency components are greater than the Nyquist sampling rate.
For a discrete-time processor, the analysis is carried out by replacing the continuoustime variable t by its discrete time event tn. If the maximum frequency of the processedsignal is higher than the Nyquist sampling rate, aliasing will occur[1f]. The effect due toaliasing can be simply illustrated by considering the case where the input sigal is a CWsignal and when there are only imbalances in the I/Q demodulator. Eq.(10) shows thatthere will be ripples introduced on the envelope, which are at twice the frequency of thebaseband frequency (f). If 2f is greater than fs, then aliasing will occur in the discrete-timeprocessor and the frequency of the ripples will have a different component which is thealiased one, given by (2f - fQ).
If the instantaneous frequency of the signal, due to imbalances and DC offsets, isgreater than the Nyquist sampling rate, ambiguity can result in the determination of thephase. In other words, the process of phase unwrapping can create errors if the phasedifference between consecutive phase points is greater than 180 degrees. When thishappens, the computed phase can fall in the wrong principal plane and the resultantinstantaneous frequency computed can be seriously affected.
In addition to the ambiguity problem, the instantaneous frequency is also degradedby the problem associated with the approximation used in computing its value. In adiscrete-time processor the instantaneous frequency is approximately given by first takingthe difference between two contiguous phase samples and then dividing the difference bythe sampling interval [Eq.(7)]. This approximation becomes worse as the modulationfrequency increases.
In a discrete-time processor, the normalized difference between the measuredinstantaneous frequency due to imbalances and DC offsets and its input instantaneousfrequency is given by
where the instantaneous frequency deviation has been normalized by the Nyquist samplingfrequency. The effect due to aliasing and approximation is a function of input signalfrequency, imbalances and DC offsets. Using a CW input signal, a few exramples are used to
illustrate this effect. The imbalances and DC offsets used are R = 1.01, &0 = 0.50,ajo/(Ki/2) = 0.01 and aqo/(Ki/2) = 0.006. These are the RMS values taken from acustom-matched I/Q demodulator[6] over an operating instantaneoub bandwidth of 100MHz. The RMS values are small and are obtained after a mean value has been removedfrom each of the mismatch compopents. Different combinations of the four mismatchcomponents are used to i'lustrate four specific cases; namely (i) r'mplitude and phaseimbalance only, (ii) DC offsets only, (iii) amplitude imbalance and DC offset only and(iv) all four mismatches are present. The RMS and peak-to-peak normalized
33
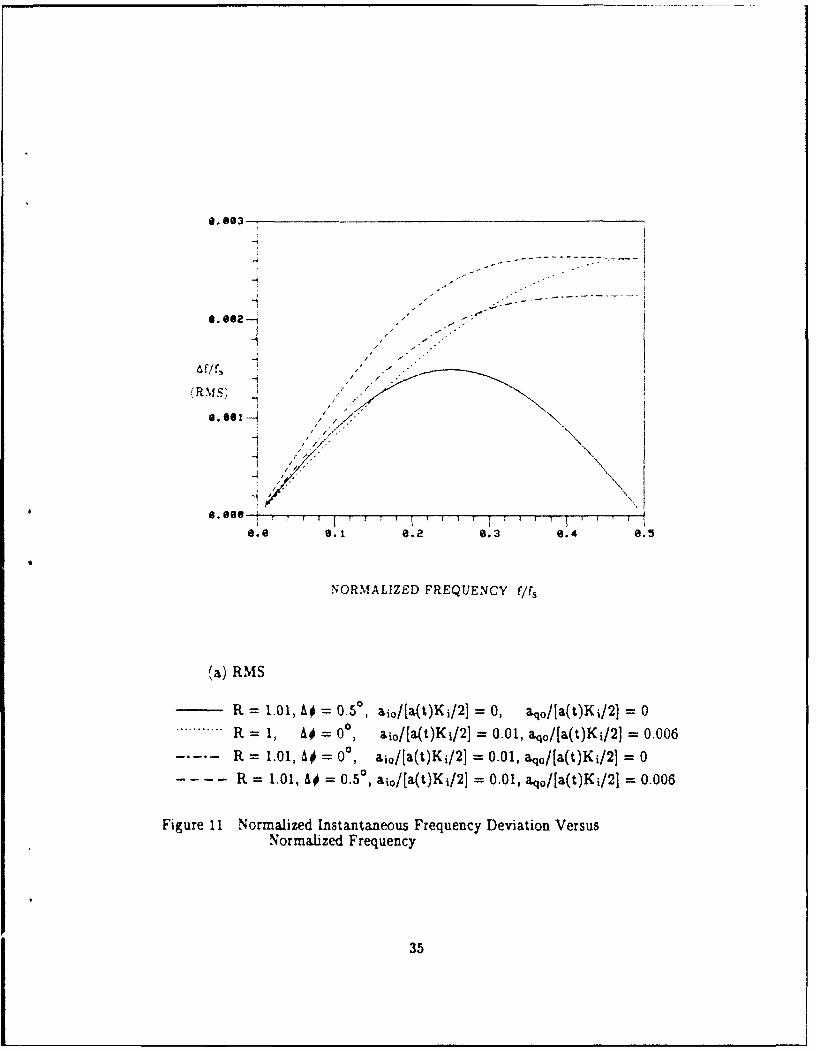
instanteneous frequency deviations as a function of imbalances and DC offsets versusnormalized signal frequency are plotted in Figs. 11 (a) and (b) respectively. For a given setof mismatches, the instantaneous frequency deviation for a continuous-time processorincreases directly proportional to the baseband frequency as given by Eq.(18). However, ascan be seen from Figs. 11 (a) and (b), the instantaneous frequency deviation for adiscrete-time processor is not monotonically increasing with frequency. Depending on therelative values of the imbalances and DC offsets, the instantaneous frequency deviationmay peak before the signal frequency reaches the sampling frequency. In the case wherethere are small amplitude and phase imbalances only, the period of the phase error isessentially half of that of the input phase cycle. As a result, when the baseband frequencyis half that of the sampling frequency, the phase error is approximately the same at everysample point. Therefore the resultant instantaneous frequency deviation as given byEq.(62) will be zero and thus the arproximation used in deriving the instantaneousfrequency actually reduces the effect due to the mismatches. For other combinations ofimbalances and DC offsets, the net effect due to aliasing and approximation is morecomplex and their values as a function of frequency are shown by the other curves in theFigures.
To facilitate the comparison between the continuous-time processor and adiscrete-time processor, Eq.(62) is multiplied by f,/f to yield
where the total instantaneous frequency deviation has been normalized by the inputbaseband carrier frequency (f). With this normalized expression, it can be compareddirectly with the normalized instantaneous frequency deviation [0a(t)/0a0 (t)] for a
continuous-time processor. The normalized RMS instantaneous frequency deviation for thesame sets of imbalances and DC offsets are plotted in Fig. 12. The normalized RMSinstantaneous frequency deviations at f/f, = 0 are identical to those from acontinuous-time processor. The normalized instantaneous frequency deviation decreaseswith input frequency as shown, while for a continuous-time processor it is independent ofinput signal frequency. As a result, the normalized instantaneous frequelcy deviation for adiscrete-time processor is always less than that of a continuous-time processor and thiserror is also decreasing with input frequency.
8.0 REDUCTION OF SYSTEMATIC ERRORS BY LOW-PASS FILTERING
The effects of imbalances and DC offsets on the envelope, phase and instantaneousfrequency have been addressed. For a number of specific cases where two out of fourpossible mismatch components are present, a full characterization has also been given. Inthe general case, when all the mismatch components are present, the analysis can be morecomplicated. However, there are some general conclusions which can be made on thedistortions introduced by the mismatches on input CW signals. For both the envelope interms of peak-to-peak-ripple/mean and the normalized instantaneous frequencydeviation, the mean is always zero over an input phase range of 2T radians. On the otherhand, the mean for the phase error is not zero.
Figure 12 Normalized Instantaneous Frequency DeviationVersus Normalized Frequency
37
For an input signal of constant amplitude, the distortions on the envelope produce aDC (bias) component which is only a function of the DC offsets and amplitude imbalance.In addition, a combination of sinusoidal components can also occur with periods equal toone and one half of the input phase cycle The bias due to DC offsets can also reduce thedynamic range of the demodulator. On the phase error, there are also a bias and ACcomponents with periods equal to one and one half of the input phase cycle. Tfiere are alsoAC components with periods equal to one and one half of the input phase on theinstantaneous frequency deviation, however there is no bias. As the magnitudes of theimbalances and DC offsets increase, the AC components for both the phase error andinstantaneous frequency deviation will depart further from a sinusoidal waveform.
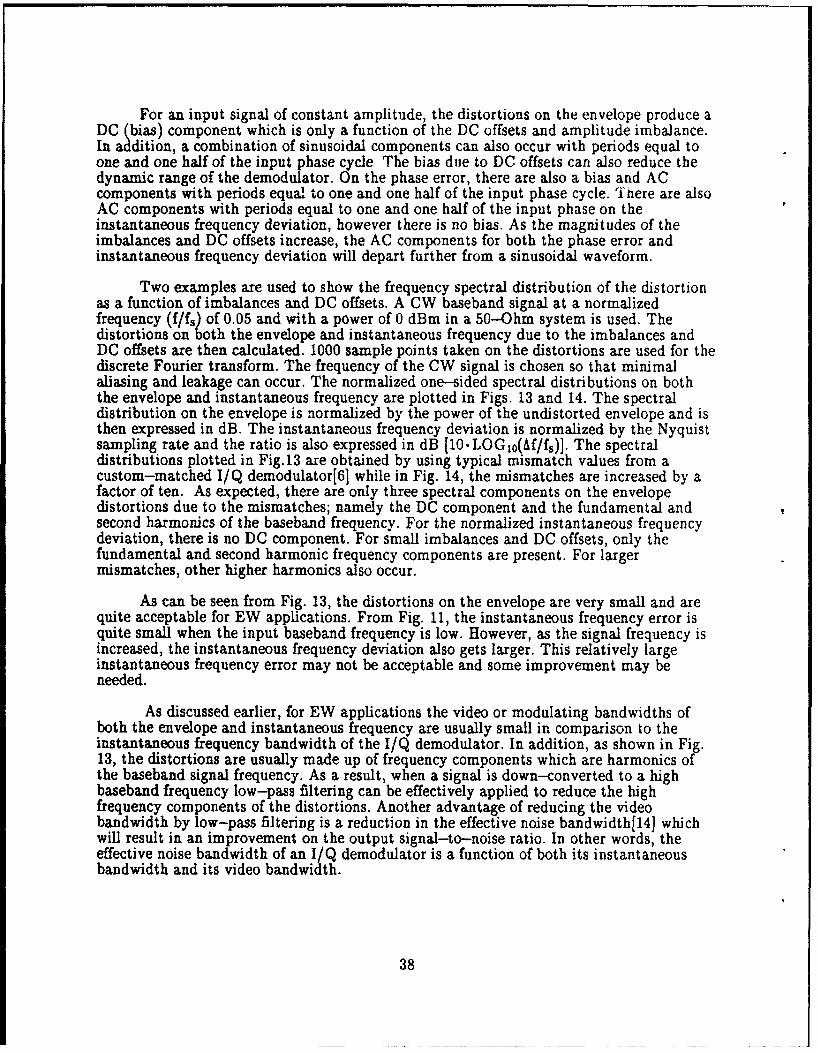
Two examples are used to show the frequency spectral distribution of the distortionas a function of imbalances and DC offsets. A CW baseband signal at a normalizedfrequency (f/f.) of 0.05 and with a power of 0 dBm in a 50-Ohm system is used. Thedistortions on both the envelope and instantaneous frequency due to the imbalances andDC offsets are then calculated. 1000 sample points taken on the distortions are used for thediscrete Fourier transform. The frequency of the CW signal is chosen so that minimalaliasing and leakage can occur. The normalized one-sided spectral distributions on boththe envelope and instantaneous frequency are plotted in Figs. 13 and 14. The spectraldistribution on the envelope is normalized by the power of the undistorted envelope and isthen expressed in dB. The instantaneous frequency deviation is normalized by the Nyquistsampling rate and the ratio is also expressed in dB [10.LOGjo(Af/f5 )]. The spectraldistributions plotted in Fig.13 are obtained by using typical mismatch values from acustom-matched I/Q demodulator[6] while in Fig. 14, the mismatches are increased by afactor of ten. As expected, there are only three spectral components on the envelopedistortions due to the mismatches; namely the DC component and the fundamental andsecond harmonics of the baseband frequency. For the normalized instantaneous frequencydeviation, there is no DC component. For small imbalances and DC offsets, only thefundamental and second harmonic frequency components are present. For largermismatches, other higher harmonics also occur.
As can be seen from Fig. 13, the distortions on the envelope are very small and arequite acceptable for EW applications. From Fig. 11, the instantaneous frequency error isquite small when the input baseband frequency is low. However, as the signal frequency isincreased, the instantaneous frequency deviation also gets larger. This relatively largeinstantaneous frequency error may not be acceptable and some improvement may beneeded.
As discussed earlier, for EW applications the video or modulating bandwidths ofboth the envelope and instantaneous frequency are usually small in comparison to theinstantaneous frequency bandwidth of the I/Q demodulator. In addition, as shown in Fig.13, the distortions are usually made up of frequency components which are harmonics ofthe baseband signal frequency. As a result, when a signal is down-converted to a highbaseband frequency low-pass filtering can be effectively applied to reduce the highfrequency components of the distortions. Another advantage of reducing the videobandwidth by low-pass filtering is a reduction in the effective noise bandwidth[14] whichwill result in an improvement on the output signal-to-noise ratio. In other words, theeffective noise bandwidth of an I/Q demodulator is a function of both its instantaneousbandwidth and its video bandwidth.
Figure 13 Frequency Spectral Distribution of Envelope Distortion andInstantaneous Frequency Deviation (R = 1.01, A0 = 0.5 ,
aio/[a(t)KI/2] = 0.01 and aqo/[a(t)Ki/21 = 0.006)
39
(a) ENVELOPE
- Is
-a.NORMALIZED
POWER -30(dB)
-48
-508 .93 0.1 S.15 G.2 8.25 8.3 8.35 9.4 0.45 0.5
(b) FREQUENCY
-10
NORMALIZEDFREQUENCY-30
(dB) -40
-so-
0 8.85 8.1 8.15 9.2 , .25 9.3 9.35 0.4 9.45 8.5
NORMALIZED FREQUENCY f/fs
Figure 14 Frequency Spectral Distribution of Envelope Distortion andInstantaneous Frequency Deviation ( R 1.10, A0 = 50,aio/[a(t)Ki/21 = 0.1 and aqo/[a(t)Ki/2] = 0.06)
40
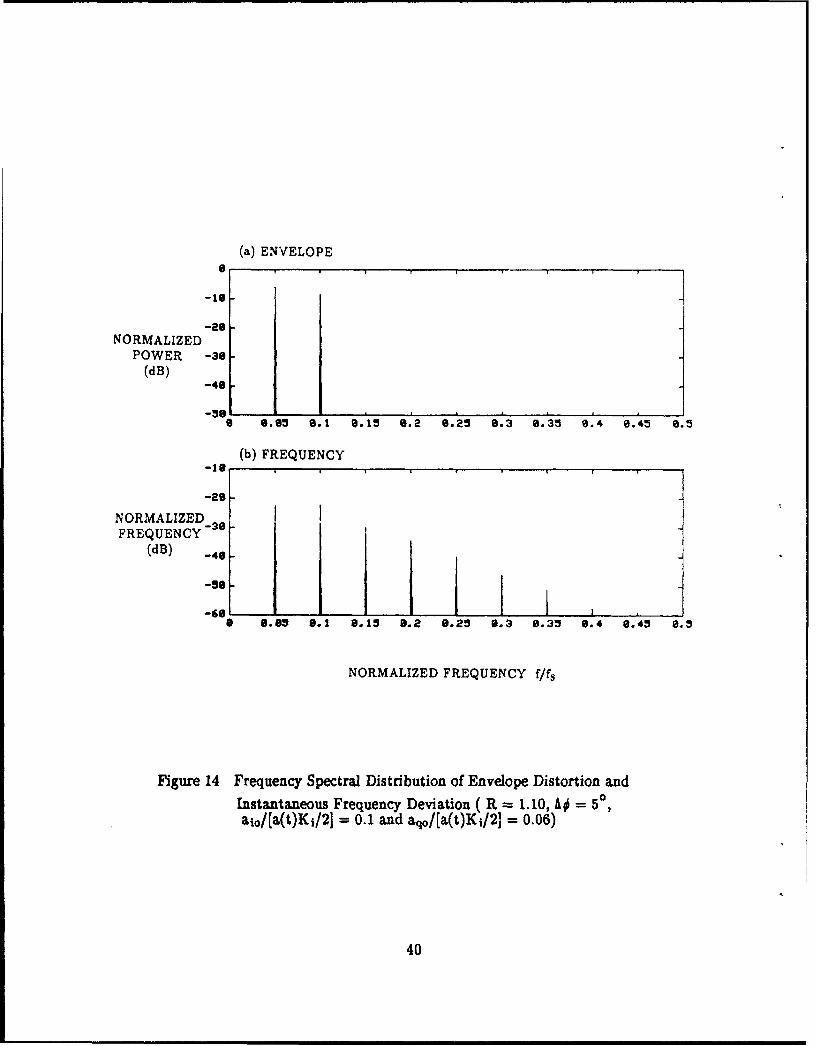
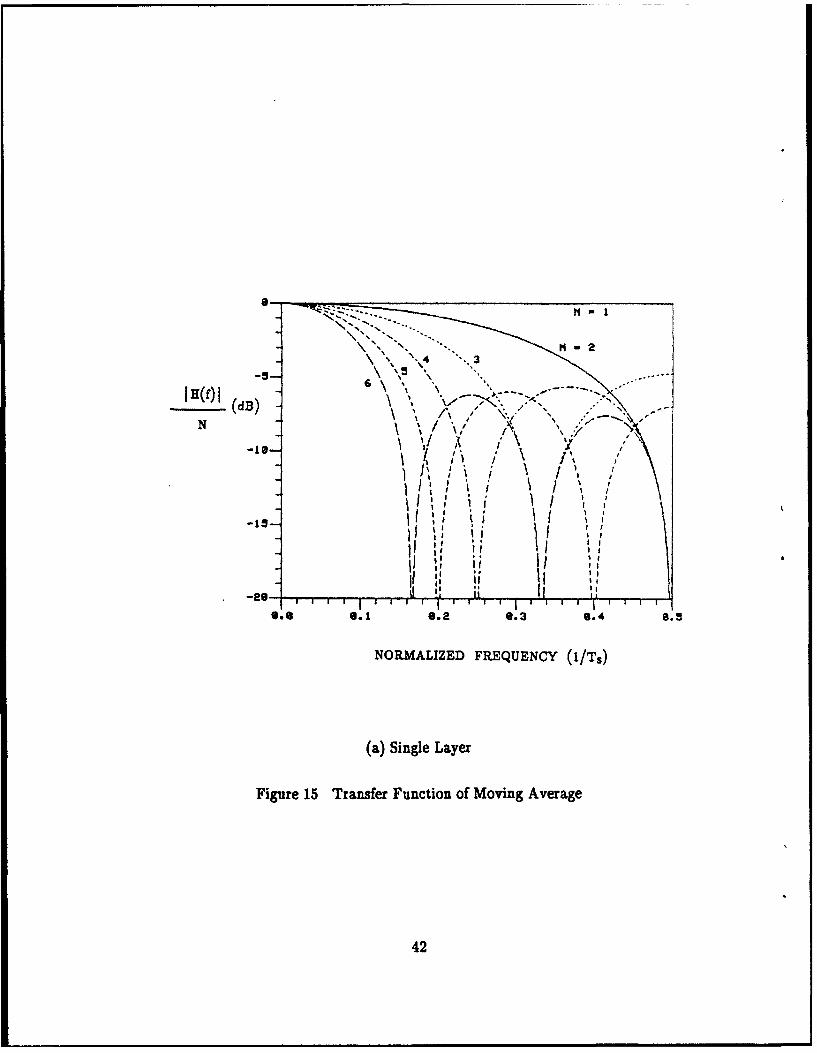
Simple low-pass filtering can be carried out in the time domain by using a movingaverage. It is carried out by adding N contiguous samples and an average is taken on theaccumulated sum. The same operation is repeated on the next N samples. The transferfunction is given by[9]
The absolute value of the transfer function is plotted in Fig.15(a) for various valuesof N. As can be seen from the plot, the operation of moving average on the sampled,processed data has the same effect as low-pass filtering in the frequency domain. Inaddition, the moving average is easy to implement digitally and is of linear phase responsewhich does not introduce distortions such as ringing and overshoot as for some other typesof filters [15]. As given in Fig. 15(a), the sidelobe levels are determined by Eq.(64) as afunction of N. For large N, the first peak sidelobe level is 13.46 dB down and the peaksidelobe level decreases directly proportional to 1/f. If it is desirable to have lower sidelobelevels, a multi-layer moving average can be performed. Fig.15 (b) shows the resultanteffect when two layers are used. In this case the data is filtered by a moving average ofN = 3 and followed by N = 4. Moreover, if more stringent requirement is needed, FIRfilters with generalized linear phase can easily be designed [9]. The tradeoff is the increasedcomplexity in hardware implementation.
Two examples are given to illustrate the effectiveness of low- pass filtering. A linearFM signal centered at a baseband frequency of 25 MHz (f/fs = 0.25) with a total frequencyexcursion of 5 MHz is used. The pulse width is 1 js with rise and fall time constants of0.02 ps. The power of the envelope and instantaneous offset (from the LO frequency)frequency of the signal are plotted in Fig. 16. At the very beginning and end of the pulse,there is an abrupt change in the phase of the signal which shows up as a spike in theinstantaneous frequency. As the instantaneous frequency inside the pulse varies, thefrequency of the ripples will also vary as shown. In the first half of the pulse, the frequencycomponents of the ripples which mainly composed of the first and second harmonics of thebaseband frequency are less than half the Nyquist sampling frequency. In the second half ofthe pulse, the frequency of the -second harmonic exceeds the Nyquist sampling frequencyand as a result, aliasing will occur. Fig. 17 shows the result after two layers of movingaverage are applied. Since the modulating bandwidth of the linear FM signal is much lessthan its baseband carrier frequency, low-pass filtering can be effectively used to attenuatethe ripples with minimal effect on the demodulated envelope and instantaneous frequency.It is noted that both the leading and trailing edges of the pulse are slightly rounded due tolow-pass filtering. In a practical system, adaptive low-pass filtering with different degreesof smoothing can be applied to different parts of the pulse to minimize this type ofdistortion. In this case, if it is desirable to retain the high frequency components of thedemodulated information at both the leading and trailing edges, then no low-pass filteringshould be applied near either the leading or trailing edge.
9.0 SUMMARY AND C'ONCLUSIONS
The effects of imbalances and DC offsets in an I/Q demodulator for thedemodulation of radar signals have been analyzed in this report. Three normalizedparameters, namely the peak-to-peak-ripple to mean, phase error and normalizedinstantaneous frequency deviation have been used to characterize the systematic errors on
41
\ .........
.aI I l-,
-• I\4'.,3• '
NN
VI 1_ _ F_ I I I
9. 6 6. 1 9. a 2 . 3 6. 4 6. 5
NORMALIZED FREQUENCY (1/Ts)
(a) Singe Layer
Figure 15 Transfer Function of Moving Average
42
NN
N 4"
-36- V! I0.6 8.1 0.2 6.3 8.4 8.5
NORMALIZED FREQUENCY (1/Ts)
(b) Two Layers
Figure 15 Transfer Function of Moving Average
43
POllER(dim)
6.0 0.2 0.4 0.6 0.8 1.9 1.2 1.4 1.6
36-
OFFSET
FREQUEMCY 25-
(MHz)
6.6 6.2 0.4 6.6 6.8 1.6 1.2 1.4 1.6
TIME IM NICROSEC
Figure 16 Raw Data of Envelope and Instantaneous Offset Frequency of aLinear FM Signal ( Pulse Width = 1 ps, BasebandFrequency= 25 MHz, af = 5 MHz and T. = 10 ns)
44
2-
POWER(dim)
6.6 0.2 0.4 6.6 0.8 1.8 1.2 1.4 1.6
36-
OFFSETFREQUENCY
(MHz)
6.6 0.2 6.4 6.6 6.8 1.6 1.2 1.4 1.6
TIME IN HICROSEC
Figure 17 Envelope and Instantaneous Offset Frequency of aLinear FM Signal with Low-pass Filtering
(3 and 4-point Moving Averages, Pulse Width = 1 As,Baseband Frequency = 25 MHz, Af = 5 MHz and T. = 10 ns,)
45
the demodulated envelope, phase and instantaneous frequency respectively. Theseparameters are evaluated as a function of imbalances and DC offsets over an input phaserange of 2r radians.
When there are imbalances and DC offsets in the I/Q demodulator, the power of theenvelope is found to be a product of the undistorted envelope term and other terms whichare generated by the imbalances and DC offsets. When the amplitude of the input signal isconstant, distortions in the form of a DC (bias) component is produced on the envelope andthis bias is only a function of DC offsets and amplitude imbalance. In addition, acombination of sinusoidal components with frequencies equal to the fundamental andsecond harmonics of the baseband signal frequency can also occur. The bias due to DCoffsets can also reduce the dynamic range of the demodulator. On the phase error, there arealso a bias and AC components with periods equal to one and one half of the input signalphase. Similarly, there are also AC components on the instantaneous frequency deviation,however, there is no bias. As the magnitudes of the mismatches increase, the ACcomponents for both the phase error and instantaneous frequency deviation will departfurther from a purely sinusoidal waveform.
In a discrete-time processor, the input signals are sampled, quantized and processedwith a finite bandwidth which is limited by the Nyquist sampling rate. In a non-ideal I/Qdemodulator where there are imbalances and DC offsets, frequency components higher thanthe Nyquist sampling rate can be generated by the non-linear operations of computing thepower of the envelope and its phase. As a result, aliasing can occur and large errors canalso result in the determination of the phase. Another factor which can affect theinstantaneous frequency measurement is the approximation used by taking the differencebetween two contiguous phase samples and then dividing the difference by the samplinginterval. The effect due to aliasing and approximation is a function of input signalfrequency, imbalances and DC offsets. For a given set of imbalances and DC offsets, theinstantaneous frequency deviation for a continuous-time processor increases directlyproportional to the baseband frequency. However, the instantaneous frequency deviationfor a discrete-time processor is not monotonically increasing with frequency. Depending onthe relative values of the imbalances and DC offsets, the instantaneous frequency deviationmay peak before the frequency reaches the sampling frequency. As a result, theinstantaneous frequency deviation in a discrete-time processor is always less than that of acontinuous-time processor.
In EW applications, the video or modulation bandwidth of the signal is usually smallin comparison to the instantaneous frequency bandwidth of the I/Q demodulator. As aresult, when the signal is down-converted to a baseband frequency which is larger than themodulation bandwidth, the frequency components of the distortions can be reduced bylow-pass filtering. The technique of using a moving average has been shown to be effectiveto attenuate the ripples caused by the mismatches and with minimal effect on both thedemodulated envelope and instantaneous frequency.
[2] Wiley, R.G. Electronic Intelligence: The Interception of Radar Signals.Norwood, MA: Artech House, 1985.
[3] Sharpin, D.L., Tsui, J.&.Y., and Hedge, J. The Effects of QuadratureSampling Imbalances on a Phase Difference Analysis Technique.Proceedings of the IEEE, National Aerospace and Electronics Conference,NAECON 1990, Vols. 1-3; 962-968, New York.
[4] Goldman, S.J. Understanding the limits of quadrature detection.Microwave & RF, 67-70, Dec, 1986.
[5] Roome, S.J. Analysis of quadrature detectois using complex envelopenotation. In IEE proceedings, Vol. 136, Pt. F, No.2, April 1989.
[6] Lee, J.P.Y. I/Q demodulation of radar signals with calibration and filteringDREO report 1119, Defence Research Establishment Ottawa, Department ofNational Defence, Canada.
[7] Anaren Microwave Inc. Catalog No. 17A
[8] Churchill, F.E., Ogar, G.W. and Thompson, B.J. The correction of I and Qerrors in a coherent processor. IEEE Trans. Aerospace andelectronic systems. Vol. AES-17, No.1, Jan, 1981.
[9] Oppenheim, A.V. and Schafer, R.W. Discrete-time Signal Processing.
[10] Rice, D.W. and Wu, K.H. Quadrature Sampling with High Dynamic Range.IEEE Trans. AES, Vol. 18, No.4, 736-739, Nov,1982
[11] Radar, C.R. A Simple Method for Sampling In-phase and Quadrature Components.IEEE Trans. AES, Vol. 20, No.6, 821-824, Nov, 1984.
[121 Bortot, P. Complex Demodulation Using a Digital Technique. Technical Report,Interactive Circuits and Systems L,1 Ottawa, Canada, Dec, 19L6
[13] Brigham, E. Oran. The Fast Fourier Transform. Englewood Cliffs,New Jersey: Prentice-Hall, 1974.
[14] Lucas, W.J. Tangential sensitivity of a detector video system withR.F. pre-amplification. In Proc. IEE, Vol. 113, No.8, 1321-1330,August 1966.
[15] Johnson, D. E. Introduction to Filter Theory.Englewood Cliffs, New Jersey: Prentice-Hall, 1976.
47
UNCLASSIFIEDSECURITY CLASSIFICATION OF rORM
(highest classif cation of Title. Abstract, Keywords)
DOCUMENT CONTROL DATAISOCtyltv Classification of title, body of abstract and indexing annotation must be entered wnlen the overaeil document 's t2ass1 e•id)
ORIGINATOR (the name and address of the organization preparing the document 2. SECURITY CLASSIFICATIL JOrganizations for whom the document was prepared. e.g. Establishment sponsoring (overall security classification of the documenta contractors report. or tasking agency, wre entered in section 8.) including special warning terms f agclicaotle)
DEFENCE RESEARCH ESTABLISHMENT OTTAWANATIONAL DEFENCE UNCLASSIFIED
SHIRLEY BAY, OTTAWA, ONTARIO KIA 0K2 CANADA
3. TITLE (the complete document title as indicated on the title page. Its classification should be indicated by the aporopriateabbreviation (S.C or U) in parentheses after the title.)
EFFECTS OF IMBALANCES AND DC OFFSETS ON I/Q DEMODULATION (U)
4. AUJTHORS (Last name, first name, middle Initial)
LEE, JIM P.
5. DATE OF PUBLICATION (month and year of publication of 6a. NO. OF PAGES (total 6b. NO. OF REFS (total Cited tndocument) containing information. Include document)
Annexes, Appendices, etc.)
DECEMBER 1992 47 157 DESCRIPTIVE NOTES (the category of the document, e.g. technical report, technical note or memorandum. if appropriate, enter tte type ot
report. e.g. interim, progress. summarry, annual or final. Give the inclusive dates when a specific reporting period is covered.)
DREO REPORT
8. SPONSORING ACTIVITY (the liame of the department project office or laboratory sponsoring the research and development include theaddress.)
DEFENCE RESEARCH ESTABLISHMENT OTTAWANATIONAL DEFENCESHIRLEY BAY, OTTAWA, ONTARIO KIA 0K2 CANADA
9a. PROJECT OR GRANT NO. (if sopropriate, the applicable research 9b. CONTRACT NO. (if appropriate, the applicable number underand development Project or grant number under which the document which the document was written)was written. Please specify whether project or grant)
011LBII10a ORIGINATOR'S DOCUMENT NUMBER Wthoe official document 10b. OTHER DOCUMENT NOS. (Any other numbers whicr, may
number by which the document is identified by the originating be assigned this document either by the originator or by theactivity. This number must be unique to this document) sponsor)
DREO REPORT 1148
11. DOCUMENT AVAILABILITY (any limitations on further dissemination of the document, other than those imposed by security classification)
ID Unlimited distrib•tion
I Distribution limited to defence departments and defence contractors; further distribution only as approvedI Distribution limited to defence departments and Canadian defence contractors; further distribution only as approved
Distribution limited to government departments and agencies, further distribution only as approved
I Distribution limited to defence departments; furtier distribution only as anproved
I Other (please specify):
12. DOCUMENT ANNOUNCEMENT (any limitation to the bibliographic announcement of this document. This will normally correspond tothe Document Avatlabilty (11). However. where further distribution (beyond the &dience specified in 11) is possible, a widerannouncement audience may be selected.)
UNLIMITED
UNCLASSIFIED
SECURITY CLASSIFICATION OF FORM
DCO03 2/06187
-SO- UNCLASSIFIED"SCUKITY CLASSIFICATION OF FONUM
13 A~tRCT 4a b~f u l~iaIsiaviwyof u doumet. 11 may also "POWa elsewhere in the body of lbe document 113elf. 11 is highlydlw~e W law th strct a' c'assified dacw"S"ant beImCIASSIfied. Each paagraph of the ubtract shall bein wit a ofictio of thUK"lt' 603f"W~ai of the oliarotion in the paragraph htules% the document itself is unclassified) repr~esentend ass ISP. 1CC1i. or (UP.1)"f is 0at RMcSsar N ateiwd here sabcts in both of fical languages unless the text is bilingual).(U) The effects of imbalances and DC offsets, in an IIQ demodulator, on thedemodulation of radar signals are addressed in this report. Three normalizedparameters, namely the peak-to-peak-ripple to mean, phase error and normalizedinstantaneous frequency deviation are used to characterize distortions intradueed onthe envelope, phase and instantaneous frequency respectively. The effect on thedistortions, due to aliasing and approximation use in deriving the instantaneousfrequency in a discrete-time processor. is also analyzed.
(U) 'When there are imbalances and DC offsets, a bias is produced on both thedemodulated envelope and phase. AC ripples with frequency components which aremultiples of the baseband-frequency are also generated on all of the threedemodulated signal waveforms. In EW applications, the instantaneous bandwidth ofthe IIQ demodulator is usually much wider than the demodulated signal bandwidth. Asa result, when the baseband frequency of the signal is high and comparable to itsmodulation bandwidth, the higher frequency components of the distortion can beeffectively reduced by low-pass filtering.
IC KEYWOADS. OESCRIPTOAS or IDENTIFIERS iteChniacity meaningful tems or short phrases that characterize a document and could beP4*efu in cataepan the dacurnefit They shoul~d be selected so that no security classification is reqtuired. Identifiers, such as equipmentMe",l aeigrusbon. trade nam~e. mWilitary project coda no"t. geographic location may also be Included. If possible keywords should be selectedfrom a pubi*shed VesWWas. Lg. Thesaurus of Engineering and Scientilic Terms (TIEST) and tha thesaurus-identified. if it is not possible to$*NMIeft adag toom. which wre Unclassiftied, the classification of tech should be indicated as with the title.)
tfQ DEMODULATIONRADAR £514DIGITAL RECEIVERRADAR SIGNAL PARAMETER MEASUREMENT