1 ADDITIONAL INFORMATION TO EAC INDUSTRY-2 (MoEFCC) RAMAGUNDAM FERTLIZER PROJECT Query 1: Total plot area of the project site. Layout map indicating existing greenbelt and proposed greenbelt with different colour and details (ha/m 2 ). The total plot area of the Project is 155.1 Hectares (including 140 Hectares within existing boundary wall). The existing greenbelt is 2.5 Hectares which is present between the boundary wall and peripheral road of the fertilizer complex. In the proposed project, structured greenbelt of 46 Hectares shall be developed in a phase wise manner. The greenbelt showing the existing and the proposed greenbelt overlaid on layout plan is attached. Query 2: Number of existing trees to be cut. The site is fully covered with tall grass and unwanted scrubs. Obnoxious weeds have also infested the total area. The same will be cleared for setting up the new plant. Some of the site photographs showing existing scrub vegetation are provided below.
Transcript
1
ADDITIONAL INFORMATION TO EAC INDUSTRY-2 (MoEFCC) RAMAGUNDAM FERTLIZER PROJECT
Query 1: Total plot area of the project site. Layout map indicating existing greenbelt and
proposed greenbelt with different colour and details (ha/m2).
The total plot area of the Project is 155.1 Hectares (including 140 Hectares within existing boundary wall). The existing greenbelt is 2.5 Hectares which is present between the boundary wall and peripheral road of the fertilizer complex. In the proposed project, structured greenbelt of 46 Hectares shall be developed in a phase wise manner. The greenbelt showing the existing and the proposed greenbelt overlaid on layout plan is attached.
Query 2: Number of existing trees to be cut. The site is fully covered with tall grass and unwanted scrubs. Obnoxious weeds
have also infested the total area. The same will be cleared for setting up the new plant. Some of the site photographs showing existing scrub vegetation are provided below.
2
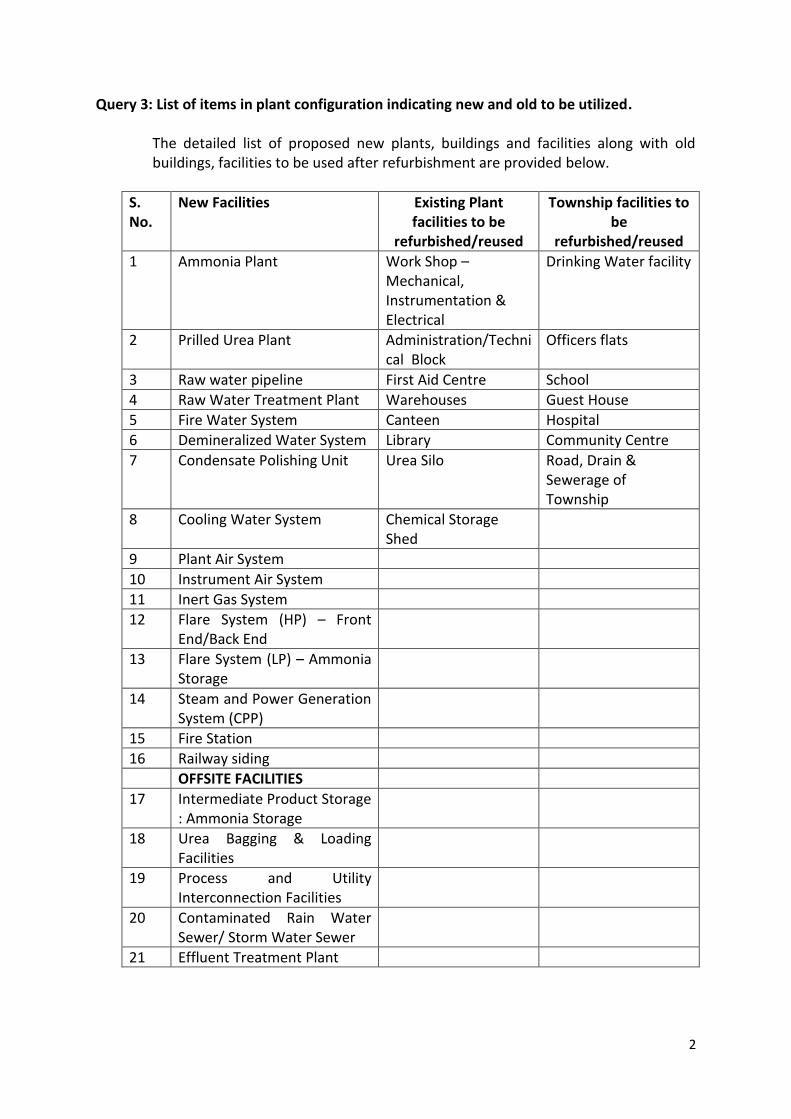
Query 3: List of items in plant configuration indicating new and old to be utilized.
The detailed list of proposed new plants, buildings and facilities along with old buildings, facilities to be used after refurbishment are provided below.
S. No.
New Facilities Existing Plant facilities to be
refurbished/reused
Township facilities to be
refurbished/reused
1 Ammonia Plant Work Shop – Mechanical, Instrumentation & Electrical
4 Raw Water Treatment Plant Warehouses Guest House
5 Fire Water System Canteen Hospital
6 Demineralized Water System Library Community Centre
7 Condensate Polishing Unit Urea Silo Road, Drain & Sewerage of Township
8 Cooling Water System Chemical Storage Shed
9 Plant Air System
10 Instrument Air System
11 Inert Gas System
12 Flare System (HP) – Front End/Back End
13 Flare System (LP) – Ammonia Storage
14 Steam and Power Generation System (CPP)
15 Fire Station
16 Railway siding
OFFSITE FACILITIES
17 Intermediate Product Storage : Ammonia Storage
18 Urea Bagging & Loading Facilities
19 Process and Utility Interconnection Facilities
20 Contaminated Rain Water Sewer/ Storm Water Sewer
21 Effluent Treatment Plant
3
Query 4: Proper justification for presence of Benzene and Ammonia in the baseline data of AAQM. If required, it should be reanalyzed.
Benzene
Benzene is detected only in two stations (Kazipalli & Godavarikhani) out of 8 monitoring stations. The 98th percentile value of Benzene at Kazipalli and Godavari
Khani is 1.5 & 2.5 g/m3 respectively. These two stations are located near to NTPC Thermal Power Station, opencast mining areas and State Highway-1. The possible sources of benzene in ambient air as reported in the baseline data of EIA study are indicated below.
Combustion of fuel (automotive fuel, wood and stationary fossil fuel, other aromatics)
Heavy vehicular movement for transportation of coal from the mine areas.
Stack emissions from nearby industries
Localized forest fires in surrounding areas. Ammonia Out of 8 air quality monitoring stations, Ammonia is reported in 5 stations. The 98th Percentile value of ammonia is ranging from 12.9 to 19.4 µg/m3. However the limit for ammonia concentration in air is 400 µg/m3 as per NAAQS Standards, 2009. The possible sources of ammonia as detected in the baseline data are given below.
Farms/agricultural activities: NH3 is emitted by fertilizer application in agricultural activities in the nearby areas.
Putrefaction of animal and vegetable matter.
Animal husbandry & Livestock waste management
Municipal solid waste dumping yards
Cement Industry (pyro-processing units)
The Ground Level Concentration for emission of Ammonia is predicted using ISCST-3 model. The stack emission from Prilling tower is mentioned below.
S. No.
Stack Source
Physical Height of Stack from Ground Level (m)
Stack Tip Dia. (m)
Exit Velocity (m/s)
Exit Temp. (K)
Pollutant emission rate, (g/s)
NH3
1. Prilling Tower Vent
130 28 0.67 343.15 50
The predicted 24 hourly average maximum concentration for NH3 is 24.4 g/m3. This maximum concentration will occur 4.5 km from the fertilizer complex. By superimposing the same on the maximum background NH3 level observed i.e. 19.4
g/m3, the total concentration in worst case scenario is not expected to be more
than 43.8 g/m3 which is well within the standard limits for 24 hourly average for
4
industrial/ residential areas i.e. 400 g/m3. The isopleth for NH3 (24 hour maximum) is attached.
Query 5: Reduce wastewater generation by adopting 3 R’s (Reduce, Recycle, Reuse) concept. Plan and efforts made in this regard to be provided.
Efforts have been made in the plant design for reducing the waste water generation from the units. Process condensate from both the Ammonia and Urea Plant shall be treated in the respective units and condensate polishing unit to recycle the water. Treated effluent water from RFCL plant shall be used for greenbelt development in the Plant as well in the township. Further, the treated effluent shall also be used for fire water makeup, flushing of toilets in RFCL plant and RFCL Township. Treated Sanitary effluent shall also be used for greenbelt development in the complex.
Query 6: Explore the possibilities for not discharging the treated effluent into the river. A plan accordingly to be prepared with respect to field condition. In case no option is available, then water modelling study using different season hydraulic data, considering various scenarios, to be carried out.
The treated effluent from the plant shall be used in the complex for greenbelt development, fire water makeup and toilet flushing as indicated in Query no. 5. Balance treated effluent shall be discharged to Godavari River via Nallah. As advised by the EAC, additional water samples have been collected both at the River Bank as well as from the middle of the river. Also, samples were collected at varying distances (100 meters, 500 meters and 2000 meters) to analyse the impact of discharge on the river water quality. The TDS of 774 ppm was reported in the water sample at SW-3 (location in close proximity to the Nallah discharge point in the river). This was significantly higher than the Raw water TDS of 411 as reported in Godavari River upstream of the Nallah Discharge Point. The higher TDS in SW-3 is attributable to
Higher TDS (988 ppm) of the Effluent coming from the Nallah which is a common discharge point of the effluent from other industries and municipal effluent.
The Sampling point was located very close to the discharge point (Approximately 100 meters downstream of the Point at the river bank where Nallah discharges into the river).
The sample was taken from the river bank.
5
The summary of the Data collected along with projected TDS in river water for the Post RFCL Project Scenario is given below.
River Water Quality - Pre-Project Scenario
Location
Average Flow (m3/hr)
Average TDS (ppm)
Mar-May 2014
Jun 2015
March-May 2014
Jun 2015
Godavari River : Upstream of Nallah 45343 67744 411 230@
Nallah
1846
988
Godavari River Bank : 100 meters Downstream of Nallah Junction
774 660
Godavari River Middle : 100 meters Downstream of Nallah Junction
438
Godavari River Bank: 500 meters Downstream of Nallah Junction
315
Godavari River Middle: 500 meters Downstream of Nallah Junction
261
Godavari River Bank: 2000 meters Downstream of Nallah Junction
252
Godavari River Middle : 2000 meters Downstream of Nallah Junction
250
River Water Quality - Post RFCL Project Scenario
Proposed Discharge from RFCL complex 250 250 2100 2100
Combined Discharge of RFCL & Nallah 2096 2096 1120 1120
Godavari River Middle : 2000 meters Downstream of Nallah Junction
47439 69840 432 257
@The lower TDS value in the water as reported in the month of June may be attributable to surface water runoff from the surrounding areas.
Based on the above the following points are submitted for EAC’s perusal
Significant increase in river water TDS was recorded within 100 meters downstream of the Disposal point of the Nallah which was high due to the influent TDS in the Nallah.
No Significant increase in the river water TDS was recorded at 500 meters downstream of the Disposal point of the Nallah. The Increase in TDS was limited to 31 ppm only at middle of the river
Insignificant increase in the river water TDS was recorded at 2000 meters downstream of the Disposal point of the Nallah. The Increase in TDS was limited to 20 ppm only at middle of the river
The TDS values in river water 2000 meters downstream of the Disposal point of the Nallah was projected for the post RFCL project scenario. A further
6
increase of 7 ppm in the river water TDS is estimated because of additional RFCL effluent disposal to river through the Nallah. Hence, practically no impact on the river water TDS is expected post RFCL Project.
The Maximum Discharge from the RFCL complex to Godavari River through the Nallah shall be restricted within 250 m3/hr @ a Maximum TDS of 2100 ppm.
Query 7: Adequate funds (at least 2.5% of the project cost) shall be earmarked towards
the Enterprise Social Commitment based on Public Hearing issues and item-wise details along with time bound action plan shall be included. Socio-economic development activities need to be elaborated upon.
Based on CSR Guidelines of Company Act, RFCL shall spend 2% of the average of three years profit during production phase, per year, on Corporate Social Responsibility (CSR) activities. The CSR projects shall be taken up in consultation with the district authorities. Further, during the construction phase, although there is no revenue earned by RFCL, we shall still spend Rs. 25 Lakhs per year on CSR activities, in consultation with the district authorities. It is submitted that above CSR expenditure i.e. Rs. 25 Lakhs per year in construction stage and 2% of three year average profits post commercial production as per Company Act 2013 may be considered for meeting the requirement of 2.5% of capital cost.
Additional Clarification Vacuum vent scrubber shall be provided in Vacuum Concentration Section of the Urea Plant and not in the Prilling Tower as indicated in EAC Minutes of Meeting.