Page 1
Brodogradnja/Shipbuilding/Open access Volume 72 Number 2, 2021
19
Suwasono, B*
Putra, IKAS
Kristiyono, TA
Azhar, A
http://dx.doi.org/10.21278/brod72202 ISSN 0007-215X
eISSN 1845-5859
ADHESIVE COATING VALUE BASED ON THE MAIN INGREDIENT
OF SHIP PAINT
UDC 620.197.6:621.78.019.84:539.61
Professional paper
Summary
Coatings are important instruments in inhibiting the corrosion rate. Field facts in various
Indonesian shipping industries show that the choice of organic materials as coating for ship
paint uses epoxy, vinyl and polyurethane. Therefore an experimental study is needed on the
adhesion ability of paint as a coating for ship armor with these three types of organic
materials. The preparation of steel specimens with type ASTM A36 is carried out by blasting,
visual inspection standard ISO 8501-1, and roughness test standard ISO 8503-4. Painting of
specimens by measuring the thickness of the paint in the wet conditions ASTM D4414
standard and ASTM D4138 standard dry conditions. Treatment of specimens in two
conditions, are: tropichal weather condition and salt spray conditon. Observation of specimens
by scanning electron microscope and adhesion test standard ASTM D4541-02. The final
result shows that the best adhesion ability of the main paint coating in tropical weather
conditions was a polyurethane coating with no blister characteristics, but there are fractures
on the surface of the material. While the main material for the best coating in salt spray
conditions was epoxy coating with characteristics that are resistant to blisters and blends with
the surface of the material.
Key words: epoxy; vinyl; polyurethane; adhesive
1. Introduction
Coating on steel ship buildings is an important thing to do in an effort to inhibit the rate
of corrosion. Corrosion on ships can cause safety, technical and economic problems.
According to Roberge [1], the importance of studying corrosion is to save costs and minimize
losses due to material reduction. Direct losses on costs incurred for overlaying corroded parts,
replacing corroded parts, and workers' wages. Indirect losses include discontinuation of
operations, products that are affected by corroded components, loss of efficiency, product
contamination, over-design due to the addition of corroded components. S.B. Lyon et al. [2],
paint coatings are generally regarded as functioning by providing a barrier between the
substrate and the environment, ideally providing a high resistance to ionic movement.
Page 2
Suwasono, B., Putra, IKAS. Adhesive coating value based
Kristiyono, T.A., Azhar, A. on the main ingredient of ship paint
20
According to the Mayne [3], the movement of ions in organic coatings is slow and rate
limiting. The charge may be carried by cations or anions (or both) depending upon the nature
of the polymer. Consider a clean, rust-free steel sheet coated with 25 µm of clear lacquer such
as plasticized polystyrene (Figure 1a). After a few weeks of exposure to the environment, a
red-brown deposit is observed on the surface of the lacquer, and blisters containing a clear
liquid may be observed underneath the lacquer (Figure 1b). Charge transfer must have taken
place in order for electrochemical reactions to proceed. Charge transfer is ionic in the
electrolyte and electronic in the substrate, so how is the charge carried in the polymer (Figure
1c). The appearance of the red-brown deposit on the surface suggests Fe2+ ions must migrate
from the substrate into the polymer (Figure 1d). The growth of the under-film blister suggests
oxygen and water must migrate from the electrolyte into the polymer (Figure 1). Of course,
where anodes and cathodes exist together within a single interfaci al defect, ionic transport
through the coating thickness would no longer control the under film corrosion process in the
manner shown here.
Fig. 1 Experimental observation of under-film corrosion: (a) coating applied on clean substrate, (b) after a few
weeks exposure to electrolyte, (c) charge transfeer between electrolyte and substrate, (d) ions migrate from
substrate, (e) oxygen and water migrate
Therefore the type of coating that is commonly used is a type of liquid coating (resin)
which includes epoxy, vinyl, and polyurethane. The epoxy resin has characteristics of
resistance to chemical reactions and impact, low shrinkage value, and good adhesive
properties to various materials (Claver) [4]. The vinyl resin has the characteristics of
resistance to liquid solvents and various solvents others (Zaske & Goodman) [5]. The
polyurethane resin has characteristics of resistance to weather, solvents, and mechanical
damage (Dodiouk & Goodman) [6].
On the other hand, research by Yong Li et al. [7] on epoxy composites with zinc rich
primer and silver epoxy enamel sprayed on Q235 steel, where this type of steel is commonly
used for bridges, vehicles, containers and ships. Samples were exposed to an atmospheric
environment for 18 months and immersed in 5% NaCl solution for 250 days. The final results
show that the resistance of painting is better in an atmospheric environment, where the
atmospheric resistance coefficient is higher than the resistance coefficient in the 5% NaCl
solution immersion. Meanwhile, research by R. Vera et al. [8] on painting with a polyurethane
coating that is sprayed on A36 steel which is commonly used for industrial structures in
marine environments. Samples were exposed to an atmospheric environment at five different
locations for 24 months and a salt spray test with a maximum exposure of 3,000 hours. The
final results show that after 2 years of exposure or after 3,000 hours in the salt spray chamber,
both paints still show evenly protective properties.
Based on the above conditions, the researchers carried out experimental activities to
explore and compare the value of the adhesiveness of paint as a coating for ship steel with
three types of organic materials including: epoxy, vinyl, and polyurethane.
Page 3
Adhesive coating value based Suwasono, B., Putra, IKAS.
on the main ingredient of ship paint Kristiyono, T.A., Azhar, A.
21
2. Experimental
2.1. The test specimen
The test specimen was cut from a steel plate that conforms to ASTM A36 standards
with a specimen size of 100 x 50 x 10 mm. The blasting process uses the dry abrasive
cleaning method, Steel Grit 15 type of abrasive material, and according to ASTM D4417
standards as shown in Figures 2 and 3.
Fig. 2 Steel plate specimen: 100 x 50 x 10 mm
(a) (b)
Fig. 3 Specimen condition: (a) Before blasting and (b) After blasting
2.2. Visual inspection of blasted samples
Visual inspection of blasted surface was carried out to see the results of the blasting
process on the specimen by comparing the cleanliness level of the specimen with the image
contained in the ISO 8501-1 standard, it was Sa 2 ½ as shown in Figure 4.
Fig. 4 Visual inspection of blasted surface; grade Sa 2 ½ according to ISO 8501-1
2.3. Roughness test
A roughness test was carried out to ensure that the surface roughness of the specimen
was in accordance with ISO 8503-4 and NORSOK M-CR-501 standards. In this study using
Testex Replica Tape and Elcometer facilities with roughness values at the Sa-3 cleanliness
level reaching 50 µm - 75 µm (A. M. Berendsen) [9] as shown in Figure 5.
Page 4
Suwasono, B., Putra, IKAS. Adhesive coating value based
Kristiyono, T.A., Azhar, A. on the main ingredient of ship paint
22
Fig. 5 Roughness meaurement with Elcometer Testex Replica and Elcometer 124
The Elcometer 122 Testex Replica Tape was a very simple technique to measure a surface
profile. The foam side of the Testex Tape was used to mould the peak-to-valley profile of the
surface and then the measurement was taken by the Elcometer 124, a mechanical Surface
Profile and Thickness Gauge.
2.4. Coating
The comparison between main paint ingredients (part A) and hardener (part B)
following the rules of paint product in general and the specimen coating using one layer. The
comparison for epoxy paint 2 : 1, for vinyl paint, and for polyurethane paint 4:1. The coating
process in this specimen was done horizontally.
(a) (b) (c)
Fig. 6 Specimens coating with resin (a) Epoxy, (b) Vinyl, and (c) Polyurethane
Measurement of paint thickness in wet conditions using the wet film thickness (WFT)
comb and the implementation method according to ASTM D4414 standard with a wet
thickness between 200-300 μm as shown in Figure 7 (a).
(a) WFT comb (b) DFT comb
Fig. 7 Measurement of paint thickness
Dry film thickness (DFT) comb and the implementation method according to the ASTM
D4138 standard with a wet thickness between 150-200 μm as shown in Figure 7 (b).
Meanwhile, the determination of solid by volume in experiment refers to paint products that
use the same base material.
2.5. Tropical weather test
A tropical weather test was carried out to analyse the resistance of materials and
coatings in open spaces (sunlight, humidity, and temperature). The specimens were placed on
a support with a angle of 90 ° and exposed to the weather for 576 hours, where every 192
hours a check was made for changes in the coating material as shown in Figure 8.
Page 5
Adhesive coating value based Suwasono, B., Putra, IKAS.
on the main ingredient of ship paint Kristiyono, T.A., Azhar, A.
23
Fig. 8 Trophical weather test
Testing with atmosphere exposure was carried out at the laboratory of chemical and material
from Indonesian Navy.
2.6. Salt spray test
The salt spray test chamber was a test chamber that assesses the ability of material and
its protective layer to withstand salt spray corrosion. Salt spray chambers meet international
standards, such as ASTM B 117. The composition of the mixture includes: 100 liters of water
[H2O], 50 grams of salt [NaCl], 350 grams of ammonium sulphate [(NH4)2SO4] , and 25
millilitres acetic acid glacial [HC2H3O2]. Specimens were placed in a salt spray chamber with
a 90° angle position and a dew rate of 1.0 to 2.0 l/h, with variations in exposure time for 196
hours, 382 hours, and 575 hours as shown in Figure 9.
(a) Salt fog phase (b) Cold phase (c) Humidity
Fig. 9 Salt spray test chamber
The operational standard of the ERICHSEN 608 engine - Corrosion Test Apparatus (P-VW
1210 test) has a 4 hour cycle of salt fog phase, 4 hours of cold phase 18 to 28° Celsius with a
humidity of 40 to 60%, and 16 hours of hot phase 40 ± 3° Celsius with 100% humidity.
2.7. Scanning Electron Microscope
Scanning Electron Microscope (SEM) was performed to obtain visual information on
specimens from topographic surfaces (K. Akhtar et al.) [10] on coating damage and ASTM
A36 material as shown in Figure 10.
Fig. 10 Scanning Electron Microscope
SEM from the Hitachi Table Top Electron Microscope TM-3000 has 3D image
capabilities and magnification of x15 to x30,000.
Page 6
Suwasono, B., Putra, IKAS. Adhesive coating value based
Kristiyono, T.A., Azhar, A. on the main ingredient of ship paint
24
2.8. Adhesive test
After weather and salt spray treatment the specimens were subjected to adhesion
measurement using a Pull-Off Test. The adhesion test was conducted to measure the adhesive
strength of a paint layer to the substrate.
The adhesion test was done by attaching 2 dolly pins using epoxy glue for 24 hours
before testing. This is done so that the dolly pin can adhere perfectly to the specimen, then the
dolly pin is pulled using a dolly cutter to test the adhesive strength of the coating. In the test
using Dolly Pull-Off, it can be seen the characteristics of the coating based on the adhesive,
cohesive, and tensile strength. The adhesive and cohesiveness values were compared with the
ASTM D4541-02 and NORSOK M-CR-501 standards. According to the NORSOK M-CR-
501 standard for material preparation and painting in shipbuilding the minimum requirement
for the adhesive strength of a layer is 5MPa.
2.9. Scatter plot and trendlines
Scatter plots use points that represent values for two different numerical variables and
were used to observe relationships between variables. The position of each point on the
horizontal and vertical axis shows values for individual data points (Mike Yi) [11], (M.
Friendly and D. Denis) [12], (D.A. Keim et al.) [13]. Meanwhile, trend lines were created by
connecting between peaks or valleys along the trend. There were three types of trend lines:
internal, external, and curved. Reliable trend lines through time, points on trend lines, and
slope angles of 24 degrees to 30 degrees (W. Selzer) [14], (M. David) [15].
For scatter plot and trend line analysis in this study using Ms. Excel Software to
produce 5 (five) types of functions (linear, exponential, logarithmic, polynomial, and power).
The value of R-square was getting closer to the value of 1, then the regression model can be
approved (J.W. Gooch) [16].
3. Results and Discussion
3.1. Specimen
3.1.1. Roughness level
The specimen roughness has a minimum roughness value of 70 µm and a maximum of
95 µm as shown in Table 1.
Table 1 Roughness test results
Material
Coating
Material
Abrasive
Surface roughness value (µm) Average
1 2 3 4 5 6 7
Epoxy Steel Grit 70 77 82 74 90 88 87 81.14
Vinyl Steel Grit 88 92 71 74 73 84 81 80.43
Polyurethane Steel Grit 95 89 72 75 85 83 76 82.14
Table 1 showed that the average roughness value of coating materials for epoxy was
81.14 µm, vinyl 80.43 µm, and polyurethane was 82.14 µm. The three coating materials were
included in the medium category in the ISO 8503-1 standard. According to Trijatmiko et al
[17] showed that roughness average rating the surface of material was blasted using abrasive
material from steel grit type reached of 84.71 µm.
Page 7
Adhesive coating value based Suwasono, B., Putra, IKAS.
on the main ingredient of ship paint Kristiyono, T.A., Azhar, A.
25
3.1.2. Paint thickness level
The wet film thickness has a minimum value of 217 µm and a maximum of 283 µm as
shown in Table 2.
Table 2 Wet film thickness testing results
Material
coating Specimen
Wet film thickness test value (µm)
Spot 1 Spot 2 Spot 3 Spot 4 Spot 5 Average
Epoxy
1 228 222 225 230 227 226.40
2 220 222 217 220 219 219.60
3 217 225 219 224 218 220.60
4 222 217 220 219 217 219.00*
5 228 225 226 225 226 226.00
6 217 221 220 223 222 220.60
7 219 223 223 224 224 222.60
Vinyl
1 250 247 244 246 244 246.20
2 237 244 245 239 240 241.00*
3 244 243 244 245 240 243.20
4 236 239 235 235 234 235.80
5 246 245 244 249 247 246.20
6 239 244 244 242 240 241.80
7 239 245 245 240 241 242.00
Polyurethane
1 279 280 276 274 274 276.60
2 282 278 276 283 283 280.40
3 272 278 275 275 277 275.40*
4 277 280 275 276 277 277.00
5 278 277 274 279 281 277.80
6 273 279 275 275 276 275.60
7 277 281 278 275 279 278.00
Table 2 showed that the average thickness value of paint in wet conditions for epoxy
222.114 µm, vinyl is 242.314 µm, and polyurethane 277.257 µm. The three coating materials
were included in the ASTM D4414 standard.
The dry film thickness has a minimum value of 170 µm and a maximum of 198 µm as
shown in Table 3.
Table 3 showed that the average thickness value of paint in dry conditions for epoxy
was 181.857 µm, vinyl 184.029 µm, and polyurethane 181.40 µm. The three coating materials
were included in the ASTM D4138 standard.
Based on Table 2, Table 3, and the average from three specimens coating (epoxy, vinyl,
and polyurethane), so the calculation DFT / WFT ratio difference regarding solids volume
was related to uneven spray paint over a nozzle as shown in Table 4, 5, and 6.
Page 8
Suwasono, B., Putra, IKAS. Adhesive coating value based
Kristiyono, T.A., Azhar, A. on the main ingredient of ship paint
26
Table 3 Dry film thickness testing results
Material
coating Specimen
Dry film thickness test value (µm)
Spot 1 Spot 2 Spot 3 Spot 4 Spot 5 Average
Epoxy
1 181 177 192 188 176 182.80
2 179 176 188 190 170 180.60
3 182 179 190 185 177 182.60
4 177 178 191 186 175 181.40
5 177 176 187 187 174 180.20
6 182 175 190 188 176 182.20
7 181 180 190 190 175 183.20
Vinyl
1 197 198 190 192 195 194.40
2 187 183 181 185 188 184.80
3 177 184 181 179 184 181.00
4 185 190 191 187 188 188.20
5 184 185 184 186 183 184.40
6 180 179 181 178 179 179.40
7 177 174 176 176 177 176.00
Polyurethane
1 176 176 179 178 177 177.20
2 180 184 183 181 182 182.00
3 177 180 176 175 175 176.60
4 185 180 183 183 185 183.20
5 187 188 187 190 186 187.60
6 175 177 177 179 176 176.80
7 188 184 185 187 188 186.40
Table 4 Solid by volume for epoxy
Spot Spot 1 Spot 2 Spot 3 Spot 4 Spot 5 Average
DFT Epoxy specimen 179.857 177.286 189.714 187.714 174.714 181.857
WFT Epoxy specimen 221.571 222.143 221.429 223.571 221.857 222.114
Solid by volume 0.81173 0.79807 0.85677 0.83962 0.78751 0.81875*
Table 5 Solid volume percentage for vinyl
Spot Spot 1 Spot 2 Spot 3 Spot 4 Spot 5 Average
DFT Vinyl specimen 183.857 184.714 183.429 183.286 184.857 184.029
WFT Vinyl specimen 241.571 243.857 243 242.286 240.857 242.314
Solid by volume 0.76109 0.75747 0.75485 0.75649 0.7675 0.75946*
Table 6 Solid by volume for polyurethane
Spot Spot 1 Spot 2 Spot 3 Spot 4 Spot 5 Average
DFT Polyurethane specimen 181.143 181.286 181.429 181.857 181.286 181.40
WFT Polyurethane specimen 276.857 279 275.571 276.714 278.143 277.257
Solid by volume 0.65428 0.64977 0.65837 0.6572 0.65177 0.65427*
Page 9
Adhesive coating value based Suwasono, B., Putra, IKAS.
on the main ingredient of ship paint Kristiyono, T.A., Azhar, A.
27
The predicted dry film thickness (DFT) can be calculated from the wet film thickness (WFT)
using the following formula (B. Goldie) [18]:
DFT = WFT x Solid by Volume (1)
Epoxy coating a solid by volume of 0.819 and a wet film thickness measured at 219.0
μm, prediction of DFT = 219.0 x 0.819 = 179.361 μm (7.174 mils).
Vinyl coating a solid by volume of 0.759 and a wet film thickness measured at 241.0 μm,
prediction of DFT = 241.0 x 0.759 = 182.919 μm (7.317 mils).
Polyurethane coating a solid by volume of 0.654 and a wet film thickness measured at
275.40 μm, prediction of DFT = 275.40 x 0.654 = 180.112 μm (7.204 mils).
3.1.3. Visualisation of tropical weather test
The test is carried out using a drying rack that conforms to the ASTM standard of G 50
- 10. This drying rack positions of the specimen at an angle of 90 °. The position of the 90 °
angle specimen aims to mimic the original position of the steel plate on the hull. The direction
of the specimens is facing to East and West to follow the position of the sun exposure.
Changes in the direction of drying the specimens are carried out manually every 12.00 WIB.
3.1.4. Visualisation of salt spray test
Salt spray tests were carried out in a salt spray fog chamber following ASTM B ll7
standard. The first phase was carried out for 192 hours, then the second phase for 384 hours,
and the third phase for 576 hours, so that the total time needed reached 24 days. The final
results of the specimens on the salt spray condition performed visually as shown in Figures
11, 12, 13 and 14.
(a) 1st Phase: 192 hours (b) 2nd Phase: 384 hours (c) 3rd Phase: 576 hours
Fig. 11 Visualisation of No Coating Specimens
(a) Epoxy (b) Vinyl (c) Polyurethane
Fig. 12 Visualisation of Coating Specimens to First Phase: 192 hours
(a) Epoxy (b) Vinyl (c) Polyurethane
Fig. 13 Visualisation of Coating Specimens to Second Phase: 384 hours
Page 10
Suwasono, B., Putra, IKAS. Adhesive coating value based
Kristiyono, T.A., Azhar, A. on the main ingredient of ship paint
28
(a) Epoxy (b) Vinyl (c) Polyurethane
Fig. 14 Visualisation of Coating Specimens to Third Phase: 576 hours
3.2. Scanning Electron Microscope
3.2.1. SEM: tropical weather test
SEM study on specimens without coating in tropical weather test performed to obtain
the visual information about material corrosion as shown in Figure 15.
(a) 1st Phase: 192 hours (b) 2nd Phase: 384 hours (c) 3rd Phase: 576 hours
Fig. 15 SEM:TWT – No coating (magnification visual of longitudinal x800 and transverse x200)
Based on Figure 15, it showed that the first phase at 192 hours corrosion occurs but has
not covered the entire surface of the material so that erosion does not occur significantly.
Second phase at 384 hours, corrosion has eroded the surface and changed the surface structure
so that the material deformation on the surface part occurs significantly. Third phase at 576
hours, corrosion was increasingly significant and the surface that has been deformed has been
separated from the material.
SEM activities on epoxy coating specimens in tropical weather test performed to obtain
visual information about coating and material damage as shown in Figure 16.
(a) 1st Phase: 192 hours (b) 2nd Phase: 384 hours (c) 3rd Phase: 576 hours
Fig. 16 SEM:TWT – Epoxy coating (magnification visual of longitudinal x800 and transverse x200)
Based on Figure 16, it shows that the first phase at 192 hours occurs evenly erosion and
fractures on the coating surface. The blister is relatively small when compared to the area of
Page 11
Adhesive coating value based Suwasono, B., Putra, IKAS.
on the main ingredient of ship paint Kristiyono, T.A., Azhar, A.
29
the coating in the field of observation. Second phase at 384 hours, the coating was
experienced significant erosion and fracture on the surface and coating. Meanwhile, at the
base, the coating was still attached to the surface of the material so that the fracture that
occurs does not affect the ability of the coating to protect the material from corrosion. Third
phase at 576 hours, the epoxy coating remains and covers the surface of the material. This
shows that the epoxy coating has a fairly good resistance even after experiencing abrasion and
blister potential. The abrasive conditions occur as a result of corrosive environments and sun
exposure. According to Da Silva et al. [19] and Linmin Wu et al. [20] showed that the
abrasive resistant coatings may be the only feasible option to protect the product surfaces. In
situations where, operating temperatures were extremely high, long operating time, and
environments not suitable for surface wear.
SEM study on vinyl coating specimens in tropical weather test performed to obtain
visual information about coating and material damage as shown in Figure 17.
(a) 1st Phase: 192 hours (b) 2nd Phase: 384 hours (c) 3rd Phase: 576 hours
Fig. 17 SEM:TWT – Vinyl coating (magnification visual of longitudinal x800 and transverse x200)
Based on Figure 17, it shows that the first phase at 192 hours shown that there was
evenly erosion and fracture on the coating surface. The area of the blister was relatively small
when compared to the area of the coating in the field of observation. Blisters also occur in
coatings that were adjacent to the material but do not interact with the surface of the material.
In the second phase at 384 hours, there was uneven erosion, where there was a coating with a
thickness higher than other areas. Third phase at 576 hours, there was erosion and the
appearance of the material surface. This flatness causes the coating to remain even though it
was very thin when compared to the area of the field of observation.
SEM study on polyurethane coating specimens in tropical weather test performed to
obtain visual information about coating and material damage as shown in Figure 18.
Based on Figure 18, it shows that the first phase at 192 hours show that there was no
blister, but there were fractures on the surface, inside, and the base of the coating, as well as
some parts of the coating that do not stick to the surface of the material. In the cross-section, a
relatively large, round cavity was formed from air trapped during the curing process. Second
phase at 384 hours, there were uneven erosion. There was a coating with a thickness higher
than other areas. In thicker coatings there are fractures that interact with the surface of the
material. Meanwhile, cross-sectional observations show that there were deeper holes and non-
uniformity in the coating thickness. Third phase at 576 hours, it appears that the basic part of
the coating was attached to the surface of the material, but there were fractures throughout the
coating. On cross-sectional observation, the holes in the coating became smaller and the area
around the holes was covered by a coating with a finer texture like sand.
Page 12
Suwasono, B., Putra, IKAS. Adhesive coating value based
Kristiyono, T.A., Azhar, A. on the main ingredient of ship paint
30
(a) 1st Phase: 192 hours (b) 2nd Phase: 384 hours (c) 3rd Phase: 576 hours
Fig. 18 SEM:TWT – Polyurethane coating (magnification visual of longitudinal x800 and transverse x200)
3.2.2. SEM: salt spray test
SEM study on specimens without coating in salt spray test performed to obtain visual
information about bare material resistance as shown in Figure 19.
(a) 1st Phase: 192 hours (b) 2nd Phase: 384 hours (c) 3rd Phase: 576 hours
Fig. 19 SEM:SST – No coating (magnification visual of longitudinal x800 and transverse x200)
Based on Figure 19, it shows that the first phase at 192 hours begins to occur at a
minimum, but it has not been significantly proven that there were still intact blasting particles.
Second phase at 384 hours, there has been erosion of the surface and changes in the structure
of the hollow steel surface. Scraping occurs at the edge of the specimen and was uneven.
Third phase at 576 hours, there was a significant change in the surface structure, where the
specimen was evenly eroded and there was no residual blasting.
SEM study on epoxy coating specimens in salt spray test performed to obtain visual
information about coating and material damage as shown in Figure 20.
Page 13
Adhesive coating value based Suwasono, B., Putra, IKAS.
on the main ingredient of ship paint Kristiyono, T.A., Azhar, A.
31
(a) 1st Phase: 192 hours (b) 2nd Phase: 384 hours (c) 3rd Phase: 576 hours
Fig. 20 SEM:SST – Epoxy coating (magnification visual of longitudinal x800 and transverse x200)
Based on Figure 20, it shows that the first phase at 192 hours begins to appear blisters
occur in epoxy coatings, where blisters mainly occur in coatings that interact with the
material. On the other hand, epoxy has fairly good adhesive properties and was shown by
bonding the epoxy layer to the steel surface. Second phase at 384 hours, there was erosion on
the surface of the layer, where the blister was found to be more spread out in the interacting
part but still close to the steel surface. Third phase at 576 hours, significant erosion occurred.
There were some areas where peeling has occurred and the coating structure becomes hollow,
but there were some parts that were still protected by the epoxy layer.
SEM study on vinyl coating specimens in salt spray test performed to obtain visual
information about coating and material damage as show in Figure 21.
(a) 1st Phase: 192 hours (b) 2nd Phase: 384 hours (c) 3rd Phase: 576 hours
Fig. 21 SEM:SST – Vinyl coating (magnification visual of longitudinal x800 and transverse x200)
Based on Figure 21, it shows that the first phase at 192 hours shown that the specimens
with vinyl resin coating experienced blisters in the layers adjacent to the material, but did not
interact with the surface of the material. Meanwhile, vinyl coatings have good adhesive
properties. Vinyl coating can get into the crevices of the material surface. Second phase at 384
hours, the blister changes the structure of the coating. In the coating there were fractures
caused by small holes on the surface of the coating. These small holes cause salt water to
enter and erode the inside of the layer. Third phase at 576 hours, the appearance of the
material surface in several areas were cause in a very significant change in the coating
structure. There were several coatings that get into the crevices of the surface of the material
that have not been eroded and protect the surface of the material.
SEM study on polyurethane coating specimens in salt spray test performed to obtain
visual information about coating and material damage as shown in Figure 22.
Page 14
Suwasono, B., Putra, IKAS. Adhesive coating value based
Kristiyono, T.A., Azhar, A. on the main ingredient of ship paint
32
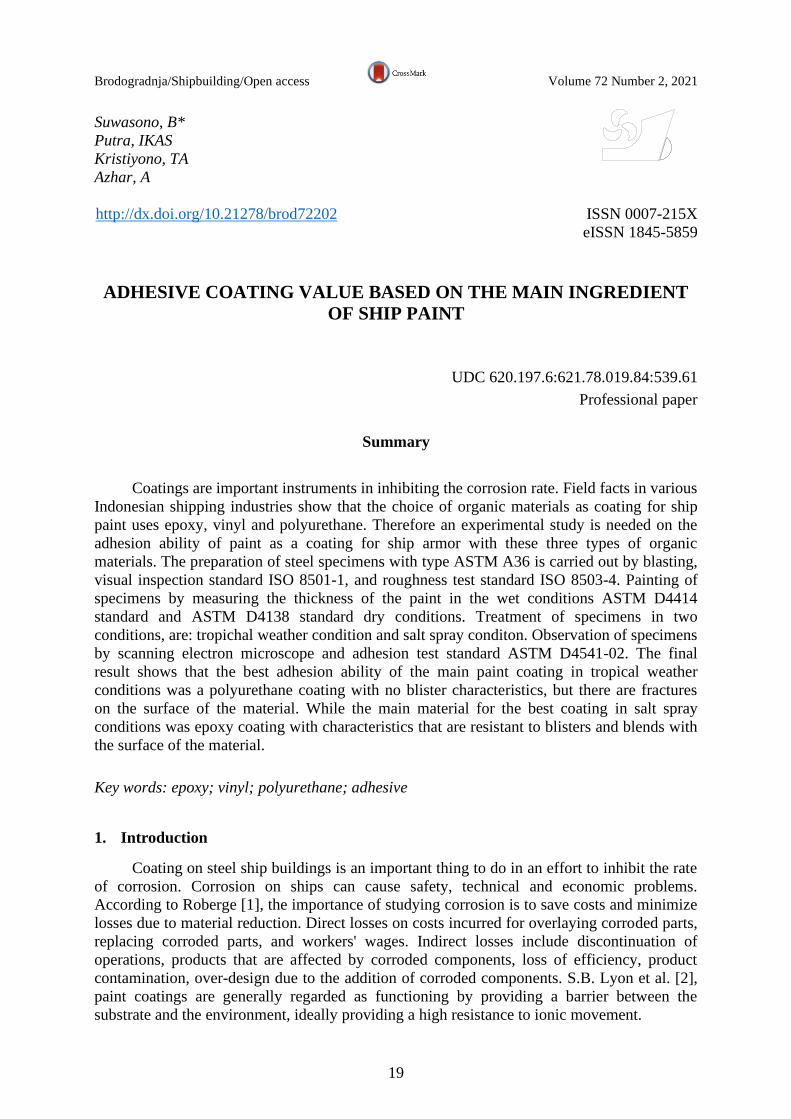
(a) 1st Phase: 192 hours (b) 2nd Phase: 384 hours (c) 3rd Phase: 576 hours
Fig. 22 SEM:SST – Polyurethane coating (magnification visual of longitudinal x800 and transverse x200)
Based on Figure 22, it shows that the first phase at 192 hours show that the
polyurethane coating does not appear to blend with the surface of the material but there was
no blister. Second phase at 384 hours, no blister and polyurethane coating can blend with the
surface of the material. Third phase at 576 hours, the polyurethane coating remains resistant
to blisters and can blend with the surface of the material, but on the other hand there was
significant erosion of the coating surface.
3.3. Adhesive Test
3.3.1. AT: tropical weather condition
Specimens in tropical weather test for 576 hours show that the adhesion value 0% of
constant, cohesion 30 to 80%, glue 20 to 70%, and adhesive 3.95 to 11.87 MPa as shown in
Table 7.
Table 7 Adhesive test: tropical weather condition
Time
(hours) Point
Adhesion (%) Cohesion (%) Glue (%) Adhesive (MPa)
E V P E V P E V P E V P
0 P-1 0 10 15 0 25 25 100 65 60 17.18 15.65 15.65
P-2 10 0 0 0 0 0 90 100 100 21.78 20.66 20.66
192 P-1 0 0 0 30 80 0 70 20 100 15.27 4.79 9.59
P-2 0 0 0 50 25 20 50 75 80 14.58 3.8 8.77
384 P-1 0 0 0 30 40 90 70 60 10 9.66 9.65 9.38
P-2 0 0 0 40 30 40 60 70 60 14.91 8.74 12.32
576 P-1 0 0 0 35 30 75 65 70 25 5.1 5.71 11.87
P-2 0 0 0 45 45 80 55 55 20 5.75 3.95 9.25
Note: E = epoxy; V = vinyl; P = polyurethane
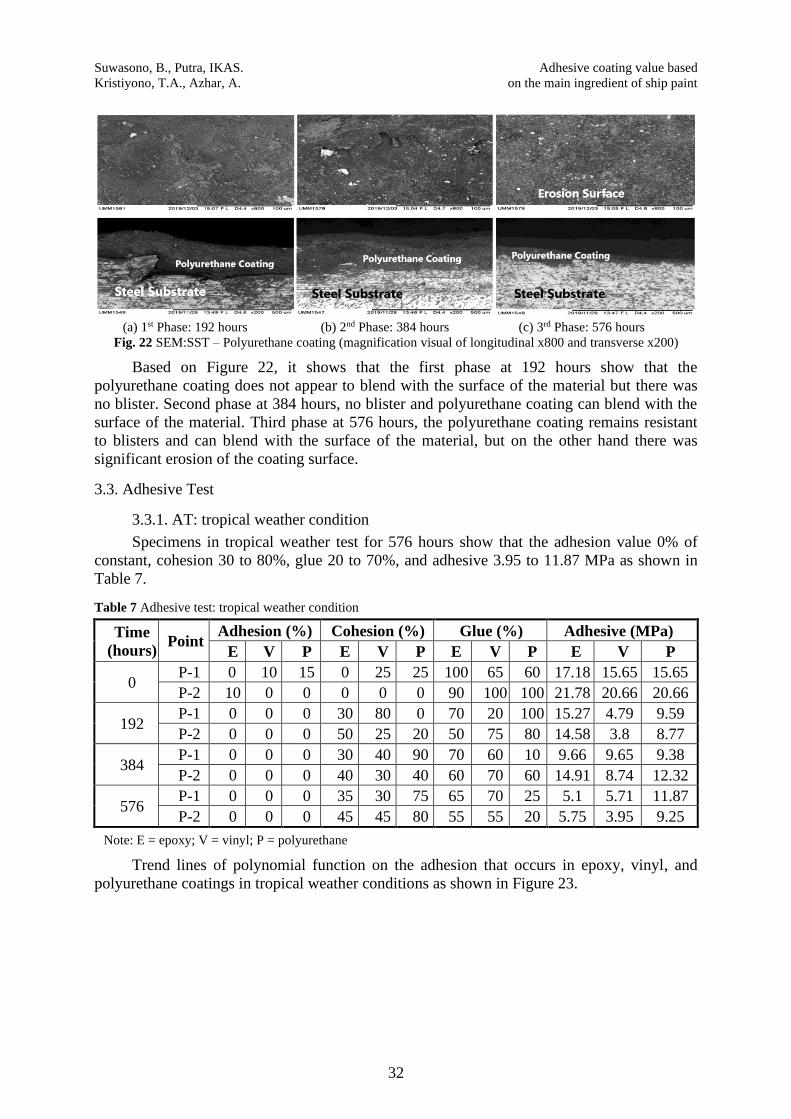
Trend lines of polynomial function on the adhesion that occurs in epoxy, vinyl, and
polyurethane coatings in tropical weather conditions as shown in Figure 23.
Page 15
Adhesive coating value based Suwasono, B., Putra, IKAS.
on the main ingredient of ship paint Kristiyono, T.A., Azhar, A.
33
Fig. 23 Trend lines of Adhesive Test: TWC – Epoxy/Vinyl/Polyurethane Coating
Figure 23 showed that the trendlines of epoxy, vinyl, and polyurethane coating have a
second polynomial order. Meanwhile, the horizontal line of NORSOK M-CR-501 was the
limit of adhesion that was allowed at least 5 MPa. Taking into account the three polynomial
trendlines and horizontal lines of NORSOK M-CR-501 shows that polyurethane coating in
tropical weather conditions has the best adhesion power than epoxy and vinyl coating.
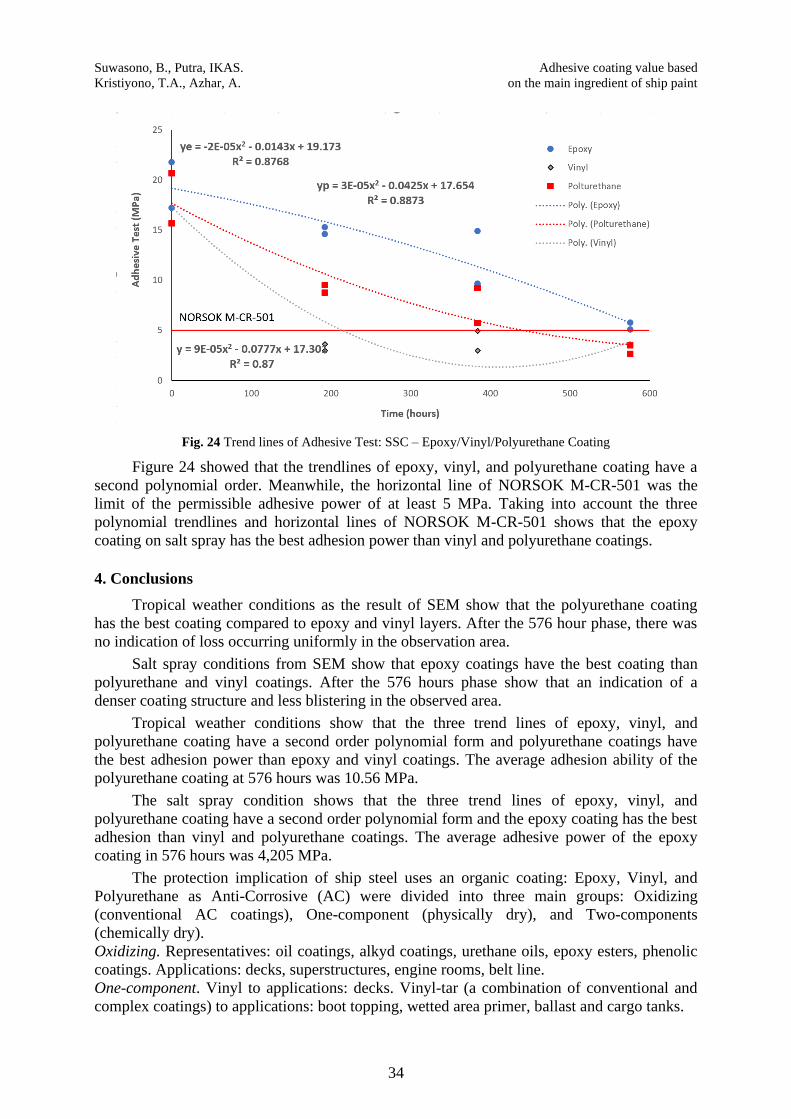
3.3.2. AT: salt spray condition
Specimens in salt spray test for 576 hours show that adhesion value 0 to 40%, cohesion
0 to 45%, glue 60 to 95%, and adhesive 2.64 to 4.31 MPa as shown in Table 8.
Table 8 Adhesive test: salt spray test
Time
(hours) Point
Adhesion (%) Cohesion (%) Glue (%) Adhesive (MPa)
E V P E V P E V P E V P
0 P-1 0 25 15 0 25 25 100 65 60 17.18 15.65 15.65
P-2 10 0 0 0 0 0 90 100 100 21.78 20.66 20.66
192 P-1 0 25 25 75 80 20 25 75 55 3.91 3.61 8.77
P-2 0 40 5 65 25 5 35 60 90 3.12 3.00 9.51
384 P-1 0 45 10 0 40 0 100 55 90 4.10 3.00 5.71
P-2 0 65 10 0 30 10 100 35 80 2.64 4.95 9.20
576 P-1 0 20 15 25 30 0 75 80 85 4.10 3.51 3.51
P-2 0 40 5 35 45 0 65 60 95 4.31 2.64 2.64
Note: E = epoxy; V = vinyl; P = polyurethane
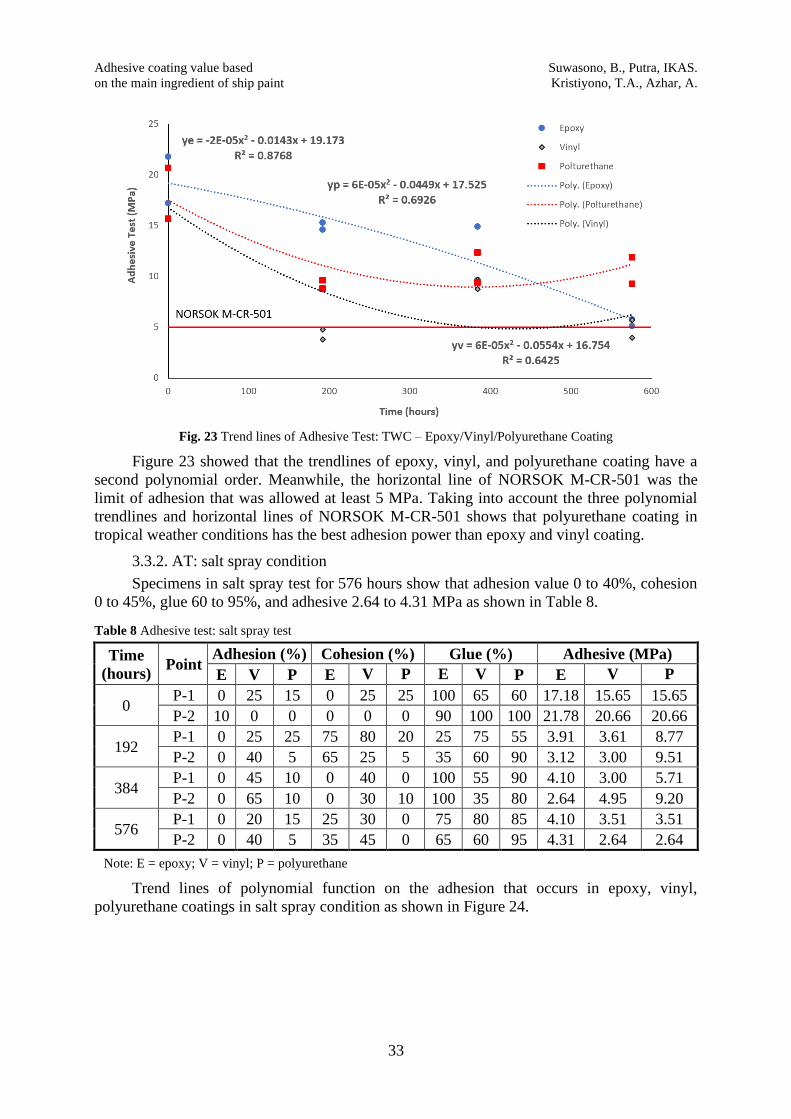
Trend lines of polynomial function on the adhesion that occurs in epoxy, vinyl,
polyurethane coatings in salt spray condition as shown in Figure 24.
Page 16
Suwasono, B., Putra, IKAS. Adhesive coating value based
Kristiyono, T.A., Azhar, A. on the main ingredient of ship paint
34
Fig. 24 Trend lines of Adhesive Test: SSC – Epoxy/Vinyl/Polyurethane Coating
Figure 24 showed that the trendlines of epoxy, vinyl, and polyurethane coating have a
second polynomial order. Meanwhile, the horizontal line of NORSOK M-CR-501 was the
limit of the permissible adhesive power of at least 5 MPa. Taking into account the three
polynomial trendlines and horizontal lines of NORSOK M-CR-501 shows that the epoxy
coating on salt spray has the best adhesion power than vinyl and polyurethane coatings.
4. Conclusions
Tropical weather conditions as the result of SEM show that the polyurethane coating
has the best coating compared to epoxy and vinyl layers. After the 576 hour phase, there was
no indication of loss occurring uniformly in the observation area.
Salt spray conditions from SEM show that epoxy coatings have the best coating than
polyurethane and vinyl coatings. After the 576 hours phase show that an indication of a
denser coating structure and less blistering in the observed area.
Tropical weather conditions show that the three trend lines of epoxy, vinyl, and
polyurethane coating have a second order polynomial form and polyurethane coatings have
the best adhesion power than epoxy and vinyl coatings. The average adhesion ability of the
polyurethane coating at 576 hours was 10.56 MPa.
The salt spray condition shows that the three trend lines of epoxy, vinyl, and
polyurethane coating have a second order polynomial form and the epoxy coating has the best
adhesion than vinyl and polyurethane coatings. The average adhesive power of the epoxy
coating in 576 hours was 4,205 MPa.
The protection implication of ship steel uses an organic coating: Epoxy, Vinyl, and
Polyurethane as Anti-Corrosive (AC) were divided into three main groups: Oxidizing
(conventional AC coatings), One-component (physically dry), and Two-components
(chemically dry).
Oxidizing. Representatives: oil coatings, alkyd coatings, urethane oils, epoxy esters, phenolic
coatings. Applications: decks, superstructures, engine rooms, belt line.
One-component. Vinyl to applications: decks. Vinyl-tar (a combination of conventional and
complex coatings) to applications: boot topping, wetted area primer, ballast and cargo tanks.
Page 17
Adhesive coating value based Suwasono, B., Putra, IKAS.
on the main ingredient of ship paint Kristiyono, T.A., Azhar, A.
35
Two-components. Polyurethane coating to application: superstructure. Epoxy coating to
applications: hull plating, tanks. Tar-epoxy coatings to applications: boot topping, wetted
area, ballast and cargo tanks.
The epoxy coating was customarily applied as a shop primer (using one layer) which
functions as temporary protection before the ship construction process at the fabrication to
assembly stage. If the epoxy or polyurethane coating was applied as anti-corrosive (after
assembly stage) should using two layers.
Acknowledgements
Authors would like to thank you to the PPUPIK – Kemaritiman: National Competitive
Grant Program from Kemendikbud – Indonesia, the FTIK Laboratory – University of Hang
Tuah, the Laboratory of Muhammadiyah Malang University, the Laboratory of Chemical and
Material from Indonesian Navy, the Workshop from Safinah Laras Persada Company, and the
Laboratory of Cipta Agung Company.
REFERENCES
[1] P. R. Roberge, Corrosion Engineering: Principles and Practice, New York: McGraw-Hill Companies,
2008.
[2] S.B. Lyon, R. Bingham and D.J. Mills, ”Advances in Corrosion Protection by Organic Coatings: What
We Know and What We Would Like to Know”, Progress in Organics Coatings, vol. 102, pp. 2-7, 2017.
https://doi.org/10.1016/j.porgcoat.2016.04.030
[3] E.M. Kinsella and J.E.O. Mayne, “Ionic Conduction in Polymer Films I. Influence of Electrolyte on
Resistance”, British Polymer Journal, vol. 1, issue 4, pp. 173-176, 1969.
https://doi.org/10.1002/pi.4980010405
[4] C. D. Claver, Applied Polymer Science: 21st Century, Oxford UK: Elsevier, 2000.
[5] O. C. Zaske and S. H. Goodman, Handbook Thermoset Plastics, Second Edition, New Jersey: Noyes
Publication, 1998.
[6] H. Dodiouk and S. H. Goodman, Handbook of Thermoset Plastics, Third Edition, Oxford: Elsevier
(William Andrew Publishing), 2014.
[7] Yong Li, Jin Fu, Wei Chen, Wenjing Yang, Xueming Li, Yanjun Yin, and Qihui Wang “Corrosive
Behavior Study of Q235 Steel Coated with Epoxy Composites in Substation Environment”, Advanced in
Engineering Research, vol. 113, pp. 561-566, IFMCA 2016.
[8] R. Vera, Cruz, E., Bagnara, M., Araya, R., Henriquez, R., Diaz-Gomes, A., and Rojas, “Evaluation of
Anticorrosive Coating on Carbon Steel in Marine Environments: Accelerated Corrosion Test and Field
Exposure”, International Journal of Electrochemical Science, pp. 898-914, 2018.
https://doi.org/10.20964/2018.01.66
[9] A. M. Berendsen, Maritime Painting Manual, Rotterdam: Springer, 1989. https://doi.org/10.1007/978-94-
017-2186-8
[10] K. Akhtar, S. A. Khan, S. B. Khan, and A. M. Asiri, Scanning Electron Microscopy: Principle and
Applications in Nanomaterials Characterization, S. K. Sharma (ed.), Chapter 4: Handbook of Materials
Characterization, Springer International Publishing AG, part of Springer Nature 2018.
https://doi.org/10.1007/978-3-319-92955-2_4
[11] Mike Yi, A Complete Guide to Scatter Plots, Chartio, 2019.
[12] M. Friendly and D. Denis, “The Early Origins and Development of the Scatterplot“, Journal of the
History of the Behavioral Sciences, vol. 41, no. 2, pp. 103–130, 2005. https://doi.org/10.1002/jhbs.20078
[13] D. A. Keim, M. C. Hao, U. Dayal, H. Janetzko and P. Bak, “Generalized Scatter Plots”, Information
Visualization, vol. 9, no. 4, pp. 301-311, 2010. https://doi.org/10.1057/ivs.2009.34
[14] W. Selzer, Overall Approach to Technical Analysis, Wealth Skills: Understanding Investment Cycles,
2013.
[15] M. David, How to Design Dashboard, Chartio, 2020.
[16] J. W. Gooch, Coefficient of Determination, in Encyclopedic Dictionary of Polymers, 2011.
https://doi.org/10.1007/978-1-4419-6247-8_15182
Page 18
Suwasono, B., Putra, IKAS. Adhesive coating value based
Kristiyono, T.A., Azhar, A. on the main ingredient of ship paint
36
[17] C. Trijatmiko, H. Pratikno, and A. Purniawan, “Analisa Pengaruh Material Abrasif Pada Blasting
Terhadap Kekuatan Lekat Cat dan Ketahanan Korosi di Lingkungan Air Laut”, Jurnal Teknik ITS, vol. 5,
no. 2, pp. 231-236, 2016. https://doi.org/10.12962/j23373539.v5i2.18090
[18] B. Goldie, Apllicator Training Bulletin: Computing Film Thickness and Coverage, PCE European,
Technology Publishing Company, 2000.
[19] W.M.C. Da Silva, H.L. de Mello, H.L., “Transitions in Abrasive Wear Mechanisms: Effect of the
Superimposition of Interactions”, Wear, vol. 271, pp. 977–986, 2011.
https://doi.org/10.1016/j.wear.2011.04.010
[20] Linmin Wu, Xingye Guo, & Jing Zhang, “Abrasive Resistant Coatings – A Review”, Lubricants, vol. 2,
pp. 66-89, 2014. https://doi.org/10.3390/lubricants2020066
Submitted: 25.02.2021.
Accepted: 26.05.2021.
Bagiyo Suwasono*, [email protected] , Associate
Professor, Department of Engineering and Marine Science,
University of Hang Tuah, Surabaya – Indonesia.
I Kadek Agus Sudama Putra, [email protected] , Department
of Engineering and Marine Science, University of Hang Tuah,
Surabaya – Indonesia.
Tri Agung Kristiyono, [email protected] , PhD. Student,
Departement of Environmental, Brawijaya University, Malang -
Indonesia .
Ali Azhar, [email protected] , PhD. Student, Departement of
Environmental, Brawijaya University, Malang - Indonesia