44
Adolescent Obesity
| Date post: | 26-Dec-2015 |
| Category: |
Documents |
| Upload: | shonda-king |
| View: | 226 times |
| Download: | 6 times |
Adolescent Obesity

Objectives
• Definition of overweight in youth
• Prevalence and trends
• Health implications
• Behavioral and pharmacological treatment

What Is BMI?
• Body mass index (BMI) = weight (kg)/height (m2)
• Or: BMI = [weight (pounds) X 703]/height (in2)
• BMI is an effective screening tool; it is not a diagnostic tool
• For children, BMI is age and gender specific, so BMI-for-age is the measure used for youth

BMI-for-Age Cutoffs for Children and Adolescents
≥ 95th percentile Overweight
85th to < 95th percentile Risk of overweight
< 5th percentile Underweight
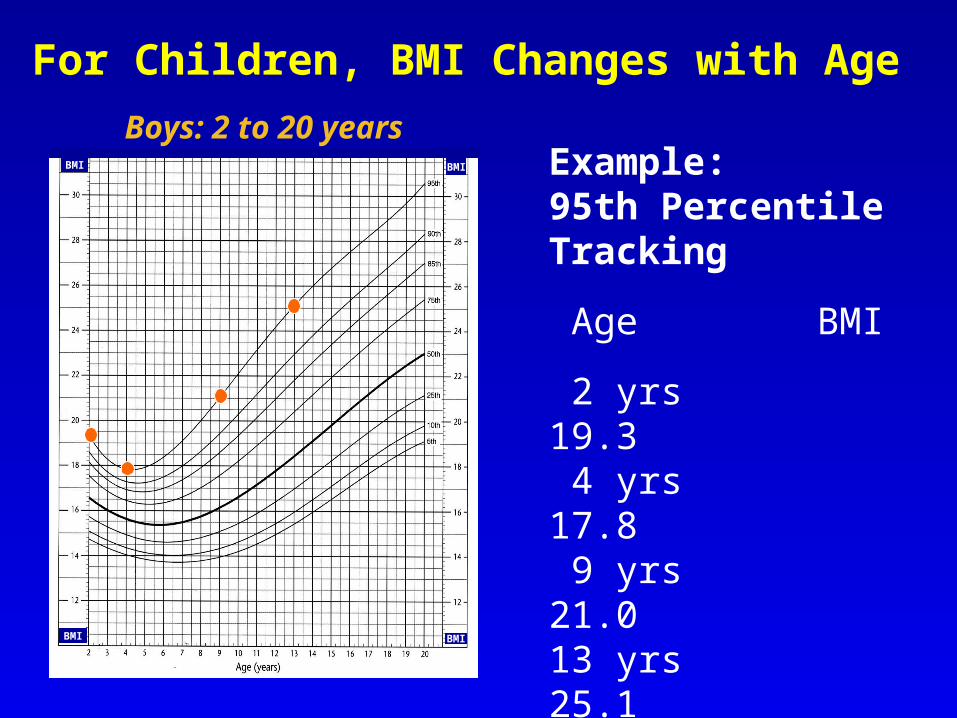
Example: 95th Percentile Tracking
Age BMI
2 yrs 19.3 4 yrs 17.8 9 yrs 21.013 yrs 25.1
For Children, BMI Changes with Age
Boys: 2 to 20 years
BMI BMI
BMI BMI

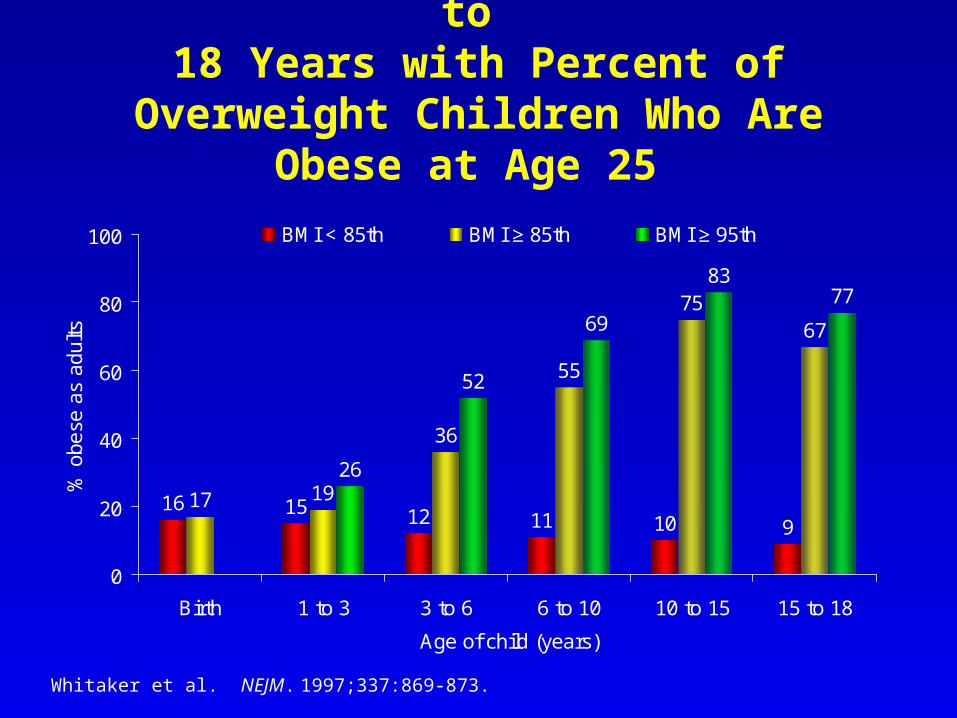
Tracking BMI-for-Age from Birth to 18 Years with Percent of Overweight Children Who Are Obese at Age 25
16 15 12 11 10 917 19
55
7567
26
52
69
8377
36
0
20
40
60
80
100
Birth 1 to 3 3 to 6 6 to 10 10 to 15 15 to 18
Age of child (years)
% o
bese
as
adul
ts
BMI < 85th BMI ≥ 85th BMI ≥ 95th
Whitaker et al. NEJM. 1997;337:869-873.

Example: Adults overweight as teens had an increased relative risk of all-cause morbidity and of coronary heart disease
Childhood Obesity: Risk for Disease
Must A, et al. NEJM 1992;327:1350-1355.
• Cardiovascular disease
• Lipid disorders
• Hypertension
• Diabetes Mellitus type 2
• Gallbladder disease
• Obstructive sleep apnea
• Orthopedic problems
• Metabolic syndrome
• Cancer (breast, uterine, prostate, and colon)
• Sudden death
• Psychosocial distress/body image disparagement
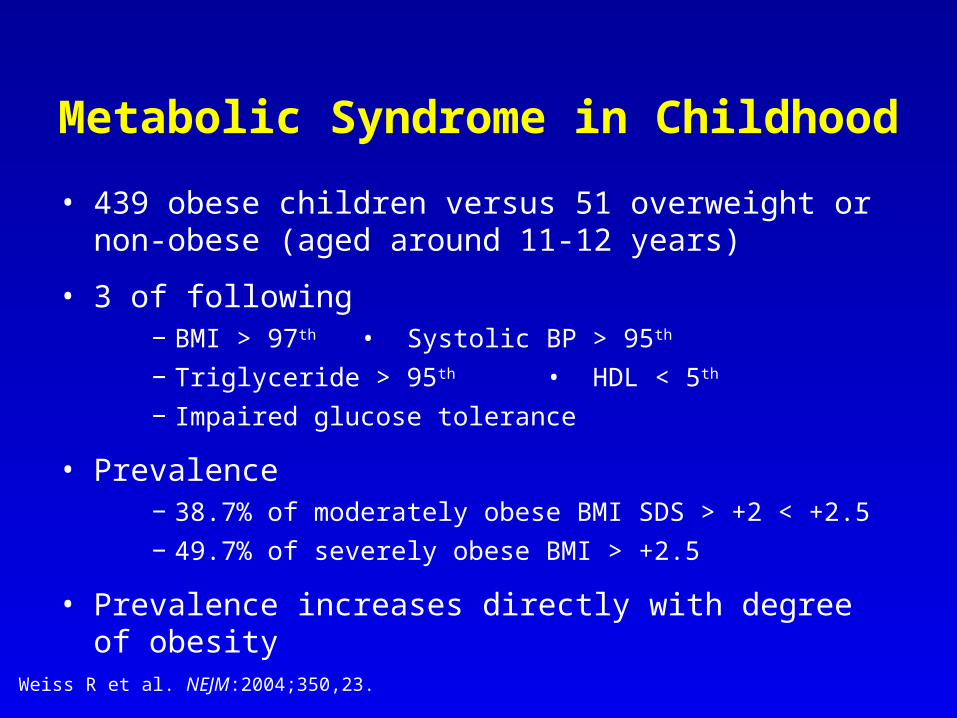
• 439 obese children versus 51 overweight or non-obese (aged around 11-12 years)
• 3 of following− BMI > 97th • Systolic BP > 95th
− Triglyceride > 95th • HDL < 5th
− Impaired glucose tolerance
• Prevalence − 38.7% of moderately obese BMI SDS > +2 < +2.5
− 49.7% of severely obese BMI > +2.5
• Prevalence increases directly with degree of obesity
Weiss R et al. NEJM:2004;350,23.
Metabolic Syndrome in Childhood
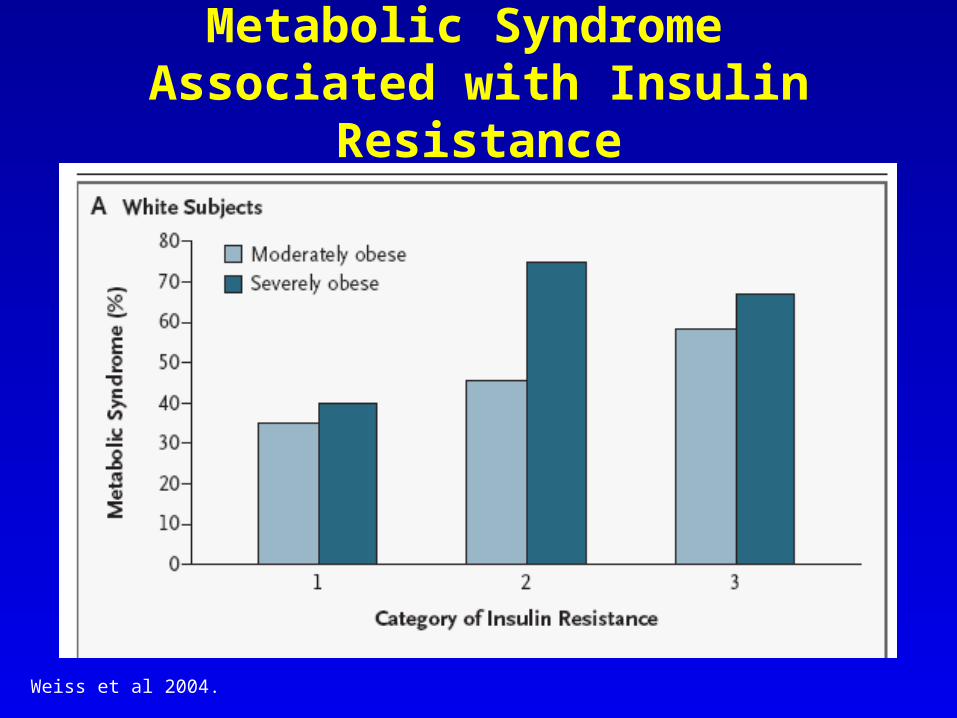
Metabolic Syndrome Associated with Insulin Resistance
Weiss et al 2004.

Weiss R et al. NEJM 2004
BMI Is Associated with Metabolic Syndrome Risk Factors in Children
and Adolescents
VariableBMI z score
Log-Transformed Triglycerides
HDL Cholesterol
Log-Transformed
Insulin Resistance Glucose Blood Pressure
Baseline At 2 Hr Systolic DiastolicBMI z score Correlation coefficient 1.0 0.04 - 0.14 0.31 0.08 0.12 0.13 - 0.01 P value 0.33 0.001 < 0.001 0.08 0.007 0.003 0.82
Pearson Correlation Coefficients of Variables in the Analysis
Weiss et al. JAMA. 2004
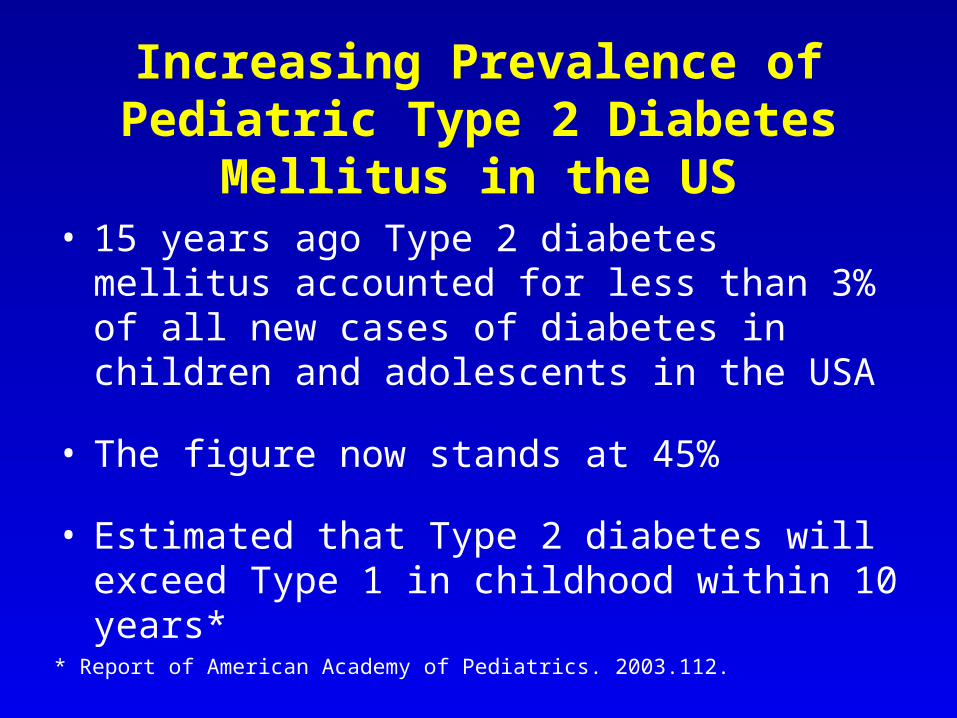
Increasing Prevalence of Pediatric Type 2 Diabetes Mellitus in the US
• 15 years ago Type 2 diabetes mellitus accounted for less than 3% of all new cases of diabetes in children and adolescents in the USA
• The figure now stands at 45%
• Estimated that Type 2 diabetes will exceed Type 1 in childhood within 10 years*
* Report of American Academy of Pediatrics. 2003.112.

Etiology of Obesity
• Increased caloric consumption
• Sedentary lifestyle
• Genetic predisposition
• Medications: psychotropics, steroids

Long-Term Effects of Treating the Parent + Child (8 – 11 y/o)
Months
-12 0 12 24 36 48 60 72 84 96 108 120 132
Ch
an
ge
in %
ag
e o
verw
eig
ht
-25
-20
-15
-10
-5
0
5
10
15
20
25
Parent plus childChild aloneNon-specific control
Epstein, Valoski, Wing & McCurley. Health Psychology. 1994;13:373-383.
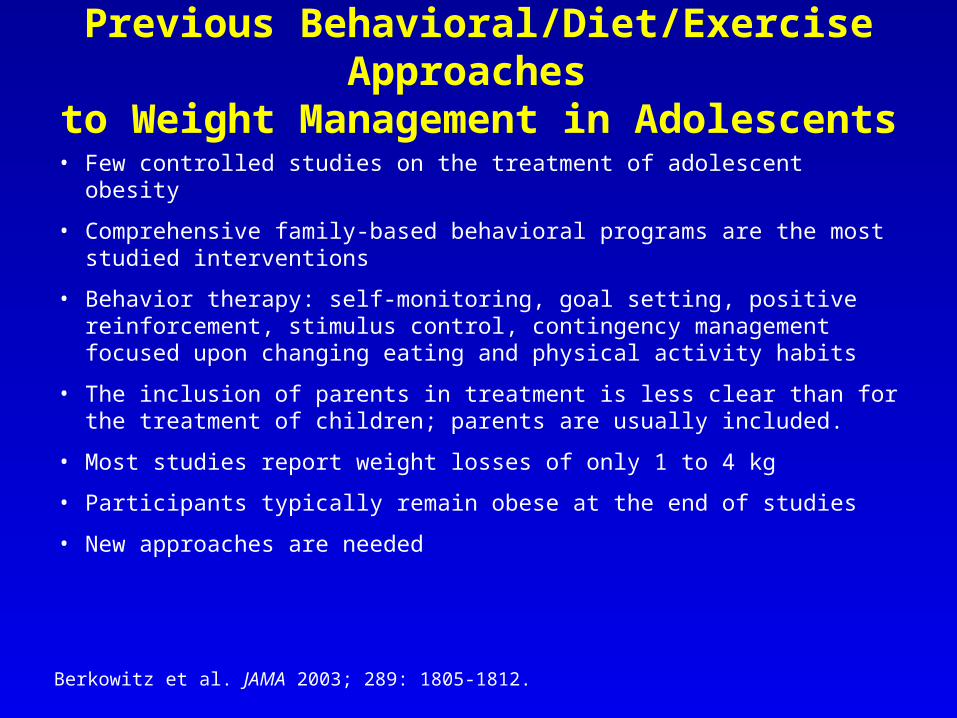
Previous Behavioral/Diet/Exercise Approaches to Weight Management in Adolescents
• Few controlled studies on the treatment of adolescent obesity
• Comprehensive family-based behavioral programs are the most studied interventions
• Behavior therapy: self-monitoring, goal setting, positive reinforcement, stimulus control, contingency management focused upon changing eating and physical activity habits
• The inclusion of parents in treatment is less clear than for the treatment of children; parents are usually included.
• Most studies report weight losses of only 1 to 4 kg
• Participants typically remain obese at the end of studies
• New approaches are needed
Berkowitz et al. JAMA 2003; 289: 1805-1812.
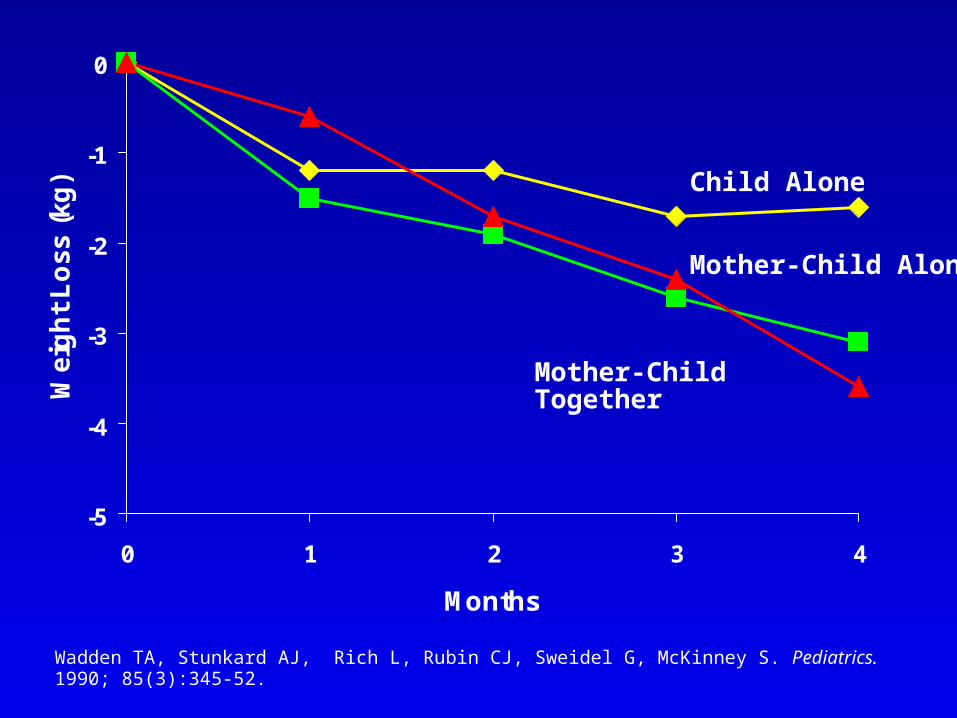
-5
-4
-3
-2
-1
0
0 1 2 3 4
Months
Wei
gh
t L
oss
(kg
) Child Alone
Mother-Child Alone
Mother-Child Together
Wadden TA, Stunkard AJ, Rich L, Rubin CJ, Sweidel G, McKinney S. Pediatrics. 1990; 85(3):345-52.

Obesity Pharmacotherapy: NHLBI Adult Recommendations
• “Appropriate weight-loss drugs can augment diet, physical activity, and behavior therapy in weight loss”
• BMI 30 or 27 with co-morbidities
• Pharmacotherapy should only be given in conjunction with lifestyle modification
National Institutes of Health. Obes Res. 1998;6(suppl 2):51S–209S.
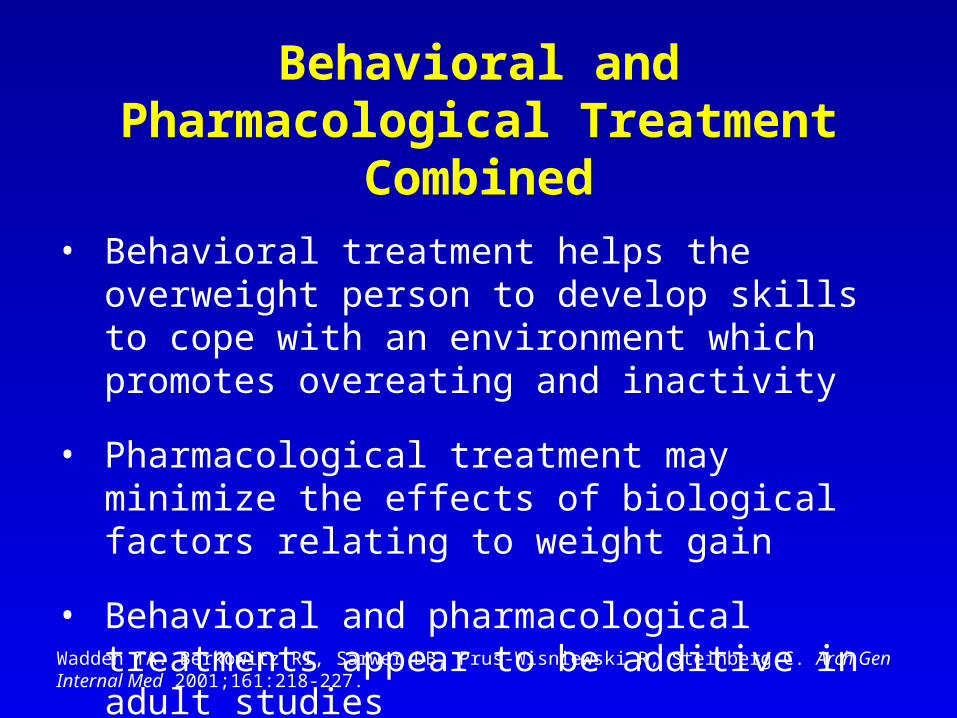
Behavioral and Pharmacological Treatment Combined
• Behavioral treatment helps the overweight person to develop skills to cope with an environment which promotes overeating and inactivity
• Pharmacological treatment may minimize the effects of biological factors relating to weight gain
• Behavioral and pharmacological treatments appear to be additive in adult studies
Wadden TA. Berkowitz RI, Sarwer DB, Prus-Wisniewski R, Steinberg C. Arch Gen Internal Med 2001;161:218-227.
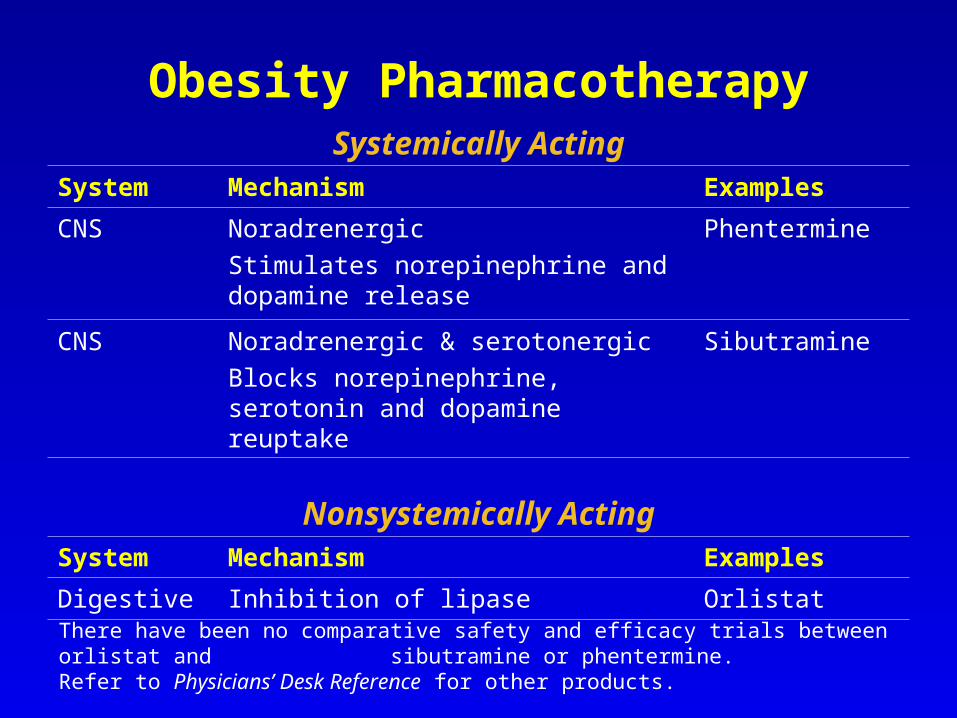
Obesity Pharmacotherapy
There have been no comparative safety and efficacy trials between orlistat and sibutramine or phentermine.Refer to Physicians’ Desk Reference for other products.
Systemically ActingSystem Mechanism Examples
CNS Noradrenergic
Stimulates norepinephrine and dopamine release
Phentermine
CNS Noradrenergic & serotonergic
Blocks norepinephrine, serotonin and dopamine reuptake
Sibutramine
Nonsystemically ActingSystem Mechanism Examples
Digestive Inhibition of lipase Orlistat

Ryan DH et al. Obes Res. 1995;3(suppl 4):553S.
S = sibutramine = norepinephrine = serotonin
Norepinephrine
Serotonin SSSS
SSSS
SSSS
SSSS
Reuptake
Reuptake
Mechanisms of ActionSibutramine’s Active Metabolites Block Serotonin and Norepinephrine Reuptake

Behavior Therapy and Sibutramine for the Treatment of Adolescent Obesity:
A Randomized Controlled TrialRobert I Berkowitz, MD, Thomas A Wadden, PhD,
Andrew M Tershakovec, MD, Joanna L Cronquist, BA
JAMA 2003; 289:1805-1812Support: NIH, Abbott Laboratories
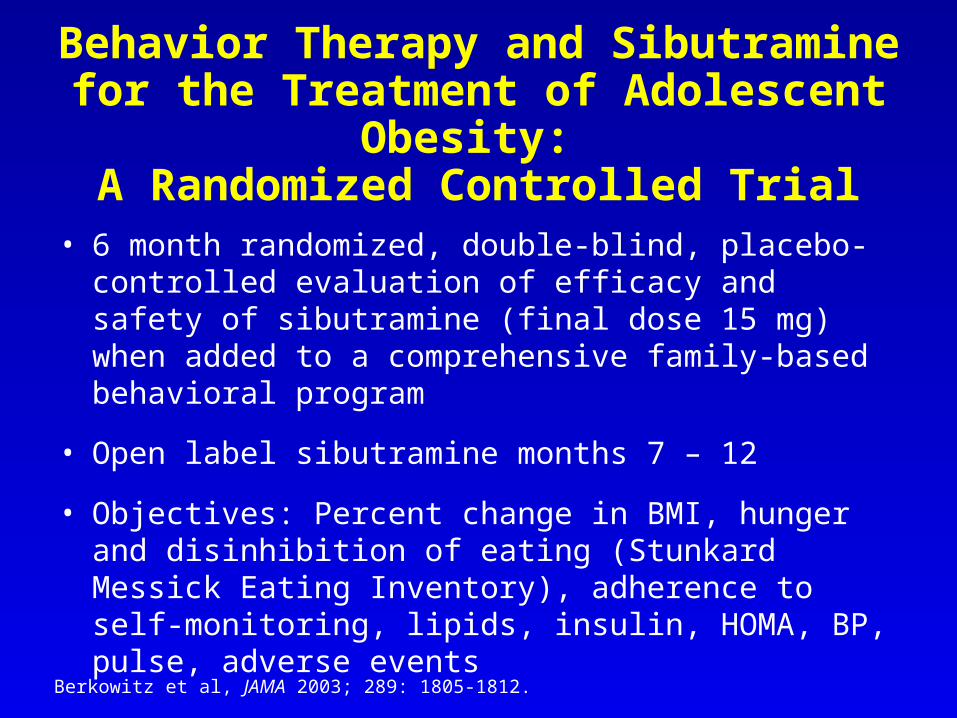
• 6 month randomized, double-blind, placebo-controlled evaluation of efficacy and safety of sibutramine (final dose 15 mg) when added to a comprehensive family-based behavioral program
• Open label sibutramine months 7 – 12
• Objectives: Percent change in BMI, hunger and disinhibition of eating (Stunkard Messick Eating Inventory), adherence to self-monitoring, lipids, insulin, HOMA, BP, pulse, adverse events
Berkowitz et al, JAMA 2003; 289: 1805-1812.
Behavior Therapy and Sibutramine for the Treatment of Adolescent Obesity:
A Randomized Controlled Trial

• Week 1: placebo
• Week 2: sibutramine 5 mg or placebo
• Week 3: sibutramine 10 mg or placebo
• Week 7: sibutramine 15 mg or placebo
• If systolic or diastolic BP increased from baseline by ≥ 10 mm Hg or pulse increased by 15%, dose decreased by 5 mg decrements
Sibutramine Dosage Titration
Berkowitz et al, JAMA 2003; 289: 1805-1812.

• Phase 1− 13 weekly group sessions followed by
− 6 biweekly group sessions
• Phase 2− Biweekly group sessions months 7 – 9
− Monthly group sessions months 10 – 12
• Behavior therapy: self-monitoring, goal setting, positive reinforcement, stimulus control, slowing eating rate, parents involved
• Dietary recommendation: 1200 – 1500 kcal/day, 30% fat, 15% protein
• Physical activity target of 120 minutes per week (e.g. walking)
Family-Based Bbehavioral Therapy Program
Berkowitz et al, JAMA 2003; 289: 1805-1812.
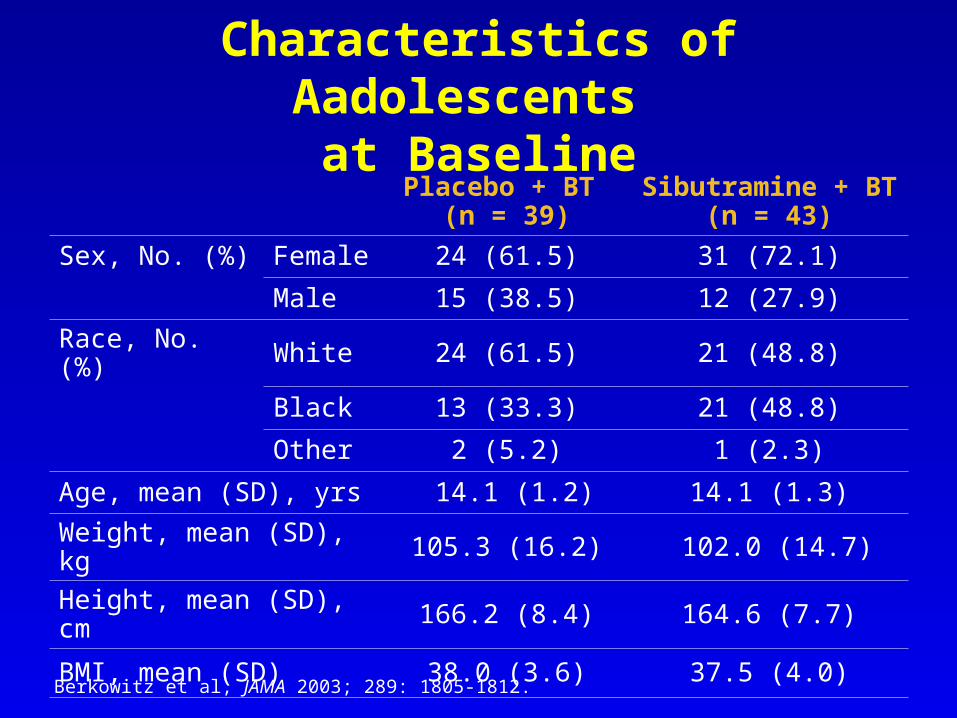
Placebo + BT (n = 39)
Sibutramine + BT (n = 43)
Sex, No. (%) Female 24 (61.5) 31 (72.1)
Male 15 (38.5) 12 (27.9)
Race, No. (%) White 24 (61.5) 21 (48.8)
Black 13 (33.3) 21 (48.8)
Other 2 (5.2) 1 (2.3)
Age, mean (SD), yrs 14.1 (1.2) 14.1 (1.3)
Weight, mean (SD), kg 105.3 (16.2) 102.0 (14.7)
Height, mean (SD), cm 166.2 (8.4) 164.6 (7.7)
BMI, mean (SD) 38.0 (3.6) 37.5 (4.0)
Characteristics of Aadolescents at Baseline
Berkowitz et al, JAMA 2003; 289: 1805-1812.
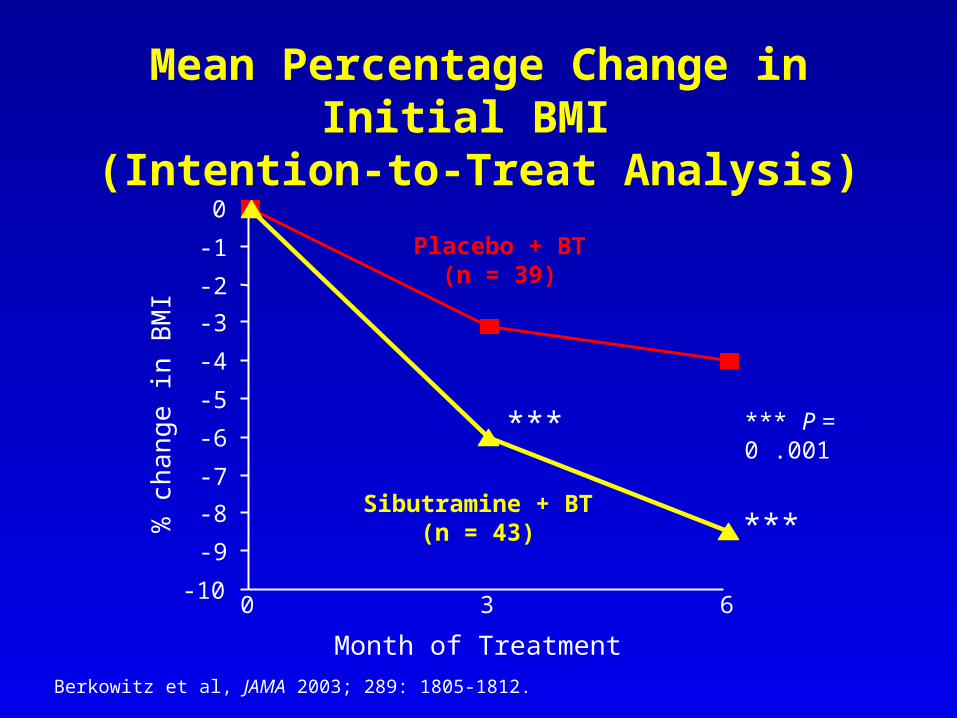
*** P = 0 .001
-10
-9
-8
-7
-6
-5
-4
-3
-2
-1
0
0 3 6
Month of Treatment
% c
han
ge
in B
MI
***
***
Placebo + BT(n = 39)
Sibutramine + BT(n = 43)
Mean Percentage Change in Initial BMI (Intention-to-Treat Analysis)
Berkowitz et al, JAMA 2003; 289: 1805-1812.
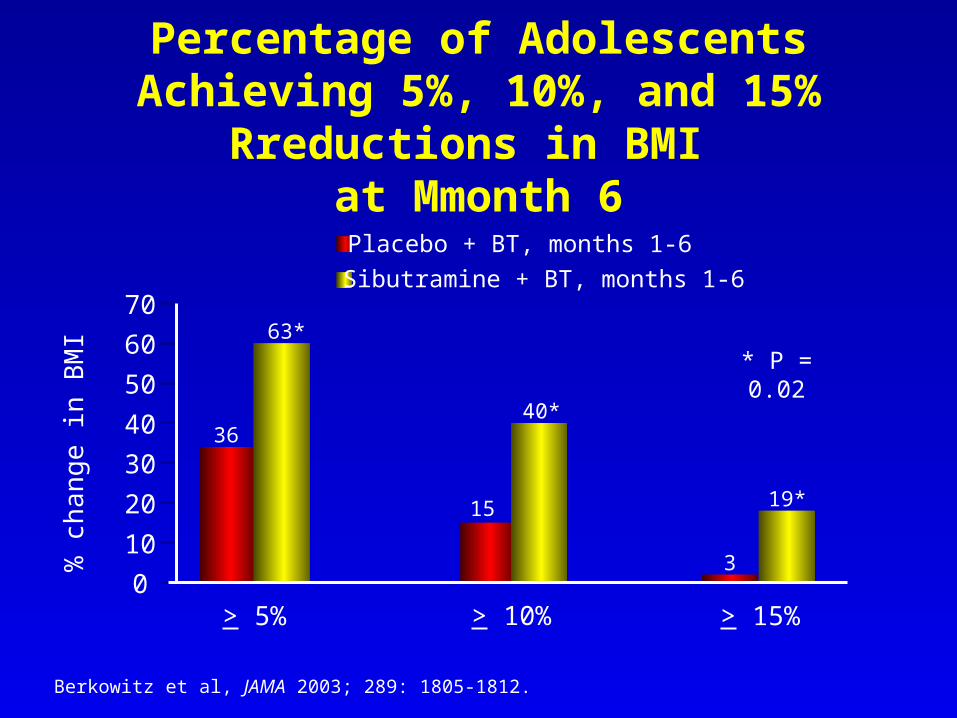
Percentage of Adolescents Achieving 5%, 10%, and 15% Rreductions in BMI
at Mmonth 6
0
10
20
30
40
50
60
70
> 5% > 10% > 15%
63*
40*
19*
36
15
3
* P = 0.02
Placebo + BT, months 1-6
Sibutramine + BT, months 1-6
% c
han
ge
in B
MI
Berkowitz et al, JAMA 2003; 289: 1805-1812.
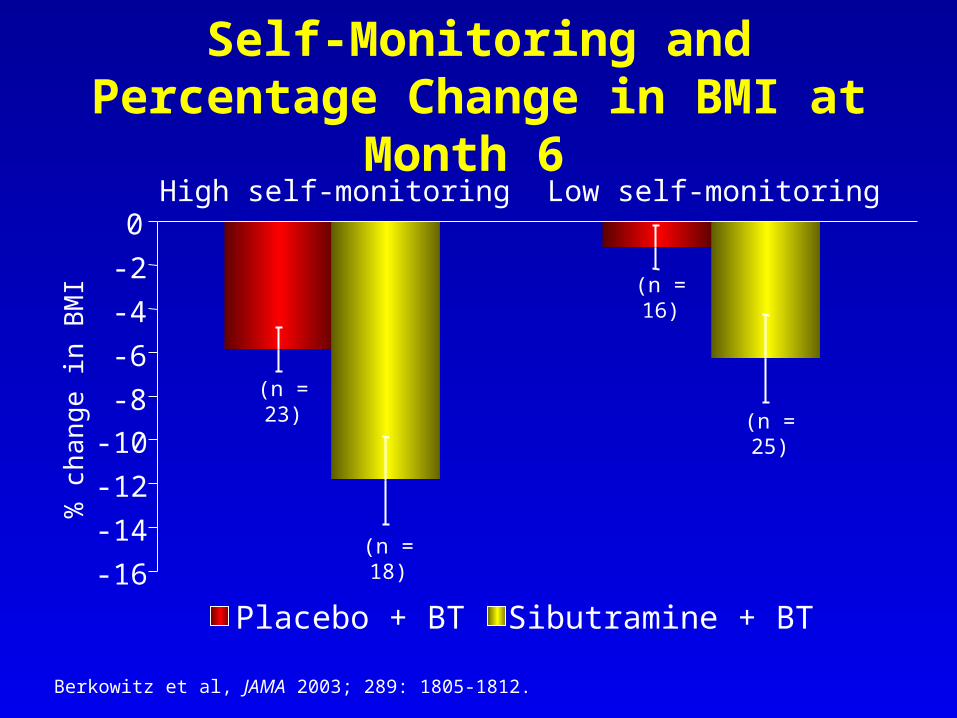
Self-Monitoring and Percentage Change in BMI at Month 6
-16
-14
-12
-10
-8
-6
-4
-2
0High self-monitoring Low self-monitoring
(n = 25)
(n = 18)
(n = 23)
(n = 16)
Placebo + BT Sibutramine + BT
% c
han
ge
in B
MI
Berkowitz et al, JAMA 2003; 289: 1805-1812.

-10
-9
-8-7
-6
-5
-4
-3-2
-1
0
0 3 6 9 12
Month of Treatment
% c
han
ge in
BM
I
Placebo + BT group received sibutramine during months 7 –
12
***
***
*** P = 0 .001
Placebo + BT(n = 39)
Sibutramine + BT(n = 43)
Placebo controlled All subjects received sibutramine
Mean Percentage Change in Initial BMI (Intention-to-Treat Analysis)
Berkowitz et al, JAMA 2003; 289: 1805-1812.
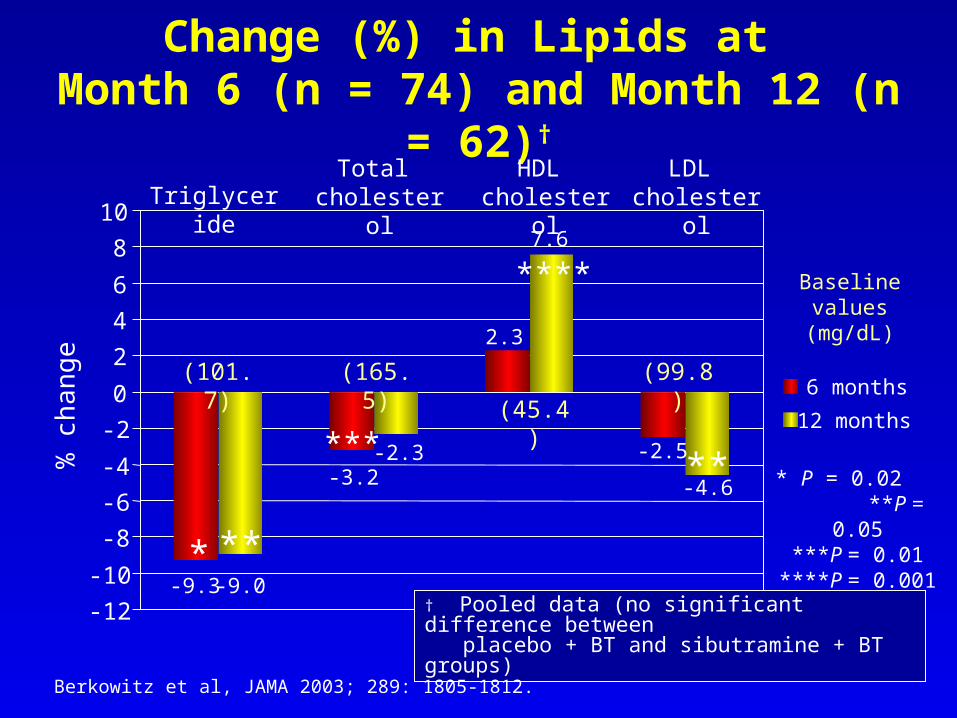
Change (%) in Lipids at Month 6 (n = 74) and Month 12 (n = 62)†
-12
-10
-8
-6
-4
-2
0
2
4
6
8
10
6 months
12 months
-9.0-9.3
Triglyceride
Total cholesterol
HDL cholesterol
LDL cholesterol
-2.3-3.2
7.6
2.3
-4.6
-2.5
(101.7)
(165.5) (45.4)
(99.8)
* P = 0.02 **P = 0.05***P = 0.01
****P = 0.001*
***
**
****
**
Baseline values
(mg/dL)
† Pooled data (no significant difference between placebo + BT and sibutramine + BT groups)
% c
han
ge
Berkowitz et al, JAMA 2003; 289: 1805-1812.

Change (%) in Insulin, Glucose and HOMA at Months 6 (n = 74) & 12 (n = 62)†
(Baseline values)Insulin
(27 U/mL)
% c
han
ge
-20.2
-12.8
-2.6-1.9
Serum glucose(90.3 mg/dL)
-14.8
-22.8
HOMA(6.1)
0
-5
-10
-15
-20
-25
***
*** **
*† Pooled data (no significant difference between placebo + BT and sibutramine + BT groups)
6 months
12 months
* P = 0.02** P = 0.01
***P < 0.001
Berkowitz et al, JAMA 2003; 289: 1805-1812.

Blood Pressure (Mean mm Hg)
Mean
BP (
mm
Hg
)
P = 0.02
Systolic
Diastolic
P = 0.06
0
20
40
60
80
100
120
140
Baseline Month 3 Month 6 Month 12
BT + placebo BT + sibutramine
Sibutramine added to placebo group
Berkowitz et al, JAMA 2003; 289: 1805-1812.
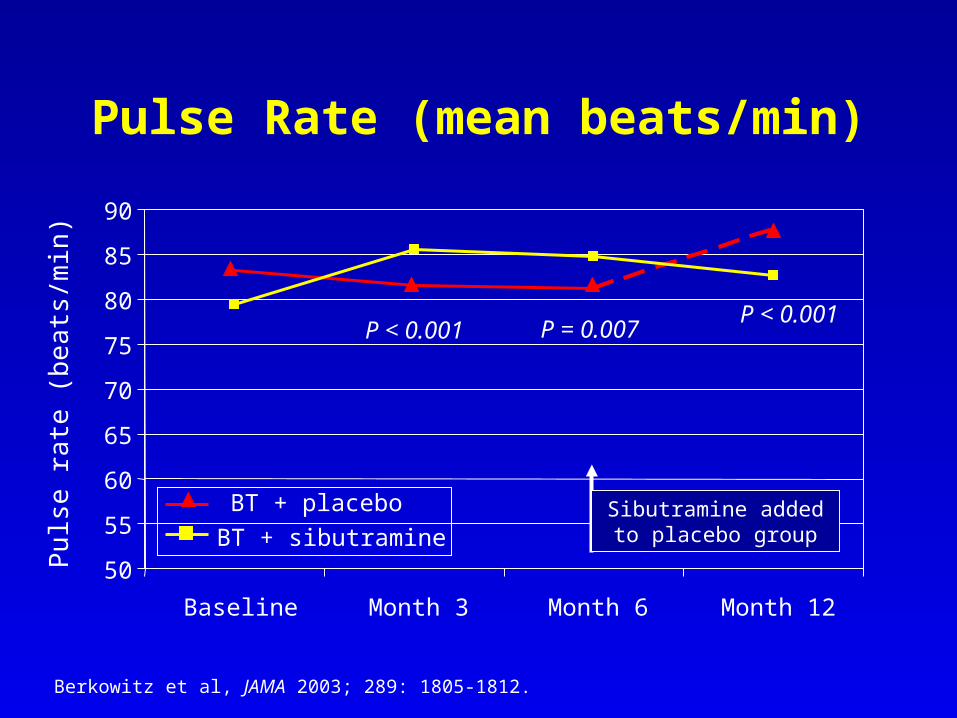
Pulse Rate (mean beats/min)Pu
lse r
ate
(b
eats
/min
)
P < 0.001
P < 0.001P =
0.007
50
55
60
65
70
75
80
85
90
Baseline Month 3 Month 6 Month 12
Berkowitz et al, JAMA 2003; 289: 1805-1812.
BT + placebo BT + sibutramine
Sibutramine added to placebo group

Reason #
Increases in blood pressure and/or pulse( BP alone = 1; BP & pulse = 4; Pulse alone = 1)
6
Ecchymoses 2
Ventricular premature beats 1
Rash of unclear etiology 1
Total number of subjects 10
Reasons for Discontinuation (Entire Study)
Berkowitz et al, JAMA 2003; 289: 1805-1812.
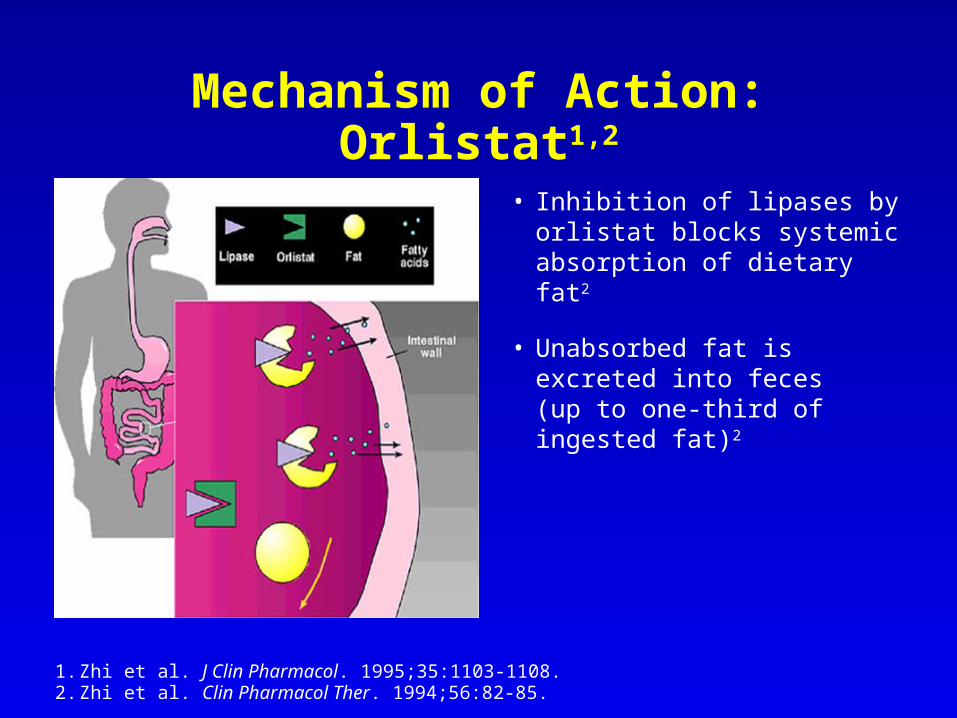
Mechanism of Action: Orlistat1,2
1. Zhi et al. J Clin Pharmacol. 1995;35:1103-1108. 2. Zhi et al. Clin Pharmacol Ther. 1994;56:82-85.
• Inhibition of lipases by orlistat blocks systemic absorption of dietary fat2
• Unabsorbed fat is excreted into feces (up to one-third of ingested fat)2

Three-Month Tolerability of Orlistat in Adolescents with Obesity-Related
Comorbid ConditionsMcDuffie JR, Calis KA, Uwaifo GI, Sebring NG,
Fallon EM, Hubbard, Yanovski JA.
Obesity Research. 2002;10:642-650
Objective
• Study safety, tolerability, and potential efficacy of orlistat in adolescents with obesity and its comorbid conditions
Mc Duffie JR, et al. Obesity Research. 2002;10:642-650.
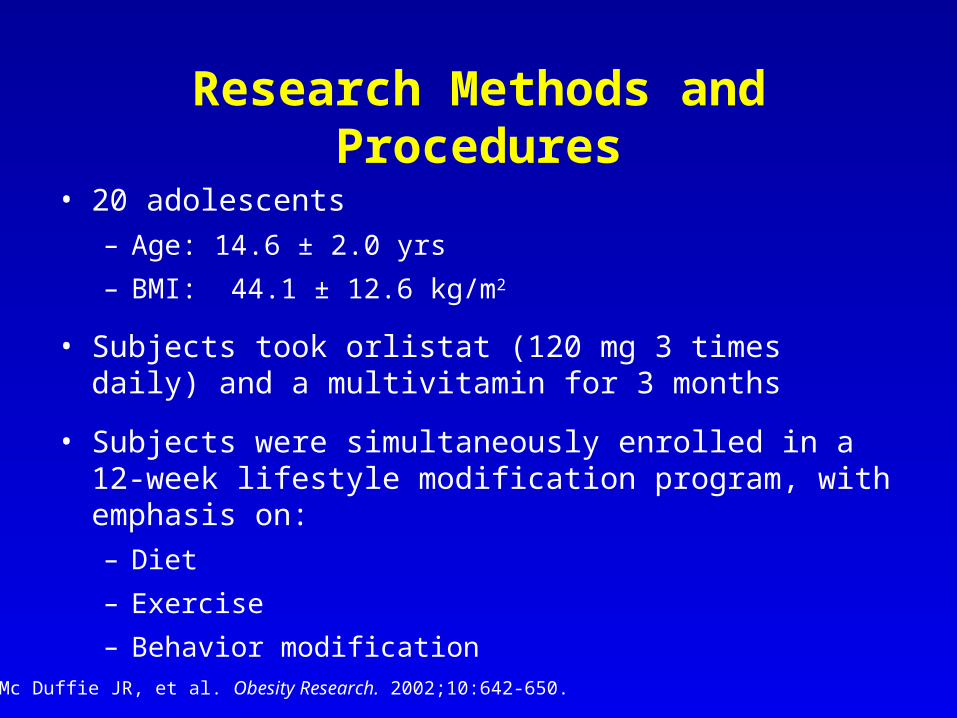
Research Methods and Procedures
• 20 adolescents
– Age: 14.6 ± 2.0 yrs
– BMI: 44.1 ± 12.6 kg/m2
• Subjects took orlistat (120 mg 3 times daily) and a multivitamin for 3 months
• Subjects were simultaneously enrolled in a 12-week lifestyle modification program, with emphasis on:
– Diet
– Exercise
– Behavior modification
Mc Duffie JR, et al. Obesity Research. 2002;10:642-650.
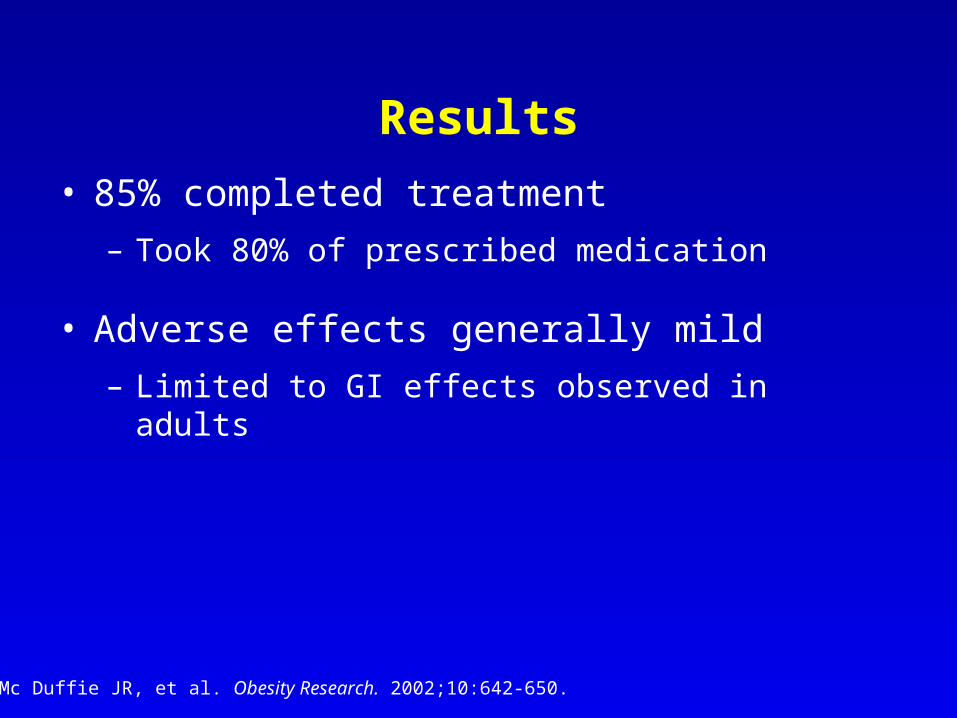
Results
• 85% completed treatment
– Took 80% of prescribed medication
• Adverse effects generally mild
– Limited to GI effects observed in adults
Mc Duffie JR, et al. Obesity Research. 2002;10:642-650.
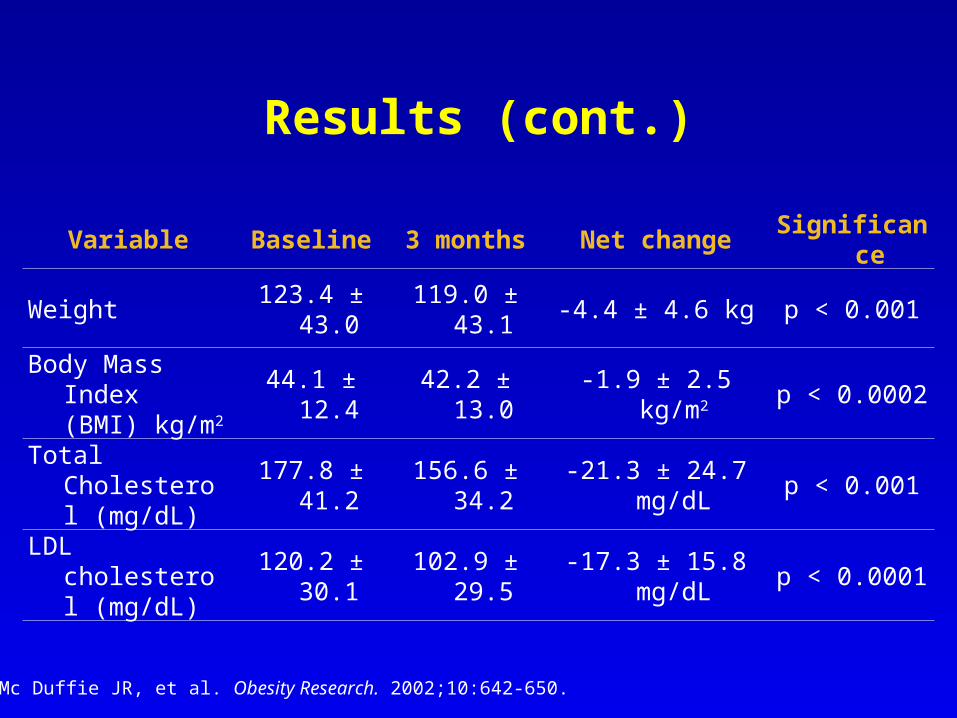
Results (cont.)
Variable Baseline 3 months Net change Significance
Weight 123.4 ± 43.0 119.0 ± 43.1 -4.4 ± 4.6 kg p < 0.001
Body Mass Index (BMI) kg/m2 44.1 ± 12.4 42.2 ± 13.0 -1.9 ± 2.5 kg/m2 p < 0.0002
Total Cholesterol (mg/dL)
177.8 ± 41.2 156.6 ± 34.2 -21.3 ± 24.7 mg/dL p < 0.001
LDL cholesterol (mg/dL)
120.2 ± 30.1 102.9 ± 29.5 -17.3 ± 15.8 mg/dL p < 0.0001
Mc Duffie JR, et al. Obesity Research. 2002;10:642-650.
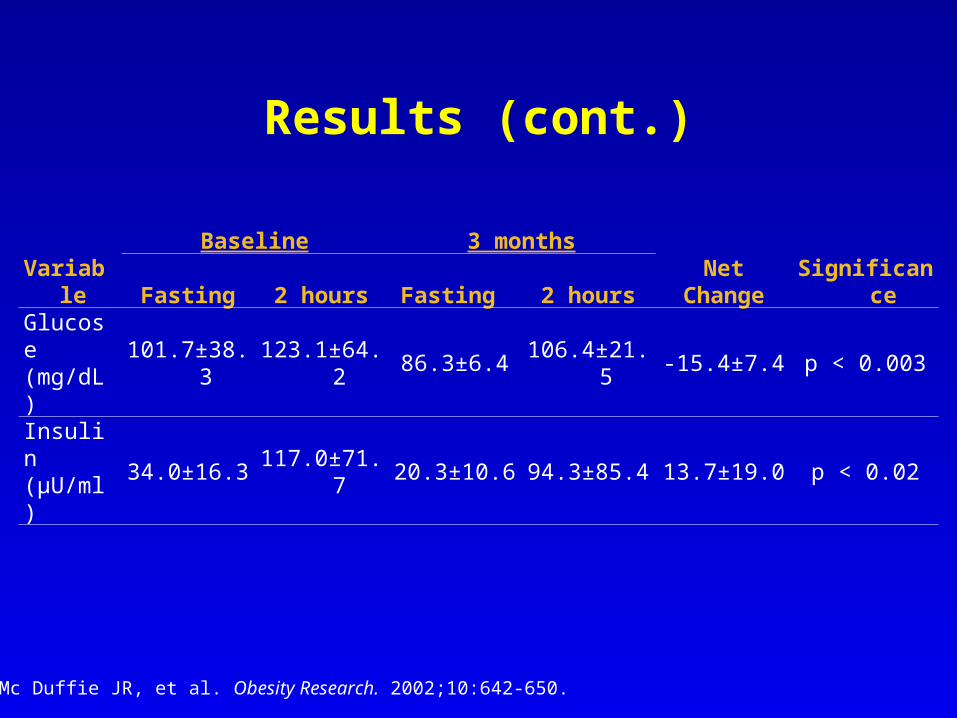
Results (cont.)
Variable Baseline 3 months
Net Change SignificanceFasting 2 hours Fasting 2 hours
Glucose (mg/dL)
101.7±38.3 123.1±64.2 86.3±6.4 106.4±21.5 -15.4±7.4 p < 0.003
Insulin (µU/ml)
34.0±16.3 117.0±71.7 20.3±10.6 94.3±85.4 13.7±19.0 p < 0.02
Mc Duffie JR, et al. Obesity Research. 2002;10:642-650.

Summary• Comorbid conditions associated with obesity in this patient sample
included: – Hyperinsulinemia: 100%
– Hyperlipidemia: 20%
– Hypertension: 10%
– Type 2 diabetes: 5%
– Impaired glucose tolerance: 5%
• In adolescents, short-term treatment with orlistat in the context of a behavioral program is well-tolerated and has a side effect profile similar to that observed in adults
• True benefit versus conventional therapy remains to be determined in placebo-controlled trials
Mc Duffie JR, et al. Obesity Research. 2002;10:642-650.
Conclusions
• Overweight is defined by BMI ≥ 95th percentile for age and gender
• Increased co-morbidities, including metabolic syndrome and type 2 diabetes mellitus with increasing BMI
• Increasing prevalence of overweight among youth
• Overweight tracks from childhood to adulthood

• Additive effects of behavior + sibutramine in adolescents for weight loss by month 6 in teens
• Continuation of sibutramine resulted in maintenance of weight loss by month 12
• Blood pressure and pulse effects (n = 19), similar to those in adults, resolved through dose reduction (n = 15) in BT + sibutramine group
• Significant improvements in lipids, insulin and HOMA
• Orlistat: Promising initial uncontrolled study of weight loss with orlistat
• Orlistat: improvements in lipids, insulin
Conclusions


