44
ADOLESCENT SMOKING, DRINKING AND DRUG USE Susan McVie Paul Bradshaw Centre for Law and Society University of Edinburgh The Edinburgh Study of Youth Transitions and Crime 2005

ADOLESCENT SMOKING, DRINKING
AND DRUG USE
Susan McVie
Paul Bradshaw
Centre for Law and Society
University of Edinburgh
The Edinburgh Study of Youth Transitions and Crime
2005

Copyright © 2005 Centre for Law and Society, The University of Edinburgh
Published 2005 by Centre for Law and Society
The University of Edinburgh
Old College
Edinburgh
EH8 9YL
All rights reserved.
The views expressed in this report do not represent those of The Edinburgh
Study’s funding bodies or of The University of Edinburgh.
Limited extracts from the text may be reproduced provided the source is acknowl-
edged. For more extensive reproduction please contact The Edinburgh Study of
Youth Transitions and Crime, B.07 Old College, South Bridge, Edinburgh EH8 9YL.
Further printed copies of this report are available, priced £10. To order, please con-
tact the Edinburgh Study of Youth Transitions and Crime, B07 Old College, South
Bridge, Edinburgh EH8 9YL.
A PDF version of the report is also available to download, free of charge, from our
website at www.law.ed.ac.uk/cls/esytc

3
KEY FINDINGS
Tobacco smoking, alcohol consumption and drug use all rose dramatically between
ages 12 and 15, although there was a particularly sharp increase around age 13 to 14.
Girls were more likely than boys to smoke from age 13 and drink alcohol from age
14, and equally likely to take drugs from age 14.
Age of starting was lowest for alcohol, followed by smoking and then illicit drug use.
Early experimentation resulted in behavioural continuity for all three substances,
demonstrated by the high proportion of drinkers, smokers and drug users at age 12
who continued to report such behaviours at subsequent sweeps.
Alcohol, tobacco and illicit drug use are closely inter-related and demonstrate a high
level of dose-dependence, whereby increased frequency of use of one coincides with
increased frequency of use of the other. Within each substance type, there is evidence
of sequential progression from occasional use at one age to regular use later.
Multiple substance users report higher levels of delinquency and victimisation; higher
impulsivity and lower self-esteem; greater involvement in unconventional activities;
weaker parental supervision and stronger peer influence than single substance users
and non-users.
These findings are supportive of policies that recognise the close links between to-
bacco, alcohol and illicit drug use and ensure that education or health-based initiatives
involve an integrated response. Early intervention may be most effective in terms of
preventing continued and more serious misuse in later adolescence.

4
INTRODUCTION
The purpose of this paper is to explore the relationships and inter-dependence be-
tween tobacco, alcohol and illicit drug use in adolescence and the characteristics of
substance users. It draws on the findings of the Edinburgh Study of Youth Transitions
and Crime, a longitudinal research programme exploring pathways in and out of of-
fending for a cohort of around 4,300 young people who started secondary school in
the City of Edinburgh in 1998. The key aims and methods of the study are summa-
rised below1.
Aims of the programme
• To investigate the factors leading to involvement in offending and desistance from it
• To examine the striking contrast between males and females in criminal offending
• To explore the above in three contexts:
- Individual development
- Interactions with forma l agencies of control
- The social and physical structures of neighbourhoods
• To develop new theories explaining offending behaviour and contribute to practical policies
targeting young people
Overview of methods
• Self report questionnaires (annual sweeps)
• Semi-structured interviews (40 undertaken in sweep 2)
• School, social work, children’s hearings records (annual sweeps)
• Teacher questionnaires (1999)
• Police juvenile liaison officer and Scottish criminal records (from 2002)
• Parent survey (2001)
• Geographic information system
Participating schools
• All 23 state secondary schools
• 8 out of 14 independent sector schools
• 9 out of 12 special schools
Response Rates
• Sweep 1 - 96.2% (n=4,300)
• Sweep 2 - 95.6% (n=4229)
• Sweep 3 - 95.2% (n=4296)
• Sweep 4 - 92.6% (n=4144)
• Sweep 5 - 89.1% (n=3856)
• Sweep 6 - 80.5% (n=3525)
Research Team
• David Smith, Lesley McAra
• Susan McVie, Lucy Holmes, Jackie Palmer, Paul Bradshaw (left 2003)
Study Funding
• Economic and Social Research Council (1998 - 2002)
• The Scottish Executive (2002- 2005)
• The Nuffield Foundation (2002 - 2006)
1 See also Smith et al (2001) and Smith and McVie (2003) for further details of the Study.

5
Context
Alcohol, tobacco and illicit drug use are widely recognised as major problems in Scot-
land. A recent survey of Scottish adults (Shaw et al 2000) indicated that around 93
per cent of men and 88 per cent of women drink alcohol at least occasionally, and al-
most 1 in 3 men and 1 in 6 women regularly exceed the recommended weekly con-
sumption limits. The same survey found that 34 per cent of Scottish adults smoked
cigarettes, with 14 per cent of men and 11 per cent of women considered to be
‘heavy’ smokers2.
While illicit drug use is less common than drinking alcohol or smoking, recent evi-
dence suggests that prevalence of drug use in Scotland is increasing, especially
amongst young people. The Scottish Schools Adolescent Lifestyle and Substance Use
Survey (SALSUS) carried out in 2002 found that 33 per cent of 15 year-olds had used
drugs in the last year (Currie et al 2003), which compares to around 23 per cent in the
late 1980s and only 10 per cent in the 1970s (Plant 1992). Patterns of drug use also
differ dramatically by age. The 2003 Scottish Crime Survey found that whilst only 9
per cent of all Scottish adults (aged 16 to 59) had used illicit drugs in the last year,
this figure was as high as 24 per cent amongst 16 to 19 year olds and 28 per cent for
20 to 24 year olds (McVie et al 2004).
The Scottish government’s concern about substance misuse has been acknowledged
through the publication of a number of policy and consultation documents which set
out key strategies to tackle these three problematic health behaviours amongst the
Scottish population. The UK-wide white paper ‘Smoking Kills’ published in 1998
was instrumental in informing the subsequent anti-smoking strategy in Scotland, in-
cluding programme, service and policy development. Yet according to a recent re-
port, “smoking remains the biggest single cause of preventable illness and premature
death in Scotland” (NHS Health Scotland and ASH Scotland 2003). Increasing con-
cern about the public health impact and costs of tobacco smoking has resulted in the
recent implementation of a Tobacco Control Action Plan overseen by a Ministerial
Working Group (Scottish Executive 2004).
Similarly, alcohol misuse was labelled one of the most serious health and social issues
in Scotland in a series of documents issued by the Scottish Office in 1989 and 1992,
which was followed by the publication of the Sensible Drinking Report in 1995. On-
going concern prompted the Scottish Office to establish an Action Plan Working
Group in 1997 to further examine the extent and nature of alcohol misuse in Scotland.
Following a considerable period of investigation and consultation (see for example
Lancaster and Duddleston 2002; Potter 2002; Sewell 2002; Reid Howie Associates
2001) the government launched a national Plan for Action on Alcohol Problems in
January 2002 (Scottish Executive 2002a), followed in September of the same year by
a service framework document aimed at helping practitioners to plan, commission and
manage support and treatment services for the Scottish public (Scottish Executive
2002b).
During the last decade, the most significant policy interest has focused on drug use
(Scottish Affairs Committee, 1994; Scottish Office, 1994, 1998, 1999a). The UK
2 Heavy smokers were defined as smoking 20 or more cigarettes per day.

6
government’s 10 year strategy for tackling drug misuse was published in April 1998,
however, Scotland produced its own strategy document Tackling Drugs in Scotland:
Action in Partnership in March 1999 (Scottish Office, 1999b). A primary focus of
this strategy document is to address substance use amongst young people by helping
“young people resist drug misuse in order to achieve their full potential in society”
and a key UK objective is to “reduce the proportion of people under 25 reporting use
of illegal drugs in the last month and previous year” (Scottish Office, 1999b).
Since this strategy was introduced, approximately £100 million has been allocated to
tackle the problem of drug use in Scotland; the country has seen a proliferation of ini-
tiatives set up to address prevention, treatment and rehabilitation, including the estab-
lishment of Drug Action Teams; and a variety of policy documents reporting on the
government’s progress in this area have been published (Scottish Executive, 2000,
2001; Scottish Parliament, 2000). To support the evidence based approach of the Ex-
ecutive, a wide range of statistical data have been collected and research studies have
been commissioned, focusing on the prevalence, health impact and criminal justice
aspects of drugs misuse.
All of these strategies make particular reference to addressing the problem of sub-
stance use amongst Scotland’s young people, although policy continues to be largely
focused on smoking, drinking and drug use as separate issues. An important strand of
research on adolescent substance misuse, however, focuses on the inter-relationship
between each of the three substances - alcohol, tobacco and illicit drugs – and a num-
ber of studies have identified strong links between the use of one substance and the
concomitant use of one or two others (Everett et al 1998; Best et al 2000; Wadsworth
et al 2004).
Using longitudinal data from the Edinburgh Study of Youth Transitions and Crime,
this findings paper examines sequences and patterns of substance use over time and
how this affects the inter-relationship between the substances and multiple substance
use behaviour. The paper concludes with a general discussion of the issues raised and
makes some recommendations for government policy.
Structure of the report
The first part of this findings paper examines the extent of substance use amongst the
Edinburgh Study cohort from sweeps one to four of the study (covering the period
when the cohort were aged on average 12 to 15), describing the trends in prevalence
and frequency of substance use in the early teenage years and focusing particularly on
gender differences.3 The second part examines the various inter-relationships be-
tween alcohol, tobacco and illegal drug use and tracks the most common sequences of
substance use. Part three looks at some of the key characteristics of four different
substance user sub-groups (differentiated by variety of substance use) and examines
the extent to which these characteristics are predictive of greater involvement in sub-
stance abuse. The paper concludes with a brief review of the key findings from this
analysis and presents some broad policy implications.
3 Analysis in this paper is restricted to those who responded at all four sweeps of the study (n=3837).
7
PART 1: PREVALENCE OF SUBSTANCE USE
Prevalence of smoking cigarettes
At each sweep of the Edinburgh Study, respondents were asked about their frequency
of cigarette smoking as shown in panel 1 (anyone who had not smoked a whole ciga-
rette was treated as a non-smoker). Although the question asked at sweep one dif-
fered from that used at later sweeps, it is useful to include the data from this sweep as
a point of reference.
Panel 1: Questions on smoking cigarettes
Sweep one
Which of these statements best describes you?
• I have never tried a cigarette (not even a puff)
• I have tried smoking cigarettes, but I don’t smoke now
• I smoke cigarettes, but less than once a week
• I smoke cigarettes at least once a week
• I smoke cigarettes every day
Sweeps two to four
How often do you smoke now?
• Every day
• At least once a week
• At least once a month
• Hardly ever/never
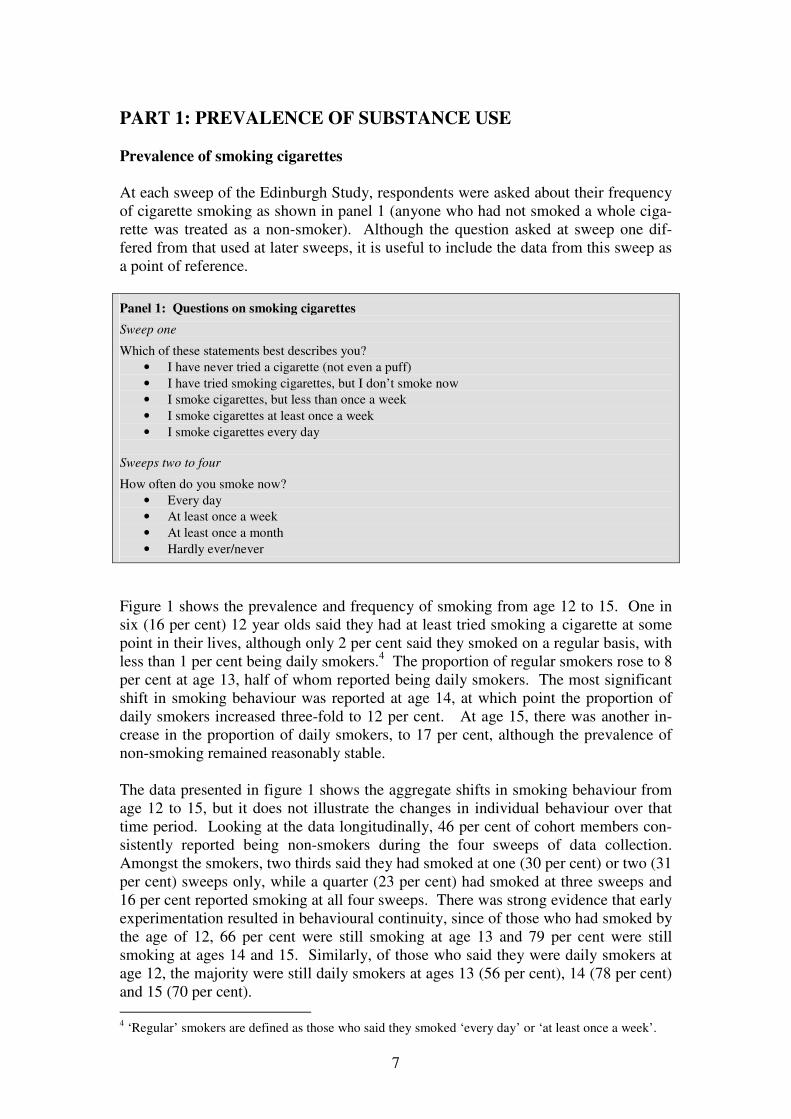
Figure 1 shows the prevalence and frequency of smoking from age 12 to 15. One in
six (16 per cent) 12 year olds said they had at least tried smoking a cigarette at some
point in their lives, although only 2 per cent said they smoked on a regular basis, with
less than 1 per cent being daily smokers.4 The proportion of regular smokers rose to 8
per cent at age 13, half of whom reported being daily smokers. The most significant
shift in smoking behaviour was reported at age 14, at which point the proportion of
daily smokers increased three-fold to 12 per cent. At age 15, there was another in-
crease in the proportion of daily smokers, to 17 per cent, although the prevalence of
non-smoking remained reasonably stable.
The data presented in figure 1 shows the aggregate shifts in smoking behaviour from
age 12 to 15, but it does not illustrate the changes in individual behaviour over that
time period. Looking at the data longitudinally, 46 per cent of cohort members con-
sistently reported being non-smokers during the four sweeps of data collection.
Amongst the smokers, two thirds said they had smoked at one (30 per cent) or two (31
per cent) sweeps only, while a quarter (23 per cent) had smoked at three sweeps and
16 per cent reported smoking at all four sweeps. There was strong evidence that early
experimentation resulted in behavioural continuity, since of those who had smoked by
the age of 12, 66 per cent were still smoking at age 13 and 79 per cent were still
smoking at ages 14 and 15. Similarly, of those who said they were daily smokers at
age 12, the majority were still daily smokers at ages 13 (56 per cent), 14 (78 per cent)
and 15 (70 per cent).
4 ‘Regular’ smokers are defined as those who said they smoked ‘every day’ or ‘at least once a week’.
8
0%
20%
40%
60%
80%
100%
Up to age 12 Age 13 Age 14 Age 15
Of cohort
mem
bers
Smoked daily
Smoked weekly
Smoked less than weekly
Not smoked
Figure 1: Prevalence and frequency of cigarette smoking, by age
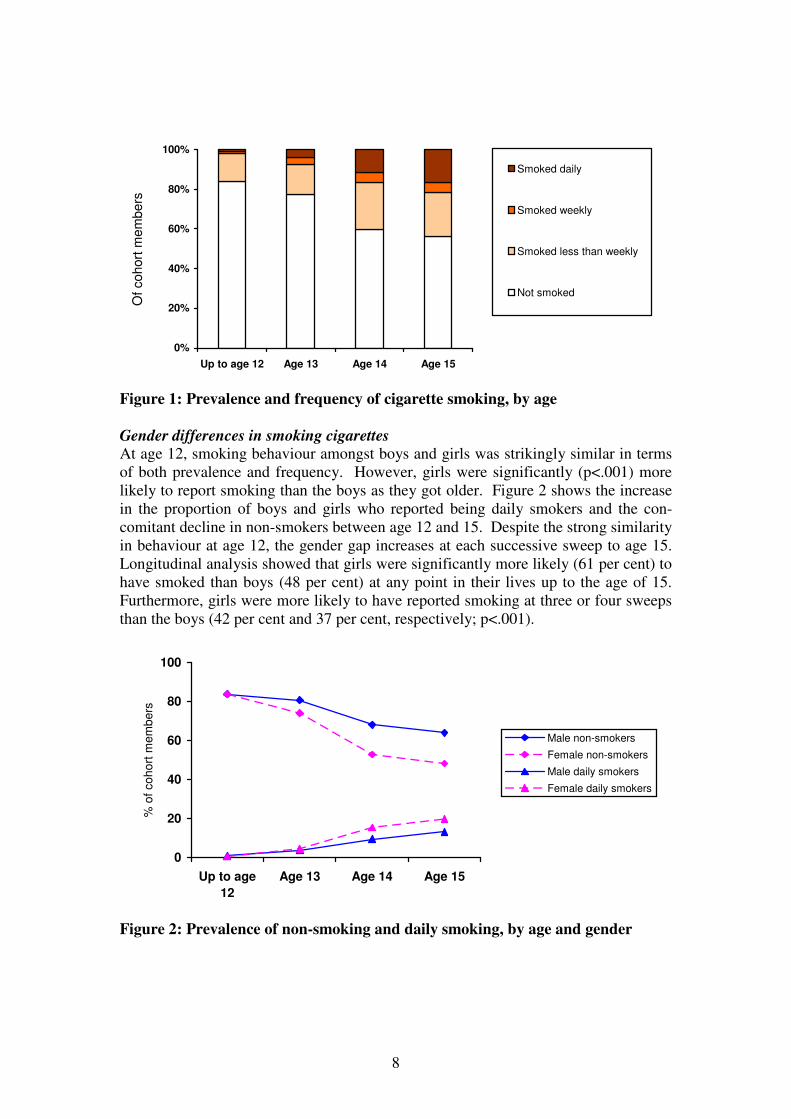
Gender differences in smoking cigarettes At age 12, smoking behaviour amongst boys and girls was strikingly similar in terms
of both prevalence and frequency. However, girls were significantly (p<.001) more
likely to report smoking than the boys as they got older. Figure 2 shows the increase
in the proportion of boys and girls who reported being daily smokers and the con-
comitant decline in non-smokers between age 12 and 15. Despite the strong similarity
in behaviour at age 12, the gender gap increases at each successive sweep to age 15.
Longitudinal analysis showed that girls were significantly more likely (61 per cent) to
have smoked than boys (48 per cent) at any point in their lives up to the age of 15.
Furthermore, girls were more likely to have reported smoking at three or four sweeps
than the boys (42 per cent and 37 per cent, respectively; p<.001).
0
20
40
60
80
100
Up to age
12
Age 13 Age 14 Age 15
% o
f co
ho
rt m
em
be
rs
Male non-smokers
Female non-smokers
Male daily smokers
Female daily smokers
Figure 2: Prevalence of non-smoking and daily smoking, by age and gender

9
Prevalence of drinking alcohol
As with smoking, respondents were asked about how often they drank alcohol as
shown in panel 2 (anyone who had not drunk a whole glass, can or small bottle of al-
cohol was treated as a non-drinker). Again, the question used at sweep one was
slightly different from those at later sweeps, but the categories can be collapsed to be
broadly comparable with later sweeps.
Panel 2: Questions on drinking alcohol
Sweep one
Which of these statements best describes you?
• I have never tried an alcoholic drink (not even a sip)
• I have tried drinking alcohol, but I don’t drink now
• I drink alcohol, but only on special occasions
• I drink alcohol, but less than once a month
• I drink alcohol at least once a month
• I drink alcohol at least once a week
Sweeps two to four
How often do you drink alcohol now?
• At least once a week
• At least once a month
• Only on special occasions
• Hardly ever/never
Drinking alcohol was more common than cigarette smoking amongst the Edinburgh
Study cohort, as illustrated in figure 3 which shows the prevalence and frequency of
alcohol consumption from age 12 to 15. Already by age 12, almost half (45 per cent)
of the cohort admitted that they had drunk a whole alcoholic drink at least once. For
the majority this had occurred only on special occasions (such as Christmas or New
Year celebrations), although one in twenty respondents reported themselves to be
regular drinkers5 and just over 1 per cent said they were weekly consumers of alcohol.
At age 13, the proportion of non-drinkers fell only slightly, but amongst those who
reported drinking there was a four-fold increase in the prevalence of regular alcohol
use with 10 per cent drinking at least monthly and 6 per cent on a weekly basis. As
with smoking, the most dramatic shift in drinking behaviour occurred at age 14, with
a large drop in the proportion who had not drank alcohol in the last year and substan-
tial rise in the prevalence of both weekly (17 per cent) and monthly (20 per cent) al-
cohol use. Prevalence of regular alcohol use increased further at age 15, with half of
the cohort drinking alcohol either weekly (24 per cent) or at least monthly (25 per
cent).
5 Regular drinkers are defined as those who said they drank ‘at least once a week’ or ‘at least once a
month’.

10
0%
20%
40%
60%
80%
100%
Up to age 12 Age 13 Age 14 Age 15
Of cohort
mem
bers
Drink weekly
Drink monthly
Drink hardly ever/specialoccasions
Non-drinkers
Figure 3: Prevalence and frequency of alcohol consumption, by age
Once again, a longitudinal look at the data reveals more detailed information about
the drinking behaviour of individuals. A staggering 91 per cent of all cohort members
revealed that they had drunk at least one whole alcoholic drink by the age 15. Of
these, only 12 per cent reported drinking alcohol at just one sweep of the study, while
a further 26 per cent said they had consumed alcohol at two of the four sweeps. Al-
most a third (29 per cent) of all drinkers stated that they had drunk at least one alco-
holic drink at three sweeps of the study. However, the greatest proportion (34 per
cent) stated that they had consumed alcohol at all four sweeps. As with smoking,
early experimentation with alcohol precipitated a high degree of continuity over time.
Of those who had drunk alcohol by the age of 12, 74 per cent reported drinking at age
13 and over 90 per cent were still drinking at ages 14 and 15. Similarly, of those who
said they were weekly drinkers at age 12, over half of them were still weekly drinkers
at age 13 (51 per cent), 14 (59 per cent) and 15 (51 per cent).
Adverse effects of drinking alcohol Reporting information about the frequency with which individuals consume alcohol is
valuable, but it does not indicate the extent to which drinking alcohol has adverse
consequences on the respondents’ lives. In order to measure the possible adverse ef-
fects, a scaled down and slightly altered version of the Rutgers Alcohol Problem In-
dex (RAPI) was included in the questionnaire at sweep 4 (White and Labouvie 1989).
In full, the 23-item RAPI is used as a screening tool for assessing adolescent problem
drinking. Space restrictions did not allow for the inclusion of the full instrument in
the Edinburgh Study questionnaire; instead a seven-item instrument was constructed,
tested and validated (see panel 3 below).

11
Panel 3: Shortened RAPI to measure the adverse effects of drinking alcohol
In the last year, how many times have these things happened to you while you were drinking alcohol or
because you had been drinking alcohol?
• I got into fights or caused trouble
• I spent too much money on alcohol
• I missed a day (or part of a day) at school
• I tried to cut down or stop drinking
• I can’t remember some of the things I did
• A friend or family member told me to stop or cut down on my drinking
• I was so drunk I felt sick or dizzy or fell over
Response options: never, once or twice, 3 or 4 times, 5 times or more.
Table 1 presents the reported adverse outcomes for those who reported drinking alco-
hol at sweep 4 of the study. For most of these measures, the majority of drinkers re-
ported that they had not suffered an adverse outcome during the course of the last
year. However, for a substantial minority, alcohol consumption had had some recog-
nised adverse effect on their behaviour or lives, and this effect was extreme for a very
small proportion of respondents. Around a quarter of drinkers had been involved in
fights or troublemaking at least once as a result of their drinking and around a third
admitted spending too much money on alcohol. Around 1 in 10 drinkers had missed
school at least once, a sizeable proportion on five or more occasions. The problematic
nature of their drinking behaviour was so bad for around a fifth that they had tried at
least once to cut down on or stop their drinking altogether; while others stated that a
friend or family member had advised them to do so.
Table 1: Prevalence of adverse effects after drinking alcohol at sweep four
Row percentages
Per cent of 15 year olds who drank
alcohol in last year (n=3196)
Never Once or
twice
3 or 4
times
5 times
or more
I got into fights or caused trouble 73 20 4 3
I spent too much money on alcohol 67 23 6 5
I missed a day or part of a day at school 88 7 2 3
I tried to cut down or stop drinking 80 14 3 3
I couldn’t remember some of the things
I had done 51 31 10 8
A friend or family member told me to
stop or cut down on my drinking 86 9 3 3
I was so drunk I felt sick or dizzy or fell
over 54 26 10 10
Note: Rows may not total 100% due to rounding.
The most commonly reported adverse effects were the more immediate physiological
consequences of drinking. Around a half said they couldn’t remember some of things
they had done after drinking, and a similar proportion admitted to being so drunk in
the last year that they had been sick, dizzy or fallen over. This figure represents a
slight increase from sweep 2, at which point 40 per cent of all drinkers admitted to
being drunk at least once. There was, however, a bigger increase in the proportion

12
who reported being drunk five times or more which rose from 5 per cent at sweep 2 to
10 per cent at sweep 4.
Gender differences in drinking alcohol In simple prevalence terms, boys were significantly (p<.001) more likely to start
drinking at an earlier age, with 50 per cent saying that they had drunk alcohol by the
age of 12 compared with 41 per cent of girls. By age 13, the girls had caught up and
there was no significant difference in the proportion of boys (52 per cent) and girls
(51 per cent) who reported drinking alcohol during the last year. Thereafter, girls
were significantly more likely (p<.01) to report drinking alcohol during the last year
at ages 14 (82 per cent) and 15 (88 per cent) than the boys (78 per cent and 81 per
cent, respectively).
A similar pattern emerged in terms of frequency of alcohol consumption, as shown in
figure 4. Boys were more likely (p<.01) to drink alcohol every week than girls at age
12, but there was no gender difference at age 13 or 14 and the girls actually overtook
the boys at age 15, with 27 per cent of girls saying they consumed alcohol at least
once a week in comparison with 22 per cent of boys (p<.01).
0
20
40
60
80
Up to age
12
Age 13 Age 14 Age 15
% o
f co
ho
rt m
em
be
rs
Male non-drinkers
Female non-drinkers
Male weekly drinkers
Female weekly drinkers
Figure 4: Prevalence of non-drinking and weekly drinking, by age and gender
Despite these shifts in behavioural patterns over time, girls and boys were just as
likely to report that they had drunk alcohol at all over the four sweeps of the study (92
per cent compared with 90 per cent, respectively); and there was no difference in the
number of sweeps of the study at which boys and girls had reported drinking (58 per
cent of boys said they had drunk alcohol at 3 or 4 sweeps compared with 57 per cent
of girls, for example).

13
Prevalence of illicit drug use
Essentially the same question was asked at each of the four sweeps about illicit drug
use, although the time period was slightly different as shown in panel 4. Those who
said they had taken or tried a drug were routed towards a list of specific drugs and
asked how often they had used each of them. Volatile substances (glue, gas or sol-
vents) were included in the list of ‘drugs’ rather than asked about separately and, for
ease of exposition, the term ‘drug use’ refers to both drug and volatile substance use
throughout this report.
Panel 4: Questions on drug use
Sweep one
Have you ever tried an illegal drug (that includes sniffing gas or glue)?
Sweeps two to four
During the last year, did you take or try any illegal drugs (that includes sniffing gas or glue)?
(If yes) How often have you tried each of these drugs?
• Cannabis
• Glue, gas or solvents
• Ecstasy
• Cocaine
• Speed
• Heroin
• LSD
• Magic mushrooms
• Downers
• Poppers
• Something else
Response options: never, once, 2 or 3 times, 4 times or more
Prevalence of illicit drug use was far lower than for smoking and drinking, but dis-
played a similar increase in occurrence as the cohort got older. At age 12, 6 per cent
of respondents reported that they had used an illegal drug or solvent at least once in
their lives; rising slightly to 7 per cent at age 13. As with both smoking and drinking
behaviour, the most dramatic rise in prevalence of drug use occurred between ages 13
and 14, during which time a fifth (20 per cent) of respondents reportedly took either
an illegal drug or some kind of solvent. This was followed by another significant rise
in prevalence to almost a third (31 per cent) at age 15. Over the course of the four
sweeps, 37 per cent of respondents stated that they had taken a drug at least once. Of
the users, exactly half reported doing so at just one sweep, while a further 34 per cent
had taken a drug at two of the four sweeps. Only 5 per cent of cohort members re-
ported taking a drug at all four sweeps of the study.
Types of drugs used The most commonly reported substances, overall, were cannabis and volatile sub-
stances, although there were dramatic changes in prevalence over time for both of
these substances. Figure 5 shows the general change in patterns of drug use over the
course of the four sweeps amongst those who reported using drugs at least once at
each sweep. This graph focuses on the proportion of drug users who reported taking
14
cannabis, volatile substances or some other drug at each sweep, since the numbers in
each of the other categories were very small.6
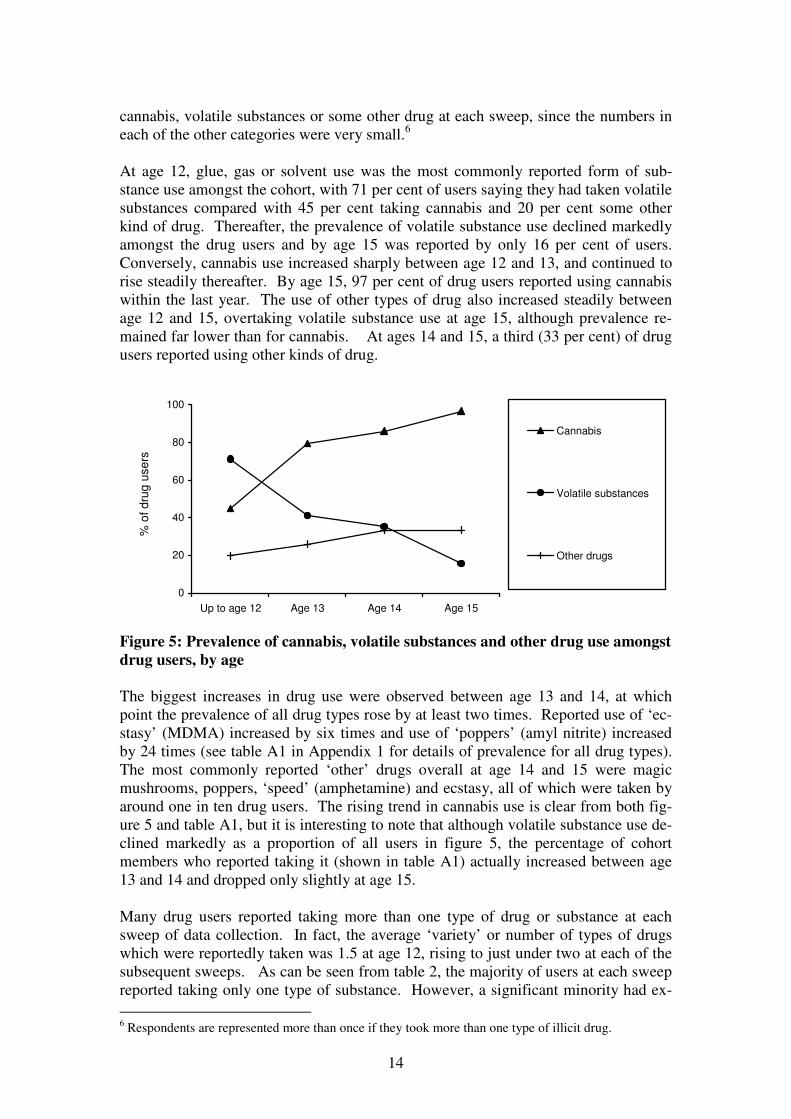
At age 12, glue, gas or solvent use was the most commonly reported form of sub-
stance use amongst the cohort, with 71 per cent of users saying they had taken volatile
substances compared with 45 per cent taking cannabis and 20 per cent some other
kind of drug. Thereafter, the prevalence of volatile substance use declined markedly
amongst the drug users and by age 15 was reported by only 16 per cent of users.
Conversely, cannabis use increased sharply between age 12 and 13, and continued to
rise steadily thereafter. By age 15, 97 per cent of drug users reported using cannabis
within the last year. The use of other types of drug also increased steadily between
age 12 and 15, overtaking volatile substance use at age 15, although prevalence re-
mained far lower than for cannabis. At ages 14 and 15, a third (33 per cent) of drug
users reported using other kinds of drug.
0
20
40
60
80
100
Up to age 12 Age 13 Age 14 Age 15
% o
f d
rug
use
rs
Cannabis
Volatile substances
Other drugs
Figure 5: Prevalence of cannabis, volatile substances and other drug use amongst
drug users, by age
The biggest increases in drug use were observed between age 13 and 14, at which
point the prevalence of all drug types rose by at least two times. Reported use of ‘ec-
stasy’ (MDMA) increased by six times and use of ‘poppers’ (amyl nitrite) increased
by 24 times (see table A1 in Appendix 1 for details of prevalence for all drug types).
The most commonly reported ‘other’ drugs overall at age 14 and 15 were magic
mushrooms, poppers, ‘speed’ (amphetamine) and ecstasy, all of which were taken by
around one in ten drug users. The rising trend in cannabis use is clear from both fig-
ure 5 and table A1, but it is interesting to note that although volatile substance use de-
clined markedly as a proportion of all users in figure 5, the percentage of cohort
members who reported taking it (shown in table A1) actually increased between age
13 and 14 and dropped only slightly at age 15.
Many drug users reported taking more than one type of drug or substance at each
sweep of data collection. In fact, the average ‘variety’ or number of types of drugs
which were reportedly taken was 1.5 at age 12, rising to just under two at each of the
subsequent sweeps. As can be seen from table 2, the majority of users at each sweep
reported taking only one type of substance. However, a significant minority had ex-
6 Respondents are represented more than once if they took more than one type of illicit drug.

15
perimented with 2 or more types of substance and the likelihood of doing so increased
with age.
Table 2: Variety of drug use amongst drug users, by age Column percentages
Number of types of
drugs taken
Age 12
(n=187)
Age 13
(n=241)
Age 14
(n=652)
Age 15
(n=1048)
One 73 66 60 64
Two 14 20 19 19
Three 6 5 10 7
Four 3 2 5 3
Five or more 4 7 7 8 Note: column percentages may not total 100 due to rounding.
In terms of the actual number of times drugs were reportedly taken, a conservative
minimum can be estimated by totalling the responses given to the question on how
many times they had taken each type of drug (assigning a value of 2 for those who
had taken a substance ‘2 or 3 times’; and a value of 4 for those who reported taking
drugs ‘4 times or more’)7. This produces an average drug use frequency of 3 times
for drug users at ages 12 and 13; and an average of 4 times for those at ages 14 and
15. Although most drug users had taken only one substance, few respondents admit-
ted to using a substance on only one occasion, as can be seen in table 3. Two in five
drug users said they had only experimented with drugs once up to age 12, but this
proportion had halved by age 15. Correspondingly, one sixth of users said they had
used drugs five times or more up to age 12, but this doubled to almost one in three by
age 15. Bearing in mind that this frequency measure is based on a ‘minimum esti-
mate’ of the real figure, the level of drug use amongst the persistent drug users may
be considerable and shows definite signs of rising as they get older.
Table 3: Frequency of drug use amongst drug users, by age Column percentages
Number of times
used drugs
Age 12
(n=187)
Age 13
(n=241)
Age 14
(n=652)
Age 15
(n=1048)
Once 39 29 22 18
Twice 27 24 20 20
Three times 3 10 6 3
Four times 16 19 24 30
Five times or more 16 19 29 30 Note: column percentages may not total 100 due to rounding.
Although the prevalence of drug use varied considerably by drug type (with cannabis
and volatile substances being by far the most commonly reported), frequency of drug
use varied far less (see table A2 in Appendix 1 for details on all drug types). There
was evidence of an increase in both frequency and prevalence for some drug types,
such as cannabis, speed and heroin. Considerable stability was evident in the fre-
quency of use of other drug types, despite changing levels of prevalence. For exam-
7 The limitations of this method must be noted in terms of trying to estimate a realistic count of drug
taking incidents amongst the cohort. However, such a frequency measure is a useful tool for distin-
guishing amongst the very occasional and the more problematic drug users.

16
ple, the average frequency of volatile substance, magic mushrooms and cocaine use
remained constant at all sweeps despite an increase in prevalence over the same pe-
riod. Although the number of respondents who reported taking some of these drug
types is small, such detailed analysis reveals that there are complex and intricate pat-
terns of drug use at both the individual level and the individual drug level.
Gender differences in illicit drug use Patterns of drug use amongst boys and girls were very similar. Figure 6 shows that
boys were slightly more likely to report taking drugs at each sweep at age 12 (p<.01)
and age 13 (p<.001), although there was no difference at ages 14 and 15. There was
also no difference in the proportion of boys and girls who had reported using a drug at
any point over the four sweeps. Amongst the drug users, boys were more likely
(p<.01) to have used drugs at three (13 per cent) or four (6 per cent) sweeps than girls
(10 per cent and 3 per cent, respectively).
0
5
10
15
20
25
30
35
Up to age 12 Age 13 Age 14 Age 15
% o
f co
ho
rt m
em
be
rs
Boys
Girls
Figure 6: Prevalence of drug use, by age and gender
There was some slight gender difference in the types of drugs used. Amongst the
drug users, boys were more likely (p<.01) to have used cannabis up to age 12 than
girls (55 per cent compared with 31 per cent, respectively), but thereafter girls and
boys were equally likely to use cannabis. Girls, on the other hand, were more likely
to report using volatile substances than the boys up to age 12 (p<.01) and at age 15
(p<.001). There was no significant gender difference in the use of other types of sub-
stance. Similarly, there was little difference in the variety of drugs used or the fre-
quency of drug use. At age 12, boys were more likely than girls (p<.05) to report us-
ing more than one type of drug (1.7 and 1.3, respectively) and to use drugs on more
than one occasion (3.3 compared with 2.3, respectively); thereafter, there was no sig-
nificant difference.

17
Substance use age of onset
In his analysis of the 1998/99 Youth Lifestyles survey data, Pudney (2002) demon-
strated that there were distinct ages of onset for particular types of substances. He
found that alcohol, tobacco and volatile substances had the earliest age of onset, at
around age 14. Drugs such as cannabis and poppers had a mean onset age of around
16; harder drugs, such as heroin, LSD, magic mushrooms and amphetamines started
later at around 17 or 18 years; while ecstasy and cocaine had the highest mean age of
onset at almost 20. Unfortunately, such detailed analysis is not possible within the
context of this report since only four sweeps of data are presented here, so onset later
than age 15 cannot be determined. It is possible to make reliable estimates about
mean age of onset for smoking and drinking, but data from later sweeps will be re-
quired to identify the mean age of onset for the various drug types.
It is possible to look at the distinct patterns of age of onset of cigarette smoking, alco-
hol consumption and drug taking generally amongst the Edinburgh Study cohort up to
age 15. Figure 7 shows the cumulative age of onset for each of the three substance
types. Retrospective information was collected at age 12 on the age at which each
substance had first been used, going back to ‘age 8 or under’. This chart demonstrates
quite clearly the dominant position of alcohol in terms of adolescent experimentation,
with tobacco being the second most commonly used substance and illicit drugs (or
volatile substances) being far less commonly used. Nevertheless, the trends in terms
of increasing use with age are quite clear for all three substance types.
0
20
40
60
80
100
Up to age 8 Age 9-11 Age 11-12 Age 12-13 Age 13-14 Age 14-15
% o
f cohort
mem
bers
Alcohol
Smoking
Drugs
Figure 7: Age of onset of smoking, drinking and drug use
The rate of drinking onset shows a much steeper incline from age 8 up to age 14 than
that for either smoking or drug use. Nevertheless, drinking and smoking appear to
share a common peak age of onset between 13 and 14 years of age, whereas the age of
onset for drug use has clearly not yet peaked by age 15 amongst this cohort. A quar-
ter (24 per cent) of all drinkers, just under a third (31 per cent) of all smokers and just
over a third (36 per cent) of all drug users said they consumed their first whole alco-
holic drink, smoked their first whole cigarette or used their first drug between the ages
of 13 and 14. This age appears to mark a significant turning point in young people’s
lives in terms of problematic health behaviours.

18
After age 14, the rate of onset of both drinking and smoking declined markedly, with
only 7 per cent of drinkers and 17 per cent of smokers starting their respective habits
between ages 14 and 15. This is hardly surprising in the case of drinking, since the
majority of young people had already reported starting to drink before this age. How-
ever, it does suggest in the case of smoking that experimentation is starting to tail off
by around age 15. Conversely, 37 per cent of drug users reported using their first
drug between age 14 and 15, so clearly the age of initial experimentation is consid-
erably higher for illicit drugs. These findings are broadly in line with those of Pudney
(2002).
Two thirds (69 per cent) of drinkers and half (52 per cent) of the smokers in the co-
hort said they had started their respective habit at age 13 or under. Amongst the co-
hort as a whole, this means that 63 per cent of them had drunk a whole alcoholic drink
and 29 per cent of them had smoked a whole cigarette by the age of 13. Age of onset
for drug use was generally higher, but nevertheless around a quarter (27 per cent) of
drug users (10 per cent of the cohort) said they had tried a drug or volatile substance
by age 13. More worryingly, 27 per cent of all drinkers (24 per cent of the cohort)
reported that they had drunk their first whole alcoholic drink at age 10 or under. This
compares with 13 per cent of smokers (7 per cent of cohort members) who said they
started smoking at age 10 or under and 5 per cent of drug users (under 2 per cent of
the cohort) who started using drugs at this age. This shows that a significant minority
of young people start to use substances at a very early age and, on the basis of longi-
tudinal evidence, these individuals have a high likelihood of continuing to do so.
Gender differences in age of onset Although smoking was more prevalent amongst the girls as a whole, it was the boys
who reported starting to smoke at the earliest age bands, with 17 per cent of male
smokers starting at age 10 or under compared with 10 per cent of female smokers.
Nevertheless, girls were equally likely as boys (18 per cent) to start smoking at ages
11 and 12, and thereafter were more likely to start smoking between ages 12 and 14.
Similarly, onset of drinking was much earlier amongst the boys than the girls, with 31
per cent of male drinkers starting at age 10 or under compared with 23 per cent of fe-
male drinkers. There was no difference in the proportion of male and female drinkers
who started consuming alcohol between the ages of 11 and 13, but girls were more
likely to start drinking than boys after age 13. Age of onset of drug use was high for
both boys and girls, with the majority of both sexes reporting taking their first drug
between ages 13 and 15, but there was no gender difference in the age of onset.

19
PART 2: RELATIONSHIPS BETWEEN ALCOHOL, TOBACCO
AND ILLICIT DRUG USE
Part one of this report shows quite distinct differences in the patterns and trends of
tobacco smoking, alcohol consumption and drug use amongst the Edinburgh Study
cohort. However, the high prevalence figures for each indicate that there must be a
large degree of overlap between the three substance types. This part of the report ex-
amines the inter-relationships between these three forms of substance use and ex-
plores developmental sequences in the progression of one level or type of substance
use to another. Analysis in this section is largely focused on those who were classed
as ‘regular’ users (i.e. those who smoked at least once a week, drank alcohol at least
once a month or had either taken more than one type of drug or had used drugs on at
least four occasions).
Individual cohort members were classified according to which types of substance they
reported using, providing eight categories in all for analysis. By far the biggest cate-
gory at each sweep was the ‘non-users’ (i.e. those who either had not used any of the
three substances, or had done so but not frequently enough to be defined as a regular
user). The proportion of cohort members in some of the other categories was very
small, particularly at the first sweep (see table A3 in Appendix 1 for an exact break-
down of the figures). Therefore, figure 8 presents the prevalence levels for four main
user sub-groups: those who reported being non-users (including non-regular users);
those who reported being regular users of a single substance only; those who said they
regularly used two substances; and those who reported regular use of all three sub-
stances.
Two obvious general trends are evident from figure 8. First, in line with the general
trends for each type of substance, the prevalence of non-regular substance users de-
clined markedly over time, from 94 per cent at age 12 to 46 per cent at age 15. Sec-
ond, the proportion of cohort members reporting regular single or multiple substance
use increased concurrently 8, and had possibly not yet peaked by age 15.
0
20
40
60
80
100
Up to age 12 Age 13 Age 14 Age 15
% o
f cohort
Non-regularuser
Singlesubstanceonly
Twosubstances
Threesubstances
Figure 8: Prevalence of substance use by user sub-group

20
The single substance users predominantly consisted of those who drank alcohol at
least once a month, with smokers and drug users being far less likely to fall into this
group. The single substance sub-group accounted for only 3 per cent of cohort mem-
bers up to age 12 but increased steadily to 26 per cent by age 15. Less than one in
twenty cohort members reported being regular smokers only at any of the four
sweeps, while only one per cent or less said they were drug users only. The propor-
tion of cohort members who reported using two or three substances was considerably
smaller than the number of single users, but clearly they represent a problematic
group. There was very little difference in the proportion of those who were regular
two-substance users (whatever the combination) and those who had reported using all
three substances on a regular basis. Table A3 (in Appendix 1) shows in more detail
the increases in prevalence at each age band for the various combinations of multiple
substance use, although those who reported taking all three substances showed the
greatest increase, from less than one per cent of the cohort at sweep one to 10 per cent
at age 15. There was least increase in the group who smoked and took drugs only.
Alcohol and tobacco
The proportion of cohort members who reported regular drinking and smoking rose
from less than one per cent at age 12 to 16 per cent at age 15. Looking in more detail
at the habits of individual substance users reveals a very strong association between
tobacco and alcohol use. Table 4 shows the proportion of smokers at each age band
who reported being regular, occasional or non-drinkers; and, conversely, the propor-
tion of regular drinkers who reported being regular, occasional or non-smokers. At a
glance, it is evident that regular smokers were more likely to report drinking, on either
a regular or occasional basis, than regular drinkers were to report smoking. Neverthe-
less, the tendency to partake regularly of both substances increased with age. The age
effect was strongest amongst the smokers, illustrated by an increase in the proportion
of regular smokers who were also regular drinkers from around a third at age 12 to
four fifths by age 15. Amongst the regular drinkers there a more modest increase in
prevalence of regular smoking from around one fifth at age 12 to one third at age 14,
before declining at age 15.
Table 4: Inter-relationship between alcohol and tobacco
Row percentages
% regular
drinkers
% occasional
drinkers
% non-drinkers
Of the regular smokers:
Up to age 12
At age 13
At age 14
At age 15
33
57
76
79
54
28
19
15
13
15
5
5
% regular
smokers
% occasional
smokers
% non-smokers
Of the regular drinkers:
Up to age 12
At age 13
At age 14
At age 15
18
27
34
25
37
30
32
29
45
43
34
36 Note: Rows may not total 100 due to rounding

21
More detailed analysis of the frequency of alcohol consumption amongst the smokers,
and cigarette smoking amongst the drinkers, reveals a high degree of dose-
dependence between the two substances which increases in severity with age (see ta-
bles A4 and A5 in Appendix 1 for a detailed breakdown of the figures). At age 12, 28
per cent of daily smokers reported also being weekly drinkers, compared with only 12
per cent of weekly smokers and 3 per cent of occasional smokers. By age 15, 57 per
cent of daily smokers were also weekly drinkers, compared with 46 per cent of
weekly smokers and only 26 per cent of occasional smokers. The reciprocal relation-
ship is similar, although less intense. Up to age 12, 13 per cent of weekly drinkers
said they smoked daily, compared with 4 per cent of monthly drinkers and less than
one per cent of occasional drinkers. By age 15, this had increased such that 39 per
cent of weekly drinkers were daily smokers, compared with 16 per cent of monthly
drinkers and 7 per cent of occasional drinkers. In other words, there was a high de-
gree of contemporaneous association between use of alcohol and tobacco, but regular
smokers were more likely to be regular drinkers than vice versa.
Tobacco and illicit drugs
The proportion of cohort members who both smoked and took drugs rose from 0.6 per
cent at sweep one to 12 per cent at sweep four. As with smoking and drinking, to-
bacco and illicit drug use proved to have a very strong inter-dependent effect, as
shown in table 5. As would be expected smoking was more common amongst the
drug users than drug use was amongst the smokers, although both demonstrated a dis-
tinct age effect. The prevalence of regular smoking amongst the drug users showed a
greater increase than the rise in regular drug use amongst the smokers, although this
may be to a large extent linked to the mode of drug use (since the use of cannabis
would be expected to be combined with tobacco smoking in most cases).
Table 5: Inter-relationship between tobacco and illicit drugs Row percentages
% regular drug
users
% occasional
drug users
% non-drug
users
Of the regular smokers:
Up to age 12
At age 13
At age 14
At age 15
33
25
43
54
14
17
21
22
54
58
36
25
% regular
smokers
% occasional
smokers
% non-smokers
Of the regular drug users:
Up to age 12
At age 13
At age 14
At age 15
34
57
68
66
41
31
25
23
25
12
8
11 Note: Rows may not total 100 due to rounding
The definition of ‘regular drug use’ used here is intended to differentiate between in-
dividuals who have experimented with at least two types of illicit drug or volatile sub-
stance or who have taken it more than just once or twice. However, this is rather a
crude distinction and does not really differentiate between low level and persistent
22
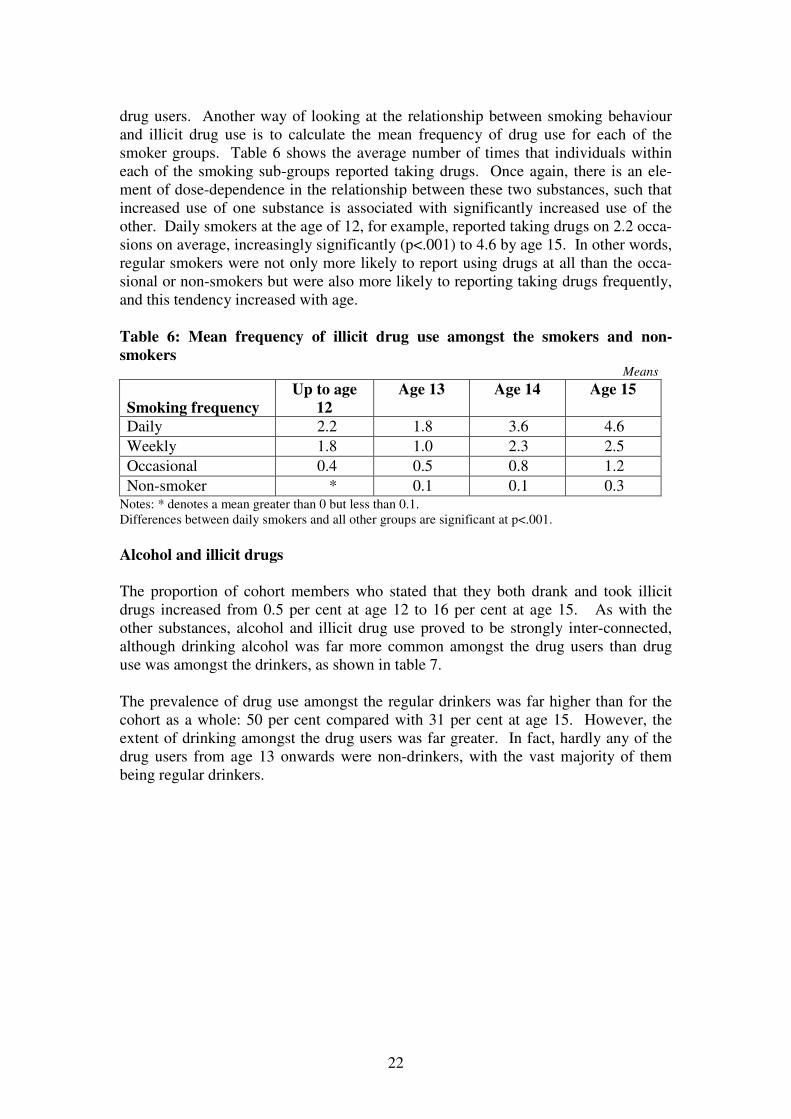
drug users. Another way of looking at the relationship between smoking behaviour
and illicit drug use is to calculate the mean frequency of drug use for each of the
smoker groups. Table 6 shows the average number of times that individuals within
each of the smoking sub-groups reported taking drugs. Once again, there is an ele-
ment of dose-dependence in the relationship between these two substances, such that
increased use of one substance is associated with significantly increased use of the
other. Daily smokers at the age of 12, for example, reported taking drugs on 2.2 occa-
sions on average, increasingly significantly (p<.001) to 4.6 by age 15. In other words,
regular smokers were not only more likely to report using drugs at all than the occa-
sional or non-smokers but were also more likely to reporting taking drugs frequently,
and this tendency increased with age.
Table 6: Mean frequency of illicit drug use amongst the smokers and non-
smokers Means
Smoking frequency
Up to age
12
Age 13 Age 14 Age 15
Daily 2.2 1.8 3.6 4.6
Weekly 1.8 1.0 2.3 2.5
Occasional 0.4 0.5 0.8 1.2
Non-smoker * 0.1 0.1 0.3 Notes: * denotes a mean greater than 0 but less than 0.1.
Differences between daily smokers and all other groups are significant at p<.001.
Alcohol and illicit drugs
The proportion of cohort members who stated that they both drank and took illicit
drugs increased from 0.5 per cent at age 12 to 16 per cent at age 15. As with the
other substances, alcohol and illicit drug use proved to be strongly inter-connected,
although drinking alcohol was far more common amongst the drug users than drug
use was amongst the drinkers, as shown in table 7.
The prevalence of drug use amongst the regular drinkers was far higher than for the
cohort as a whole: 50 per cent compared with 31 per cent at age 15. However, the
extent of drinking amongst the drug users was far greater. In fact, hardly any of the
drug users from age 13 onwards were non-drinkers, with the vast majority of them
being regular drinkers.
23
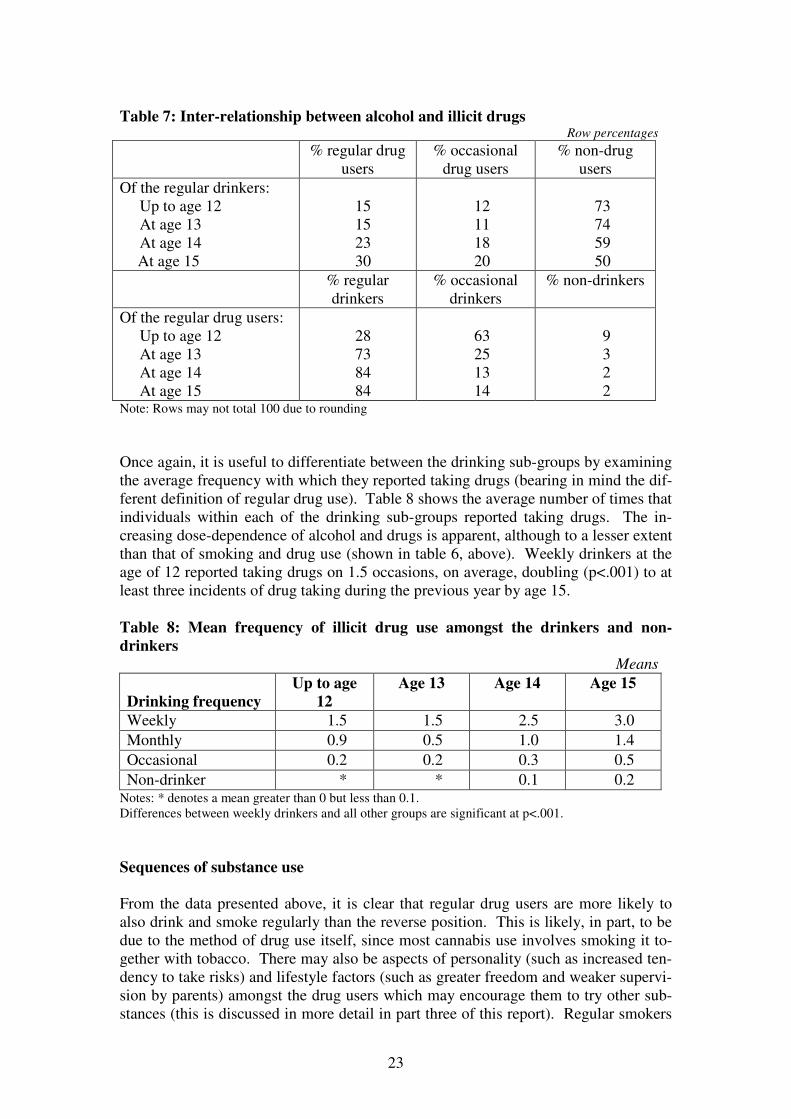
Table 7: Inter-relationship between alcohol and illicit drugs Row percentages
% regular drug
users
% occasional
drug users
% non-drug
users
Of the regular drinkers:
Up to age 12
At age 13
At age 14
At age 15
15
15
23
30
12
11
18
20
73
74
59
50
% regular
drinkers
% occasional
drinkers
% non-drinkers
Of the regular drug users:
Up to age 12
At age 13
At age 14
At age 15
28
73
84
84
63
25
13
14
9
3
2
2 Note: Rows may not total 100 due to rounding
Once again, it is useful to differentiate between the drinking sub-groups by examining
the average frequency with which they reported taking drugs (bearing in mind the dif-
ferent definition of regular drug use). Table 8 shows the average number of times that
individuals within each of the drinking sub-groups reported taking drugs. The in-
creasing dose-dependence of alcohol and drugs is apparent, although to a lesser extent
than that of smoking and drug use (shown in table 6, above). Weekly drinkers at the
age of 12 reported taking drugs on 1.5 occasions, on average, doubling (p<.001) to at
least three incidents of drug taking during the previous year by age 15.
Table 8: Mean frequency of illicit drug use amongst the drinkers and non-
drinkers
Means
Drinking frequency
Up to age
12
Age 13 Age 14 Age 15
Weekly 1.5 1.5 2.5 3.0
Monthly 0.9 0.5 1.0 1.4
Occasional 0.2 0.2 0.3 0.5
Non-drinker * * 0.1 0.2 Notes: * denotes a mean greater than 0 but less than 0.1.
Differences between weekly drinkers and all other groups are significant at p<.001.
Sequences of substance use
From the data presented above, it is clear that regular drug users are more likely to
also drink and smoke regularly than the reverse position. This is likely, in part, to be
due to the method of drug use itself, since most cannabis use involves smoking it to-
gether with tobacco. There may also be aspects of personality (such as increased ten-
dency to take risks) and lifestyle factors (such as greater freedom and weaker supervi-
sion by parents) amongst the drug users which may encourage them to try other sub-
stances (this is discussed in more detail in part three of this report). Regular smokers

24
were also found to be more likely to drink on a frequent basis than the reverse rela-
tionship, which is contrary to the popular image of individuals who take up smoking
as a consequence of their drinking behaviour. But how does this tie in with the results
presented in part one of this report, which demonstrated that alcohol tended to have
the earliest age of onset, followed by tobacco and then illicit drug use?
To tease out these relationships further, it is possible to analyse the temporal progres-
sion of substance using behaviour. Table 9 shows the proportion of cohort members
who displayed developmental progression from occasional drinking, smoking and
drug use to more regular drinking, smoking and drug use between sweeps of the
study. Before interpreting these results, there are two important points which must be
stressed in relation to table 9. First, the results presented do not demonstrate that oc-
casional use of one substance ‘caused’ progression to regular use of that substance or
another; in other words it does not provide supporting evidence for a domino effect.
This table merely shows the proportion of cases in which one form of behaviour pre-
ceded another in the case of the Edinburgh Study participants. The second point that
must be borne in mind is that, while we can make broad assumptions about the se-
quential stages in which substance use took place, the temporal nature of the data col-
lected is not specific enough to be absolutely precise. The reference period used for
sweeps two to four was ‘during the last year’, and at the first sweep age of first use
was restricted to specified age bands of a year or more.8 In many cases, therefore, on-
set of use of one substance coincided with onset of use of another within the same
sweep, and these results are not displayed here. Table 9 is simply intended to give a
broad indication of the developmental progression of substance use.
The results presented in part one of this report on age of onset indicated that the tem-
poral priority for substance use was alcohol consumption followed by smoking to-
bacco and then drug or volatile substance use. This pattern appears to be supported
by table 9, which shows that regular participation in all forms of substance using be-
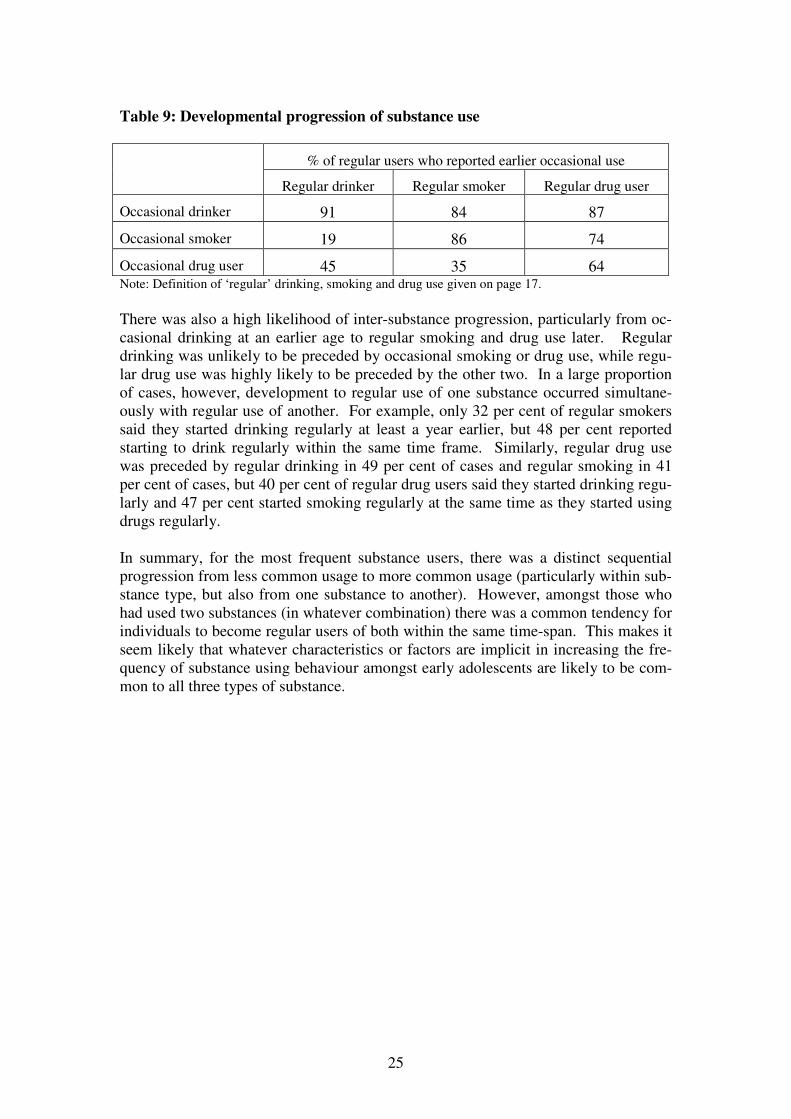
haviour is in the vast majority of cases, preceded by occasional drinking. Intra-
substance progression produced the highest probability of subsequent regular use,
with 91 per cent of regular drinkers having reported occasional alcohol consumption
at an earlier age and 86 per cent of regular smokers having reported prior occasional
smoking. The regular drug users were the least likely to report occasional use at an
earlier age, which might indicate that progression from occasional to regular drug use
occurs more quickly amongst users than for drinking or smoking.
8 The age bands used at sweep one were ‘age 8 or under’, ‘age 9 or 10’, ‘age 11 or over’.
25
Table 9: Developmental progression of substance use
% of regular users who reported earlier occasional use
Regular drinker Regular smoker Regular drug user
Occasional drinker 91 84 87
Occasional smoker 19 86 74
Occasional drug user 45 35 64 Note: Definition of ‘regular’ drinking, smoking and drug use given on page 17.
There was also a high likelihood of inter-substance progression, particularly from oc-
casional drinking at an earlier age to regular smoking and drug use later. Regular
drinking was unlikely to be preceded by occasional smoking or drug use, while regu-
lar drug use was highly likely to be preceded by the other two. In a large proportion
of cases, however, development to regular use of one substance occurred simultane-
ously with regular use of another. For example, only 32 per cent of regular smokers
said they started drinking regularly at least a year earlier, but 48 per cent reported
starting to drink regularly within the same time frame. Similarly, regular drug use
was preceded by regular drinking in 49 per cent of cases and regular smoking in 41
per cent of cases, but 40 per cent of regular drug users said they started drinking regu-
larly and 47 per cent started smoking regularly at the same time as they started using
drugs regularly.
In summary, for the most frequent substance users, there was a distinct sequential
progression from less common usage to more common usage (particularly within sub-
stance type, but also from one substance to another). However, amongst those who
had used two substances (in whatever combination) there was a common tendency for
individuals to become regular users of both within the same time-span. This makes it
seem likely that whatever characteristics or factors are implicit in increasing the fre-
quency of substance using behaviour amongst early adolescents are likely to be com-
mon to all three types of substance.
26
PART 3: CHARACTERISTICS OF SUBSTANCE USERS
The previous two parts of this report have focused on the extent and nature of tobacco
smoking, alcohol consumption and illicit drug use, and on the complex relationships
and inter-dependence between the three substances. This part shall focus on the char-
acteristics of those individuals who reported using these three substances and assess
the extent to which certain key characteristics or factors can be used to predict differ-
ent types of substance user. In order to maximise numbers for analysis, scrutiny of
the data is restricted to the four regular user sub-groups defined in part two, namely
non-users and single, double and triple substance users. Given the very small num-
bers in both the double and triple substance user sub-groups at sweep one, only
sweeps two to four are included in the analysis for the remainder of this section.
Gender
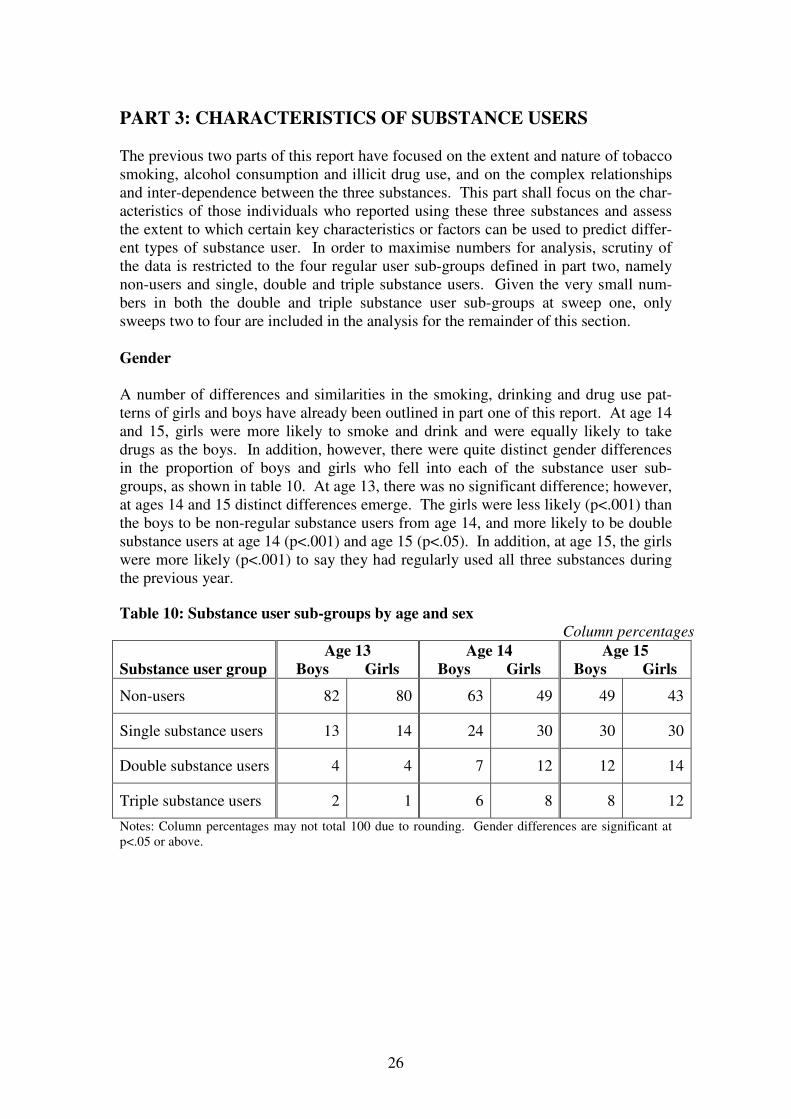
A number of differences and similarities in the smoking, drinking and drug use pat-
terns of girls and boys have already been outlined in part one of this report. At age 14
and 15, girls were more likely to smoke and drink and were equally likely to take
drugs as the boys. In addition, however, there were quite distinct gender differences
in the proportion of boys and girls who fell into each of the substance user sub-
groups, as shown in table 10. At age 13, there was no significant difference; however,
at ages 14 and 15 distinct differences emerge. The girls were less likely (p<.001) than
the boys to be non-regular substance users from age 14, and more likely to be double
substance users at age 14 (p<.001) and age 15 (p<.05). In addition, at age 15, the girls
were more likely (p<.001) to say they had regularly used all three substances during
the previous year.
Table 10: Substance user sub-groups by age and sex
Column percentages
Substance user group
Age 13
Boys Girls
Age 14
Boys Girls
Age 15
Boys Girls
Non-users 82 80 63 49 49 43
Single substance users 13 14 24 30 30 30
Double substance users 4 4 7 12 12 14
Triple substance users 2 1 6 8 8 12
Notes: Column percentages may not total 100 due to rounding. Gender differences are significant at
p<.05 or above.

27
Self-reported delinquency
There are many research studies which have shown links between the use of alcohol
or illegal drugs and delinquent or anti-social behaviour (recent examples include Port-
man Group 2002; White et al 2002; Sun et al 2004). It is important to note that the
relationship is often a very complex one, and patterns of transition and order of initia-
tion are not always easy to determine or explain. For the purposes of this report, the
analysis shall be restricted to determining whether there is an association between the
two forms of behaviour and, if so, and the extent of this association within each sub-
group. Two measures of delinquent behaviour are used: variety of offending (a count
of the number of different offending behaviours the respondent had engaged in) and
volume of offending (the cumulative frequency of offending across all the offending
behaviours asked about).9 A total of 15 items of anti-social or delinquent behaviour
were used to create both of these measures (these are listed in panel 5).
Panel 5: Items of delinquency included in variety and volume measures
• Fare dodging
• Shoplifting
• Noisy or cheeky in public
• Joyriding
• Theft from school
• Carrying a weapon
• Graffiti
• Vandalism
• Housebreaking
• Robbery
• Theft from home
• Fire-raising
• Assault
• Theft from vehicle
• Truanting from school
The four substance use sub-groups were compared in terms of their mean variety and
volume of self-reported delinquency at ages 13 to 15 (scores are presented in tables
A6 and A7 in Appendix 1). Figure 9 shows that levels of self-reported delinquency
among the Edinburgh Study cohort differed significantly between the various sub-
groups. There was an incremental increase in both variety and frequency of offending
from the non-user group through to the multiple user group. Overall, variety and vol-
ume of delinquency appear to decline slightly with age; however, this trend is com-
mon to all four groups. The multiple substance users reported higher levels (p<.001)
of delinquent involvement than all of the other groups, both in terms of variety and
volume. At each age point, the triple substance group reported a mean score that was
at least twice as high as that of the single substance group, and at least four times
higher than the non-users. The scale of difference was least between the double and
triple substance user groups, yet the level of statistical significance remained high
(p<.001).
9 For more detail about these measures see Smith and McVie 2003.

28
0
10
20
30
40
50
Age 13 Age 14 Age 15 Age 13 Age 14 Age 15
Mean
Non-regular user Single substance only Two substances Three substances
Variety of offending Volume of offending
Figure 9: Mean variety and volume of offending amongst substance user sub-
groups
Personality
A number of research studies have linked personality characteristics to both delin-
quent and problematic health behaviours. Eysenck’s (1977) early work has largely
been rejected on methodological grounds; however, more recently, personality theory
has seen a revival thanks to longitudinal studies carried out in Dunedin and the US,
although this has largely been restricted to demonstrating links between personality
and self-reported delinquency. Various studies have shown there to be a strong rela-
tionship between certain personality constructs and problematic health behaviours and
that people who misuse drugs and alcohol are more likely to suffer from antisocial
and dependent personality disorders. Research on the latter has tended to be restricted
to adults (see, for example, Grant et al 2004), whilst research on adolescents has more
often focused on more general personality traits. Sutherland and Shepherd (2002), for
example, identified a strong association between substance use, violence and low self
esteem. Meanwhile, Wills et al (2000) found that adolescent substance use was
strongly mediated by risk-taking tendencies. The Edinburgh Study questionnaires
included brief personality scales measuring both self-esteem and impulsivity (panel 6,
below, shows the precise questions and the sweeps at which they were used).
The self-esteem measure is a shortened version of the Rosenberg Self-Esteem Scale
(Rosenberg 1965); while the impulsivity measure was adapted from the Eysenck Im-
pulsivity Scale (Eysenck et al 1984). Unfortunately, the analysis for this report does
not extend to sweep five (at which impulsivity was again included as an item) so a
longitudinal analysis in the changing relationship between this personality characteris-
tic and substance use cannot be conducted here. The six items from each scale were
scored from 0 to 4, giving each trait a total score with a range of 0 to 24 where a high
score corresponded to high self esteem or high impulsivity.10
The four substance user
sub-groups were then compared in terms of their mean personality scores for self es-
teem at ages 13 and 15 and for impulsivity at age 14.
10
All three of these scales had good internal reliability, with Cronbach’s alpha scores of .73 for sweep
2 self esteem, .79 for sweep 4 self esteem and .74 for sweep 3 impulsivity.

29
Panel 6: Personality measures used in the Edinburgh Study11
Self-Esteem (measured at sweeps 2 and 4)
How much do you agree or disagree with these statements?
• I like myself
• I often wish I was someone else
• I am able to do things well
• I don’t think much of myself
• There are some good things about me
• There are lots of things about myself I would like to change
Impulsivity (measured at sweep 3)
How much do you agree or disagree with these statements?
• Having to plan things makes them less fun to do
• I get into trouble because I do things without thinking
• I put down the first answer that comes into my head on a test and often forget to check it later
• I get involved in things I later wish I could get out of
• I sometimes break rules because I do things without thinking
• I get so excited about doing new things that I don’t think about problems that might happen
Response options: Agree a lot, agree a bit, not sure, disagree a bit, disagree a lot.
Quite interesting differences emerge for the two personality constructs across the
three sweeps, as shown in table 11 where the mean scores are presented. At age 13,
the non-users had a significantly (p<.001) higher self esteem score than any of the
other sub-groups; however, there were no significant differences amongst the sub-
stance users. By age 15, an interesting shift in the relationship between substance use
and self esteem had occurred. There was no significant difference between the non-
users and single substance users in terms of their self esteem score, and there was no
difference between double and triple substance users. However, non-users and single
substance users had a significantly higher self esteem score than both the double and
triple substance users. In other words, although this personality trait did little to dif-
ferentiate between any of the substance users at age 13, by age 15 the multiple users
were quite different from the single substance users (who were actually very like non-
users).
Table 11: Mean personality scores for substance user sub-groups, by age
Means
Substance user group
Self esteem at
age 13
(n=3788)
Impulsivity at
age 14
(n=3789)
Self esteem at
age 15
(n=3813)
Non-users 15.7 11.4 16.4
Single substance users 14.5 14.0 16.2
Double substance users 13.8 15.1 15.1
Triple substance users 13.9 15.4 14.7
11
Both of these measures were also included at sweep one, but analysis of this sweep is not presented
here.
30
In terms of impulsivity at age 14, the non-users had a significantly (p<.001) lower
impulsivity score than any of the other substance user groups. The single substance
users were also significantly less impulsive than the double and triple users. How-
ever, there was no significant difference between the double and triple substance users
in terms of their level of impulsivity. In other words, the relationship between impul-
sivity and substance use amongst the regular user groups at age 14 was the same as
that of self esteem at age 15, with a discrete differentiation between the single and
multiple user groups (although no difference between the double and triple substance
users). Nevertheless, the link between impulsivity and non-regular substance use at
age 14 was more like that of the link with self esteem at age 13, where the non-
substance users were quite clearly differentiated from all the other the substance user
groups.
Lifestyle, peers and parenting
Social activities are a key feature of adolescence and the social context of leisure is
important to adolescent development as it provides opportunities for both differentia-
tion and integration. Unsupervised leisure activities, such as hanging around on the
streets, provide opportunities for getting involved in problematic behaviour. The in-
creasing influence of peers and diminishing power of parental authority during ado-
lescence also play a role in determining behavioural patterns. Research from the US
found a direct linear relationship between substance use and various aspects of leisure
and lifestyle, including peer substance using behaviour, how much parents "really
knew" about their activities and number of hours spent hanging out with friends
(Caldwell and Darling 1996). While another study by Kung and Farrell (2000) found
that both peer pressure and parenting practices had direct effects on drug use, with
peer pressure mediating the influence of parenting.
Lifestyle Analysis of the Edinburgh Study data on lifestyle and leisure activities can be broadly
separated into two types: organised or conventional leisure activities; and unorganised
or unsupervised leisure activities. Details of the questionnaire items which were put
in each type are summarised in panel 7 – these items are analysed individually as the
measures are quite different in terms of response options and there was insufficient
internal reliability to combine them into short scales. The four substance user sub-
groups were, therefore, compared individually on each of these measures.
Panel 7: Types of leisure activity
Supervised or conventional leisure
• Stay at home most evenings.
• Going to organised clubs, groups or sports centres most days.
• Going shopping or out for something to eat at least once a week.
Unorganised or unsupervised leisure
• Going to amusement arcades at least once a week.
• Going to discos, nightclubs or raves at least once a week.
• Hanging around most evenings.
31
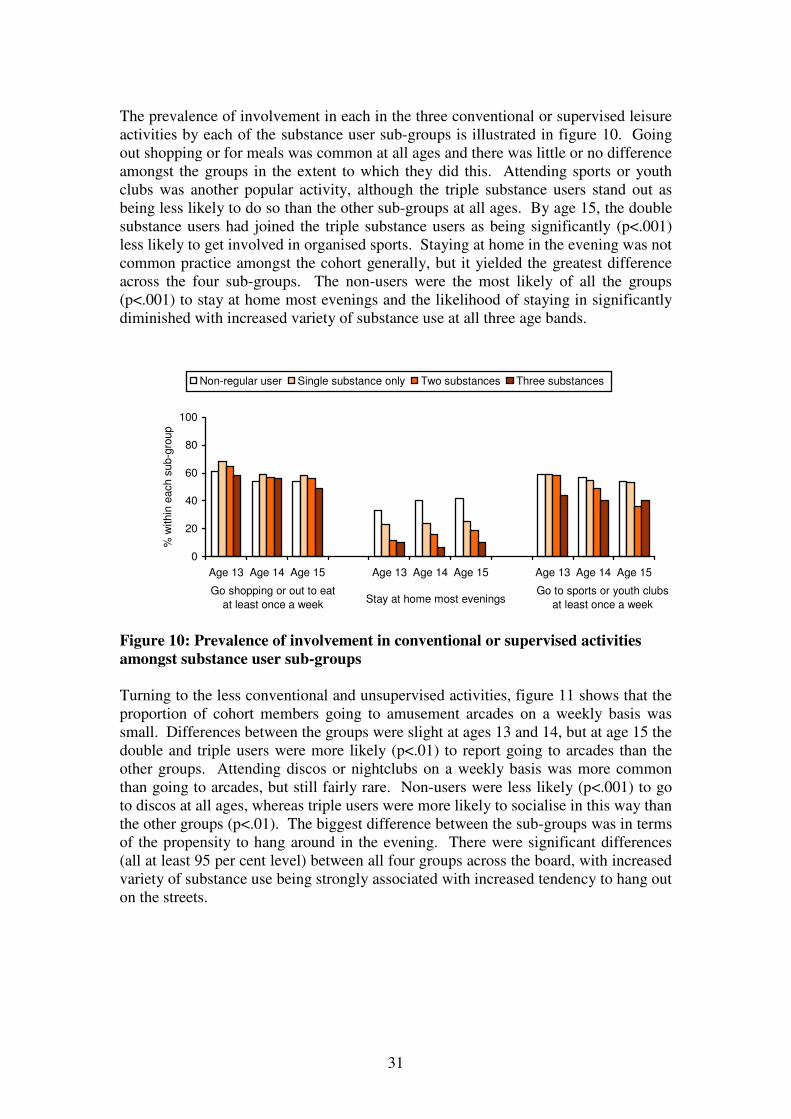
The prevalence of involvement in each in the three conventional or supervised leisure
activities by each of the substance user sub-groups is illustrated in figure 10. Going
out shopping or for meals was common at all ages and there was little or no difference
amongst the groups in the extent to which they did this. Attending sports or youth
clubs was another popular activity, although the triple substance users stand out as
being less likely to do so than the other sub-groups at all ages. By age 15, the double
substance users had joined the triple substance users as being significantly (p<.001)
less likely to get involved in organised sports. Staying at home in the evening was not
common practice amongst the cohort generally, but it yielded the greatest difference
across the four sub-groups. The non-users were the most likely of all the groups
(p<.001) to stay at home most evenings and the likelihood of staying in significantly
diminished with increased variety of substance use at all three age bands.
0
20
40
60
80
100
Age 13 Age 14 Age 15 Age 13 Age 14 Age 15 Age 13 Age 14 Age 15
% w
ithin
each
su
b-g
roup
Non-regular user Single substance only Two substances Three substances
Go shopping or out to eat
at least once a weekStay at home most evenings
Go to sports or youth clubs
at least once a week
Figure 10: Prevalence of involvement in conventional or supervised activities
amongst substance user sub-groups
Turning to the less conventional and unsupervised activities, figure 11 shows that the
proportion of cohort members going to amusement arcades on a weekly basis was
small. Differences between the groups were slight at ages 13 and 14, but at age 15 the
double and triple users were more likely (p<.01) to report going to arcades than the
other groups. Attending discos or nightclubs on a weekly basis was more common
than going to arcades, but still fairly rare. Non-users were less likely (p<.001) to go
to discos at all ages, whereas triple users were more likely to socialise in this way than
the other groups (p<.01). The biggest difference between the sub-groups was in terms
of the propensity to hang around in the evening. There were significant differences
(all at least 95 per cent level) between all four groups across the board, with increased
variety of substance use being strongly associated with increased tendency to hang out
on the streets.
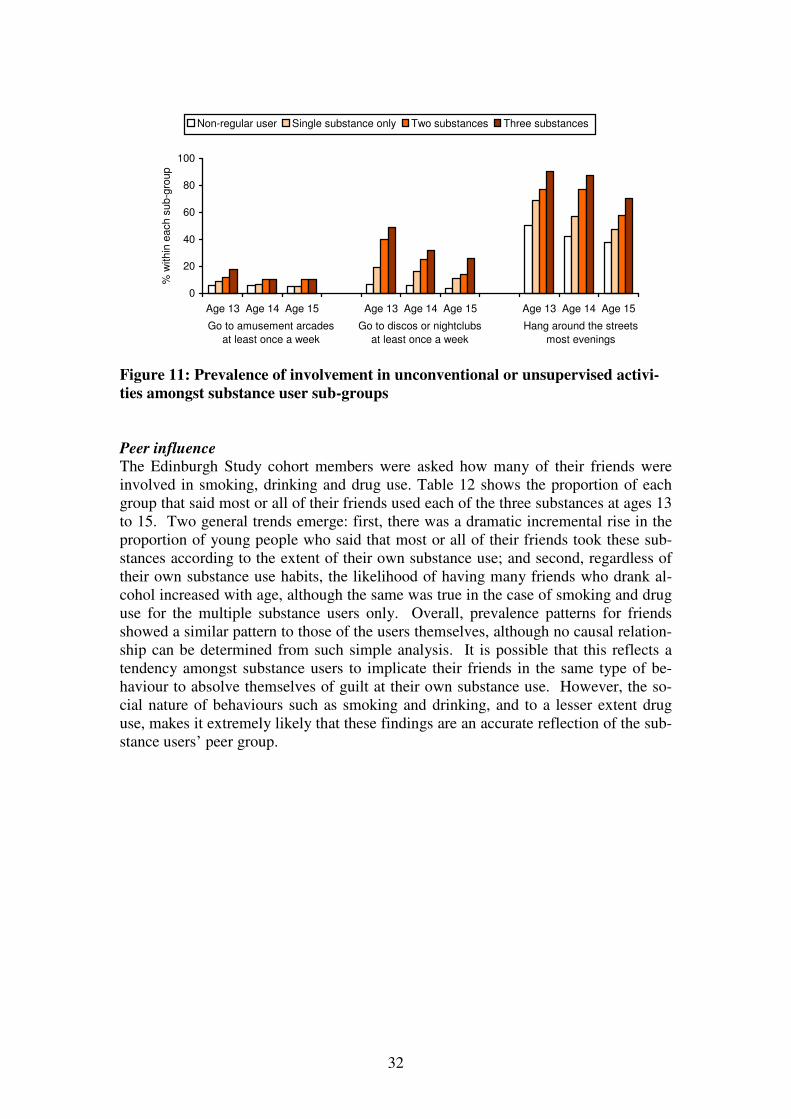
32
0
20
40
60
80
100
Age 13 Age 14 Age 15 Age 13 Age 14 Age 15 Age 13 Age 14 Age 15
% w
ithin
each s
ub-g
roup
Non-regular user Single substance only Two substances Three substances
Go to amusement arcades
at least once a week
Go to discos or nightclubs
at least once a week
Hang around the streets
most evenings
Figure 11: Prevalence of involvement in unconventional or unsupervised activi-
ties amongst substance user sub-groups
Peer influence The Edinburgh Study cohort members were asked how many of their friends were
involved in smoking, drinking and drug use. Table 12 shows the proportion of each
group that said most or all of their friends used each of the three substances at ages 13
to 15. Two general trends emerge: first, there was a dramatic incremental rise in the
proportion of young people who said that most or all of their friends took these sub-
stances according to the extent of their own substance use; and second, regardless of
their own substance use habits, the likelihood of having many friends who drank al-
cohol increased with age, although the same was true in the case of smoking and drug
use for the multiple substance users only. Overall, prevalence patterns for friends
showed a similar pattern to those of the users themselves, although no causal relation-
ship can be determined from such simple analysis. It is possible that this reflects a
tendency amongst substance users to implicate their friends in the same type of be-
haviour to absolve themselves of guilt at their own substance use. However, the so-
cial nature of behaviours such as smoking and drinking, and to a lesser extent drug
use, makes it extremely likely that these findings are an accurate reflection of the sub-
stance users’ peer group.

33
Table 12: Prevalence of peer substance use by substance user sub-group, by age
Within group percentages
Peer substance use
Non-users Single
substance
users
Double
substance
users
Triple
substance
users Most/all friends smoked cigs
- at age 13
- at age 14
- at age 15
6
9
9
23
32
25
49
62
62
77
84
83
Most/all friends drank alcohol
- at age 13
- at age 14
- at age 15
12
27
36
41
73
79
59
83
86
73
96
96
Most/all friends took drugs
- at age 13
- at age 14
- at age 15
0
1
2
*
4
6
1
18
27
6
42
46
Note: * denotes a percentage greater than 0 but less than 1.
Parental supervision Three aspects of parental supervision were measured at each sweep of the Edinburgh
Study, relating to the extent to which individuals movements were monitored (see
panel 8 for details of the questions asked and response options). These three ques-
tions were combined into a scale ranging from 0 to 9, where 0 indicated that their par-
ents never knew where they were, who they were with or what time they would re-
turn, whereas 9 showed very strong monitoring of the individual’s movements.12
Again, significant divergence was found between all four sub-groups in terms of the
mean parental supervision scores. These are presented in table 13, below.
Panel 8: Questions about parental supervision.
When you went out during the last year, how often did your parents know:
• where you were going?
• who you were going out with?
• what time you would be home?
Response options: always, usually, sometimes and never.
The non-users were found to have a significantly higher (p<.001) parental supervision
score than any of the substance user groups at all three sweeps. In addition, the single
substance users had a consistently higher mean score than the multiple users (with
differences significant at p<.01 or above). Differences were least amongst the multi-
ple users, although the triple substance users did prove to be less well supervised than
the double users at all sweeps (p<.05 or less at all ages). These findings are strongly
consistent with the evidence presented earlier in this section of the report that sub-
12
The parental supervision scale had good internal reliability, with Cronbach’s alpha of .72, .71 and .71
for sweeps two to four, respectively.

34
stance misuse is highly associated with leisure pursuits away from the purview of par-
ents and increased peer influence over behaviour.
Table 13: Mean parental supervision score by substance user sub-group, by age
Means
Mean parental
supervision score
Non-users Single
substance
users
Double
substance
users
Triple
substance
users
At age 13 7.0 5.9 5.0 4.2
At age 14 6.9 5.7 5.3 4.7
At age 15 6.8 5.9 5.5 5.2
Victimisation
Very little other research has looked at the links between substance use and victimisa-
tion amongst young people, although a review of research carried out by Burniston et
al (2002) for the Scottish Executive found that amongst the difficulties faced by
young people with drug misuse problems was “the danger of victimisation or exploi-
tation by others (including dealers and pimps)”. Given the fact that the Edinburgh
Study has shown a close relationship between substance use and delinquency, dis-
cussed earlier in this report, and a strong and causative link between delinquency and
victimisation (see Smith 2004), it did not seem unlikely that victimisation would also
be shown to be associated with substance using behaviour.
Two measures of victimisation were included in the Edinburgh Study: variety of vic-
timisation (a count of the number of different types of victimisation the respondent
reported experiencing) and volume of victimisation (the cumulative frequency of vic-
timisation across all the types asked about). A total of 5 items of victimisation were
used to create both of these measures (these are listed in panel 9).13
Panel 9: Questions on victimisation.
During the last year, did anyone:
• threaten to hurt you?
• actually hurt you by hitting, kicking or punching you (fighting with you)?
• actually hurt you with a weapon?
• steal something of yours that you left somewhere?
• use threats or force to steal or try to steal something from you?
Response options: yes/no. If yes, ‘how many times did that happen in the last year?’
The analysis reveals a strong association between extent of victimisation and sub-
stance use, with only occasional non-significant differences between substance user
sub-groups. Figure 12 shows that the mean variety and volume scores for each of the
four groups followed very similar trends. Non-users were significantly less victim-
ised than all of the other groups (p<.001). Single users were also consistently victim-
13
Mean variety ranged from 0 (non-victims) to 5 (victims of all five offence types); while mean vol-
ume ranged from 0 to a maximum of 55 (victims of all five offence types more than 10 times each).
See Smith and McVie (2003) for more details on the construction of these measures.
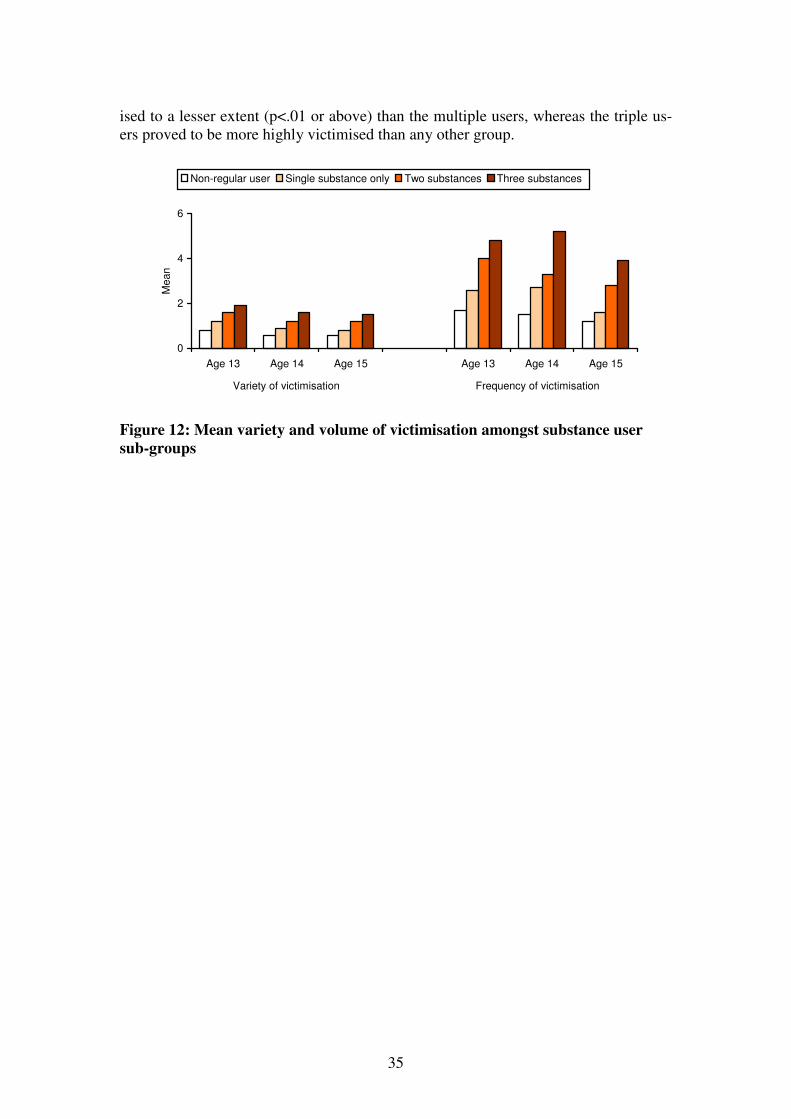
35
ised to a lesser extent (p<.01 or above) than the multiple users, whereas the triple us-
ers proved to be more highly victimised than any other group.
0
2
4
6
Age 13 Age 14 Age 15 Age 13 Age 14 Age 15
Mean
Non-regular user Single substance only Two substances Three substances
Variety of victimisation Frequency of victimisation
Figure 12: Mean variety and volume of victimisation amongst substance user
sub-groups
36
CONCLUSION
The longitudinal evidence provided by the Edinburgh Study of Youth Transitions and
Crime represents a significant and important addition to the burgeoning literature on
substance use. Not only does it identify patterns, trends and gender differences in al-
cohol consumption, tobacco smoking and illicit drug use amongst a large cohort of
early adolescents, but it provides individual level evidence about onset and sequential
progression from one type or level of substance use to another. The analysis pre-
sented in this report demonstrates that regular alcohol consumption, tobacco smoking
and illicit drug use starts for a small but worrying minority at a very early age and is
relatively common practice by the age of 15. Amongst those who start using sub-
stances up to age 12 there is significant behavioural continuity whereby early experi-
mentation leads to longer term use, at least during adolescence. In addition, there is
strong evidence of sequential progression from occasional use of one substance to
both regular use of the same and other substances. The data presented suggest that a
key transitional point in the lives of young people occurs between the ages of 13 and
14, since that is the time-frame during which the greatest increases in both prevalence
and frequency of alcohol, tobacco and illicit drug use occurred.
There is no denying the close association between alcohol, tobacco and illicit drug
use, yet the inter-relationships between them are complex and difficult to unpick. Al-
cohol was the most common substance to be consumed in isolation, while smoking
and illicit drug use were in almost every case linked to the use of at least one other
substance. Although drug use was the least prevalent of the problematic health be-
haviours, regular drug users appeared to be the most likely to also be regular drinkers
and smokers than the other way around. Notwithstanding the different definition of
‘regular drug user’, the probability of sequential progression from occasional use to
regular use was also lowest for drug users, which suggests that progression to regular
drug use might occur relatively quickly amongst users whereas there may be a greater
period of development from occasional to regular use for drinking and smoking.
Nevertheless, it is particularly significant that the progression to regular alcohol, to-
bacco or illicit drug use often occurred simultaneously, which suggests that similar
factors or characteristics are implicated in this advancement to more persistent sub-
stance use.
Those who used two or three substances represented the most problematic and worry-
ing group in terms of their characteristics. At age 13, there were some similarities
between the non-substance users, the single substance users and those using two or
three substances. Each of these groups was just as likely to participate in ordinary
teenage leisure activities, such as going to sports or youth clubs and going shopping
or for meals with their family, for example. However, there were also differences be-
tween the groups, which increased as they got older. Multiple substance users – par-
ticularly those using all three substances – were significantly more likely to be delin-
quent, impulsive, hang around the streets, spend time in ‘adult oriented’ venues such
as amusement arcades and discos or nightclubs and to report associating with other
substance users. They were also more likely to display worrying characteristics such
as greater levels of victimisation, lower self-esteem and weaker parental supervision.
In particular, it is important to note that girls were more likely to be multiple sub-
stance users than the boys at ages 14 and 15.

37
These findings support the notion that multiple substance users represent a fairly vul-
nerable and risk-prone sector of the population. Previous findings published from the
Edinburgh Study suggested that victimisation and delinquency were predominantly
linked as a result of the same activities, situations and social circles leading both to
victimisation and delinquency (Smith 2004). Although not entirely synonymous, it
seems likely that there are similarities in the reasons for the close links between vic-
timisation and substance use. For example, individuals involved in substance use may
place themselves in risky situations, participate in dangerous activities or associate
with other anti-social and problematic individuals, all of which might put them at risk
of being victimised or harmed by others.
These findings have clear policy implications for the development and implementa-
tion of educational and health-based initiatives to tackle adolescent substance use.
There appear to be three distinct groups that would benefit from specifically targeted
approaches. First, there are those who start using substances regularly from a very
early age, for whom a policy of early intervention aimed at preventing the establish-
ment of a long term and increasingly serious substance using history would be benefi-
cial. Second, there are those who report using two or more substances, many of
whom are also likely to have started using substances at an early age. The evidence
suggests that these individuals are likely to be particularly problematic in terms of
their behaviour, personality and lifestyle, but also to be vulnerable and lacking in pa-
rental control. This implies that intervention programmes focusing on substance use
may be most effective if situated within a broader, welfare-based approach such as
that offered by the Scottish children’s hearing system. Finally, there is the adolescent
population generally for whom a programme of general educational and preventative
work up to and around age 13, when the greatest increases in prevalence and fre-
quency occur, might be the most effective action. Given the complex interplay be-
tween the different substance types, an integrated response to the multi-faceted prob-
lem of substance misuse may be most beneficial, providing programmes which focus
on alcohol, tobacco and illicit drugs together, rather than individually, for all three
groups. In addition, it seems likely that a gendered approach to programme develop-
ment might be advantageous in preventing or tackling the higher levels of substance
use amongst adolescent girls.

38
APPENDIX 1 – ADDITIONAL TABLES
Table A1: Prevalence of drug use, by drug type and age
Column percentages
Type of drug Age 12
(n=3811)
Age 13
(n=3823)
Age 14
(n=3811)
Age 15
(n=3804)
Cannabis 2.4 5.5 17.3 30.1
Volatile substances 3.8 2.9 6.9 5.2
Ecstasy 0.2 0.3 1.9 4.3
Cocaine 0.4 0.5 1.5 2.2
Speed 0.4 0.7 2.6 4.0
Heroin 0.1 0.3 0.6 1.0
LSD 0.2 0.4 1.4 1.7
Magic mushrooms 0.3 0.7 2.5 3.7
Downers 0.2 0.5 1.4 2.6
Poppers 0 0.1 2.4 4.7
Something else 0.2 0.3 0.5 0.6 Note: more than one response permitted.
Table A2: Mean frequency of drug use amongst drug users, by drug type and age Column means
Type of drug Age 12
(n=3811)
Age 13
(n=3823)
Age 14
(n=3811)
Age 15
(n=3804)
Cannabis 2.1 2.4 2.7 3.0
Volatile substances 1.8 1.7 1.9 2.0
Ecstasy 1.7 1.7 2.2 2.2
Cocaine 1.8 1.6 1.5 1.7
Speed 1.4 1.4 1.6 1.9
Heroin 1.3 1.9 2.1 2.4
LSD 1.3 1.7 1.8 1.9
Magic mushrooms 1.7 1.6 1.9 1.9
Downers 2.3 1.5 2.0 2.2
Poppers 0 1.8 2.2 2.1
Something else 1.3 2.0 2.3 2.3 Note: more than one response permitted.

39
Table A3: Prevalence of substance use by user sub-group
Column percentages
User sub-group Age 12
(n=3716)
Age 13
(n=3739)
Age 14
(n=3678)
Age 15
(n=3587)
Non-user 94.0 80.8 59.0 46.3
Smoker only 1.0 2.7 2.9 2.7
Drinker only 2.7 10.5 21.8 26.4
Drug user only 1.1 0.4 0.7 1.1
Smoker & drinker 0.3 2.7 5.5 6.0
Smoker & drug user 0.3 0.5 1.0 1.9
Drinker & drug user 0.2 1.0 2.8 5.2
All three substances 0.3 1.4 6.3 10.3 Note: Non-user group includes non-regular users.
Table A4: Drinking behaviour of the cigarette smokers
Row percentages
% weekly
drinkers
% monthly
drinkers
% occasional
drinkers
% non-
drinkers
Of the daily smokers:
Up to age 12
At age 13
At age 14
At age 15
28.0
27.6
53.9
56.9
12.0
26.3
24.6
24.1
52.0
28.9
16.2
13.9
8.0
17.1
5.3
5.1
Of the weekly smokers:
Up to age 12
At age 13
At age 14
At age 15
11.8
15.3
36.0
46.4
17.6
21.6
34.3
27.8
54.9
41.6
24.6
19.6
15.7
21.5
5.1
6.2
Of the occasional smokers:
Up to age 12
At age 13
At age 14
At age 15
3.0
2.7
18.2
26.2
6.5
6.2
34.2
35.6
69.4
33.7
41.7
34.2
21.1
57.4
5.8
3.9

40
Table A5: Smoking behaviour of the alcohol drinkers
Row percentages
% daily
smokers
% weekly
smokers
% occasional
smokers
% non-
smokers
Of the weekly drinkers:
Up to age 12
At age 13
At age 14
At age 15
13.2
18.3
37.0
38.8
11.3
15.7
9.6
9.8
30.2
31.0
24.2
24.3
45.3
34.9
29.1
27.0
Of the monthly drinkers:
Up to age 12
At age 13
At age 14
At age 15
3.6
10.8
14.6
16.3
10.7
11.6
7.9
5.8
40.5
29.0
39.1
32.7
45.2
48.7
38.5
45.3
Of the occasional drinkers:
Up to age 12
At age 13
At age 14
At age 15
0.8
3.3
4.6
6.7
1.8
2.6
2.7
2.9
23.7
19.5
22.8
22.3
73.7
74.6
69.9
68.1
Table A6 – Mean variety of delinquency amongst substance user sub-groups
Column percentages
User sub-group Age 13
(n=3602)
Age 14
(n=3533)
Age 15
(n=3497)
Non-user 2.0 1.9 1.4
Single substance user 4.8 4.1 3.0
Double substance user 7.0 5.8 4.7
Triple substance user 9.0 8.0 6.5 Note: Non-user group includes non-regular users.
Table A7 – Mean volume of delinquency amongst substance user sub-groups
Column percentages
User sub-group Age 13
(n=3602)
Age 14
(n=3533)
Age 15
(n=3497)
Non-user 5.8 5.8 4.6
Single substance user 17.2 16.6 11.4
Double substance user 31.7 26.3 20.8
Triple substance user 45.4 43.2 34.1 Note: Non-user group includes non-regular users.

41
REFERENCES
Best, D., Rawaf, S., Rowley, J., Floyd, K., Manning, V. and Strang, J. (2000) “Drink-
ing and smoking as concurrent predictors of illicit drug use and positive drug attitudes
in adolescents” Drug and Alcohol Dependence, 60:319-321
Burniston, S., Dodd, M., Elliott, L., Orr, L. and Watson, L. (2002) Drug treatment
services for young people: A research review Edinburgh: Scottish Executive Effective
Interventions Unit
Caldwell, L.L. and Darling, N. (1996) “Examining the influence of leisure activities,
parents, peers and personal characteristics on partying and substance use of adoles-
cents: an ecological perspective”. Paper presented to the 1996 Leisure Research
Symposium, Kansas City, MO.
Currie, C., Fairgrieve, J., Akhtar, P. and Currie, D. (2003) Scottish Schools Adolescent
Lifestyle and Substance Use Survey (SALSUS): National Report National Statistics
Publication, Edinburgh: The Stationary Office
Everett, S.A., Giovino, G.A., Warren, C.W., Crossett, L. and Kann, L. (1998) “Other
substance use among high school students who use tobacco” Journal of Adolescent
Health, 23:289-296
Eysenck, H.J (1977) Crime and personality. London : Routledge and Kegan Paul.
Eysenck, S.B.J., Easting, G., and Pearson, P.R. (1984) Age-norms for impulsiveness,
venturesomeness and empathy in children. Personality and Individual Differences,
5:315-321.
Grant, B.F., Hasin, D.S., Stinson, F.S., Dawson, D.A., Chou, S.P., Ruan, W.J. and
Pickering, R.P. (2004) “Prevalence, Correlates, and Disability of Personality Disor-
ders in the United States: Results from the National Epidemiologic Survey on Alcohol
and Related Conditions” Journal of Clinical Psychiatry 65:948-958
Kung, E.M. and Farrell, A.D. (2000) “The role of parents and peers in early adoles-
cent substance use: an examination of mediating and moderating effects” Journal of
child and family studies, 9, 4:509-528
Lancaster, B and Duddleston, A (2002) Attitudes towards alcohol: views of problem
drinkers, alcohol service users and their families and friends. Edinburgh: The Scot-
tish Executive Health and Community Care Research Findings No. 12.
McVie, S., Campbell, S. and Lebov, K. (2004) Scottish Crime Survey 2003. Edin-
burgh: Scottish Executive Social Research
NHS Health Scotland and ASH Scotland (2003) Reducing smoking and tobacco re-
lated harm: A key to transforming Scotland’s Health. Edinburgh: Health Scotland

42
Plant, M. (1992) “Alcohol, tobacco and illicit drug use in Scotland” in Plant, M.,
Ritson, B. and Robertson, R. (eds.) Alcohol and Drugs: The Scottish Experience, Ed-
inburgh: Edinburgh University Press
Portman Group (2002) Counting the cost: the measurement and recording of alcohol-
related violence and disorder. London: Social Issues Research Centre Portman
Group.
Potter, K (2002) Consultation with children and young people on the Scottish Execu-
tive’s Plan for Action on Alcohol Misuse. Edinburgh: Scottish Executive Central Re-
search Unit
Pudney, S. (2002) The road to ruin? Sequences of initiation into drug use and offend-
ing by young people in Britain Home Office Research Study 253, London: Home Of-
fice Research and Development Statistics Directorate
Reid Howie Associates (2001) Towards A Plan for Action on Alcohol Misuse: Sum-
mary of Evidence Edinburgh: Scottish Executive Central Research Unit
Rosenberg, M. (1965) Society and the Adolescent Self-Image. Princeton, NJ: Prince-
ton University Press.
Scottish Affairs Committee (1994) Drug Abuse in Scotland Volumes 1 and 2, Lon-
don: House of Commons
Scottish Executive (2000) Protecting Our Future: Scottish Executive’s Drug Action
Plan, Edinburgh: Scottish Executive
http://www.scotland.gov.uk/library2/doc15/dap-00.asp
Scottish Executive (2001) Annual Report on Drug Misuse Edinburgh: Scottish Ex-
ecutive
http://www.scotland.gov.uk/library3/social/ardm-00.asp
Scottish Executive (2002a) Plan for Action on Alcohol Problems. Edinburgh: The
Scottish Executive Health and Community Care
Scottish Executive (2002b) Alcohol problems support and treatment services frame-
work. Edinburgh: The Scottish Executive Information and Communication
Scottish Executive (2004) A breath of fresh air for Scotland. Improving Scotland’s
health: the challenge. Tobacco Control Action Plan. Edinburgh: The Scottish Execu-
tive Health and Community Care
Scottish Office (1994) Drugs in Scotland: Meeting the Challenge: Report of Ministe-
rial Drugs Task Force Edinburgh: HMSO
Scottish Office (1998) Working Together for a healthier Scotland: A Consultation
Paper Cmnd 3854, Edinburgh: The Stationary Office

43
Scottish Office (1999a) Towards a healthier Scotland – A White Paper on Health, Ed-
inburgh: The Stationery Office
http://www.scotland.gov.uk/library/documents-w7/tahs-00.htm
Scottish Office (1999b) Tackling Drugs in Scotland: Action in Partnership Edin-
burgh: The Stationery Office
Scottish Parliament (2000) Drug misuse: Issues and Strategies Research Note 00/05,
The Scottish Parliament Information Centre
http://www.drugmisuse.isdscotland.org/policy/rn00-05.pdf
Sewell, K (2002) International alcohol policies: A selected literature review. Edin-
burgh: The Scottish Executive Central Research Unit.
Shaw, A., McMunn, A. and Field, J (eds.) (2000) The Scottish Health Survey 1998:
Volume 1 Edinburgh: Scottish Executive Department of Health
Smith, D.J. (2004) The links between victimization and offending. Edinburgh: The
Edinburgh Study of Youth Transitions and Crime, Report No. 5.
Smith, D. J. and McVie, S. (2003) “Theory and methods in the Edinburgh Study of
Youth Transitions and Crime” British Journal of Criminology, 43, 1:169-195
Smith, D.J., McVie, S., Woodward, R., Shute,J., Flint, J., McAra, L. (2001) The Ed-
inburgh Study of Youth Transitions and Crime: Key Findings at Ages 12 and 13
www.law.ed.ac.uk/cls/esytc/findingsreport.htm
Sun, F., Cousineau, M.M., Brochu, S. and White, N.D. (2004) “Psychoactive sub-
stance consumption and seriousness of crimes committed by users” Canadian Journal
of Criminology and Criminal Justice, 46, 1:1-26
Sutherland, I. and Shepherd, J.P. (2002) “A personality-based model of adolescent
violence” British journal of criminology, 42, 2:433-441
Wadsworth, E.J.K, Simpson, S.A., Moss, S.C and Smith, A.P. (2004) ‘Recreational
drug use: patterns from a South Wales self-report study’. Journal of Psychopharma-
cology, 18, 2: 228-237
White, H.R., and Labouvie, E.W. (1989) “Towards the assessment of adolescent prob-
lem drinking” Journal of Studies in Alcohol 50:30-37
White, H.R., Tice, P.C., Loeber, R. and Stouthamer-Loeber, M. (2002) “Illegal acts
committed by adolescents under the influence of alcohol and drugs” Journal of Re-
search in Crime and Delinquency, 39, 2:131-152
Wills, T.A., Sandy, J.M., and Yaeger, A. (2000) “Temperament and adolescent sub-
stance use: an epigenetic approach to risk and protection” Journal of Personality, 68,
6:1127-1151
UK White Paper (1998) Smoking kills. London: HMSO.

44


