27
Economy & Civil Construction Outlook Adrian Hart, Senior Manager Infrastructure & Mining
| Date post: | 25-Jan-2017 |
| Category: |
Business |
| Upload: | informa-australia |
| View: | 551 times |
| Download: | 0 times |

Economy & Civil Construction Outlook Adrian Hart, Senior Manager Infrastructure & Mining

Presentation Outline
Key Messages, Implications & Risks
Economic State of Play & Outlook
National Civil Construction Outlook
State Comparisons
Implications: Findings from the CCFWA Infrastructure Report 2015

Key Messages
National economy to continue growing below trend – but stronger
growth expected later this decade
Mining investment bust still has 2-3 years to run, impacting on the
economy and civil construction work. We have not hit bottom yet.
Vast differences in the economic and civil construction outlook
between the “resources” and “non-resources” states
Vast differences in the outlook between segments of the
construction industry, and within the civil construction market

Implications
For businesses: to plan and prepare for the substantial shifts in
construction work taking place over next 3-5 years, regionally and
by segment. Be aware of the drivers, opportunities and risks.
Where possible, use the current downturn to lock in lower costs
(interest rates, rents, wages, overheads) to be in the best shape
for the next upswing in the cycle.
For governments and infrastructure providers: to recognise the
best time to deliver projects and how to fund them. Use long term
planning to avoid unnecessary booms and busts in activity.
We need a political “New Deal” for infrastructure investment

Risks
Global: economic conditions end up worse than expected, driving
down commodity prices and resources investment even more
The $A stays too high for too long – even US$0.70 is high given
the appreciation of the US dollar against other currencies
Domestic: Public investment continues its decline (since 2010)
due to either a lack of productive infrastructure projects, or lack
of consensus on how to fund them
Political noise and electioneering stymie confidence and
spending in the economy

World Economic Growth
-4%
-2%
0%
2%
4%
6%
87 89 91 93 95 97 99 01 03 05 07 09 11 13 15 17
World OECD Australia
Year ended December Source: BIS Shrapnel, OECD, Consensus
Annual growth in Real GDP

Value of Australian exports by region
0%
5%
10%
15%
20%
25%
30%
35%
40%
45%
88 90 92 94 96 98 00 02 04 06 08 10 12 14
South Korea
European Union
USA
India
Year ended December Source: ABS
Percent of annual Australian exports
0%
5%
10%
15%
20%
25%
30%
35%
40%
45%
88 90 92 94 96 98 00 02 04 06 08 10 12 14
Greater China
Japan
Other East Asia
Year ended December Source: ABS
Percent of annual Australian exports

China’s Real GDP Growth
+ 0.3+ 0.4+ 0.5
+ 0.5+ 0.6
+ 0.8+ 1.0
+ 0.7+ 0.7
+ 1.0+ 1.0
+ 0.8+ 0.9
+ 1.0+ 1.0
+ 1.0
+ 1.1
0
4
8
12
16
20
0
4
8
12
16
20
00 01 02 03 04 05 06 07 08 09 10 11 12 13 14 15 16 17
Tho
usa
nd
s
Source: BIS Shrapnel, OECD, Consensus
$ Trillion, Real GDP (in constant PPP, $US 2008)
Annual change in Real GDP ($T)
$4.4 trillioneconomy in 2000
$17.8 trillioneconomy in 2017
Size of Australian economy in 2014(in constant PPP, $US 2008)
0%
2%
4%
6%
8%
10%
12%
14%
00 05 10 15 17
Year ended December
Percent
Annual GDP growth (%)
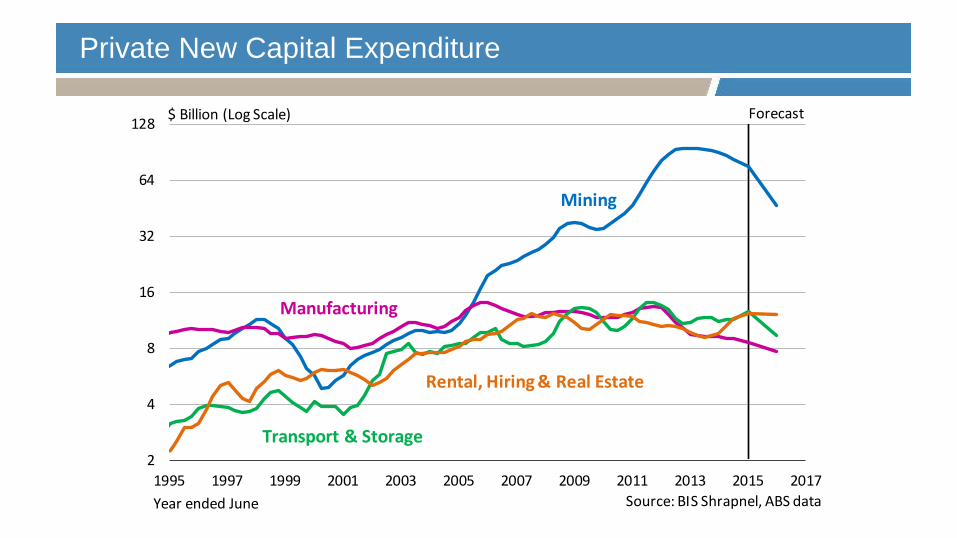
Private New Capital Expenditure
2
4
8
16
32
64
128
1995 1997 1999 2001 2003 2005 2007 2009 2011 2013 2015 2017
Mining
Forecast$ Billion (Log Scale)
Rental, Hiring & Real Estate
Manufacturing
Transport & Storage
Year ended June Source: BIS Shrapnel, ABS data
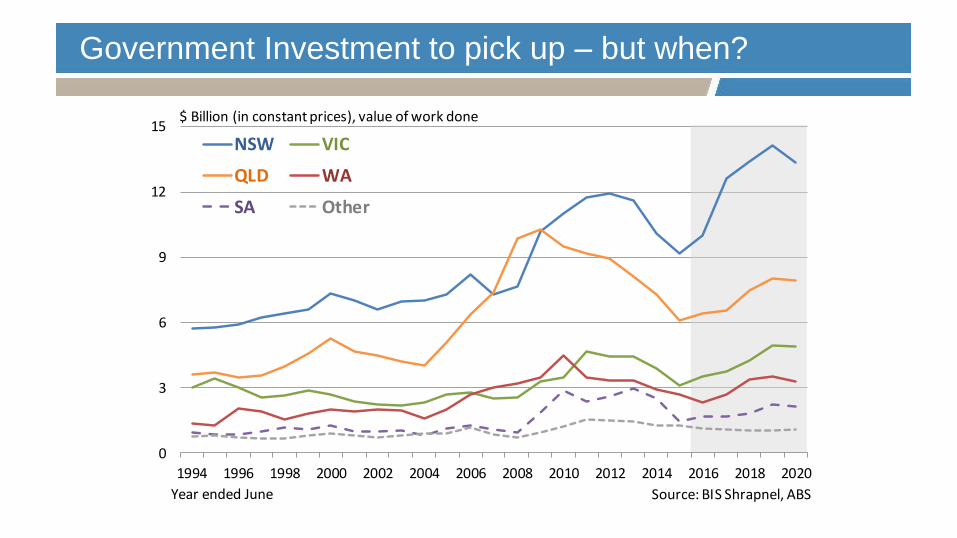
Government Investment to pick up – but when?
0
3
6
9
12
15
1994 1996 1998 2000 2002 2004 2006 2008 2010 2012 2014 2016 2018 2020
NSW VIC
QLD WA
SA Other
Year ended June Source: BIS Shrapnel, ABS
$ Billion (in constant prices), value of work done

Phases of construction in Australia
Housing boom/bust
Private funding boom
Resources boom
Public funding boom
0
50
100
150
200
250
1991 1993 1995 1997 1999 2001 2003 2005 2007 2009 2011 2013 2015
Year ended June
Engineering Construction
Non-Residential Building
Residential Building
Source: BIS Shrapnel, ABS
$ Billion

Construction – Australia Value of Work Done
0
50
100
150
200
250
2002 2004 2006 2008 2010 2012 2014 2016 2018 2020
Year ended June
Engineering Construction
Non-Residential Building
Residential Building
Source: BIS Shrapnel, ABS
$ Billion

Engineering Construction – Australia Value of Work Done
0
30
60
90
120
150
1996 1998 2000 2002 2004 2006 2008 2010 2012 2014 2016 2018 2020
Privately funded
Publicly funded
Total
Year ended June Source: BIS Shrapnel, ABS
$ Billion (in constant prices), value of work done

Mining and Heavy Industry Construction – Australia Value of Work Done
0
10
20
30
40
50
60
70
1996 1998 2000 2002 2004 2006 2008 2010 2012 2014 2016 2018 2020
Other heavy industry
Other minerals (includes iron ore)
Coal
Bauxite, alumina and aluminium
Oil and gas
Year ended June Source: BIS Shrapnel, ABS
Forecast$ Billion (in constant prices), value of work done

Construction – Australia Value of Work Done by State
0
10
20
30
40
50
60
1992 1994 1996 1998 2000 2002 2004 2006 2008 2010 2012 2014 2016 2018 2020
Source: BIS Shrapnel, ABS
$ Billion
Year ended June
NSW
QLD
VIC
WA
SA NT
ACT TAS

Challenges & Implications – From CCFWA Infrastructure Report 2015
End of resources boom requires new drivers for growth:
“Restoring full employment and growth after the end of the China resources boom … requires real
currency depreciation supported by public investment in productive infrastructure and
uninhibited productivity-raising reform.” – Ross Garnaut (2015)
“Monetary policy alone can't deliver everything we need and expecting too much from it can lead,
in time, to much bigger problems… Meanwhile, as often remarked, infrastructure spending has a role
to play in sustaining growth and also in generating confidence.” – Glenn Stevens (2015)
“Robust demand growth from advanced economies has not yet emerged despite continued very low
interest rates and easing of brakes to the recovery … in this context an increase in public
infrastructure investment, particularly for advanced economies with clearly identified infrastructure
needs and efficient public investment processes, could provide a boost to demand in the short
term and help raise potential output in the medium term.” – IMF World Economic Outlook (2014)

Challenges & Implications – From CCFWA Infrastructure Report 2015
Do we have clearly identified infrastructure needs? Do we have an
infrastructure deficit?
ABN Amro & Citigroup 2008 – Australian investment task between $450 - 770 billion
Engineers Australia 2010 – changes in investment needed to retain adequacy requirements
Infrastructure Australia 2013 – Australian infrastructure backlog measured at $300 billion
Property Council of Australia 2014 – WA infrastructure deficit measured at $60 billion
Infrastructure Australia 2015 – National Infrastructure Audit
Australia’s population to grow to 30.5 million by 2031
75% of this growth focused in Sydney, Melbourne, Brisbane and Perth
Biggest infrastructure gaps are in urban transport and regional water
Economic cost of congestion in Perth to rise to $15.9 billion per annum by 2031

Challenges & Implications – From CCFWA Infrastructure Report 2015
How can we fund infrastructure provision?
Private sector – when benefits of infrastructure provision can be captured
Public sector approaches:
User charges – can be politically difficult for some sectors such as roads
Capital recycling – all costs should be considered, including future regulation
Tax reforms – including road pricing, value catchment, betterment levies – not stamp duties!
Debt financing – raises servicing costs, but can be both efficient and equitable
Challenges for public sector funding
Choosing the most productive projects – requires transparent CBA and better industry data
Reforming procurement processes to lower costs as per Productivity Commission (2014)
Utilising a mix of funding mechanisms including debt – don’t lock out valid solutions
Requires a political “New Deal” in terms of advocacy for tax reform and debt funding

Challenges & Implications – From CCFWA Infrastructure Report 2015
Can we really use more debt for infrastructure provision?
Do we have a debt problem?
Public debt in Australia is not relatively high in Australia – but household debt is!
Commonwealth public debt around 16% of GDP, total public debt closer to 35%
114th largest public debt to GDP ratio, generally half that of our major trading partners
G20 public debt to GDP ratios averaging around 100% (not good either!)
IMF: Australia identified as having one of the world’s largest measure of “fiscal space”
Morgan Stanley: Australia could boost debt by $80 billion without losing AAA credit rating
Household debt has risen sharply to 100% of GDP from 30% in the early 1990s.
Costs of funding infrastructure through debt
Additional interest costs, even at record low rates
Potential loss of creditworthiness (credit rating) which could push up repayment costs
(Very real) risk of not choosing productive projects
Risk of confusing productive and unproductive debt – requires tax and spending reform!

Australia’s public debt position compared to our peers
0-20% of GDP
20-40% of GDP
40-75% of GDP
75%+ of GDP
Rank / Country
1 Japan 227.70 227.7
3 Greece 174.50 174.5
5 Italy 134.10 134.1
7 Portugal 131.00 131.0
9 Ireland 118.90 118.9
11 Singapore 106.70 106.7
15 Spain 97.60 97.6
16 France 95.50 95.5
20 Canada 92.60 92.6
24 United Kingdom 86.60 86.6
35 Germany 74.70 74.7
39 United States 71.20 71.2
67 India 51.30 51.3
112 New Zealand 35.30 35.3
113 Switzerland 34.70 34.7
114 Australia 34.50 34.5
129 Norway 29.60 29.6
133 Indonesia 23.90 23.9
137 China 22.40 22.4
144 Chile 16.50 16.5
159 Kuwait 6.80 6.8
163 Libya 2.90 2.9
164 Saudi Arabia 1.60 1.6
Net Debt as
Share of GDP
Source: IMF Datamapper
Source: CIA The World Factbook

Commonwealth net debt and interest payments as share of GDP
-0.2%
0.0%
0.2%
0.4%
0.6%
0.8%
1.0%
1.2%
1.4%
1.6%
1.8%
-5%
0%
5%
10%
15%
20%1
986
19
87
19
88
19
89
19
90
19
91
19
92
19
93
19
94
19
95
19
96
19
97
19
98
19
99
20
00
20
01
20
02
20
03
20
04
20
05
20
06
20
07
20
08
20
09
20
10
20
11
20
12
20
13
20
14
20
15e
20
16f
20
17f
20
18f
20
19f
Net Debt (LHS) Interest Payments (RHS)
Debt expected to peak
at levels similar to 1996
as a share of GDP.
Record low interest rates
mean servicing costs will
peak at a level 40% lower
than 1996.
Public debt would need to
rise by another $180
billion to match servicing
costs from 1996 as a
share of GDP.

Public sector net debt as share of GDP
Public debt as a share
of GDP remains well
below historical
averages, despite
rising since 2008
(Circled area matches
period of previous
slide)
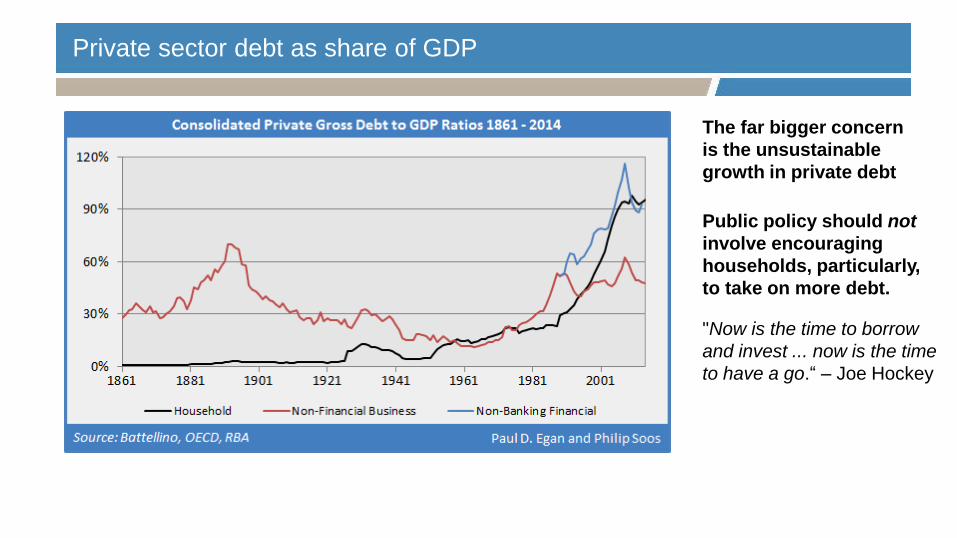
Private sector debt as share of GDP
The far bigger concern
is the unsustainable
growth in private debt
Public policy should not
involve encouraging
households, particularly,
to take on more debt.
"Now is the time to borrow
and invest ... now is the time
to have a go.“ – Joe Hockey

Fiscal Space – Distance to Debt Limit
246
241.1
228.1
224.5
222.9
214.5
209.5
202
196.7
193
191.1
188.8
171.7
167.9
165.1
158.1
156.6
151.1
149.8
145.3
132.6
124.3
116.9
115.2
105.5
58.8
0
0
0
0
0 50 100 150 200 250
Norway
South Korea
New Zealand
Hong Kong
Luxembourg
Australia
Taiwan
Switerland
Denmark
Singapore
Israel
Sweden
Finland
Germany
United States
Netherlands
Austria
Malta
Canada
Iceland
United Kingdom
Belgium
France
Spain
Ireland
Portugal
Japan
Italy
Greece
Cyprus
Fiscal Space: Distance to Debt Limit (Percentage Points)
Source: Moodys Analytics, IMF

Challenges & Implications
Benefits of using debt for infrastructure provision
Intergenerational equity: costs of infrastructure provision are spread across multiple generations,
to match the benefits accruing to future generations from infrastructure provision.
Economic efficiency (in special circumstances): the economic returns (output benefits) to
infrastructure provision exceed the costs and in some cases can even drive a decline in the public
debt to GDP ratio (IMF).
Gross multiplier impact of a boost to civil construction: 2.17
Initial Civil Construction Broader Economic Annual Interest Costs ($M) @
Boost ($M) Impact ($M) 2.5% 3.0% 3.5%
$250 $542 6.3 7.5 8.8
$500 $1,084 12.5 15.0 17.5
$750 $1,518 18.8 22.5 26.3
$1,000 $2,169 25.0 30.0 35.0

Challenges & Implications
The IMF has specifically endorsed debt funding for infrastructure in
Australia
“Increasing public investment (financed by more borrowing rather than offsetting measures) would
support aggregate demand and ensure against downside risks. It would also employ resources
released by the mining sector, catalyse private investment, boost productivity, take advantage of
record-low borrowing rates, and maintain the government’s net worth. Indeed, IMF research
suggests that economies like Australia—with an output gap, accommodative monetary policy,
and fiscal space—benefit most from debt-financed infrastructure investment, with the growth
boost largely containing the impact on the (low) debt-to-GDP ratio.” – IMF (2015)
But depends on the following factors:
Selecting the best projects through transparent CBA
Having spare industry capacity (keeping costs of procurement low)
Taking advantage of low interest rates and fiscal space may require:
Establishing consensus with State and Federal Governments on debt and tax/spend reform
Separation of “Opex” and “Capex” spending in the Budget
A political “New Infrastructure Deal”?


