Dottorato di Ricerca in Strutture ed Infrastrutture VII ciclo – nuova serie
Part of this thesis is included within a Cooperation Agreement between the Università Politecnica delle Marche and the EMPA (Swiss Federal Laboratories for Materials Testing and Re-search). An advanced characterization of fatigue resistance and mois-ture damage of bituminous mixes was performed in the Road Engineering and Sealing Components Laboratory at EMPA un-der the supervision of Prof. Dr. Manfred N. Partl, Head of Labo-ratory.
Table of contents
1
Table of contents:
List of tables ...................................................................... 5
List of figures ..................................................................... 7
4.1.1 Laboratory vs. in Situ Results ......................................................... 109 4.1.2 Comparison between Different Materials ........................................ 111
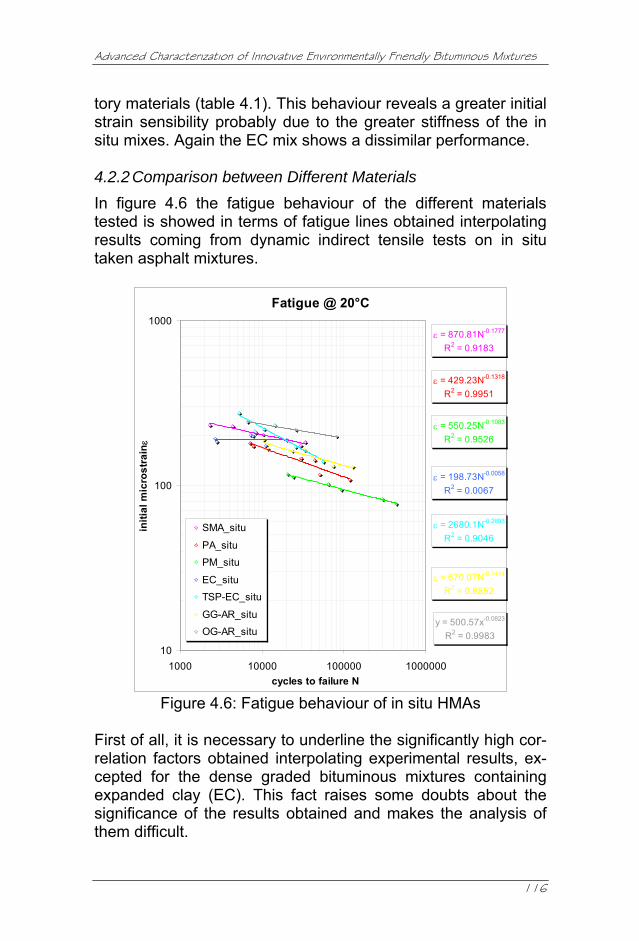
4.2 FATIGUE LIFE ..................................................................................... 113 4.2.1 Laboratory vs. In Situ Results ......................................................... 113 4.2.2 Comparison between Different Materials ........................................ 116
4.3 RUTTING RESISTANCE ......................................................................... 118 4.3.1 Laboratory vs. In Situ Results ......................................................... 118 4.3.2 Comparison between Different Materials ........................................ 121
4.4 WATER SENSITIVITY WITH CAST ......................................................... 124 4.4.1 Experimental Output ....................................................................... 124 4.4.2 Water Sensitivity Index ................................................................... 129 4.4.3 Temperature Sensitivity Index ........................................................ 132
4.5 MECHANICAL CHARACTERIZATION OF SSCR MIX ................................... 135
7.2 TESTING AND MODELS ........................................................................ 192 7.2.1 Laboratory-scale Test Methods ...................................................... 193 7.2.2 Macro-scale Test Methods .............................................................. 197 7.2.3 Pilot Site and Simulations ............................................................... 198
8.2 TRIAL SECTION ................................................................................... 208 8.3 TEST PROGRAM ................................................................................. 210
8.3.1 In Situ Evaluation of De-polluting Properties ................................... 210 8.3.2 Laboratory Evaluation of De-polluting Properties ............................ 213
9.De-pollution properties ............................................... 215 9.1 IN SITU RESULTS ................................................................................ 215
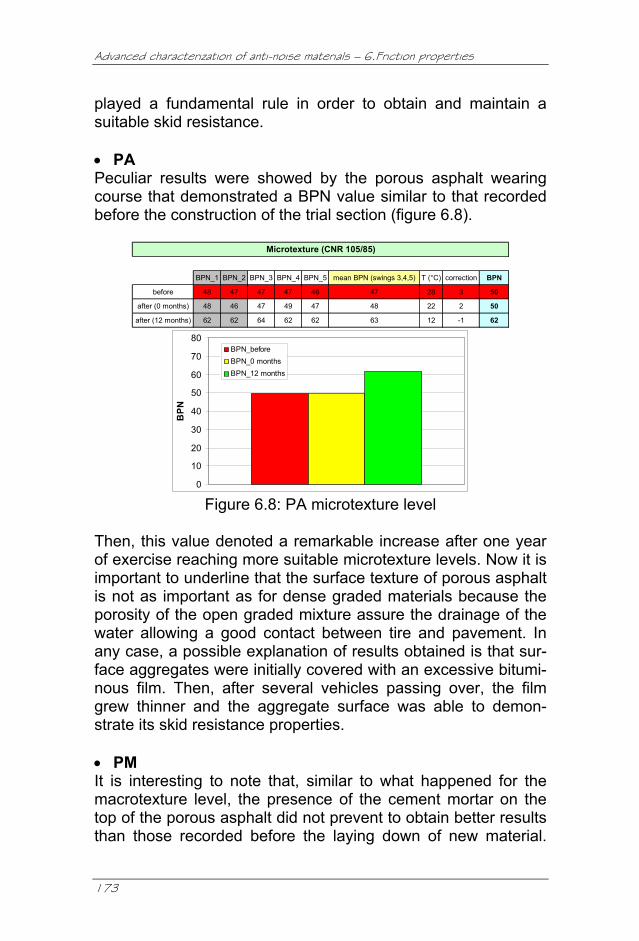
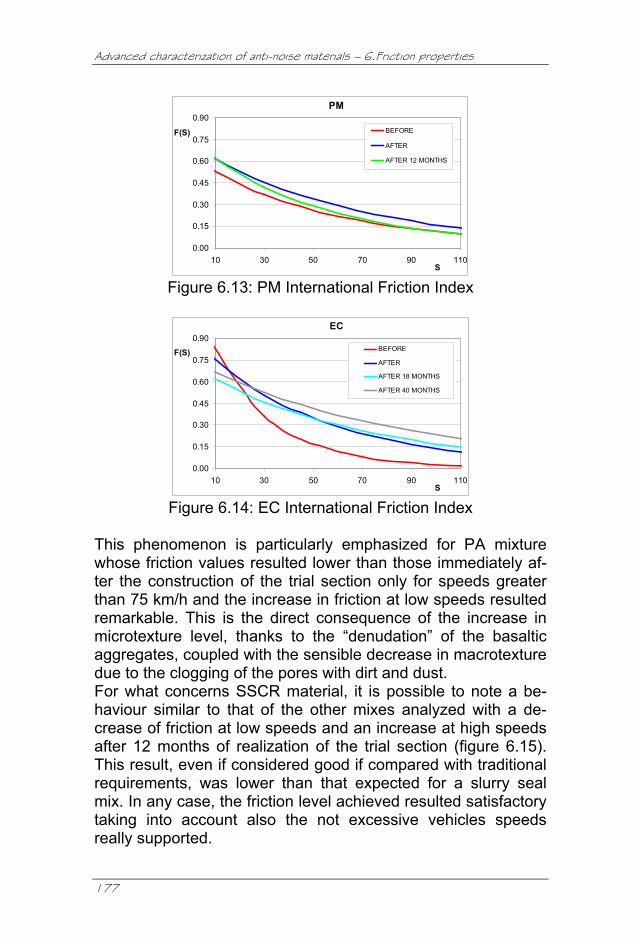
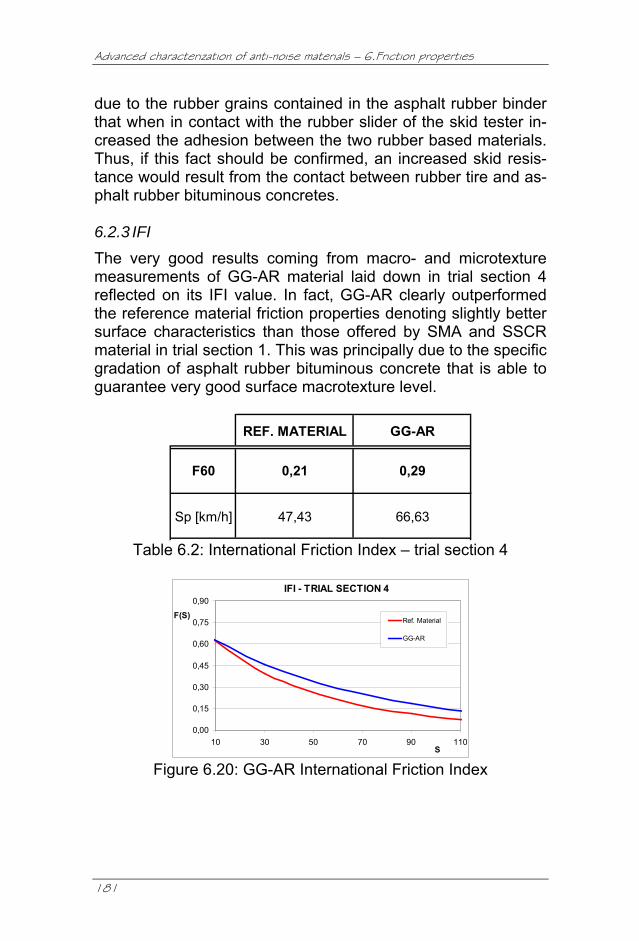
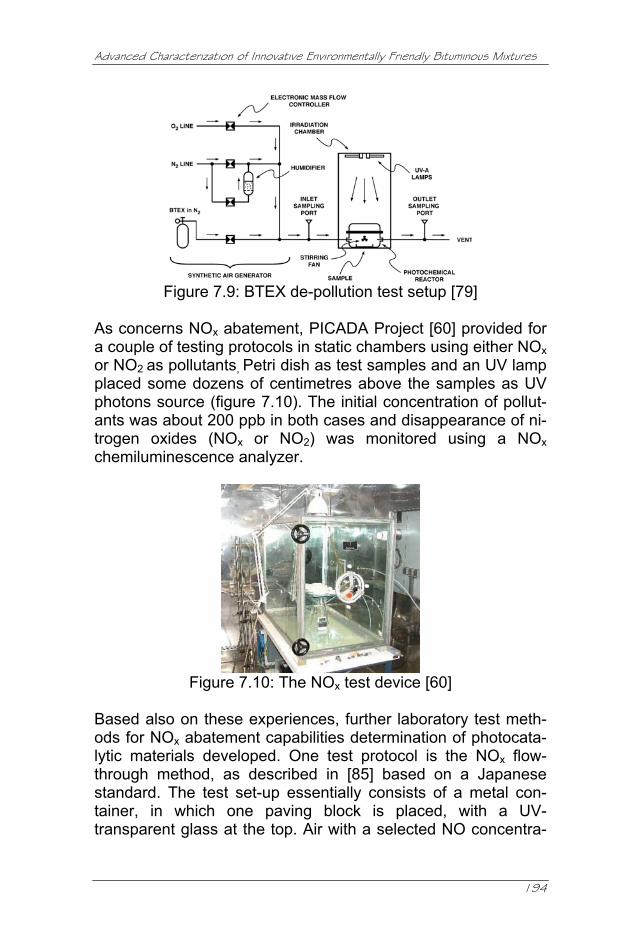
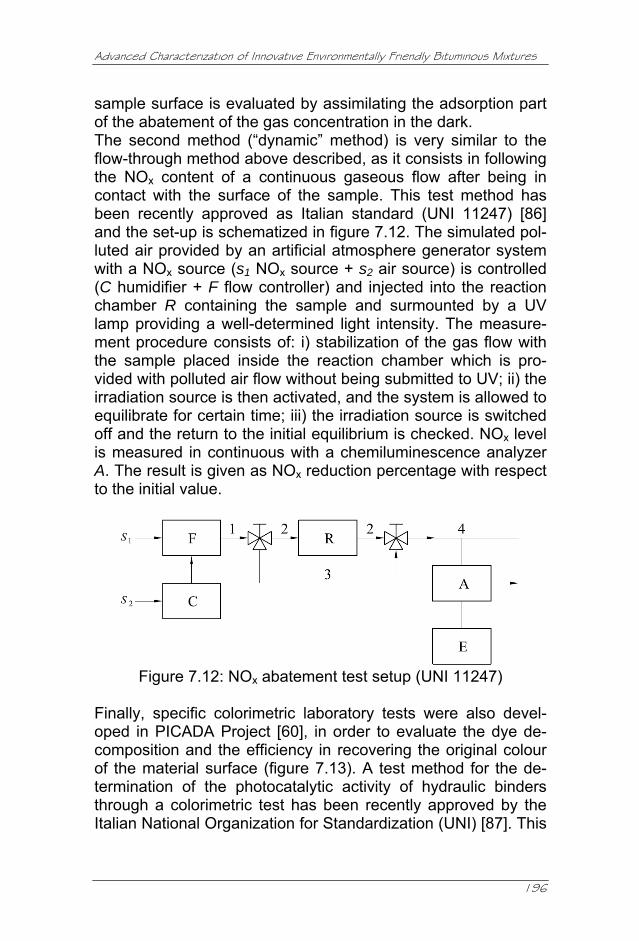
Figure 6.7: SSCR microtexture level ..................................... 172 Figure 6.8: PA microtexture level ........................................... 173 Figure 6.9: PM microtexture level .......................................... 174 Figure 6.10: EC microtexture level ........................................ 174 Figure 6.11: SMA International Friction Index ........................ 176 Figure 6.12: PA International Friction Index ........................... 176 Figure 6.13: PM International Friction Index .......................... 177 Figure 6.14: EC International Friction Index .......................... 177 Figure 6.15: SSCR International Friction Index ..................... 178 Figure 6.16: Initial International Friction Index ....................... 178 Figure 6.17: IFI after 12 months of practice ........................... 179 Figure 6.18: Macrotexture level of trial section 4 ................... 180 Figure 6.19: Microtexture level of trial section 4 .................... 180 Figure 6.20: GG-AR International Friction Index .................... 181 Figure 7.1: NOx reduction from pavement blocks [64] ........... 186 Figure 7.2: Photocatalytic process ......................................... 187 Figure 7.3: De-soiling effect [63] ............................................ 189 Figure 7.4: Anti-fogging effect [63] ......................................... 189 Figure 7.5: Photocatalytic conversion of NO2 by TiO2 [76] .... 190 Figure 7.6: Degradation of NO from different products [78] ... 191 Figure 7.7: Photocatalytic activity vs. BTEX [60] ................... 191 Figure 7.8: The PICADA partners [60] ................................... 193 Figure 7.9: BTEX de-pollution test setup [79] ........................ 194 Figure 7.10: The NOx test device [60] .................................... 194 Figure 7.11: NOx abatement “static” test method [85] ............ 195 Figure 7.12: NOx abatement test setup (UNI 11247) ............. 196 Figure 7.13: Samples subjected to de-soiling test [60] .......... 197 Figure 7.14: A scheme of the “Indoortron” chamber [60] ....... 197 Figure 7.15: The canyon street pilot site [60] ......................... 199 Figure 7.16: 3-D simulation of NOx concentration [92] ........... 200 Figure 7.17: Photo-activity of cement-based materials [58] ... 200 Figure 7.18: “Dives in Misericordia” Church [93] .................... 201 Figure 7.19: Road application in Antwerp (Belgium) [64] ....... 203 Figure 7.20: NOx measurements in Antwerp [64] .................. 204 Figure 7.21: Road application in Bergamo (Italy) [88] ............ 204 Figure 7.22: NOx measurements in Bergamo (Italy) [88] ....... 205 Figure 7.23: Road application in Segrate (Italy) ..................... 205 Figure 7.24: Road application in Gaiofana (Italy) ................... 206 Figure 8.1: Application of the photocatalytic cement mortar .. 209 Figure 8.2: Application of the photocatalytic spray product ... 209 Figure 8.3: Environmental measuring station ........................ 211
Advanced Characterization of Innovative Environmentally Friendly Bituminous Mixtures
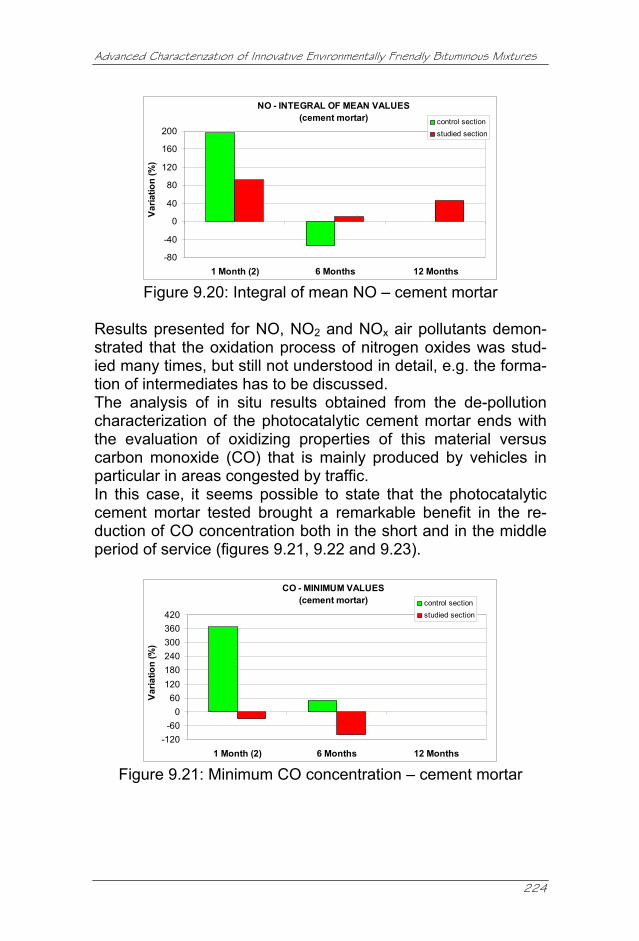
12
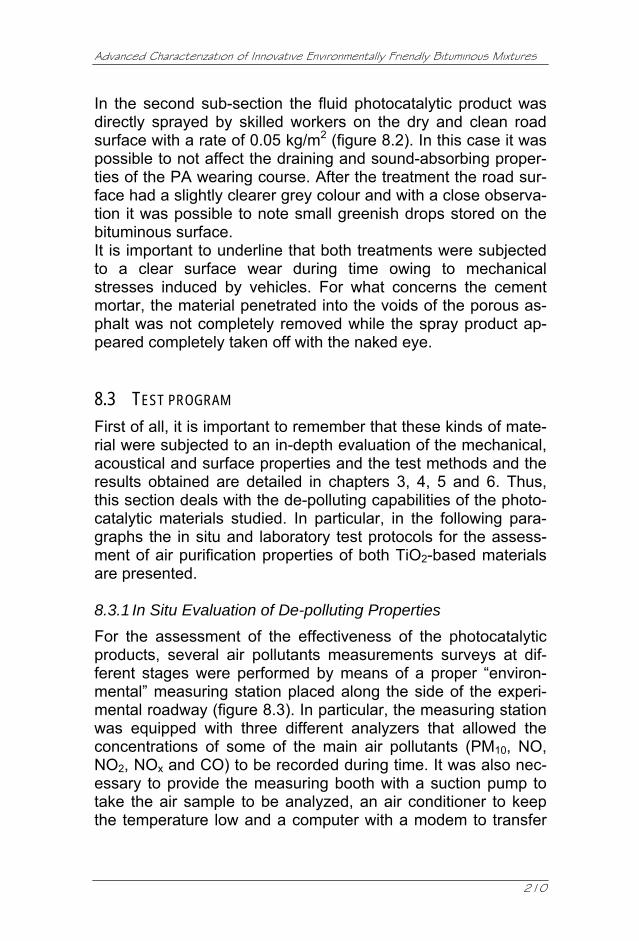
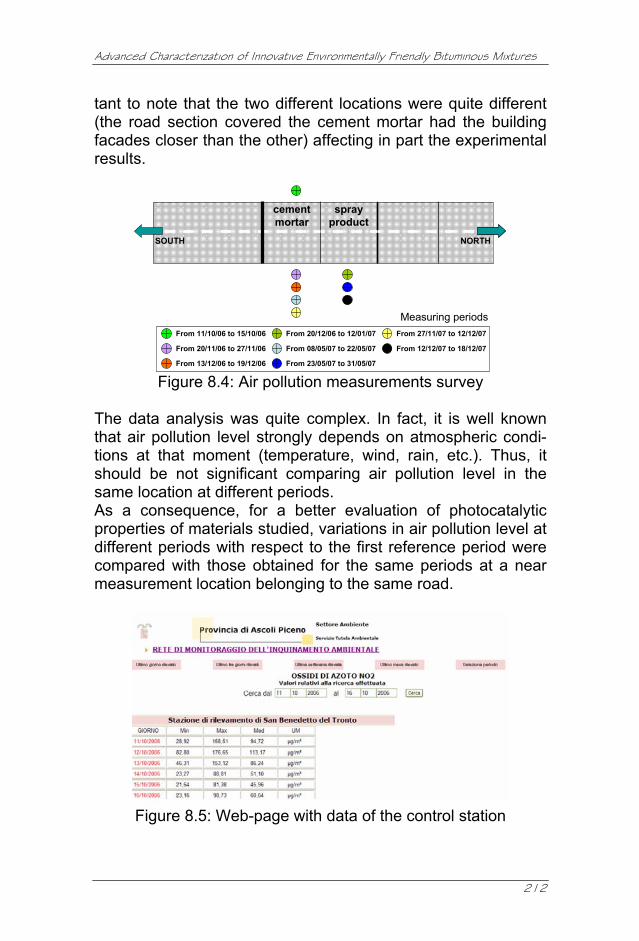
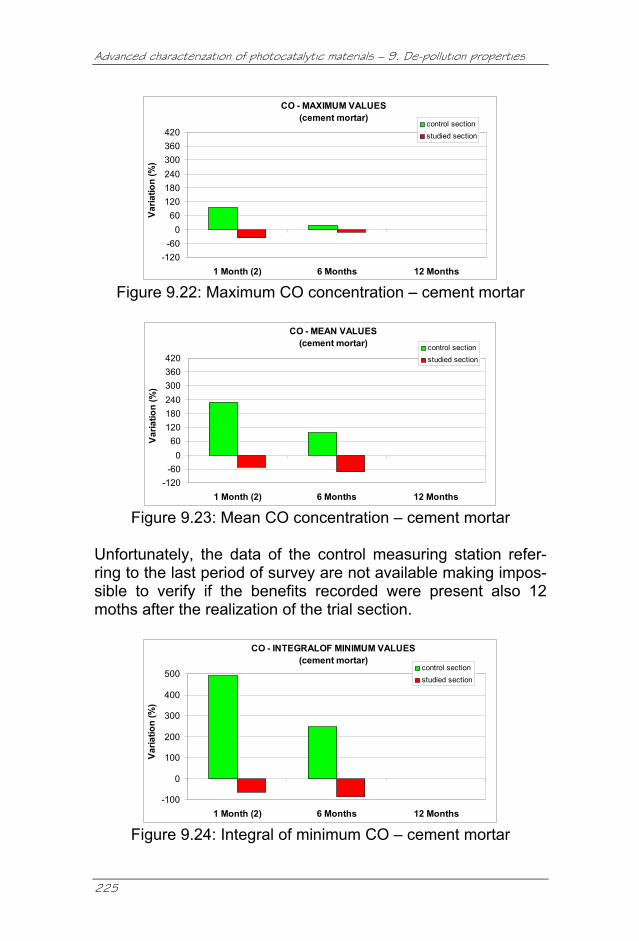
Figure 8.4: Air pollution measurements survey ...................... 212 Figure 8.5: Web-page with data of the control station ........... 212 Figure 8.6: Example of data analysis ..................................... 213 Figure 9.1: Mean PM10 concentration – cement mortar ......... 216 Figure 9.2: Integral of mean PM10 – cement mortar .............. 216 Figure 9.3: Minimum NOx concentration – cement mortar ..... 217 Figure 9.4: Maximum NOx concentration – cement mortar .... 217 Figure 9.5: Mean NOx concentration – cement mortar .......... 218 Figure 9.6: Integral of minimum NOx – cement mortar .......... 218 Figure 9.7: Integral of maximum NOx – cement mortar ......... 219 Figure 9.8: Integral of mean NOx – cement mortar ................ 219 Figure 9.9: Minimum NO2 concentration – cement mortar ..... 220 Figure 9.10: Maximum NO2 concentration – cement mortar .. 220 Figure 9.11: Mean NO2 concentration – cement mortar ........ 220 Figure 9.12: Integral of minimum NO2 – cement mortar ........ 221 Figure 9.13: Integral of maximum NO2 – cement mortar ....... 221 Figure 9.14: Integral of mean NO2 – cement mortar .............. 221 Figure 9.15: Minimum NO concentration – cement mortar .... 222 Figure 9.16: Maximum NO concentration – cement mortar ... 222 Figure 9.17: Mean NO concentration – cement mortar .......... 223 Figure 9.18: Integral of minimum NO – cement mortar .......... 223 Figure 9.19: Integral of maximum NO – cement mortar ......... 223 Figure 9.20: Integral of mean NO – cement mortar ............... 224 Figure 9.21: Minimum CO concentration – cement mortar .... 224 Figure 9.22: Maximum CO concentration – cement mortar ... 225 Figure 9.23: Mean CO concentration – cement mortar .......... 225 Figure 9.24: Integral of minimum CO – cement mortar .......... 225 Figure 9.25: Integral of maximum CO – cement mortar ......... 226 Figure 9.26: Integral of mean CO – cement mortar ............... 226 Figure 9.27: Mean PM10 concentration – spray product ........ 227 Figure 9.28: Integral of mean PM10 – spray product .............. 227 Figure 9.29: Minimum NOx concentration – spray product .... 228 Figure 9.30: Maximum NOx concentration – spray product ... 228 Figure 9.31: Mean NOx concentration – spray product .......... 228 Figure 9.32: Integral of minimum NOx – spray product .......... 229 Figure 9.33: Integral of maximum NOx – spray product ......... 229 Figure 9.34: Integral of mean NOx – spray product ............... 229 Figure 9.35: Minimum NO2 concentration – spray product .... 230 Figure 9.36: Maximum NO2 concentration – spray product ... 230 Figure 9.37: Mean NO2 concentration – spray product .......... 230 Figure 9.38: Integral of minimum NO2 – spray product .......... 231
List of figures
13
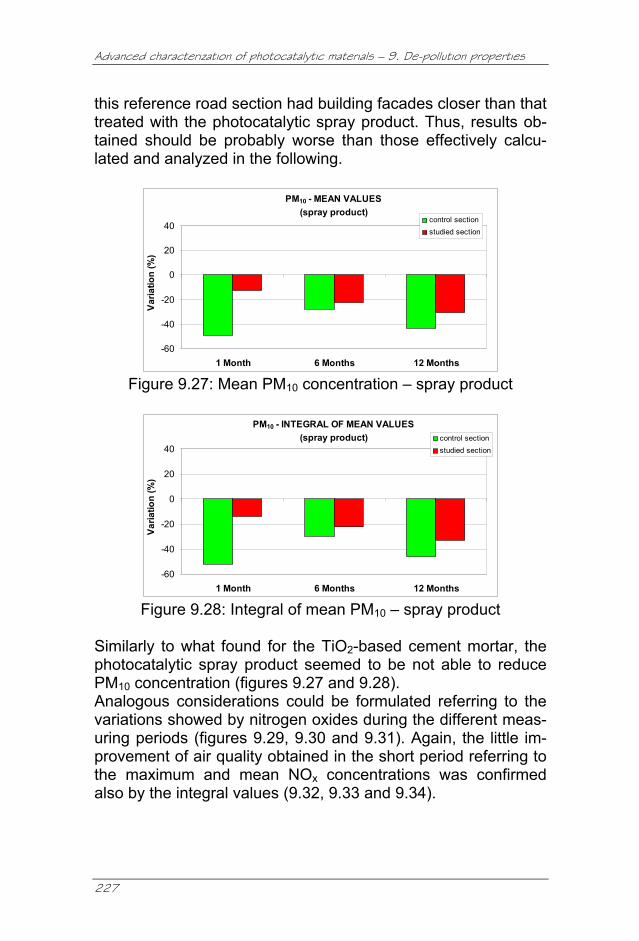
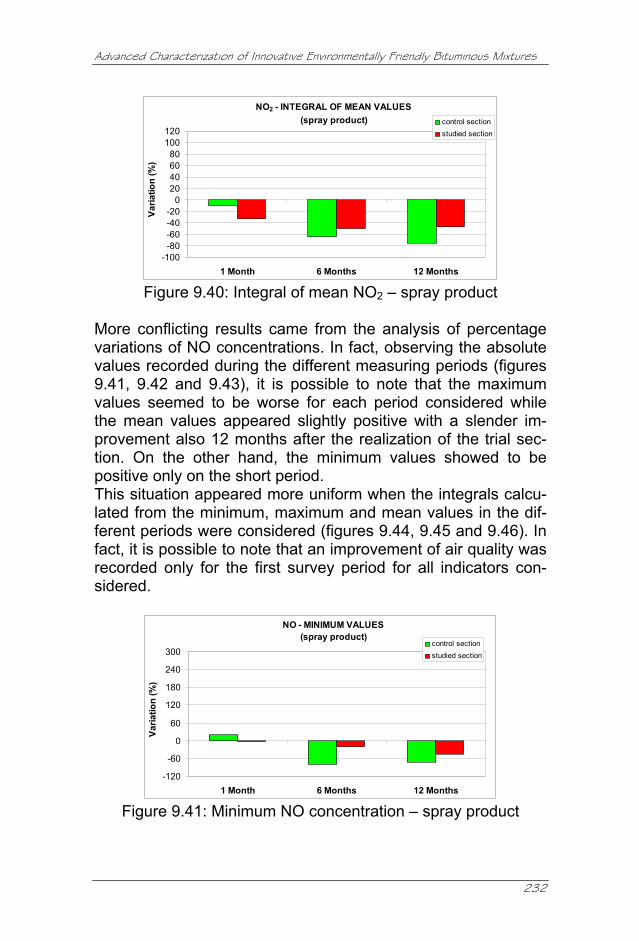
Figure 9.39: Integral of maximum NO2 – spray product ......... 231 Figure 9.40: Integral of mean NO2 – spray product ............... 232 Figure 9.41: Minimum NO concentration – spray product ..... 232 Figure 9.42: Maximum NO concentration – spray product .... 233 Figure 9.43: Mean NO concentration – spray product ........... 233 Figure 9.44: Integral of minimum NO – spray product ........... 233 Figure 9.45: Integral of maximum NO – spray product .......... 234 Figure 9.46: Integral of mean NO – spray product ................. 234 Figure 9.47: Minimum CO concentration – spray product ..... 235 Figure 9.48: Maximum CO concentration – spray product .... 235 Figure 9.49: Mean CO concentration – spray product ........... 235 Figure 9.50: Integral of minimum CO – spray product ........... 236 Figure 9.51: Integral of maximum CO – spray product .......... 236 Figure 9.52: Integral of mean CO – spray product ................. 236 Figure 9.53: Laboratory test – reference sample (0.5 l/min) .. 237 Figure 9.54: Laboratory test – reference sample (1.0 l/min) .. 238 Figure 9.55: Laboratory test – reference sample (1.5 l/min) .. 238 Figure 9.56: Laboratory test – cement mortar (0.5 l/min) ....... 239 Figure 9.57: Laboratory test – cement mortar (1.0 l/min) ....... 239 Figure 9.58: Laboratory test – cement mortar (1.5 l/min) ....... 240 Figure 9.59: Laboratory test – spray product (0.5 l/min) ........ 240 Figure 9.60: Laboratory test – spray product (1.0 l/min) ........ 241 Figure 9.61: Laboratory test – spray product (1.5 l/min) ........ 241
Advanced Characterization of Innovative Environmentally Friendly Bituminous Mixtures
14
Abstract
15
Abstract Nowadays the environmental sustainability is one of the main issues which developed countries have to deal with. In particu-lar, noise and air pollution significantly lower the standard of liv-ing of millions of people in many urban contexts. Roads have a negative indirect impact on environment mainly owing to the acoustic and atmospheric pollution caused by traffic. On this subject, road research is more and more addressing its studies to possible solutions for these problems. This thesis intended to give a contribution evaluating acoustic and air de-polluting properties of innovative environmentally friendly road materials. In particular, several bituminous mixtures for wearing courses have been investigated in order to obtain materials with ad-vanced acoustic properties in reducing tire/road noise genera-tion mechanisms and/or enhancing sound absorption proper-ties. This aim has been pursued acting on composition (granu-lometric distribution and binder content) and/or preparing mate-rials with components having enhanced acoustic properties. Similarly, a couple of photocatalytic materials containing tita-nium dioxide (TiO2) and specifically prepared for road pave-ments have been evaluated in terms of air de-polluting proper-ties. These potentialities arise directly from special chemical properties of TiO2. Some of the materials investigated give also further environ-mental benefits such as, for example, reduced exploitation of mineral natural resources or re-use of waste materials other-wise addressed to the disposal. Innovative road materials can be successfully considered as long as they satisfy requirements in terms of safety and durabil-ity. Taking into account this consideration, materials selected have been subjected to advanced mechanical and surface characterization through laboratory and in situ tests. These lat-ter have been possible thanks to the construction of proper trial sections in different urban roads.
Advanced Characterization of Innovative Environmentally Friendly Bituminous Mixtures
16
The advanced study of mechanical and functional properties of different environmentally friendly road materials for wearing courses is presented within this thesis. In particular, mechanical performance has been analyzed in terms of stiffness, permanent deformation (rutting) and fatigue behaviour. Specific test protocols have been selected for more innovative materials. Acoustic properties have been studied through in situ and labo-ratory tests. In situ tests provided for the measurement of sound levels alongside the roadway while laboratory tests allowed sound absorption properties to be determined. Similar approach has been selected to evaluate air de-polluting capabilities of photocatalytic materials based on in situ air pollu-tion measurements and laboratory characterization by means of innovative test protocols. The different trial sections allowed also skid resistance proper-ties of the different materials tested to be checked.
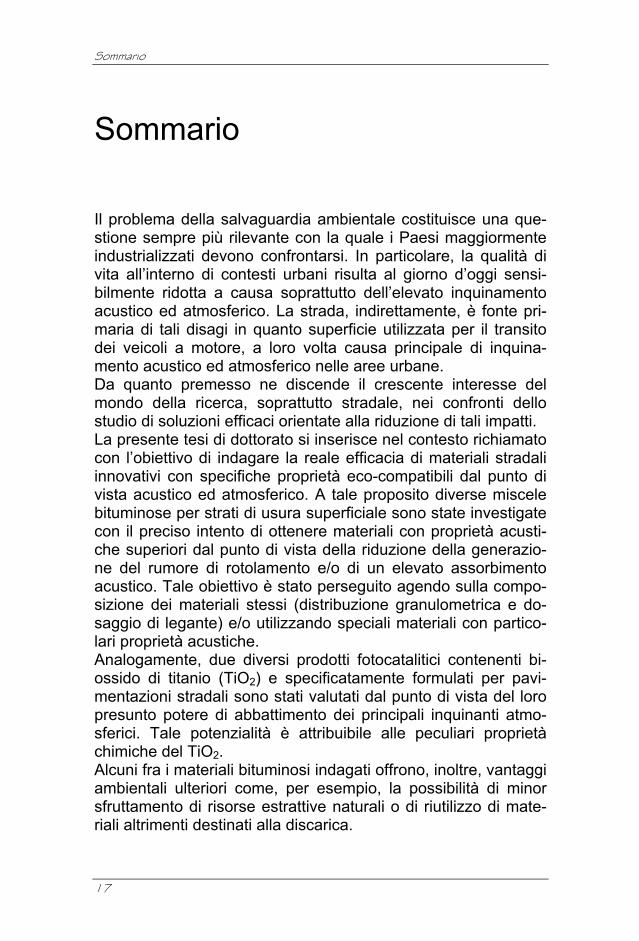
Sommario
17
Sommario Il problema della salvaguardia ambientale costituisce una que-stione sempre più rilevante con la quale i Paesi maggiormente industrializzati devono confrontarsi. In particolare, la qualità di vita all’interno di contesti urbani risulta al giorno d’oggi sensi-bilmente ridotta a causa soprattutto dell’elevato inquinamento acustico ed atmosferico. La strada, indirettamente, è fonte pri-maria di tali disagi in quanto superficie utilizzata per il transito dei veicoli a motore, a loro volta causa principale di inquina-mento acustico ed atmosferico nelle aree urbane. Da quanto premesso ne discende il crescente interesse del mondo della ricerca, soprattutto stradale, nei confronti dello studio di soluzioni efficaci orientate alla riduzione di tali impatti. La presente tesi di dottorato si inserisce nel contesto richiamato con l’obiettivo di indagare la reale efficacia di materiali stradali innovativi con specifiche proprietà eco-compatibili dal punto di vista acustico ed atmosferico. A tale proposito diverse miscele bituminose per strati di usura superficiale sono state investigate con il preciso intento di ottenere materiali con proprietà acusti-che superiori dal punto di vista della riduzione della generazio-ne del rumore di rotolamento e/o di un elevato assorbimento acustico. Tale obiettivo è stato perseguito agendo sulla compo-sizione dei materiali stessi (distribuzione granulometrica e do-saggio di legante) e/o utilizzando speciali materiali con partico-lari proprietà acustiche. Analogamente, due diversi prodotti fotocatalitici contenenti bi-ossido di titanio (TiO2) e specificatamente formulati per pavi-mentazioni stradali sono stati valutati dal punto di vista del loro presunto potere di abbattimento dei principali inquinanti atmo-sferici. Tale potenzialità è attribuibile alle peculiari proprietà chimiche del TiO2. Alcuni fra i materiali bituminosi indagati offrono, inoltre, vantaggi ambientali ulteriori come, per esempio, la possibilità di minor sfruttamento di risorse estrattive naturali o di riutilizzo di mate-riali altrimenti destinati alla discarica.
Advanced Characterization of Innovative Environmentally Friendly Bituminous Mixtures
18
Nella formulazione di materiali stradali innovativi occorre consi-derare in ogni caso le caratteristiche primarie di durabilità e a-derenza che le pavimentazioni stradali devono garantire al fine di offrire adeguate sicurezza e confort di guida. Alla luce di tale considerazione, i materiali stradali analizzati sono stati sottopo-sti in prima analisi ad approfondita caratterizzazione meccanica e delle proprietà superficiali per mezzo di prove in laboratorio ed in sito. Queste ultime sono risultate possibili grazie alla rea-lizzazione di stese sperimentali in corrispondenza di specifici tronchi stradali urbani. In definitiva, lo studio avanzato delle proprietà meccaniche e funzionali di diversi materiali bituminosi per strati di usura aventi particolari caratteristiche eco-compatibili è presentato all’interno di tale tesi di dottorato. In particolare le prestazioni meccaniche delle miscele sono sta-te analizzate principalmente in termini di modulo di rigidezza e di resistenza a fatica ed all’ormaiamento. Protocolli di prova specifici sono stati inoltre previsti per materiali maggiormente innovativi. Per quanto riguarda le prestazioni acustiche, lo studio è avve-nuto mediante prove in sito, grazie al monitoraggio dei livelli so-nori lungo diversi tronchi pilota appositamente realizzati, ed in laboratorio, attraverso la determinazione dell’assorbimento acu-stico. Approccio simile è stato seguito per la valutazione delle capaci-tà disinquinanti di materiali fotocatalitici sulla base di monito-raggi in sito con centraline ambientali e caratterizzazione di la-boratorio per mezzo di protocolli di prova originali. Le diverse stese sperimentali hanno altresì permesso il control-lo delle proprietà di aderenza superficiale offerte dai vari manti stradali realizzati.
Introduction
19
Introduction Nowadays the environmental sustainability is one of the main issues which developed countries have to deal with. Roads have a negative impact on environment mainly owing to the great amount of natural resources employed during con-struction, but also, indirectly, because of acoustic and atmos-pheric pollution caused by traffic travelling on them. These negative effects related to road infrastructures are con-sidered a serious problem on many urban contexts all over the world because they significantly lower the standard of living of millions of people. Economic development brings with it an increase in traffic vol-ume and vehicle speed, producing an increase in noise and air pollution levels. To improve quality of life while at the same time respecting economic development, Public Administrations have to take considerable action in order to minimize traffic noise and air pollution. In this context innovative solutions for road pavement materials can be successfully considered as long as they satisfy transpor-tation agency requirements in terms of safety and durability. To this purpose, this thesis illustrates the mechanical and func-tional characterization of different materials for wearing courses of flexible pavement that could be employed to reduce traffic noise or atmospheric pollution. In particular this work consist of two main part: the first section deals with tire/pavement noise and shows the mechanical and acoustic properties demonstrated by several potentially anti-noise bituminous materials; the second section concerns the study of a couple of photocatalytic products for road pavement that should be able to reduce atmospheric pollution thanks to chemical properties of titanium dioxide contained on them. Social surveys have indicated noise as the type of environ-mental pollution that affects more people than any other type of pollution and have demonstrated that road traffic noise is the dominant source of noise.
Advanced Characterization of Innovative Environmentally Friendly Bituminous Mixtures
20
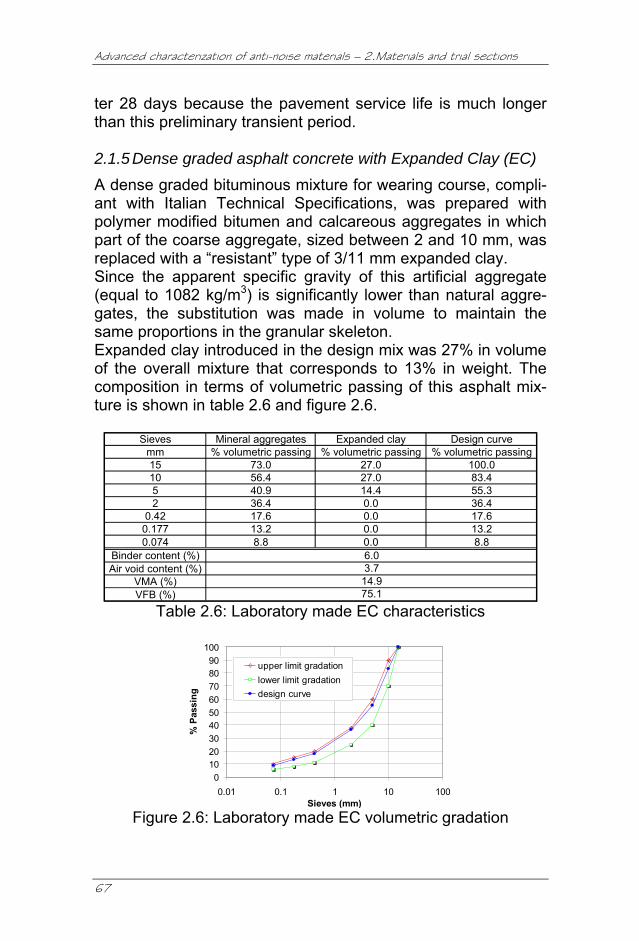
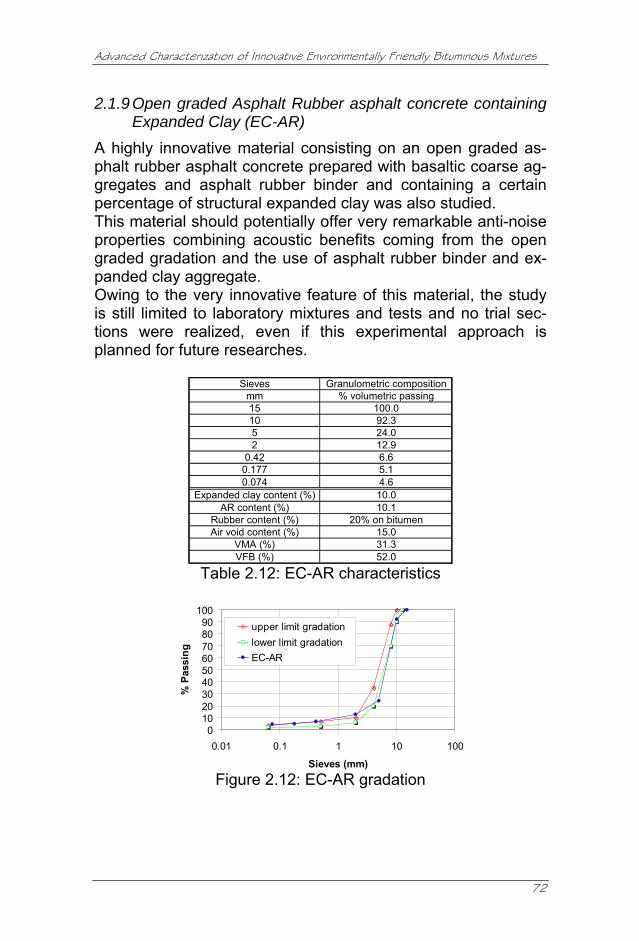
It is well known that noise source abatement is most effective and most cost efficient, so the development of “low noise” road surfaces is considered a strategic abatement procedure be-cause tire/road noise is the dominant traffic noise source. Unfortunately, tire/pavement noise is complex because several sound generation mechanisms and some other sound en-hancement mechanisms can be distinguished making it difficult to develop strategies that may reduce traffic noise in all cases. Thus, there is a great challenge for the road sector to develop and test noise-reducing pavement. Nonetheless, reduction of noise from tire/pavement interface has been demonstrated. A low noise road surface is commonly defined as a surface able to cause at least 3.0 dB(A) lower noise than the reference type. In Italy the type of surface being very common is a dense graded asphalt concrete with 16 mm maximum grain size. In general, a low noise road surface can be built trying to mini-mize noise generation mechanisms and/or maximize the noise absorption mechanisms principally acting on texture, porosity and stiffness of pavement wearing courses. Selecting reduced maximum aggregate size (8÷10 mm) is con-sidered fundamental to optimize texture in order to achieve qui-eter pavement while an air void content as high as possible is a strategic solution to obtain good levels of sound absorption. Moreover, reduced stiffness of road surface is able to attenuate noise generation mechanisms due to the tread impact with pavement. However, it is sometimes claimed that reduction of noise emission could indirectly cause a decrease in safety and durability. On this context, several bituminous materials have been studied in this thesis in terms of mechanical, acoustic and friction prop-erties by means of laboratory and in situ tests. In particular the materials studied were: i) dense graded bituminous mixture containing expanded clay; ii) porous asphalt concrete; iii) Splittmastixasphalt; iv) cold micro-surfacing with dry addition of crumb rubber coming from reclaimed tires; v) porous asphalt partially filled with a photocatalytic cement mortar containing ti-tanium dioxide (TiO2); vi) thin open graded Hot Mix Asphalt con-taining expanded clay; vii) gap graded Asphalt Rubber mixture; viii) open graded Asphalt Rubber mixture; ix) open graded As-phalt Rubber mix containing expanded clay.
Introduction
21
The mechanical characterization consisted of an evaluation of the different mixes in terms of stiffness modulus, fatigue life and permanent deformation resistance. However, specific testing protocols were implemented to assess mechanical properties of cold micro-surfacing with crumb rubber. Within a particular re-search project developed in collaboration with EMPA (Swiss Federal Laboratories for Materials Testing and Research), open graded Asphalt Rubber mixes were also subjected to a new test method in order to characterize water sensitivity of this material with respect to fatigue performance by means of CAST (CoAxial Shear Test) apparatus. The mechanical evaluation of asphalt mixes was performed on materials both manufactured in laboratory and taken in situ dur-ing construction of proper trial sections on urban roads. These experimental pavement stretches allowed anti-noise and friction properties of asphalt mixtures to be verified by in situ tests. Materials taken during construction were also used to prepare specimens for laboratory acoustic characterization by means of the impedance tube. The second section of this thesis deals with photocatalytic products for road pavements. As already introduced, nowadays increasing air pollution, prin-cipally due to traffic, affects urban areas. The principle pollut-ants emitted by vehicles are carbon monoxide (CO), oxides of nitrogen (Nox), volatile organic compounds and particulates. These pollutants have known or suspected harmful effects on human health and environment and may not only prove to be a problem in the immediate vicinity but can travel long distances, chemically reacting in the atmosphere to produce secondary pollutants. In the last decades, great interest focused on the photocatalytic degradation of atmospheric pollutants by means of products containing TiO2. As semiconductor, titanium dioxide is able to absorb photonic energy sufficient to activate it. In presence of water and oxygen, activated TiO2 is responsible for the formation of radicals that in their turn are able to degrade toxic organic materials and pollut-ants. TiO2 is only the catalyst of the chemical reaction and it does not consume itself during oxidation process. This gives rise to its chemical durability.
Advanced Characterization of Innovative Environmentally Friendly Bituminous Mixtures
22
Recently, photocatalytic materials containing titanium dioxide specifically implemented for road surface were brought onto the market. These products have the advantage that they are as close as possible to the source of pollution (exhaust pipes) and they have a widespread territorial distribution (road network). On this subject, two different TiO2-based products for road pavements were studied in terms of mechanical properties, similarly to what already introduced for anti noise materials, and de-pollution capabilities. Also in this case the functional charac-terization was performed in situ, thanks to specified air pollution surveys, and in laboratory, by means of innovative test proto-cols. The two materials studied were: i) photocatalytic cement mortar containing titanium dioxide (maximum grain size = 1.5 mm) and ii) liquid product containing nano-molecular titanium dioxide dis-persed in silicon inorganic resins. Both materials were applied on a porous asphalt surface.
Methodological approach
23
Methodological approach The study of the selected bituminous mixes was performed fol-lowing always the same methodological approach. Based on the idea that innovative materials for road pavement can be successfully considered as long as they satisfy usual re-quirements in terms of safety and durability, the selected mixes were subjected to preliminary laboratory mix design and me-chanical characterization prior to be laid down on proper trial sections in different Italian urban roads. Then, mechanical per-formances of materials taken during construction were verified by means of the same testing protocols preliminarily consid-ered. Materials taken during construction were useful to check func-tional properties (anti-noise and de-polluting) of selected mixes by means of specific laboratory tests. Trials section allowed also the evaluation of acoustic, photo-catalytic and friction properties of the selected and really laid down materials thanks to suitable in situ surveys. Where possi-ble, durability of materials subjected to real traffic action was estimated observing possible development of pavement dis-tresses. Some exceptions to this general scheme are possible: for in-stance, the cold micro-surfacing with crumb rubber really laid down was not mechanically tested. Similarly, acoustically in situ properties of the thin open graded Hot Mix Asphalt containing expanded clay and the open graded Asphalt Rubber mix con-taining expanded clay were not evaluated.
Advanced Characterization of Innovative Environmentally Friendly Bituminous Mixtures
24
Advanced characterization of anti-noise materials
25
Part I
Advanced characterization of anti-noise materials
Advanced Characterization of Innovative Environmentally Friendly Bituminous Mixtures
26
Advanced characterization of anti-noise materials – 1.Tyre/road noise
27
1. Tyre/road noise 1.1 INTRODUCTION
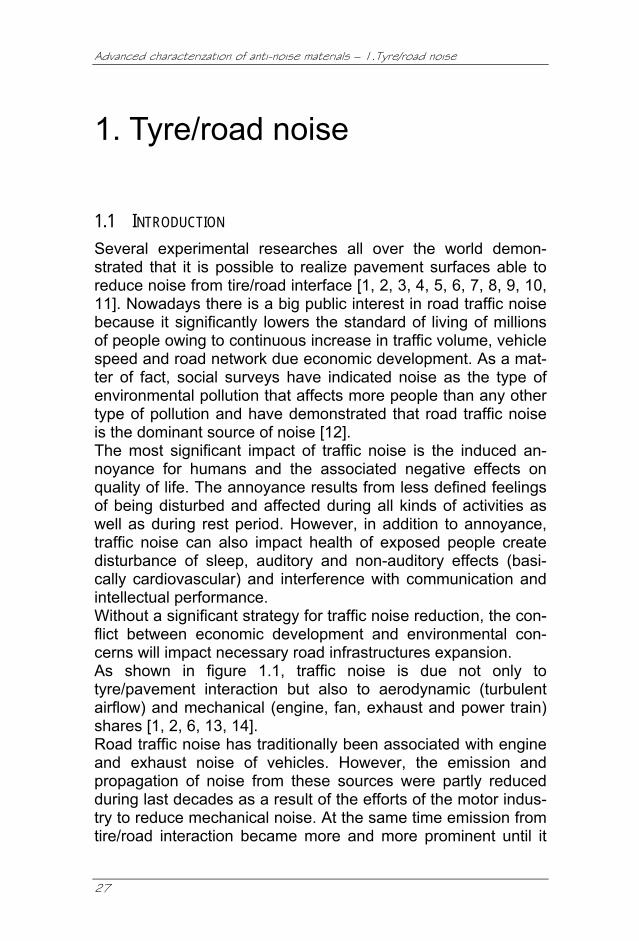
Several experimental researches all over the world demon-strated that it is possible to realize pavement surfaces able to reduce noise from tire/road interface [1, 2, 3, 4, 5, 6, 7, 8, 9, 10, 11]. Nowadays there is a big public interest in road traffic noise because it significantly lowers the standard of living of millions of people owing to continuous increase in traffic volume, vehicle speed and road network due economic development. As a mat-ter of fact, social surveys have indicated noise as the type of environmental pollution that affects more people than any other type of pollution and have demonstrated that road traffic noise is the dominant source of noise [12]. The most significant impact of traffic noise is the induced an-noyance for humans and the associated negative effects on quality of life. The annoyance results from less defined feelings of being disturbed and affected during all kinds of activities as well as during rest period. However, in addition to annoyance, traffic noise can also impact health of exposed people create disturbance of sleep, auditory and non-auditory effects (basi-cally cardiovascular) and interference with communication and intellectual performance. Without a significant strategy for traffic noise reduction, the con-flict between economic development and environmental con-cerns will impact necessary road infrastructures expansion. As shown in figure 1.1, traffic noise is due not only to tyre/pavement interaction but also to aerodynamic (turbulent airflow) and mechanical (engine, fan, exhaust and power train) shares [1, 2, 6, 13, 14]. Road traffic noise has traditionally been associated with engine and exhaust noise of vehicles. However, the emission and propagation of noise from these sources were partly reduced during last decades as a result of the efforts of the motor indus-try to reduce mechanical noise. At the same time emission from tire/road interaction became more and more prominent until it
Advanced Characterization of Innovative Environmentally Friendly Bituminous Mixtures
28
appears the component that needs to be reduced more than anything else. As represented in figure 1.2, for a properly main-tained automobile, tire/pavement interaction is the dominant sub-source at speeds above approximately 50 km/h [1, 2, 6, 14, 15].
OVERALL VEHICLE NOISE
ENGINE
POWER UNIT NOISE
TYRE/ROAD NOISE
AERODYNAMIC NOISE
TRASMISSION
EXHAUST
OVERALL VEHICLE NOISE
ENGINE
POWER UNIT NOISE
TYRE/ROAD NOISE
AERODYNAMIC NOISE
TRASMISSION
EXHAUST
Figure 1.1: Traffic noise sources
Soun
d Pr
essu
re L
evel
(dB
A)
Vehicle Speed (km/h)
55
85
80
75
70
65
60
50 60 70 80 90 100 110 120 130
Overall Noise
Tire Noise
Powertrain Noise
Aerodynamic NoiseSoun
d Pr
essu
re L
evel
(dB
A)
Vehicle Speed (km/h)
55
85
80
75
70
65
60
50 60 70 80 90 100 110 120 130
Overall Noise
Tire Noise
Powertrain Noise
Aerodynamic Noise
Figure 1.2: Contributions of traffic noise sources
Common strategies to reduce traffic noise often consist of pas-sive solutions as, for instance, noise barriers that involve rele-vant construction and maintenance cost without solving the problem at the source. Moreover, the use of this solution often has technical and practical restrictions. As a consequence, re-ducing tire/pavement noise at its source can be considered the most effective approach. It is obvious that not only tires but also road pavement characteristics should be improved in this re-spect.
Advanced characterization of anti-noise materials – 1.Tyre/road noise
29
This last aspect is discussed and studied in detail in this thesis. Pavement design in order to achieve a quiet surface has to save, at the same time, safety and durability properties required to traditional asphalt pavement. To develop reduced noise pavement that satisfies transporta-tion agencies’ requirements for safety, durability and competi-tive economics it is necessary to use expertise in pavement de-sign, materials and acoustics. 1.2 SOUND AND ROAD TRAFFIC NOISE The term noise relates to “unwanted sound”, so it takes a nega-tive sense depending on receptor sensitivity. Typically sound is an energy created by a vibrating surface that produces a variation of density which propagates in a fluid me-dium. In the case of tire/pavement noise the medium is air. The sound is thus ripples around the fairly constant meteorological atmospheric air pressure. The ear reacts to the strength (amplitude) of these variations of air pressure as well as to their variation speed (frequency). Pressure level describes magnitude of sound. Assuming that one wishes to use a linear scale for sound pressure, all nor-mally occurring sounds will be very close each other making dif-ficult to discriminate between them. Instead of a linear scale, a logarithmic scale is used to represent sound pressure level Lp in decibel (dB) according to:
)/(log10 22
10 refp ppL =
where p is the linear sound pressure considered and pref is an internationally standardised reference sound pressure assumed as 20x10-6 Pa. The reference value has been selected in order to obtain a sound pressure level of 0 dB at the threshold of hearing. Human hearing is not equally sensitive to sound of all frequen-cies. Often, it is desirable to report the effect of frequency and amplitude using a single number metric. To include the fre-quency related sensitivity of hearing into a single number met-ric, weighting networks are used. The A-weighting network is an
Advanced Characterization of Innovative Environmentally Friendly Bituminous Mixtures
30
approximation of the sensitivity of the human ear to sound at moderate amplitudes typical of environmental noise. The deci-bel scale ranges from 0 dB(A), the threshold of human hearing, to 140 dB(A) where serious hearing damage can occur. As a general rule of thumb, one can differentiate between two levels of similar sound that are at least 3 dB(A) different in level [1, 3, 16]. As already introduced, sound can be also described by fre-quency that is the speed of variation of density of fluid medium. Sound at low frequencies is generally less attenuated by dis-tance and facades than sound at high frequencies. Humans with good hearing can hear sound between 20 Hz and 20.000 Hz. Sound below 20 Hz (infrasound) or above 20 kHz (ultrasound) is out of the audible range and is typically not a concern for sources of noise. Between 20 Hz and 20 kHz, the sensitivity of hearing varies. The peak sensitivity of the human hearing is between 1000 and 4000 Hz. Noise in this frequency range is most critical when considering strategies for mitigating the effects of noise. Noise characterized by the same intensity is heard in a different way depending on the frequency because the human ear act as a filter that “weighs” sounds.
Figure 1.3: Effect of adding noise sources
Noise levels are measured on a logarithmic scale. Therefore, when combining the effect of multiple sources this must be con-sidered. In fact, it is possible to demonstrate that doubling the sound emissions would result in a 3 dB(A) increase in noise levels, which can be differentiated by the human ear [1, 3, 9, 16].
Advanced characterization of anti-noise materials – 1.Tyre/road noise
31
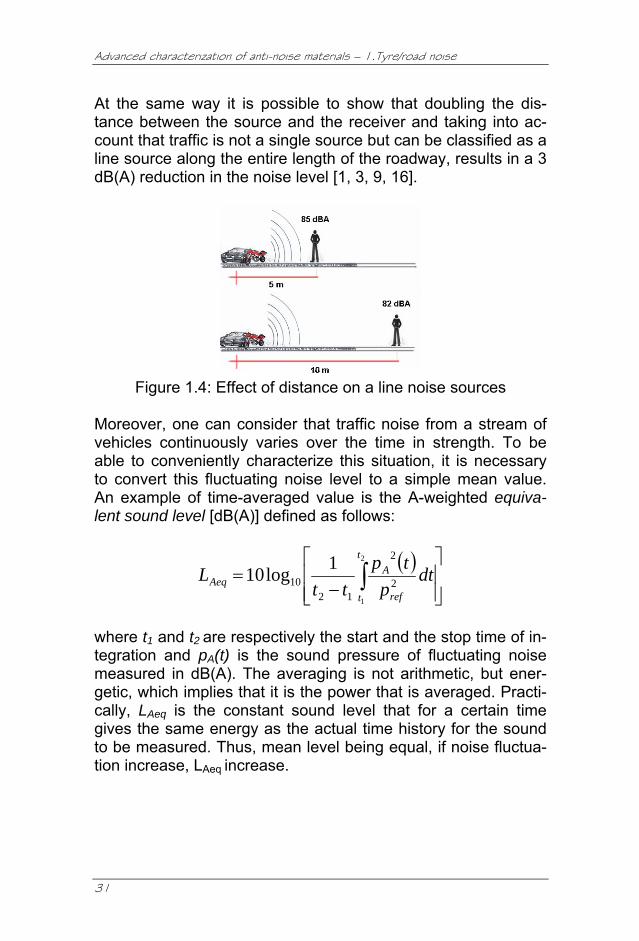
At the same way it is possible to show that doubling the dis-tance between the source and the receiver and taking into ac-count that traffic is not a single source but can be classified as a line source along the entire length of the roadway, results in a 3 dB(A) reduction in the noise level [1, 3, 9, 16].
Figure 1.4: Effect of distance on a line noise sources
Moreover, one can consider that traffic noise from a stream of vehicles continuously varies over the time in strength. To be able to conveniently characterize this situation, it is necessary to convert this fluctuating noise level to a simple mean value. An example of time-averaged value is the A-weighted equiva-lent sound level [dB(A)] defined as follows:
( )⎥⎥⎦
⎤
⎢⎢⎣
⎡
−= ∫
2
1
2
2
1210
1log10t
t ref
AAeq dt
ptp
ttL
where t1 and t2 are respectively the start and the stop time of in-tegration and pA(t) is the sound pressure of fluctuating noise measured in dB(A). The averaging is not arithmetic, but ener-getic, which implies that it is the power that is averaged. Practi-cally, LAeq is the constant sound level that for a certain time gives the same energy as the actual time history for the sound to be measured. Thus, mean level being equal, if noise fluctua-tion increase, LAeq increase.
Advanced Characterization of Innovative Environmentally Friendly Bituminous Mixtures
32
1.3 GENERATION AND PROPAGATION OF TIRE/ROAD NOISE
For a better design of a low noise pavement surface it is neces-sary to understand generation and propagation mechanisms of tyre/road noise. At the tire/pavement interface, several mechanisms create en-ergy which is radiated as sound. These will be referred to as source generation mechanisms. There are also characteris-tics of the tire/pavement interface that cause that energy to be converted to sound and radiated efficiently. These characteris-tics will be referred to as sound enhancement mechanisms. All these mechanisms can be divided into two main groups: one group directly related to mechanical vibrations of the tire; the other group related to aerodynamic phenomena [1, 2, 5, 6, 13]. It is possible to assign an emitting energetic rate to each one of the different source generation mechanisms depending on traf-fic flow condition: • Radial vibrations At the interface between tire and pavement several impacts oc-cur as the tread hits the pavement. These impacts cause vibra-tions of the tire carcass that produce sound (figure 1.5). The tread impact can be compared to a small rubber hammer hitting the pavement. Noise created from radial vibrations is character-ized by low frequency emissions (< 1000 Hz). This is the domi-nant source generation mechanism with 60÷80% of total noise emitted. If both the tread block and the pavement can be made resilient, the energy created can be reduced.
Figure 1.5: Tire carcass radial vibrations
• Air pumping Within the contact patch, the passages and grooves in the tire are compressed and distorted. The air entrained in these pas-sages is compressed and pumped in and out of the passages
Advanced characterization of anti-noise materials – 1.Tyre/road noise
33
respectively in the rear part and in the front part of tire (figure 1.6). Because of air compression effects and air pumping, aerodynamically generated sound is created. This phenomena is similar to sound created by clapping hands.
Figure 1.6: Air “pumped out” and air “sucked in”
Sound generated by this aerodynamic mechanism is character-ized by high frequency emissions (> 1000 Hz) and represents about 10÷30% of total noise. Pavement texture is responsible of the horizontal flow of air trapped between tire and road. This fact allows air pumping phenomenon to be lowered. Porosity of open graded asphalt brings further benefits thanks to vertical flow of air allowed. • Slip-Stick Within the contact patch the tread blocks transfer tractive forces from the tire to the pavement for acceleration or braking. If these horizontal forces exceed the limits of friction, the tread block slips briefly and then re-sticks to the pavement (figure 1.7). This action of slipping and sticking can happen quite rap-idly and generates both noise and vibration. This phenomenon is observed in the gymnasium when athletic shoes squeak on a playing floor.
Figure 1.7: Slip-stick motion
Advanced Characterization of Innovative Environmentally Friendly Bituminous Mixtures
34
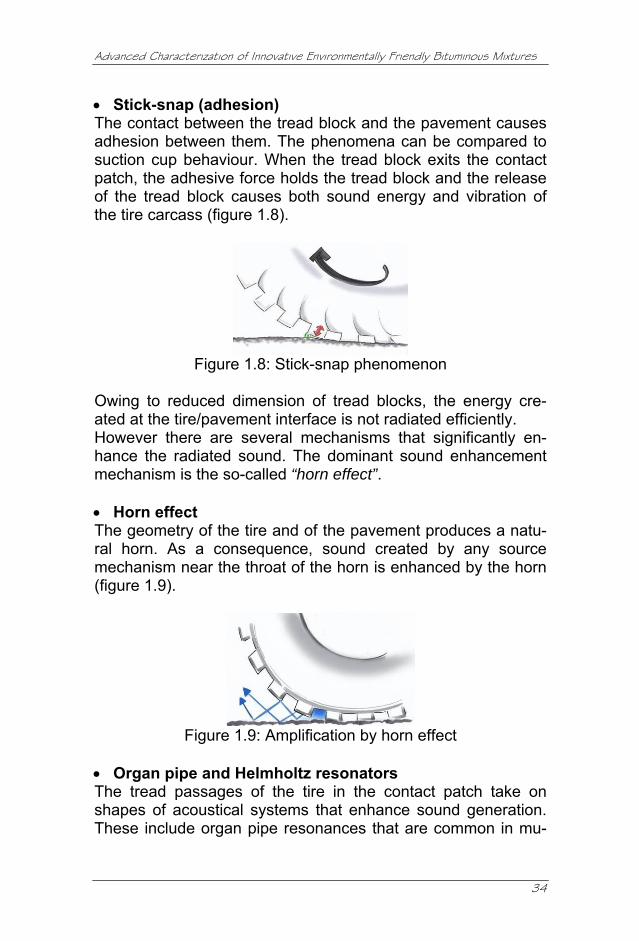
• Stick-snap (adhesion) The contact between the tread block and the pavement causes adhesion between them. The phenomena can be compared to suction cup behaviour. When the tread block exits the contact patch, the adhesive force holds the tread block and the release of the tread block causes both sound energy and vibration of the tire carcass (figure 1.8).
Figure 1.8: Stick-snap phenomenon
Owing to reduced dimension of tread blocks, the energy cre-ated at the tire/pavement interface is not radiated efficiently. However there are several mechanisms that significantly en-hance the radiated sound. The dominant sound enhancement mechanism is the so-called “horn effect”. • Horn effect The geometry of the tire and of the pavement produces a natu-ral horn. As a consequence, sound created by any source mechanism near the throat of the horn is enhanced by the horn (figure 1.9).
Figure 1.9: Amplification by horn effect
• Organ pipe and Helmholtz resonators The tread passages of the tire in the contact patch take on shapes of acoustical systems that enhance sound generation. These include organ pipe resonances that are common in mu-
Advanced characterization of anti-noise materials – 1.Tyre/road noise
35
sical instruments and Helmholtz resonances similar to the whis-tle produced when blowing across an open bottle (figure 1.10).
Figure 1.10: Organ pipe and Helmholtz resonators
• Carcass vibration Vibrational waves created at tire/pavement interface propagate in the tread band, which is the structural element of the tire lo-cated adjacent to the tread blocks. These waves create sound which is radiated from the tire carcass. In addition, the tire car-cass sidewalls near the contact patch vibrate and radiate sound (figure 1.11).
Figure 1.11: Secondary tire carcass vibrations
Figure 1.12: Cavity resonance in tyre tube
• Internal acoustic resonance The air inside the tire is also excited by the excitation of the tire. At certain frequencies associated with the natural frequency of the toroidal enclosure inside the tire, the air inside the tire reso-
Advanced Characterization of Innovative Environmentally Friendly Bituminous Mixtures
36
nates. The response of the air inside the tire is sufficient for these resonances to be audible (figure 1.12). Different source mechanisms may dominate the sound genera-tion for different applications making it difficult to develop strategies able to reduce source generation for all cases. In ad-dition, if source mechanisms are similar in strength, a strategy to suppress one mechanism should not have a dramatic effect on overall noise level because other mechanisms should be-come dominant. The enhancement mechanisms further complicate strategies for achieving reduction of tire/pavement noise. The contributions from the various sound enhancement mechanisms are often dif-ficult to distinguish from each other or from the source mecha-nisms. It should also be emphasized that many of the mechanisms for generation or enhancement of sound from tires and pavement are directly integrated with the tire/pavement characteristics re-quired for safety, durability, and cost. Thus, tire/pavement noise is a challenging problem and meth-ods for improvement are not straight-forward. The achievement of low-noise pavements has to be pursued through a difficult balancing between reduction of rolling noise and preservation of safety and durability. 1.4 LOW NOISE ASPHALT SURFACES PRINCIPLES It has been shown that modification of pavement surface type and/or texture can result in significant tire/road noise reduction. Thus proper selection of the pavement surface can be an ap-propriate noise abatement procedure. Specifically, a low noise road surface can be built at the same time considering safety, durability and cost using one of the following approaches [1, 3, 9, 10]: 1) Pavements with smooth surface texture using small maxi-
mum size aggregate; 2) Porous surfaces, such as open graded friction courses with
high air void content; 3) Pavement-wearing surfaces with inherent low stiffness at
the tire/pavement interface.
Advanced characterization of anti-noise materials – 1.Tyre/road noise
37
These guidelines will be more comprehensible after the reading of the following paragraphs concerning pavement properties af-fecting generation and propagation of rolling noise. 1.4.1 Influence of Pavement Surface on Tire/Road Noise This section deals with road surface characteristics affecting tyre/road noise emission. • PAVEMENT TEXTURE Texture is the most important parameter affecting rolling noise generation mechanisms [1, 13]. Texture is usually classified in terms of texture wavelength (λ) and corresponding amplitude (h) of surface profile along longitudinal travel direction (figure 1.13). Based on the European Standard EN ISO 13473-1 [17] texture can be distinguished in microtexture (λ < 0,5 mm), macrotexture (0,5 mm < λ < 50 mm), megatexture (50 mm < λ < 0,5 m) and unevenness (λ > 0,5 m).
Wavelength
Pavement Texture
Am
plitu
de
Distance
Wavelength
Pavement Texture
Am
plitu
de
Distance Figure 1.13: Pavement surface profile
Texture wavelengths most affecting generation and propagation of rolling noise are included in macrotexture and megatexture range [1, 13]. Moreover, it is possible to identify 10 mm texture wavelength as the border between the range of texture when increase of am-plitude is favourable (positive correlation) and the range of tex-ture when an increase of amplitude is unfavourable (negative correlation) [1, 13]. In fact, within the texture wavelength range 10÷500 mm sound pressure levels are characterized by low frequencies and are principally due to tread impact mechanisms. This type of noise increases with texture amplitude. On the other hand, sound
Advanced Characterization of Innovative Environmentally Friendly Bituminous Mixtures
38
pressure levels within the texture wavelength range 0.5÷10 mm, principally due to air displacement mechanisms, are character-ized by high frequencies and decrease with texture amplitude [1, 13]. Figure 1.14 shows these general guidelines: a typical texture spectrum of a dense graded asphalt concrete 11 mm maximum chipping size is depicted and arrows point towards a develop-ment desirable for achieving low traffic noise without sacrificing the total texture level. It is possible to state that microtexture and unevenness have not relevant effects on rolling noise [1, 13]. In particular, microtexture affect molecular bond between tyre rubber and road pavement acting on stick-slip and stick-snap generation mechanisms. High microtexture generally increases friction and, consequently, stick-slip mechanism. In the same time, adhesion bonds between tyre rubber and road surface decrease, lowering stick-snap. Thus the overall effect of micro-texture is uncertain and the source generation mechanisms in-volved are secondary.
• POROSITY Porous asphalt (air void content > 15%) is characterized by high sound absorption properties that allow both tyre/road noise and power unit and aerodynamic noise to be reduced. Besides sound absorption, porous asphalt also assures reduc-tion of air pumping and horn, organ pipe and Helmholtz resona-tors amplification phenomena [1, 2, 13].
Advanced characterization of anti-noise materials – 1.Tyre/road noise
39
These good acoustic properties do not depend only on air void content but also on thickness of porous layer (d), air flow resis-tance (Rs) and tortuosity (k) of voids [1, 13, 18]. On their turn, these latter two characteristics depend on shape, interconnec-tion and dimension of voids, properties directly related to maxi-mum chipping size of bituminous mixture. An increase of Rs will reflect on a levelling of frequency spec-trum of sound absorption coefficient while with an increase of k frequency spectrum will move towards low frequencies [1, 12, 16]. • STIFFNESS It is possible to assume that a softer bituminous mixture for wearing courses could enhance acoustic properties of road pavement attenuating noise generation mechanisms due to the tread impact with pavement surface. On this subject, the use of rubber within asphalt mixes is useful in order to obtain a softer pavement surface. • AGE As a general rule of thumb, tire/road noise increase with age of pavement. This is due to some phenomena happening over pavement life-time. In particular, mega- and macrotexture change, as particles and other materials wear away. Moreover, weather produce structural ageing of bituminous materials that reflects on an in-crease of pavement stiffness. Finally, for porous surface ageing could produce clogging of voids by accumulated dirt. • COLOUR Surface colour depends on aggregates and binder colour and it has effect on the pavement temperature. Since tire/pavement noise depends on temperature this has some significant impli-cations. Some studies assert that sound pressure level de-crease 0.1 dB per 1 °C increase in temperature [1]. Thus, it is acoustically preferable to select a surface as dark as possible in order to it will absorb more solar radiation and becomes warmer.
Advanced Characterization of Innovative Environmentally Friendly Bituminous Mixtures
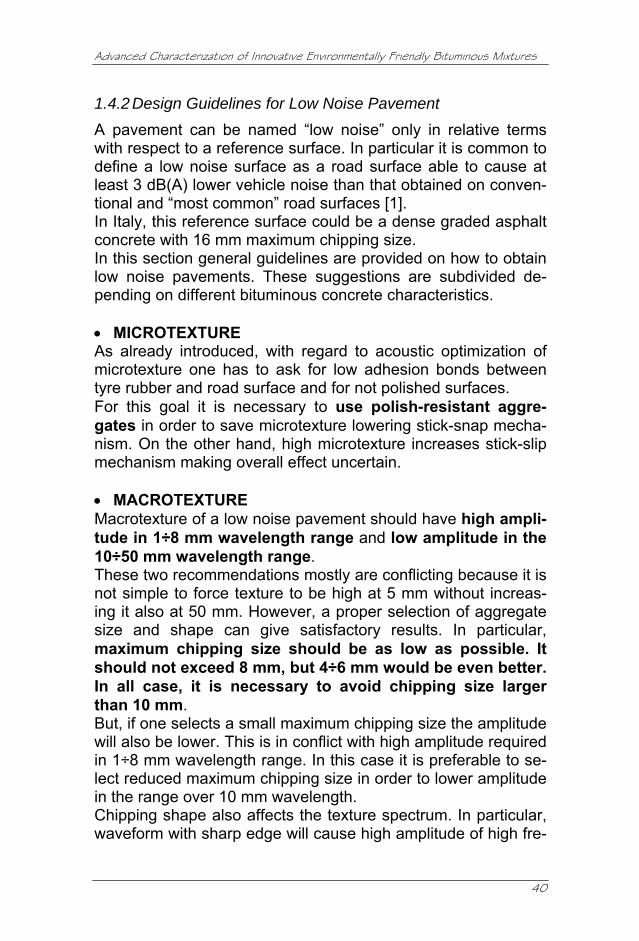
40
1.4.2 Design Guidelines for Low Noise Pavement A pavement can be named “low noise” only in relative terms with respect to a reference surface. In particular it is common to define a low noise surface as a road surface able to cause at least 3 dB(A) lower vehicle noise than that obtained on conven-tional and “most common” road surfaces [1]. In Italy, this reference surface could be a dense graded asphalt concrete with 16 mm maximum chipping size. In this section general guidelines are provided on how to obtain low noise pavements. These suggestions are subdivided de-pending on different bituminous concrete characteristics. • MICROTEXTURE As already introduced, with regard to acoustic optimization of microtexture one has to ask for low adhesion bonds between tyre rubber and road surface and for not polished surfaces. For this goal it is necessary to use polish-resistant aggre-gates in order to save microtexture lowering stick-snap mecha-nism. On the other hand, high microtexture increases stick-slip mechanism making overall effect uncertain. • MACROTEXTURE Macrotexture of a low noise pavement should have high ampli-tude in 1÷8 mm wavelength range and low amplitude in the 10÷50 mm wavelength range. These two recommendations mostly are conflicting because it is not simple to force texture to be high at 5 mm without increas-ing it also at 50 mm. However, a proper selection of aggregate size and shape can give satisfactory results. In particular, maximum chipping size should be as low as possible. It should not exceed 8 mm, but 4÷6 mm would be even better. In all case, it is necessary to avoid chipping size larger than 10 mm. But, if one selects a small maximum chipping size the amplitude will also be lower. This is in conflict with high amplitude required in 1÷8 mm wavelength range. In this case it is preferable to se-lect reduced maximum chipping size in order to lower amplitude in the range over 10 mm wavelength. Chipping shape also affects the texture spectrum. In particular, waveform with sharp edge will cause high amplitude of high fre-
Advanced characterization of anti-noise materials – 1.Tyre/road noise
41
quency components. Consequently it is useful to select aggre-gate with sharp edge (crushed stones) able to retain sharpness as long as possible (polishing resistant). Finally, it is essential to use an aggregate grading able to create a surface texture as open as possible. This can be obtained, for example, by minimizing sand content within ag-gregate mixture. A Splittmastixasphalt surface is a good exam-ple. • MEGATEXTURE As already said, influence of megatexture on tyre/road noise is always negative. Thus it is fundamental to minimize megatex-ture. To this aim, firstly, large chipping size should be avoided. Secondly, it is very important to have not missing chippings of large spaces between them. Thus, it is necessary to use uni-form sizes and well packed aggregates. In figure 1.15 it is possible to note, on the left, an acoustically poor surface with high megatexture due to a non-uniform spread of large chippings, while, on the right, it is shown a sur-face having good acoustical properties thanks to uniform spread of 0÷8 mm aggregates.
Figure 1.15: Poor and good megatextures
Another important aspect is the orientation of the aggregates. If elongate or flaky chippings orientated in a random way are used, a noticeable increase of amplitude in the wavelength range that is extremely bad for noise will occur. This problem can be avoided by selecting cubical particle shape of chip-pings. If cubical particle shape is not suitable, it is fundamental to roll the surface well in order to get a uniform orientation.
Advanced Characterization of Innovative Environmentally Friendly Bituminous Mixtures
42
This is not as effective as the use of cubical chippings also be-cause too much rolling may cause too low a texture amplitude at both long and short texture wavelengths. Moreover, if the un-derlying surface has not homogeneous strength, depressions on different spot may be caused by excessive rolling with con-sequent megatexture amplitude increase. Figure 1.16 shows different megatexture levels due to different situations illustrated above.
Uniform size (cubic) and uniform orientation
Missing and depressed chippings
Non-uniform size and non-uniform orientation
Uniform size (rectangular) and uniform orientation
Uniform size (cubic) and uniform orientation
Missing and depressed chippings
Non-uniform size and non-uniform orientation
Uniform size (rectangular) and uniform orientation
Figure 1.16: Different megatexture levels
• TEXTURE OF POROUS SURFACE Acoustical optimization of porous asphalts depends on texture (to reduce generation of rolling noise), porosity (to increase sound absorption properties), thickness and number of layers. Satisfactory air drainage required to texture surface of dense graded asphalt is not really needed when there is high porosity. Thus, texture optimization becomes simplified for porous as-phalts requiring the lowest possible megatexture and macro-texture at all wavelengths.
Figure 1.17: Different porous asphalts surface textures
Advanced characterization of anti-noise materials – 1.Tyre/road noise
43
Figure 1.17 shows the different texture between an open graded friction course manufactured with reduced maximum chipping size (Φmax=10 mm) and a porous asphalt with 19 mm maximum chipping size. However, using reduced maximum chipping size may affect general requirement in terms of air void content and non-clogging properties. A rather good compromise seems to be the double-layer surfac-ing, in which a small chipping size is preferable in the top layer as long as the aggregates are larger below. In any case, it is necessary to keep in mind that when a po-rous surface has reached a certain degree of clogging, it obeys the same design rules as a dense surface. • BINDER Since the binder influences stiffness of bituminous mix and stiff-ness, on his turn, influences noise, so binder may also influence noise. As a consequence, it is suitable to avoid a binder that gives a very stiff surface. In this sense a binder including rubber pow-der coming from reclaimed tires (Asphalt Rubber) could be use-ful due to its reduced stiffness and to its ageing resistance. This type of binder has been recently introduced on Italian market and mixes manufactured with it have been studied within this thesis. The choice of binder can influence also the preservation of ini-tial porosity of open graded asphaltic material. Thus, it is rec-ommended to use a binder that makes possible the highest initial porosity and, at the same time, makes the surface as resistant to clogging as possible. • COLOUR As already said colour may have an effect on pavement tem-perature and thus on noise emission. Thus it is preferable to se-lect as dark colour as possible. • POROSITY Besides texture, porosity is the most important parameter in or-der to obtain a low noise pavement thanks to high sound ab-sorption coefficient obtainable.
Advanced Characterization of Innovative Environmentally Friendly Bituminous Mixtures
44
However, high porosity could be in conflict with mechanical properties and durability of pavement. Therefore, high quality bituminous binder has to be used to compensate the loss of mechanical performance due to open grading. As a conse-quence of what introduced, the porosity should be as high as possible taking into account durability requirements. At present, a porosity of 25÷30% is the maximum that can be achieved for a mixture which still offers acceptable mechanical stability. However, for a target porosity, the sound absorption can be op-timized in order to obtain the maximum of absorption at a fre-quency of 1000 Hz for high speed roads and of 600 Hz for low speed roads. Moreover, the absorption coefficient frequency spectrum should be as broad as possible. These aspects are related not only to porosity but also to flow resistance Rs that has to be in the range 20÷50 kN×s×m-4 for high speed roads and 12÷30 kN×s×m-4 for low speed roads. This can be obtained using a maximum chipping size of 10÷11 mm. Finally, in order to obtain a frequency-optimized sound absorp-tion it is recommended that layer thickness should be as high as possible and at least 40 mm. 1.5 STATE OF THE ART OF LOW NOISE ROAD PAVEMENTS
1.5.1 Porous Asphalts As already said, porous asphalts (at least 15% air voids) are considered able to give very good acoustical properties thanks to its high air void content that affects air displacement genera-tion mechanisms and sound absorption properties. Moreover, porosity allows water to flow vertically through road wearing course increasing wet friction and reducing splash and spray. In this case, asphalt binder employed must have rheological qualities such as to assure mechanical properties required to porous asphalts. This is why polymer modified binders are usu-ally preferred.
Advanced characterization of anti-noise materials – 1.Tyre/road noise
45
The main issue associated with porous pavement is clogging of the pores with dust, sand and grit coming from pavement or tires [1, 2, 4, 5, 6, 13]. This implies a noticeable decrease in anti-noise properties and it makes necessary to provide for a careful and systematic maintenance in order to keep porosity during lifetime. To counter these issues, in Europe a new kind of open graded asphalt called “double-layer porous asphalt” has been intro-duced. 1.5.2 Double-Layer Porous Asphalts The concept of double-layer is to manufacture a 40÷60 mm thick bottom layer with high maximum chipping size (11÷16 mm) and a 20÷30 mm thick top layer with lower maximum chip-ping size (4÷8 mm). Both layers have high porosity assuring high sound absorption levels but the top layer is characterized by relatively narrow channels while the bottom layer has rela-tively wide channels. The double layer concept is especially intended to avoid the clogging effect. In fact, the bottom layer wide pores allow water and dirt to run away while the top layer is intended to be a filter in which most of dirt will be accumulated in order to protect the lower layer from clogging (figure 1.18). This configuration allows also easier cleaning operations [1, 2, 6, 13]. Moreover, due to the small chippings of top layer it is relatively easy to obtain a smooth megatexture, which results in a low noise at low frequencies.
Figure 1.18: Typical structure of double-layer porous asphalt
The acoustic efficiency may stay good even with a somewhat clogged top layer. This may occur because partial filling of
Advanced Characterization of Innovative Environmentally Friendly Bituminous Mixtures
46
pores will create some type of Helmholtz multi-resonators with narrow necks at the top and large volumes underneath, which should give a sound absorption over a wide frequency range. Moreover, the total thickness is larger than traditional single layer porous asphalt thickness and it seems to be close to an optimum. 1.5.3 SplittMastixAsphalt (SMA) The SMA is a 3÷4 cm layer with a rather high stone content (70÷80%) in which the voids of the stone matrix are filled with a mortar oversaturated with high bitumen content (6÷8%). Cellulose fibres or elastomers can reinforce the binder in order to improve mix stability.
Figure 1.19: Two variants of an SMA surface
Reduced sand content allows a surface texture relatively open to be created. This fact will provide better horizontal air drain-age, reducing air pumping. Moreover, if small maximum chipping size is used texture im-pact mechanisms will be reduced. Figure 1.19 shows the differ-ent texture level between a SMA surface with 8 mm maximum chippings (on the left) and a SMA surface with 16 mm maxi-mum chippings (on the right). 1.5.4 Thin Layers To avoid problems related to porous asphalt for low speed roads (costs, construction complexity, maintenance), innovative asphalt mixes with lower porosity (10÷15%) and manufactured
Advanced characterization of anti-noise materials – 1.Tyre/road noise
47
with reduced maximum chippings (4÷8 mm) has been devel-oped [1, 2, 4, 5, 6]. They usually have certain fractions of the aggregate compro-mised (gap graded) and this fact allows not only an open tex-ture similar to SMA but also a substantial porosity to be ob-tained. This fact contributes to the noise-reducing properties. Layer thickness usually ranges from 15 to 25 mm depending on maximum chipping size. Also in this case, a polymer modified asphalt binder is recom-mended to assure suitable mechanical properties. 1.5.5 Rubberized Asphalt Concretes Rubber coming from reclaimed tires can be introduced into bi-tuminous mixtures replacing a small part of aggregate and dry mixed before asphalt binder is added (dry process) or mixed into the asphalt creating a rubber modified binder (wet process). This latter process is much more diffused and practised. ASTM D 8 [19] defines Asphalt Rubber as “a blend of asphalt cement, reclaimed tyre rubber, and certain additives in which the rubber component is at least 15% by weight of the total blend and has reacted in the hot asphalt cement sufficiently to cause swelling of the rubber particles”. The term Asphalt Rubber is commonly used referring to mixes manufactured with this type of binder. Under an acoustical point of view, rubber should be able to re-duce stiffness attenuating noise mechanical source generation mechanisms. 1.5.6 Expanded Clay Expanded clay is a lightweight aggregate (loose bulk density equal to 300÷900 kg/m3 according to EN 13055-2 [20]) obtained from clay by expansion and heating in a rotatory kiln at around 1100 °C. This aggregate has a rough aspect and rounded shape and its surface exhibits a microporous brown-coloured crust. The inte-rior is cellular in texture and black in colour (figure 1.20). Expanded clay is introduced in asphalt mixes replacing a part of mineral aggregates and its proportions in mix compositions is usually not more than 15% by weight.
Advanced Characterization of Innovative Environmentally Friendly Bituminous Mixtures
48
The peculiar structure of expanded clay creates acoustically in-teresting properties. This seems to be due not only to sound absorption by the pores of the particles exposed on the top of the pavement [1, 21, 22] but also to reduced stiffness and tex-ture of the mix including expanded clay with respect to tradi-tional dense graded asphalt concrete. Further beneficial effects resulting from the use of expanded clay in a road surfacing principally are high and durable skid re-sistance and reduction of consumption of natural mineral ag-gregates (limestone or basalt) [1, 23, 24]. In any way, expanded clay for road pavement has to hold suit-able mechanical properties. These requirements become more restrictive if expanded clay is employed in porous asphalts.
Figure 1.20: Expanded clay grains
1.5.7 Poroelastic Road Surface (PERS) PERS is a very innovative road surface and it consists of gran-ules of rubber from scrap tyres (40÷95% by weight) bound to-gether with bitumen or polyurethane (figure 1.21). Gradation is such as to assure a very high air void content (25÷40%).
Figure 1.21: Poroelastic materials
Advanced characterization of anti-noise materials – 1.Tyre/road noise
49
This futuristic road material seems able to drastically reduce noise thanks to the great elasticity of the surface combined with high air void content [1, 2, 13]. However, to-date poroelastic road surfaces remain at the ex-perimental status and further studies have to be done in order to make the material durable and safe. In fact, PERS has shown serious problems such as adhesion to base course, wet friction and fire resistance [1, 25]. 1.5.8 Euphonic Pavement Euphonic pavement consists of a 40÷60 mm thick porous as-phalt laid on top of a continuously reinforced concrete slab with Helmholtz resonators of about 500 cm3 each, distributed over the entire surface (figure 1.22) [1, 13]. This innovative solution allows high sound absorption for a broad frequency spectrum to be obtained.
POROUS HMA
CONCRETE SLAB WITH
HELMHOLTZ RESONATORSPOROUS H
MA
CONCRETE SLAB WITH
HELMHOLTZ RESONATORS
Figure 1.22: Euphonic pavement
1.5.9 Rollpave Rollpave is a rollable, porous thin single-layer surface (50 m length and 30 mm thick) manufactured off-side under factory conditions. Each length is then rolled onto a drum. The drums are transported to site and the asphalt is unrolled on an adhe-sive support layer called “carrier” (figure 1.23). A fine iron gauze which is built into the surface during the manufacturing process is then heated via induction (to a tem-perature in excess of 115 degrees) to melt the bituminous layer around the gauze, thereby allowing the surface to bond to the underlying tack coat. A roller is then used to flatten the asphalt mat and the surface is ready for driving on.
Advanced Characterization of Innovative Environmentally Friendly Bituminous Mixtures
50
Reheating the iron gauze to the same temperature breaks the adhesion between the asphalt and the carrier so that the as-phalt mat can be rolled up and removed.
Figure 1.23: Rollpave
The improvement in acoustic performance was to be achieved through the prefabricated nature of the surfaces which allowed the manufacture of the surfaces under controlled conditions. First results were not as positive as expected in terms of noise reduction and nowadays it is unknown whether proposed solu-tions for this problem are really effective [26]. The expected lifetime of the surface is 10 years, based on the fact that the surface is effectively a thin porous asphalt. With respect to safety, Rollpave is comparable to single-layer porous asphalt in terms of skid resistance performance. How-ever, there is increased splash and spray and the surface is less permeable than single-layer porous asphalt. Moreover, the initial costs of Rollpave (in terms of machinery, materials, production facilities, etc.) are high in comparison to regular asphalt. The cost-effectiveness of the surface depends mainly on the noise reduction provided, the laying speed and the lifetime. Finally, for what concerns construction speed, the expectation is that in the future Rollpave can be laid approximately 50% faster than single-layer porous asphalt and approximately 100% faster than two-layer porous asphalt. 1.5.10 Silent Transport Silent Transport is a pavement system whose principle is to have different surfaces across the width of a single lane in order
Advanced characterization of anti-noise materials – 1.Tyre/road noise
51
to mitigate the different noise sources from road traffic, particu-larly heavy vehicles such as trucks and buses. In particular, the surface which was taken into account within the IPG pro-gramme [26] comprised: i) a thick single-layer porous asphalt outside of the wheel tracks of the vehicle (to influence noise propagation across the surface); ii) a two-layer porous asphalt in the wheel tracks (to reduce tyre/road noise at source) and iii) a thin porous layer in between the wheeltracks, achieved by placing an acoustically dense membrane in between the two porous layers (to reduce engine noise at source). Notwithstand-ing the good results obtained, the surface failed to reach the expected levels of noise reduction offering no additional bene-fits with respect to twin layer porous asphalts [26]. 1.6 MEASURING METHODS OF TYRE/ROAD NOISE Standardised measurements methods are necessary for char-acterization of tyre/road noise. This standardization is very use-ful in order to compare data obtained by different researches. Two different concepts for in situ noise measurements methods can be distinguished: • the first one is based on the idea to measure sound level
with microphones situated along side of the roadway (Statis-tical Pass-By e Controlled Pass-By);
• the second one consists of determination of tire/pavement noise placing microphone very close to tire/pavement inter-face (Close-Proximity Method e Close-Proximity Sound In-tensity).
For what concerns the determination of sound absorption capa-bilities of asphaltic materials, they can be evaluated by means of laboratory impedance tube or in situ extended surface test method. 1.6.1 Statistical Pass-by Method – EN ISO 11819-1 The statistical pass-by (SPB) method consists of placing micro-phones at a defined distance from the vehicle path at the side of the roadway. In Europe, the EN ISO 11819-1 [27] calls for placing microphones at a height of 1.2 m above the pavement.
Advanced Characterization of Innovative Environmentally Friendly Bituminous Mixtures
52
Figure 1.24 details requirements for the surrounding micro-phone area according to ISO Standard.
> 20 m> 20 m
test lane7.
5 m
≥5
m ≥3.
5 m
area covered with material having similar sound absorption
Area with not tall arbitrary covering (grass or plants)
microphone position
> 20 m> 20 m
test lane7.
5 m
≥5
m ≥3.
5 m
area covered with material having similar sound absorption
Area with not tall arbitrary covering (grass or plants)
microphone position 10 m10 m
test lane
no screening guard, rail or safety barriers allowed
no reflecting solid safety barrier allowed
microphone position
7.5
m10
m10
m
10 m10 m
test lane
no screening guard, rail or safety barriers allowed
no reflecting solid safety barrier allowed
microphone position
7.5
m10
m10
m
Figure 1.24: ISO Standard requirements for SPB method
The SPB method provides for recording of type and speed of vehicle and maximum A-weighted sound pressure level of a random sample of vehicles selected from real traffic stream and classified in three different categories depending on dimen-sions. The vehicles measured are those that are not disturbed by noise from other vehicles. Afterwards, simple statistics are used to determine a kind of av-erage sound level for a mix of vehicles called Statistical Pass-by Index (SPBI). SPB method accounts for all aspects of traffic noise including engine, exhaust and aerodynamic noise and is based on a rather representative sample of real traffic providing the best available measure of impact of traffic noise on roadside. However this method is laborious and time intensive and test conditions are very restrictive.
Advanced characterization of anti-noise materials – 1.Tyre/road noise
53
The roadway must be essentially straight and level, there is a limit on the background noise, and no acoustical reflective sur-faces can be within a large area surrounding the microphone position. Moreover, vehicle must be moving at a relatively uni-form speed and the passbys are of individual vehicles and must be acoustically separated from all other traffic noise (figure 1.25).
Figure 1.25: Typical measurement set up for SPB method
1.6.2 Controlled Pass-by Method For Controlled Pass-by (CPB) method, specified within the French standard NF S 31 119-2 [28], the same measurement setup as SPB is used. However, for CPB either a single vehicle or relatively few se-lected vehicles are driven at a controlled speed in a specified gear past the measurements location. Test speeds shall be distributed over the range 70÷110 km/h, with a normalisation made to a reference speed of 90 km/h. Since test speed and the properties of the test vehicles are known and may be kept constant or at least controlled, com-parison of different road surfaces will be easier than with SPB method. The method has the same site limitations as SPB and requires a light traffic density making it suited to roads temporary closed, very low traffic roads or test track conditions. For conditions of heavy traffic density, neither SPB nor CPB can be used. An effective alternative may be based on measuring time-averaged traffic noise. Time-averaged noise as well as traffic speed and vehicle mix is measured. Often meteorological measurements are also made.
Advanced Characterization of Innovative Environmentally Friendly Bituminous Mixtures
54
For time-averaged methods, traffic mix, traffic volume, speed and meteorological conditions are not controlled. A normaliza-tion process based on traffic noise models is used to develop a comparable descriptor of noise at the wayside location. Normal-izing the time-averaged data to account for site differences and meteorological conditions is difficult and adds uncertainty to the comparison. Moreover, the site limitations are not solved. 1.6.3 Close-Proximity Method – ISO/CD 11819-2 The Close-Proximity (CPX) method, standardised within ISO/CD 11819-2 [29], consists of measuring the sound levels at or near the tire/pavement interface using microphones located near the road surface. Microphones are directly mounted on a tyre located on a specially designed trailer usually covered with an acoustical chamber in order to provide screening from wind and traffic noise (figures 1.26 and 1.27). Thus, this measure-ment can be made in the traffic stream. Measures have to be normalised to selected reference speeds which are the same as in the SPB method.
200 mm 200 mm100 mm 100 mm
optional microphone
mandatory microphone
650 mm 650 mm
200 mm
200 mm200 mm
200 mm 200 mm100 mm 100 mm
optional microphone
mandatory microphone
650 mm 650 mm
200 mm
200 mm200 mm Figure 1.26: Microphone positions in the CPX method
Also in this case, data collected at different speeds and for dif-ferent tires have to be summarised into a single value (Close-Proximity Sound Index – CPXI) to better compare different road surfaces.
Advanced characterization of anti-noise materials – 1.Tyre/road noise
55
CPX measurements can be made relatively quickly allowing tire/pavement noise across a pavement network to be meas-ured in relatively short time. However, CPX method refers to a limited set of tires of light vehicles and it does not take into ac-count vehicle variation typical of a traffic stream or noise pro-duced by heavy vehicles. Close proximity method has been developed to allow meas-urement to focus on tire/pavement interaction noise but it may be not representative of real sound perceived by receiver if a sound absorptive surface is interposed.
Figure 1.27: Typical CPX trailer
1.6.4 Close Proximity Sound Intensity Similar measurements could be performed through the Close Proximity Sound Intensity (CPSI) method that consists of mounting microphone directly on the tire (figure 1.28) measur-ing not the sound pressure level but the sound intensity, i.e. sound power for unit area.
Figure 1.28: Typical mounting of CPI device
Advanced Characterization of Innovative Environmentally Friendly Bituminous Mixtures
56
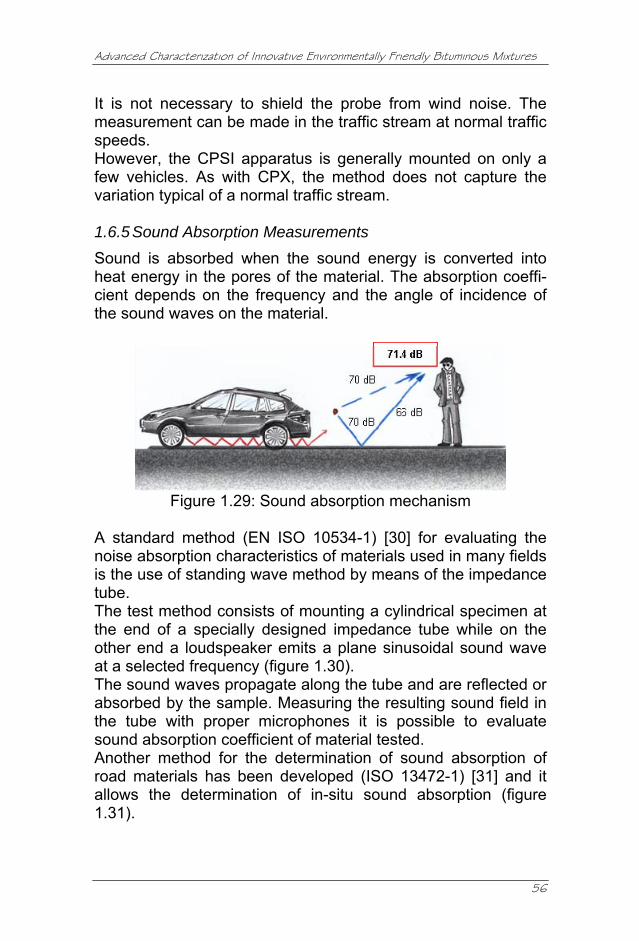
It is not necessary to shield the probe from wind noise. The measurement can be made in the traffic stream at normal traffic speeds. However, the CPSI apparatus is generally mounted on only a few vehicles. As with CPX, the method does not capture the variation typical of a normal traffic stream. 1.6.5 Sound Absorption Measurements Sound is absorbed when the sound energy is converted into heat energy in the pores of the material. The absorption coeffi-cient depends on the frequency and the angle of incidence of the sound waves on the material.
Figure 1.29: Sound absorption mechanism
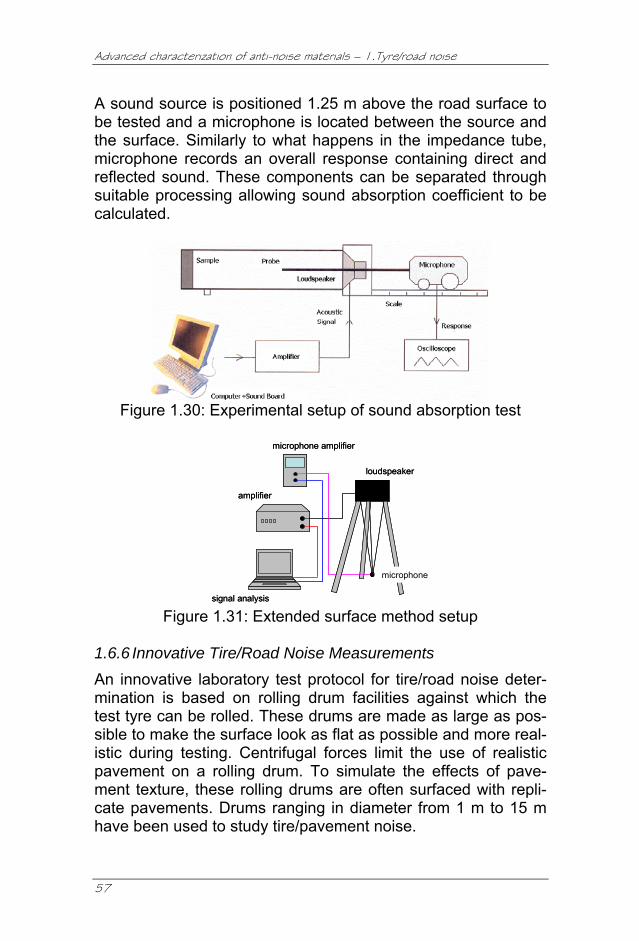
A standard method (EN ISO 10534-1) [30] for evaluating the noise absorption characteristics of materials used in many fields is the use of standing wave method by means of the impedance tube. The test method consists of mounting a cylindrical specimen at the end of a specially designed impedance tube while on the other end a loudspeaker emits a plane sinusoidal sound wave at a selected frequency (figure 1.30). The sound waves propagate along the tube and are reflected or absorbed by the sample. Measuring the resulting sound field in the tube with proper microphones it is possible to evaluate sound absorption coefficient of material tested. Another method for the determination of sound absorption of road materials has been developed (ISO 13472-1) [31] and it allows the determination of in-situ sound absorption (figure 1.31).
Advanced characterization of anti-noise materials – 1.Tyre/road noise
57
A sound source is positioned 1.25 m above the road surface to be tested and a microphone is located between the source and the surface. Similarly to what happens in the impedance tube, microphone records an overall response containing direct and reflected sound. These components can be separated through suitable processing allowing sound absorption coefficient to be calculated.
Figure 1.30: Experimental setup of sound absorption test
microphone
loudspeaker
microphone amplifier
amplifier
signal analysis
microphone
loudspeaker
microphone amplifier
amplifier
signal analysis Figure 1.31: Extended surface method setup
1.6.6 Innovative Tire/Road Noise Measurements An innovative laboratory test protocol for tire/road noise deter-mination is based on rolling drum facilities against which the test tyre can be rolled. These drums are made as large as pos-sible to make the surface look as flat as possible and more real-istic during testing. Centrifugal forces limit the use of realistic pavement on a rolling drum. To simulate the effects of pave-ment texture, these rolling drums are often surfaced with repli-cate pavements. Drums ranging in diameter from 1 m to 15 m have been used to study tire/pavement noise.
Advanced Characterization of Innovative Environmentally Friendly Bituminous Mixtures
58
The test tyre is mounted so that it rolls against either the outer or the inner surface of the drum at selected speed and load. Generated noise level is continuously recorded by one or more microphones mounted close to the test tyre [1, 2]. This test method allows several advantages to be obtained. In particular, surveys of noise emission from large numbers of tyres under various operating conditions can be carried out in a short time. However, the use of artificial road surfaces make the method more questionable than others concerning realistic operating conditions. Figure 1.32 shows the so-called Tire/Pavement Test Apparatus (TPTA), developed at the Purdue University, Indiana, USA. This facility consists of 4 m non-rotating drum and two counter-balanced rotating test tyres able to reach speeds up to about 50 km/h.
Figure 1.32: Tire/Pavement Test Apparatus
1.7 RECENT INTERNATIONAL RESEARCHES In this section some of the most recent scientific researches about anti noise pavements are showed. In particular, 4 differ-ent scientific papers presented at the last “ISAP Symposium on Asphalt Pavements and Environment” held in Zurich in 2008 are cited as an example. All these papers deal with low noise bitu-minous materials and are based on trial sections. In particular, do Nascimento and Leite [32] demonstrated, through in situ measurements of sound levels at the side of the roadway and sound absorption properties, that different Asphalt Rubber mixtures allow remarkable acoustic benefits to be ob-tained. In fact, open graded Asphalt Rubber asphalt concrete
Advanced characterization of anti-noise materials – 1.Tyre/road noise
59
showed 7÷8 dB(A) of noise reduction with respect to traditional dense graded asphalt mixtures. Moreover, this study pointed out friction improvements obtained thanks to the employment of AR mixes. A study carried out by the Danish Road Institute and the Dutch Centre for Transportation and Navigation [33] investigated acoustic properties of different thin hot mix asphalts laid down both in Denmark and the Netherlands. From in situ measure-ments according to SPB method noise reduction of about 3÷5 dB (with peak values up to 8 dB) are recorded with respect to traditional reference asphalt pavements. From an analogous research carried out by the Vienna Univer-sity of Technology [34], within a research project funded by the Austrian Ministry for Transportation, Innovation and Technology and the Austrian Motorway Company, and dealing with innova-tive low noise road materials, it is possible to observe that ma-terials with relevant acoustic properties are single and double-layer porous asphalts. Moreover, the study shows also that SMA reduced noise levels of about 2÷4 dB(A) depending on grading and binder type. Finally, experimental data obtained with CPX method demonstrated as the rolling noise is reduced of about 1 dB(A) if Asphalt Rubber binder is used, all other con-ditions being equal. This benefit could become larger, up to 3 dB(A), if reduced maximum chipping size is selected. A study carried out in California [35] about the superficial prop-erties of 4 different flexible pavements (dense graded asphalt concrete, Asphalt Rubber gap graded asphalt concrete, Asphalt Rubber open graded asphalt concrete and porous asphalt) and based on more than 50 trial sections showed that the best ap-proach with regard to traffic noise could be the use of a thin open graded asphalt layer with 9.5-12.5 mm maximum chipping size. This solution seems to be the better arrangement between noise reduction, durability and low costs needs. Acoustic im-provements with respect to traditional asphalt concretes were also noticed where open graded Asphalt Rubber wearing courses were used.
Advanced Characterization of Innovative Environmentally Friendly Bituminous Mixtures
60
1.8 CONCLUSIONS Traffic noise issue can not be undervalued more. The design of low noise road surface has to be considered a strategic noise abatement procedure because it acts directly at the source of the problem lowering tire/road noise that is dominant at speeds greater than 50 km/h. Quiet pavement that is safe, durable and economical has been demonstrated to be possible. However, expertise in pavement design, materials and acoustic is necessary to reach this ambitious goal because of the ele-vated complexity of the generation and propagation mecha-nisms principally involving road surfaces, tires and their interac-tion. Many of the issues of quiet pavement are only partially under-stood. As effort on the various aspects of quiet pavement pro-ceed, a better understanding of the problem will evolve which will allow more accurate prediction of sound levels, develop-ment of optimized lower-noise pavement designs, and direct measurement of the properties affecting noise reductions.
Advanced characterization of anti-noise materials – 2.Materials and trial sections
61
2. Materials and trial sections For this part of the research, nine different bituminous mixtures were tested. As a general rule, all these materials were me-chanically and acoustically studied by means of both laboratory and in situ evaluations. For each kind of material, tests on labo-ratory manufactured as well as in situ taken asphalt mixes were performed. Laboratory made mixes resulted from proper mix design processes while in situ materials were available thanks to the construction of proper trial sections on different urban roads in Italy. Mix design of laboratory made materials was based on the optimization of volumetric properties, Marshall stability and quotient and indirect tensile strength. Some exceptions to this general scheme were necessary due to logistic, organizing and/or time problems. In the following paragraphs, each material analyzed is pre-sented in detail with a description of the corresponding trial sec-tions from which mixes were taken. 2.1 MATERIALS In the following paragraphs the compositive and volumetric characteristics of all materials studied are detailed. 2.1.1 SplittMastixAsphalt (SMA) The SMA mix has been prepared with basaltic coarse aggre-gates and polymer modified bitumen, compliant with Italian Technical Specifications. In table 2.1 and figure 2.1 characteristics of laboratory made SMA are shown while table 2.2 and figure 2.2 indicate composi-tion properties of in situ SMA mix. In particular, air void content, voids in mineral aggregate (VMA) and VMA filled with binder (VFB) calculated according to EN 12697-8 [36] are reported.
Advanced Characterization of Innovative Environmentally Friendly Bituminous Mixtures
Advanced characterization of anti-noise materials – 2.Materials and trial sections
63
0102030405060708090
100
0.01 0.1 1 10 100
Sieves (mm)
% P
assi
ng
upper limit gradationlower limit gradationin situ SMA
Figure 2.2: In situ SMA gradation
2.1.2 Slurry Seal with “dry” addition of Crumb Rubber (SSCR) The SMA described above was also the base for the application of a particular treatment consisting of a Slurry Seal containing a certain percentage of Crumb Rubber coming from reclaimed tires added to the blend as dry ingredient. The first part of the study consisted of the mix design of this particular bituminous material. Once fixed granulometric grada-tion, bitumen emulsion content and cement content, four differ-ent dosages (0%, 10%, 20% and 30% with respect to aggre-gates weight) of two crumb rubber sizes (2.5÷4 mm and 4÷7.5 mm) were separately tested with different methods. Emulsion content changed with rubber content and size taking into ac-count specific surface and volume of rubber grains introduced as follows:
( ) ( ) ( )⎭⎬⎫
⎩⎨⎧
+⎥⎦
⎤⎢⎣
⎡ ∑=∑
p
ppi iii iittXt
γφ
γφ
γφ ::100
where: 100 = emulsion content per 1000 g of traditional Slurry Seal (g); ti = percentage weight retained at the i sieve (%); Φi = opening of the i sieve (mm); γ = basaltic aggregate specific weight (2.69 g/cm3); tp = percentage rubber weight added (%); Φp = mean diameter of rubber grains added (mm); γp = rubber grains specific weight (1 g/cm3); X = real emulsion content (g).
Advanced Characterization of Innovative Environmentally Friendly Bituminous Mixtures
Granulometric distribution selected is shown in table 2.3 and figure 2.3 while cement and water contents were respectively fixed to 9% and 1.5% with respect to aggregates weight.
After the mix design process and some trial sections not inter-ested by traffic, a Slurry Seal containing 8.5 % of 4÷7.5 mm crumb rubber was selected to be laid down in the real trial sec-tion effectively interested by traffic. This material had the same granulometric distribution of that manufactured in laboratory and was prepared with 11% of polymer modified bitumen emul-sion, 10% of water and 1% of cement. 2.1.3 Porous Asphalt (PA) The PA mix has been prepared with basaltic coarse aggregates and polymer modified bitumen. In table 2.4 and figure 2.4 characteristics of laboratory made PA are shown while table 2.5 and figure 2.5 indicate composition properties of in situ PA mix. The aggregate gradations were op-
Advanced characterization of anti-noise materials – 2.Materials and trial sections
65
timized to obtain both acceptable mechanical performance and quite high air void content (about 20%).
Advanced Characterization of Innovative Environmentally Friendly Bituminous Mixtures
66
It is important to note that the aggregate gradations were char-acterized by a passing at 5 mm sieve lower than 20%. This fea-ture is able to assure a stone-on-stone contact condition provid-ing adequate permeability in porous mixes according to Khan-dal and Mallick [37].
0102030405060708090
100
0.01 0.1 1 10 100
Sieves (mm)
% P
assi
ng
upper limit gradationlower limit gradationin situ PA
Figure 2.5: In situ PA gradation
2.1.4 PA partially filled with Photocatalytic cement Mortar con-
taining TiO2 (PM) A further innovative road material was obtained partially filling the PA mixes introduced above with a photocatalytic cement mortar containing titanium dioxide (TiO2) that should confer air polluting-abatement capabilities to the grout. This aspect will be discussed in depth in the part II of this thesis dealing with air de-polluting pavements. The photocatalytic mortar (maximum grain size = 1.5 mm), mixed with 30% water to obtain the right fluidity, was applied with a rate of 4 kg/m2 in order to seep into the asphalt concrete at least 10 mm deep assuring good bonding between the mor-tar and the upper pavement layer. Since the only uppermost part of the pavement has air pollu-tion-abatement capabilities, the adopted solution is as effica-cious as a whole photocatalytic concrete layer but economically more favourable. Since the mortar is a cement based material, the PM speci-mens were tested after at least 28 days of curing time in air. In real conditions, i.e. in trafficked roads, it is assumed that the pavement resistance is provided, in the first 28 days, only by the PA itself without the contribution of cement mortar. Then, the mechanical properties of PM mixture have been studied af-
Advanced characterization of anti-noise materials – 2.Materials and trial sections
67
ter 28 days because the pavement service life is much longer than this preliminary transient period. 2.1.5 Dense graded asphalt concrete with Expanded Clay (EC) A dense graded bituminous mixture for wearing course, compli-ant with Italian Technical Specifications, was prepared with polymer modified bitumen and calcareous aggregates in which part of the coarse aggregate, sized between 2 and 10 mm, was replaced with a “resistant” type of 3/11 mm expanded clay. Since the apparent specific gravity of this artificial aggregate (equal to 1082 kg/m3) is significantly lower than natural aggre-gates, the substitution was made in volume to maintain the same proportions in the granular skeleton. Expanded clay introduced in the design mix was 27% in volume of the overall mixture that corresponds to 13% in weight. The composition in terms of volumetric passing of this asphalt mix-ture is shown in table 2.6 and figure 2.6.
Figure 2.6: Laboratory made EC volumetric gradation
Advanced Characterization of Innovative Environmentally Friendly Bituminous Mixtures
68
Constituent characteristics of EC mix really laid down in the trial section are showed in table 2.7 and figure 2.7. Expanded clay content is reported as weight percentage with respect to aggre-gate weight (mineral and not). The binder content is indicated in both materials as percentage with respect to the overall aggregate weight that correspond re-spectively to 5%, for the laboratory mix, and 6%, for the in situ mix, considering a mixture wholly composed by stone aggre-gates.
2.1.6 Thin Semi-Porous layer with Expanded Clay (TSP-EC) To combine acoustic properties of lightweight aggregates with those of thin HMA layers, a thin semi-porous asphalt concrete containing a certain percentage of “structural” expanded clay and manufactured with polymer modified binder was realized. The expanded clay, sized between 5 and 10 mm, replaced a part of coarse basaltic aggregate.
Advanced characterization of anti-noise materials – 2.Materials and trial sections
69
“Structural” expanded clay was selected because this mechani-cally more resistant type of lightweight aggregate results more suitable to be employed within asphalt mixes having air void content greater than 10%. Clearly, the higher apparent specific gravity of the “structural” type of this artificial aggregate (equal to 1200 kg/m3) enhances mechanical performance of expanded clay grains in despite of a little decrease in acoustic absorption properties.
Also in this case, due to different specific gravity between ex-panded clay and mineral aggregates, TSP-EC gradation is pre-sented in terms of volumetric passing. Only the mixture taken in situ, based on a proper laboratory mix design, was mechanically and functionally tested. Composition characteristics of this asphalt concrete are presented in table 2.8 and figure 2.8.
Advanced Characterization of Innovative Environmentally Friendly Bituminous Mixtures
70
2.1.7 Gap Graded Asphalt Rubber asphalt concrete (GG-AR) In situ taken GG-AR material was prepared with calcareous ag-gregates and asphalt rubber binder. Mixture composition is showed in table 2.9 and figure 2.9.
AR content (%) 9.0Rubber content (%) 20% on bitumenAir void content (%) 15.0
VMA (%) 31.4VFB (%) 52.2
Table 2.10: Laboratory made OG-AR characteristics OG-AR materials were prepared with basaltic coarse aggre-gates and asphalt rubber binder. Laboratory and in situ mixture compositions are showed in tables 2.10 and 2.11 and in figures 2.10 and 2.11 respectively.
A highly innovative material consisting on an open graded as-phalt rubber asphalt concrete prepared with basaltic coarse ag-gregates and asphalt rubber binder and containing a certain percentage of structural expanded clay was also studied. This material should potentially offer very remarkable anti-noise properties combining acoustic benefits coming from the open graded gradation and the use of asphalt rubber binder and ex-panded clay aggregate. Owing to the very innovative feature of this material, the study is still limited to laboratory mixtures and tests and no trial sec-tions were realized, even if this experimental approach is planned for future researches.
Rubber content (%) 20% on bitumenAir void content (%) 15.0
VMA (%) 31.3VFB (%) 52.0
Table 2.12: EC-AR characteristics
0102030405060708090
100
0.01 0.1 1 10 100
Sieves (mm)
% P
assi
ng
upper limit gradationlower limit gradationEC-AR
Figure 2.12: EC-AR gradation
Advanced characterization of anti-noise materials – 2.Materials and trial sections
73
Mixture composition in terms of volumetric passing and compo-nents contents is showed in table 2.12 and in figure 2.12. Ex-panded clay and AR contents refer to the overall aggregate weight (mineral and not). In particular, 10.1% of AR content cor-responds to 9% with respect to a mixture wholly prepared with mineral aggregates. 2.2 TRIAL SECTIONS All materials presented, except EC-AR, were laid down on four trial sections in different Italian urban roads subjected to real traffic load (figure 2.13). This fact allowed not only material for laboratory tests to be taken but also in situ evaluation of anti-noise properties. On this section a brief description of these experimental stretches is provided.
Figure 2.13: Location of trial sections
2.2.1 Trial Section 1 – SS16, San Benedetto del Tronto SMA, SSCR, PA, PM and EC mixes were laid down on an ur-ban trial section about 1600 m long in San Benedetto del Tronto (national road number 16 – figures 2.14 and 2.15).
Advanced Characterization of Innovative Environmentally Friendly Bituminous Mixtures
74
Figure 2.14: Trial section 1
This test road was built in two different periods; in fact, the part paved with EC mix was realized in October 2004 while the other 4 materials were laid down nearly two years later. Three main sections of about 500 m were spread with SMA, PA and EC over a 50 mm thick dense graded HMA binder course realized after the milling of pre-existent asphalt layers. The thickness of the SMA wearing course was 30 mm while PA and EC wearing courses were 40 mm thick. The Slurry Seal with crumb rubber and the photocatalytic mortar were spread over a sub-section of SMA and PA respectively, obtaining five different experimental stretches to be tested.
Figure 2.15: San Benedetto del Tronto trial section
Advanced characterization of anti-noise materials – 2.Materials and trial sections
75
This trial section has one carriageway and two lanes and the speed limit is 50 km/h. Obviously, the test surfaces covered both lanes. The test road has several intersections with and without traffic lights and it is quite completely straight. More-over, buildings facades are very close to the road surface creat-ing a “canyon” configuration that is detrimental for traffic noise. 2.2.2 Trial Section 2 – Via Belgioioso, Pesaro TSP-EC mix was laid down on an urban trial section about 800 m long in Pesaro (via Belgioioso – figures 2.16 and 2.17).
Figure 2.16: Trial section 2
Figure 2.17: Pesaro trial section
Advanced Characterization of Innovative Environmentally Friendly Bituminous Mixtures
76
This test road was built in April 2007. Material was spread as a replacement for the old high distressed wearing course. The thickness of the new TSP-EC wearing course was 30 mm. This trial section has one carriageway and two lanes separated by a continuous traffic divider and the speed limit is 50 km/h. The test road has some intersections without traffic lights and it is completely straight. Owing to organizing and logistic problems, there was not possi-ble to perform in situ acoustic evaluation, thus this road section allowed also material to be taken during construction for the fol-lowing mechanical and acoustic laboratory characterization. 2.2.3 Trial Section 3 – Via Erbosa, Firenze GG-AR and OG-AR mixes were laid down on an urban trial sec-tion about 700 m long in Firenze (via Erbosa – figures 2.18 and 2.19).
Figure 2.18: Trial section 3
This test road was built in May 2007. Materials were spread as a replacement for the old wearing course. Two sections of about 350 m were spread with GG-AR and OG-AR respectively over a dense graded HMA binder course. The thickness of both wearing courses was 30 mm. This trial section has one carriageway and the speed limit is 50 km/h. The section covered with GG-AR has two lanes (one for
Advanced characterization of anti-noise materials – 2.Materials and trial sections
77
ordinary traffic and one reserved for buses) while OG-AR trial section has only one lane. The test road has some intersections without traffic lights and it is completely straight.
Figure 2.19: Firenze trial section
2.2.4 Trial Section 4 – Via della Cooperazione, Imola Another trial section realized with GG-AR wearing course was constructed on an urban way about 1000 m long in Imola (via della Cooperazione – figures 2.20 and 2.21)
Figure 2.20: Trial section 4
Advanced Characterization of Innovative Environmentally Friendly Bituminous Mixtures
78
This test road was built in October 2007. Material was spread as a replacement for the old wearing course and was staggered with some short sections of a traditional HMA wearing course selected as reference surface for traffic noise survey. The thickness of the new GG-AR wearing course was 30 mm. This trial section has two carriageway and four lanes and the speed limit is 70 km/h. The test road has some up and down hills, two intersections without traffic lights and it is quite straight.
Figure 2.21: Imola trial section
Advanced characterization of anti-noise materials – 3.Experimental program
79
3. Experimental program All the selected materials were mechanically and acoustically studied by means of laboratory and in situ tests. In this section, laboratory tests are presented in terms of specimen preparation methods and mechanical and acoustical test protocols. Subse-quently, test methods followed for the in situ acoustic charac-terization of the materials laid down on the respective trial sec-tions are presented. This characterization was based on find-ings of the noise level along the experimental road. For a better understanding, these results were associated with traffic analy-sis conducted at the same time. Trial sections allowed also the friction properties of materials employed to be checked and test protocols for this kind of evaluation are presented. Thus, a schematic summary of traffic and noise measurements surveys is presented for each trial sections investigated. 3.1 LABORATORY SPECIMENS PREPARATION Except for cold Slurry Seal mix that needed particular prepara-tion methods, specimens of the other materials tested were compacted by means of shear gyratory compactor or roller compactor depending on material type and testing protocol. In the following paragraphs these two kinds of compaction methods are detailed while SSCR specimen preparation will be explained together with test protocols specifically selected for the mechanical characterization of this cold bituminous mixture. 3.1.1 Shear Gyratory Compactor – EN 12697-31 Except for PA and PM mixtures, specimens subjected to stiff-ness modulus, fatigue resistance and permanent deformation resistance tests with Nottingham Asphalt Tester (NAT) were cy-lindrical samples prepared with the Shear Gyratory Compactor according to EN 12697-31 [38]. This compaction method was
Advanced Characterization of Innovative Environmentally Friendly Bituminous Mixtures
80
also used to prepare EC-AR specimens to be tested by CoAxial Shear Test (CAST). The Gyratory Compactor (figure 3.1) produces asphalt mixture specimens simulating the compaction conditions in the field. The asphalt mixture specimens are compacted at a constant pressure of 600 kPa, while the upper part of the mould simulta-neously rotates around the vertical axis with a speed of 30 rpm and a nominally constant angle of 1.25° (figure 3.1).
Figure 3.1: Shear Gyratory Compactor
The rotation generates shear stresses in the specimen creating a kneading of the material and facilitating reorientation of the aggregates. By knowing the mass of the specimen and the height of the specimen, specimen density can be estimated. Cylindrical specimens with 100 mm or 150 mm diameter can be prepared by selecting specified height compaction method or specified gyrations number compaction method. 3.1.2 Roller Compactor – EN 12697-33 Specimens for Wheel Tracking test were slabs prepared with Roller Compactor according to EN 12697-33 [39]. Moreover, specimens for laboratory sound absorption evaluation by means of the impedance tube were cylindrical samples cored from slabs compacted with Roller Compactor. Finally, cylindrical PA and PM samples for tests performed by the NAT were also cores from slabs manufactures with Roller Compactor. In the case of the PM mixture this compaction method was selected in
Advanced characterization of anti-noise materials – 3.Experimental program
81
order to apply the photocatalytic mortar correctly to represent the in situ condition. PA samples were prepared with the same protocol to better compare results subsequently obtained. The Roller Compactor (figure 3.2) is able to generate slabs of asphalt material in laboratory under conditions which simulate in situ compaction.
Figure 3.2: Roller Compactor
Four different levels of vertical force can be selected up to ap-proximately 30 kN. Loose hot asphalt concrete is compacted in specific mould as shown in figure 3.3. Slabs produced with the Roller Compactor measure 305 mm by 305 mm and from 30 mm to 100 mm thick.
Figure 3:3: Roller Compactor mould
The Roller Compactor can apply four different pressures: P1, P2, P3 and P4. P1 has a pressure range of 0 ÷ 2.5 bar and a minimum number of 2 passes which must be applied before the other pressure levels. P2, P3 and P4 have a pressure range of 0 ÷10 bar and the number of passes can be set between 0 and
Advanced Characterization of Innovative Environmentally Friendly Bituminous Mixtures
82
100. Obviously, setting the number of cycles to 0, Roller Com-pactor skips the corresponding pressure. The user can precisely pre-set a target density selecting the fi-nal height (thickness) of the slab. The volume of the mould is cross-sectional area multiplied by height of material, therefore, by compacting a certain mass, the slab density can be easily found. The final height of material in a mould can be fixed using two knurled nuts. Slabs can be subsequently cored to provide cylindrical speci-mens. 3.2 LABORATORY TEST EQUIPMENTS AND PROTOCOLS Hot Mix Asphalts selected were mechanically studied consider-ing three main properties: stiffness modulus, permanent defor-mation and fatigue behaviour. Moreover, laboratory open graded asphalt rubber mixtures with and without expanded clay were subjected to the CAST test in order to assess moisture and temperature cycles resistance. Cold micro-surfacing with crumb rubber was subjected to a specific experimental pro-gram. All the materials studied were acoustically characterized in laboratory through the determination of the sound absorption properties by means of the impedance tube. 3.2.1 Stiffness Modulus – EN 12697-26 Indirect Tensile Stiffness Modulus (ITSM) of asphalt mixtures was determined according to EN 12697-26 [40] by means of the Nottingham Asphalt Tester (NAT) showed in figure 3.4. The method is applicable to cylindrical specimens of various di-ameters (80÷200 mm) and thicknesses (30÷75 mm), manufac-tured in the laboratory or cored from a road layer. In this case, specimens subjected to this test were 100 mm diameter cylin-drical samples prepared with the shear gyratory compactor ex-cept for PA and PM mixtures whose specimens were 95 mm di-ameter cylindrical samples cored from slabs prepared with the roller compactor (figure 3.5). This preparation method was nec-essary in order to apply the photocatalytic mortar in a better way to best represent the in situ condition. PA and PM speci-mens were manufactured in the same way to perform a better comparison between the two materials.
Advanced characterization of anti-noise materials – 3.Experimental program
83
Figure 3.4: Nottingham Asphalt Tester
Figure 3.5: PM samples for ITSM test
The incorporated load actuator is capable of applying repeated load pulses with rest period along the vertical diameter of the specimen. The load has a haversine waveform and the loading time is controlled during the test. The rise-time is the time needed for the applied load to increase from zero to maximum value. Its duration is 124 ± 4 ms and the pulse repetition period is fixed to 3 s (figure 3.6). Considering the first part of the load pulse as a quarter of a sinusoidal wave, the rise-time of 124 ms could be associated to a frequency load of about 2 Hz. The test method is based on the idea to deform samples in their linear range under repeated loads whose amplitude shall be such that no damage can be generated on specimens. Thus, the peak load value is adjusted to achieve a target peak tran-sient horizontal deformation of 5 μm of the specimen diameter.
Advanced Characterization of Innovative Environmentally Friendly Bituminous Mixtures
84
Figure 3.6: Load pulse form for ITSM test
At least 10 conditioning pulses shall be applied in order to en-able the equipment to adjust the load magnitude and duration to give the specified horizontal diametral deformation and time. This deformation is measured by means of two LVDT mounted opposite one another in a rigid frame clamped to the specimen (figure 3.7).
Figure 3.7: ITSM test configuration
A further five load pulses are applied to the specimen in order to calculate stiffness modulus in that diameter. In fact, using the measurements from the 5 load pulses (figure 3.8), the stiffness
Advanced characterization of anti-noise materials – 3.Experimental program
85
modulus is determined for each load pulse using the following expression:
)273.0( υ+⋅⋅
=hz
FSm
where: Sm is the measured stiffness modulus (MPa); F is the peak value of the applied vertical load (N); z is the amplitude of the horizontal deformation obtained
during the load cycle (mm); h is the mean thickness of the specimen (mm); υ is the Poisson's ratio (0.35).
Figure 3.8: Summary of results of ITSM test for one diameter
The test is performed within a constant temperature climatic chamber. In this case the Indirect Tensile Stiffness Modulus (ITSM) was investigated at 20 °C testing at least 6 samples for each material studied considering two perpendicular diameters. The specimens were placed in the climatic chamber at the fixed temperature for at least 4 hours before testing. 3.2.2 Fatigue Resistance – BS DD ABF Fatigue behaviour of materials studied was investigated by means of the NAT performing stress controlled indirect tensile fatigue tests according to the British Standard [41].
Advanced Characterization of Innovative Environmentally Friendly Bituminous Mixtures
86
This method characterises the behaviour of bituminous mixtures under repeated load fatigue testing with a constant load mode using an indirect tensile load. A cylinder-shaped test specimen is exposed to repeated compressive loads with a haversine load signal through the vertical diametrical plane (figure 3.9). This loading develops a relatively uniform tensile stress perpendicu-lar to the direction of the applied load and along the vertical diametrical plane, which causes the specimen to fail by splitting along the central part of the vertical diameter.
Figure 3.9: Indirect tensile fatigue test configuration
Specimens tested to determine fatigue resistance were the same previously subjected to ITSM test. The rise-time and the pulse repetition period are equal to those of ITSM test but the peak load value is now fixed at a certain level and horizontal deformation is not measured. For each ma-terial selected three different stress levels were studied. The fatigue life of a single specimen is determined as the total number of load applications before a complete fracture of the specimen occurs. 3.2.3 Permanent Deformation Resistance – BS 598-110 The permanent deformation susceptibility of bituminous materi-als is assessed by the rut depth formed by repeated passes of a loaded wheel at a fixed constant temperature according to BS
Advanced characterization of anti-noise materials – 3.Experimental program
87
598-110 [42]. The specimens subjected to this test are slabs prepared in laboratory with roller compactor. Wheel-tracking apparatus consists of a loaded wheel that bears on a sample held securely on a table. The table beneath the wheel moves to and from and an acquisition device monitors the rate at which a rut develops in the surface of the test speci-men (figure 3.10). The apparatus includes a tyre of 204 mm outside diameter fitted to the wheel. The tyre is treadless and has a rectangular cross profile with a width of 47 mm. The tyre thickness is 20 mm. The wheel load under standard test conditions is 525 N (figure 3.11).
Figure 3.10: WTT specimens
Figure 3.11: Wheel Tracking Machine
The centre of the contact area of the tyre describes simple harmonic motion with respect to the centre of the top surface of the test specimen with a total distance of travel of 250 mm and a frequency of 21 load cycles per 60 s.
Advanced Characterization of Innovative Environmentally Friendly Bituminous Mixtures
88
The test is performed at controlled temperature being the test apparatus within a climatic chamber. Test specimens are condi-tioned at the test temperature for at least 4 hours before testing. The test temperature was usually fixed at 60 °C. But in some cases wheel tracking tests were performed also at 40 °C to in-vestigate the temperature dependency of rutting resistance. The Wheel Tracking Test (WTT) was carried out for either 540 minutes. A couple of parameters is used to describe material performance: final rut depth and rut rate, i.e. the asymptotic rate of increase in track depth. Although the rut depth measure-ments showed some variations during the test, the general trend exhibited an increasing monotonic function. This function, determined as a regression curve, allowed the final rut depth and the BS rut rate to be calculated according to the British Standard. 3.2.4 Coaxial Shear Test (CAST) Laboratory open graded asphalt rubber mixtures with and with-out expanded clay were subjected to the CAST test in order to assess moisture and temperature cycles resistance. CAST has been designed at EMPA in the 1980s and has been continuously further developed and improved [43]. It can pro-vide fatigue test under simultaneous action of dynamic loading, temperature cycles and water. Moreover, the fatigue test can be carried out, allowing the influence of environmental conditions on asphalt mixture properties to be investigated. The CAST test allows the mechanical properties of ring shaped centrally drilled specimens to be determined under load and temperature cycles. Inner and outer lateral surfaces of the specimens are sealed with epoxy resin and then glued to an in-ternal steel core and an external steel ring respectively as shown in figure 3.12. Afterwards, the steel ring with the specimen is introduced into the climatic testing chamber and mounted on a loading platform while the steel core is connected to the servo-hydraulic testing system. Temperature in the climatic chamber can be changed according to selected temperature cycles and controlled with a tolerance of ±0.2 °C.
Advanced characterization of anti-noise materials – 3.Experimental program
89
Figure 3.12: Vertical section of a typical CAST specimen
The servo-hydraulic system provides axial sinusoidal load cy-cles in controlled stress and strain mode. In particular, for wet test, sinusoidal loading cycles are selected to simulate the pressure-pumping effect of water in the asphalt mixture cavities.
Figure 3.13: CAST setup for dry test
The displacement is measured on the upper surface of the steel core by means of a LVDT. From the measured displacement and the specimen dimensions processed by the data acquisition software and the integrated finite element model, complex modulus E* and phase angle are calculated taking into account also glue properties and geometry of the test set-up [43]. The CAST set-up for specimen testing in water and in air are shown in figure 3.13 and 3.14, respectively. In wet test an alu-minium disc was used as support under the specimen to keep it saturated during the test. The specimen was flowed with water from below until its upper surface was covered by a 10 mm
Advanced Characterization of Innovative Environmentally Friendly Bituminous Mixtures
90
thick water layer. A hood was placed above the steel ring sur-face to reduce the water evaporation.
Figure 3.14: CAST setup for wet test
In particular, specimen height of 50 mm was chosen. Moreover, test method requires 150 mm diameter specimens and an inner radius equal to 29 mm (figure 3.15).
Figure 3.15: CAST specimen
In order to better simulate environmental conditions in the wet and dry fatigue test with CAST, specimens were subjected si-multaneously to temperature cycles with an upward ramp from 27 °C to 32 °C and a downward ramp from 32 °C to 27 °C, both with a temperature rate of 1 °C per hour. This rather high range of temperature was selected to promote damage development experimentally in a realistic summer temperature range. The low temperature rate of 1°C/h was chosen to achieve, as much as possible, a homogeneous temperature distribution in the
Advanced characterization of anti-noise materials – 3.Experimental program
91
specimens during the test. Furthermore, at the beginning of each test, the specimen was kept at 27 °C for two hours to en-sure initial thermal equilibrium. All test parameters are listed in table 3.1.
Test parameter Temperature cycles No temperature cyclesTempering period 7200 s 7200 s
Frequency 10 Hz 10 HzDef. Amplitude 0,01 mm 0,01 mm
Temperature prog. 27 - 32 °C 27 °CCycle number 4 /Duration test 144000 s 144000 s
CAST fatigue test conditions
Table 3.1: Test parameters for the CAST fatigue test
3.2.5 ASTRA Test In the following sections (§ 3.2.5, 3.2.6, 3.2.7 and 3.2.8) test methods to evaluate the mechanical properties of the Slurry Seal made up with dry addition of Crumb Rubber are presented. In particular, the compatibility between crumb rubber and slurry seal was prevalently analyzed by means of an innovative test method specifically devised for slurry surfacings, which is based on the use of the ASTRA test equipment, developed at the Uni-versità Politecnica delle Marche since 1992 and previously em-ployed for the characterisation of bituminous interfaces [44]. This innovative test method subsequently presented was previ-ously developed in order to achieve a practical laboratory test which could be useful in the design of these special surface treatments and in the evaluation of their estimated field per-formance [45]. In order to overtake the limitations of the other currently avail-able methods, slurry specimens are prepared by using as a support a slab of bituminous mixture for wearing courses com-pacted with a typical field density. This is accomplished by us-ing the roller compactor previously introduced. In this case 40 mm thick SMA slabs were prepared as support for slurry appli-cation. Slurry was prepared by using a mechanic stirrer appara-tus and poured on the slab without lateral restraints in order to achieve an application rate of about 10 kg/m2 (figure 3.16). Af-terwards, cylindrical samples were extracted from slabs by cor-ing and transferred in the ASTRA apparatus for testing after a
Advanced Characterization of Innovative Environmentally Friendly Bituminous Mixtures
92
proper curing period in a temperature and humidity-controlled environmental chamber.
Figure 3.16: Preparation of slurry surfacings slabs
Based on this test method, in the ASTRA apparatus slurry sur-facing specimens are subjected to the repeated action of a rub-ber slider which moves at a controlled horizontal speed while transferring to the surfacing a predefined vertical stress σ by means of a lever and weights system (figures 3.17 and 3.18). The whole apparatus is located in a climatic chamber with tem-perature and relative humidity control.
HOR IZONTAL DISPLACEMENTTRANSDUCER
ARTICUL ATED ELEMENT FOR THETRANSFER OF THE HORIZONTAL LOAD"T"
VERTICALL OAD "P"
MOVABLELODGING
MOVINGPISTON
MOTOR
SLURRY SUR FACING
LOAD CELL
RUBBERSLIDER
Figure 3.17: ASTRA test configuration
Advanced characterization of anti-noise materials – 3.Experimental program
93
Figure 3.18: ASTRA device
While the surface of the specimen is equal to 7088 mm2, the slider covers only a portion of it, equal to 4416 mm2. This de-rives from the square section of the slider (60 mm × 60 mm) and from its maximum horizontal excursion (13.6 mm).
Figure 3.19: Slurry specimen subjected to the ASTRA test
As a result of the stresses transferred to the surfacing, the slider causes a certain degree of ravelling of the slurry (figure 3.19), which may be quantified by means of a performance in-dex, indicated as SSI (Slurry Surfacing Index), defined by the following expression:
100(%) ⋅−
=initial
finalinitial
PPP
SSI
Advanced Characterization of Innovative Environmentally Friendly Bituminous Mixtures
94
where Pinitial is the weight of the slurry on the support measured after curing (and before testing) and Pfinal is the weight of the slurry measured after testing. Increasing values of SSI indicate an increasing tendency to ex-hibit ravelling. Theoretically expected values range between 0, which corresponds to a condition without loss of coated surface aggregates, and 62.3, which corresponds to the total loss of the slurry treatment, which is directly subjected to the action of the slider. Based on previous studies [45], test parameters were selected as follows:
Rubber slider speed 8.5 mm/minNumber of passes of the slider 5
Normal stress σ applied by the slider 2 kg/cm2
Test temperature 25 °C
ASTRA test parameters
Table 3.2: ASTRA test parameters
3.2.6 Modified British Wheel Tracking Test – ISSA TB 147 Moreover, SMA slabs covered with SSCR mix with 0% and 20% of crumb rubber were subjected to the Modified British Wheel Tracking Test according to the ISSA (International Slurry Sur-facing Association) Technical Bulletin No. 147 [46]. The only differences with the standard Wheel Tracking Test al-ready introduced are the test temperature, fixed at 45 °C, and the test duration, that is 60 minutes. 3.2.7 Pendulum Test – CNR B.U. 105 The same slab samples subjected to the Modified WTT were tested according to Italian Standard CNR B.U. 105 [47] in order to assess the skid resistance of SSCR surfaces in laboratory (figure 3.20). This test returns the so-called British Pendulum Number (BPN) that represents the loss of energy due to the sliding of the stan-dard rubber coated slider assembly across the test surface. In fact, the Skid Tester incorporates a spring loaded slider made of a standard rubber attached to the end of a pendulum. On re-leasing the pendulum from a horizontal position, the loss of en-ergy as the slider assembly passes over the test surface is
Advanced characterization of anti-noise materials – 3.Experimental program
95
measured by the reduction in length of the upswing using a calibrated scale.
Figure 3.20: Laboratory Pendulum Test
In particular, the mass of the pendulum arm, including the slider assembly, is 1,50 ± 0,03 kg while the centre of gravity is on the axis of the arm at a distance of 411 ± 5 mm from the axis of ro-tation. The pendulum arm has to be set in order to achieve a contact length of 125,4 ± 1,6 mm between the slider and the tested surface. The slider assembly consists of a 6,3×25,4×76,2 mm slider rubber and an aluminium backing. The slider assem-bly is spring-loaded against the test surface in such a way to achieve a nominal static force equal to 2,5 ± 0,1 kg. The test consists of 5 different swings on the wet test surface and the BPN of that surface is the whole number coming from the arithmetic mean of the last three values recorded. BPN has to be corrected depending on the test surface temperature. The reference temperature is fixed to 15 °C. 3.2.8 Cohesion Test – EN 12274-4 Slurry mixes having 0, 10 and 20% of both crumb rubber typol-ogy were tested in terms of cohesion according to a test proto-col described in the EN 12274-4 [48] which enables the set time and the trafficability time to be determined. Test specimens are prepared by pouring the slurry in a 10 mm height and 60 mm in diameter moulds (figure 3.21). The slurry has to be prepared in a beaker stirring it using a metal rod. After
Advanced Characterization of Innovative Environmentally Friendly Bituminous Mixtures
96
setting has taken place the specimens are conditioned at 23 ± 2°C for two hours and are then subjected to actual testing after fixed curing periods. In this case 15, 30, 60 and 90 minutes of curing period were selected and 5 different repetitions for each test configuration were performed.
Figure 3.21: Slurry specimen preparation for Cohesion Test
During the test, the specimens are loaded with a neoprene ele-ment 6,3 mm height and 28,5 mm in diameter which transfers on their surface a vertical stress equal to 200 ± 4 kPa. Results are expressed by referring to the measurement of the torque, which is necessary to cause the axial rotation of the neoprene element by 90-120° in 0.5-0.7 seconds.
Figure 3.22: Cohesion Tester
Advanced characterization of anti-noise materials – 3.Experimental program
97
3.2.9 Sound Absorption Test – EN ISO 10534-1 The acoustical part of the laboratory experimental program was based on the determination of the sound absorption coefficient α of the different materials investigated by means of the imped-ance tube according to the EN ISO 10534-1 [30]. Sound ab-sorption coefficients of materials studied, in terms of peak fre-quency and magnitude, were examined correlating them, where possible, also with results of “in situ” measurements of A-weighted road noise recorded. Specimens subjected to sound absorption investigation were 95 mm diameter cylindrical specimens cored from slabs prepared in laboratory with the roller compactor. The slabs were prepared with materials taken during the construction of the respective experimental road sections, except for EC-AR mixture which was totally prepared in laboratory. The thickness and air void content of the slabs were preferably chosen equal to those ob-tained in situ.
Figure 3.23: Impedance tube
For each material investigated, one slab was prepared and 5 cylindrical specimens were cored to be tested for the determi-nation of acoustic absorption coefficient. The measuring system
Advanced Characterization of Innovative Environmentally Friendly Bituminous Mixtures
98
consists of a tube with a small diameter compared to the wave-length of the acoustic signal to allow only the propagation of plane waves. At one end of the tube there is a loudspeaker that emits noise at determined frequencies, while at the other end there is a sample, whose sound absorption coefficient has to be measured (figures 3.23 and 3.24) This value is determined by the evaluation of the standing wave pattern of a plane wave which is the superposition of an incident sinusoidal plane wave with the plane wave reflected from the test sample.
Figure 3.24: Sound absorption determination setup
The loudspeaker is enclosed and sealed in a wooden box and is isolated from the tube to minimize structure-borne excitation of the impedance tube and to avoid experimental errors. Each sample was subjected to 7 different frequencies: 400, 500, 630, 800, 1000, 1250 and 1600 Hz. To reduce possible er-rors, the measurements were repeated at least two times or un-til there were at least two quite similar determinations for each frequency and specimen analyzed. Results were summarized focusing on mean α value for each frequency and specimen and highlighting, for each material, the mean values of sound absorption coefficients for each frequency analyzed. 3.3 IN SITU ACOUSTIC INVESTIGATION Two different approaches were selected to investigate in situ acoustic performance of studied materials depending on logistic needs. The first one was based on the idea of comparing noise levels recorded before and after the laying down of the bituminous materials included in the study providing acoustic measure-
Advanced characterization of anti-noise materials – 3.Experimental program
99
ments at different stage. This protocol was adopted for the monitoring of the trial section 1 constructed in San Benedetto del Tronto. On the contrary, for trial sections 3 and 4 noise levels recorded along the side of sections constructed with the materials studied were related with noise levels recorded at the same time on near different sections covered with traditional asphalt con-cretes and interested by quite the same traffic load. In situ acoustic investigation was not possible for trial section 2.
Figure 3.25: Measurements boxes
0
10
20
30
40
50
60
70
80
90
day 1 day 2 day 3 day 4 day 5 day 6 day 7 day 8
Measuring days
Leq
(dB
A)
Leq,dayLeq,night
Leq,wd = 69.5 dBA Leq,wn = 65.6 dBA
0
10
20
30
40
50
60
70
80
90
day 1 day 2 day 3 day 4 day 5 day 6 day 7 day 8
Measuring days
Leq
(dB
A)
Leq,dayLeq,night
Leq,wd = 69.5 dBA Leq,wn = 65.6 dBA
Figure 3.26: Results of one week of noise measurements
The acoustic characterization of materials under study was car-ried out performing noise measurements surveys, each lasting
Advanced Characterization of Innovative Environmentally Friendly Bituminous Mixtures
100
one week, according to the Italian technical specifications [49]. The measurement boxes, according to Class 1 of EN 60651 and EN 60804, were fixed at about 4 m high to lampposts situ-ated along the side of the experimental roadway (figure 3.25). The measurement boxes were able to determine the A-weighted equivalent sound level Leq for each measuring hour and the results were summarized in one mean A-weighted sound pressure level for night (Leq,wn) and day (Leq,wd) periods, as shown in the example of figure 3.26. 3.3.1 Trial Section 1 All measurement periods and places of trial section 1 are sum-marized and schematized in figure 3.27.
The measuring periods indicated with the symbols in the upper part of the figure refer to the condition before the laying down of the road materials; while the symbols indicated below the road section refer to the condition after the construction of the trial stretches at different stages. Moreover, the measuring point (*) was chosen in such a way that it could represent the reference noise level both for OGFC and for PM. The same assumption was also valid for (**) with regard to SMA and SSCR. The acoustic measurements at different stages allowed also the time dependency of the performance to be investigated.
Advanced characterization of anti-noise materials – 3.Experimental program
101
3.3.2 Trial Section 3 A schematic summary of acoustic survey performed on trial section 3 in Via Erbosa (Firenze) on Asphalt Rubber mixes is presented in figure 3.28. The acoustic measurements were performed in October 2007 and results were compared with those obtained at the same time for a traditional asphalt concrete for wearing courses laid down on the near Via di Villamagna.
3.3.3 Trial Section 4 A schematic summary of acoustic survey performed on trial section 4 in Via della Cooperazione (Imola) on Asphalt Rubber gap graded mix is presented in figure 3.29.
Advanced Characterization of Innovative Environmentally Friendly Bituminous Mixtures
102
These acoustic measurements were performed in July 2008 and results were compared with those obtained at the same time for the contiguous road section covered with a traditional asphalt concrete for wearing courses. 3.4 IN SITU TRAFFIC INVESTIGATION In order to make the comparative study of the “in situ” acoustic measurement objective, it was supported by traffic investiga-tion. Each investigation was carried out for 24 hours once a week, during the traffic noise finding weeks, recording the num-ber of vehicles and the corresponding speed and length. For each measuring point one measurement tool was placed at the centre of each lane (figure 3.30).
Figure 3.30: Traffic measurement tool
This kind of measurement tool utilizes the VMI (Vehicle Mag-netic Imaging) technology that is able to point out variations of the terrestrial magnetic field. As a consequence, when a vehicle passes near the measurement tool, it is able to count the vehi-cle and to evaluate the corresponding speed and length. Results have been summarized emphasizing, for each day of measure, the total traffic flow. 3.4.1 Trial Section 1 Similarly to what showed in 3.3.1, all measurement periods and places of trial section 1 are summarized and schematized in figure 3.31.
Advanced characterization of anti-noise materials – 3.Experimental program
Likewise in figure 3.27, the measuring periods indicated with the symbols in the upper part of the figure refer to the condition be-fore the laying down of the road materials; while the symbols indicated below the road section refer to the condition after the construction of the trial stretches. Furthermore, the measuring point (*) was chosen in such a way that it could represent the reference traffic flow for SMA, SSCR, OGFC and PM. Similarly, (**) represent the traffic passing on SMA, SSCR and OGFC pavements. 3.4.2 Trial Section 3 The acoustic measurements in trial section 3 were coupled with traffic determinations according to what showed in figure 3.32.
3.5 IN SITU FRICTION CONTROL According to EN ISO 13473-1 [17] the pavement texture is the deviation of a pavement surface from a true planar surface and the profile is a two-dimensional representation of a surface. The profile of a surface is described by two coordinates: one along the surface plane, called distance, and the other in a direction normal to the surface plane, called amplitude. In a Fourier analysis, the profile curve can be mathematically described by a series of Fourier coefficients combined with si-nusoidal curves with certain frequencies and wavelengths. The texture level is defined as the distance between periodically re-peated parts of the curve. In particular, as already introduced, texture is usually classified in terms of texture wavelength (λ) and can be distinguished in microtexture (λ < 0,5 mm), macrotexture (0,5 mm < λ < 50 mm), megatexture (50 mm <λ < 0,5 m) and unevenness (λ > 0,5 m). The surface characteristics principally affecting friction proper-ties of pavements are microtexture and macrotexture. Microtexture assures the adhesion between tire and pavement also in presence of water while macrotexture produces lateral drainage of water and is responsible for the tire deformation for hysteresis that enhances friction properties. The texture characteristics dependency of the pavement sur-face friction is analytically summarized within the International Friction Index (IFI) introduced in order to harmonize and com-pare different texture and skid resistance measurements per-formed all over the world through different methods.
Advanced characterization of anti-noise materials – 3.Experimental program
105
On this context, the construction of proper trial sections allowed also friction properties of materials really laid down to be veri-fied by means of in situ tests monitoring pavement surface macrotexture and skid resistance. Thanks to these in situ measurements the International Friction Index (IFI) was evalu-ated too. This control was possible only for trial sections 1 and 4, excluding TSP-EC mix. Test methods for the friction evaluation are presented in the fol-lowing sections. 3.5.1 Pavement Surface Macrotexture Depth – EN 13036-1 The test method described within the European Standard EN 13036-1 [50] provides a procedure for determining the average depth of pavement surface by careful application of a known volume of material on the surface and subsequent measure-ment of the total area covered. The technique is designed to provide an average depth value of the pavement macrotexture and is considered insensitive to pavement microtexture charac-teristics. It has to be remembered that pavement macrotexture is intended as the deviations of a pavement surface from a true planar surface with the characteristic dimensions of wavelength from 0.5 mm up to 50 mm. The test procedure involves (figure 3.34):
1) spreading 25000 mm3 of 0.18÷0.25 mm diameter solid glass spheres into a circular patch on a clean and dry pavement surface by means of a flat hard rubber covered side-down disk (25 mm thick – 60÷75 mm diameter);
2) evaluating the area covered by measuring the diameter of the circular area covered by the material at a minimum of four equally spaced locations around the sample circum-ference;
3) calculating the average depth between the bottom of the pavement surface voids and the tops of surface aggregate particles.
The average pavement macrotexture depth is calculated using the following equation:
2
4DVMTD
⋅=
π
Advanced Characterization of Innovative Environmentally Friendly Bituminous Mixtures
106
where: MTD = mean texture depth of pavement macrotexture (mm), V = sample volume (mm3), D = average diameter of the area covered by the solid glass spheres (mm).
When used in conjunction with other physical tests, such as the Pendulum Test [47], the macrotexture depth values derived from this test method may be used to determine the pavement skid resistance capability. 3.5.2 Pendulum Test – CNR B.U. 105
Figure 3.35: Pavement Skid Resistance measurement
The Skid Resistance of the pavement surfaces analyzed was evaluated through the Pendulum Test [47] already described in 3.2.7. In figure 3.35 the execution of the test is showed.
Advanced characterization of anti-noise materials – 3.Experimental program
107
3.5.3 International Friction Index – ASTM E 1960 According to the ASTM E 1960 [51], the calculation of the Inter-national Friction Index (IFI) arise from a measurement of pave-ment macrotexture and wet pavement friction. The IFI was developed in the PIARC “International Experiment to Compare and Harmonize Texture and Skid Resistance Measurements”. The index allows the harmonizing of friction measurements with different equipment to a common calibrated index. The IFI consists of two parameters that report the calibrated wet friction at 60 km/h (F60) and the “speed constant” of wet pave-ment friction (Sp). The mean texture depth (MTD) has been shown to be useful in predicting the speed constant (gradient) of wet pavement fric-tion while a linear transformation of the estimated friction at 60 km/h provides the calibrated F60 value. F60 and Sp have proven to be able to predict the speed de-pendence of wet pavement–related measurements of the vari-ous types of friction-measuring equipment. The two IFI parame-ters (F60 and Sp) have been found to be reliable predictors of the dependence of wet pavement friction on tire slip and vehicle speed. The speed constant Sp is first computed from a macrotexture measurement (TX in mm) as follows:
TXbaS p *+=
where a and b are constants depending upon the method used to determine the macrotexture. In particular for MTD method a and b are fixed respectively equal to -11.6 and 113.6. The next step uses the FR(S) at a given S to adjust the friction to a common slip speed of 60 km/h. This is accomplished using the speed constant predicted by the texture measurement in the previous step and using the following relationship:
⎟⎟⎠
⎞⎜⎜⎝
⎛ −
= pSS
eSFRFR60
*)(60 where:
Advanced Characterization of Innovative Environmentally Friendly Bituminous Mixtures
108
FR60 is the adjusted value of friction from a slip speed of S to 60 km/h for the equipment; FRS is the friction measured by the equipment at slip speed S; S is the slip speed of the equipment (10 km/h in case of pendu-lum test). The final step in harmonization is the calibration of the equip-ment, by regression of the adjusted measurement FR60, with the calibrated Friction Number F60:
TXCFRBAF *60*60 ++= where A, B and C are calibration constants for a particular de-vice. In case of the Pendulum Test A is 0.056, B is 0.008 and C is 0. F60 is the prediction of the calibrated Friction Number and Sp is the prediction of the calibrated Speed Number. The values of F60 and Sp are then reported as the International Friction In-dex. Friction at some other slip speed S may be calculated with:
⎟⎟⎠
⎞⎜⎜⎝
⎛ −
= pSS
eFSF60
*60)(
Advanced characterization of anti-noise materials – 4.Mechanical properties
109
4. Mechanical properties In this chapter, mechanical properties of investigated materials are presented. Firstly, results concerning stiffness modulus, fa-tigue resistance and rutting resistance of hot mix asphalts are showed. In this phase comparisons between different materials as well as between the same material prepared in laboratory or taken in situ were possible. Then analysis of results coming from fatigue tests with CAST apparatus on OG-AR and EC-AR mixes is illustrated. Finally, mechanical performance coming from the mix design process of the cold microsurfacing made up with crumb rubber is detailed in the last sections. 4.1 STIFFNESS MODULUS Stiffness modulus of the selected hot mix asphalts was deter-mined through dynamic indirect tensile test on materials both prepared in laboratory and taken in situ during construction of the trial sections. For each test configuration at least 6 different repetitions were performed. 4.1.1 Laboratory vs. in Situ Results In this section the comparison between materials wholly pre-pared in laboratory and materials taken in situ during construc-tion and then compacted and tested in laboratory are illustrated. It is possible to note that for each material stiffness noticeably increase in case of “in situ” bituminous concretes (figures 4.1 and 4.2). In particular, the higher the binder content of the mixes the less the increase of the stiffness modulus seems to be. In fact, it ranges from 33% for the SMA to 74% for the PA. This behav-iour could indicate that higher binder content slows down the stiffening process of the bituminous mix due to the aging of the asphalt binder. In fact, the thicker bitumen film covering the ag-gregates may lower the oxidation during the heating process.
Advanced Characterization of Innovative Environmentally Friendly Bituminous Mixtures
110
The higher stiffness showed by in situ materials is probably due to the aging of these mixes considered as the loss of volatile compounds. In fact, the in situ material is firstly heated up to very high temperatures in order to be laid down and compacted properly. Then, it is reheated in laboratory during the compac-tion process. On the other hand, the laboratory material is not subjected to the first heating process keeping more “fresh”.
2859
1663
2936
1670
2893
1458
2828
1474
2650
1676
2848
1831
0
500
1000
1500
2000
2500
3000
3500
4000
4500
5000
PA_lab PA_situ
Stif
fnes
s M
odul
us (M
Pa)
4057
2705
4563
2759
3976
2281
3748
2947
4371
2240
4368
3010
0
500
1000
1500
2000
2500
3000
3500
4000
4500
5000
PM_lab PM_sito
Stif
fnes
s M
odul
us (M
Pa)
Figure 4.1: PA and PM stiffness modulus
Nevertheless, it must be considered that different materials were employed for the preparation of in situ bituminous con-cretes with respect to laboratory made mixes. Thus, increased stiffness could be due also to the different mechanical proper-ties of the materials selected, especially the bituminous binder. Moreover, EC mix could show a stiffness increasing higher than what expected. In fact, this material, due to laboratory handling,
Δ = 57%Mean value = 2657 MPa
Mean value = 4181 MPa
Δ = 74%Mean value = 1629 MPa
Mean value = 2836 MPa
Advanced characterization of anti-noise materials – 4.Mechanical properties
111
was heated more times than the others producing higher oxida-tion of bitumen and consequent stiffening of asphalt concrete.
5075
3716
5404
3750
5618
4569
5856
4222
5387
2928
5752
3115
0
1000
2000
3000
4000
5000
6000
7000
SMA_lab SMA_situ
Stif
fnes
s M
odul
us (M
Pa)
6003
4976
6718
5498
6505
5486
6607
4292
8066
3647
8404
3894
0
1000
2000
3000
4000
5000
6000
7000
8000
9000
EC_lab EC_situ
Stif
fnes
s M
odul
us (M
Pa)
Figure 4.2: SMA and EC stiffness modulus
4.1.2 Comparison between Different Materials The comparison between the different materials was possible considering results of in situ materials. In such a way, mean stiffness modulus of 7 different bituminous mixtures was com-pared allowing the load spreading ability of these mixes to be evaluated (figure 4.3). As expected, asphalt mixtures characterized by a high air void content (PA, TSP-EC, OG-AR) prove to have stiffness much lower than dense graded mixtures owing to their higher struc-tural “weakness”. In particular, TSP-EC mix showed very low stiffness modulus probably due to the reduced maximum chip-ping size and to the presence of lightweight aggregates that make the granular matrix less stiff than a pure mineral one.
Mean value = 3717 MPa
Mean value = 5515 MPa
Δ = 33%
Δ = 52%Mean value = 4632 MPa
Mean value = 7051 MPa
Advanced Characterization of Innovative Environmentally Friendly Bituminous Mixtures
112
Moreover, OG-AR stiffness modulus was comparable with that of PA mix notwithstanding the greater amount of binder, voids in mineral aggregates and voids filled with binder and the lower maximum chipping size selected. This fact seems to prove the high quality of asphalt rubber binder employed to prepare OG-AR mix. As already introduced, very good results in terms of indirect tensile stiffness modulus were obtained for the dense graded bituminous mixes SMA and EC notwithstanding the reduced maximum chipping size of these materials and the presence of granular expanded clay within the EC asphalt concrete. These results proved the high performance of polymer modified bind-ers employed and the effectiveness of the granulometric distri-butions selected.
5515
2836
4181
7051
1472
5856
2371
0
1000
2000
3000
4000
5000
6000
7000
8000
SMA PA PM EC TSP-EC GG-AR OG-AR
Mea
n S
tiffn
ess
Mod
ulus
(MP
a)
Figure 4.3: Mean stiffness of in situ HMAs
As it can be seen, GG-AR performance was comparable with that of SMA and EC notwithstanding the higher contents of binder and voids filled with asphalt rubber bitumen. GG-AR load spreading ability was even more remarkable since it contained only calcareous aggregates instead of basalt used for SMA and EC. Again the very good performance obtainable from asphalt rubber binder seems to be showed. On the other hand, it is also necessary to underline that GG-AR mix was characterized by lower air void content (but quite the same VMA) and higher maximum chipping size. Difference between EC stiffness
Advanced characterization of anti-noise materials – 4.Mechanical properties
113
modulus and SMA and GG-AR ones (≈20%) was probably due to the lower amount of binder in EC mixture. Moreover, as al-ready said, EC was heated more times than SMA and GG-AR producing higher oxidation of bitumen and consequent stiffening of asphalt concrete. Finally, it is possible to observe that the photocatalytic mortar provides a significant increase (≈50%) in porous asphalt stiff-ness modulus even though the grout penetration affected only about 20% of the volume of the specimen. In terms of mortar permeation the PM mixture can be consid-ered an intermediate condition between a porous asphalt and a Grouted Macadam (GM), characterized by 25÷35% air void content of the compacted asphalt, completely filled with a tradi-tional cement mortar. In general, a growth in modulus with in-creasing grout penetration into the porous asphalt is obtainable. Even though the complete permeation of the cement mortar provides the best results, a penetration of the photocatalytic material greater than 1 cm deep is not justified because of an excessive cost impact considering that the “photocatalytically active” material is that one in contact with air pollutants. All things considered, all materials showed load spreading abil-ity suitable for the employment within heavy loaded road pave-ments taking into account that, as known, bearing capacity of porous mixtures is limited and mainly empowered to the lower pavement layers. 4.2 FATIGUE LIFE In the following paragraphs the results concerning fatigue resis-tance of asphalt mixtures analyzed through indirect tensile dy-namic test are showed. These evaluations were carried out testing materials both prepared in laboratory and taken in situ. 4.2.1 Laboratory vs. In Situ Results As already mentioned, the fatigue life of a single specimen is determined as the total number of load applications before a complete fracture of the specimen occurs. Plotting the initial strain as a function of the cycles to failure in a bi-logarithmic plane, it is possible to obtain the fatigue laws for the mixes (fig-
Advanced Characterization of Innovative Environmentally Friendly Bituminous Mixtures
114
ures 4.4 and 4.5). The initial strain is obtained normalizing the applied stress with respect to the stiffness modulus. The equa-tion of the fatigue law is defined as follows:
aNC −⋅=ε where C is a constant dependent on material characteristics and testing conditions and a is the slope of the fatigue law.
Fatigue @ 20°C
ε = 331.39N-0.0599
R2 = 0.834
ε = 550.25N-0.1083
R2 = 0.9526
100
1000
100 1000 10000 100000 1000000
cycles to failure N
initi
al m
icro
stra
in ε SMA_lab
SMA_situ
Fatigue @ 20°C
ε = 361.49N-0.0688
R2 = 0.5515
ε = 198.73N-0.0058
R2 = 0.0067
100
1000
100 1000 10000 100000 1000000
cycles to failure N
initi
al m
icro
stra
in ε EC_lab
EC_situ
Figure 4.4: SMA and EC fatigue lines
The fatigue law allows the parameter ε6 to be calculated. ε6 represents the strain level that assures a fatigue life greater than 1 million of cycles. Thus, the greater is ε6 the better is the fatigue behaviour. Based on this parameter, it is possible to state that, for each material tested, the mixture wholly prepared in laboratory outperformed the respective mix taken in situ and compacted in laboratory (table 4.1). This experimental result seems to confirm that a stiffer material often is not so much re-sistant to fatigue process. An exception to this behaviour is rep-
Advanced characterization of anti-noise materials – 4.Mechanical properties
115
resented by the EC mix that, however, showed very low correla-tion factors (table 4.1).
Fatigue @ 20°C
ε = 609.5N-0.1168
R2 = 0.9628
ε = 870.81N-0.1777
R2 = 0.9183
100
1000
100 1000 10000 100000 1000000
cycles to failure N
initi
al m
icro
stra
in ε PA_lab
PA_situ
Fatigue @ 20°C
ε = 338.97N-0.0841
R2 = 0.9072ε = 429.23N-0.1318
R2 = 0.9951
10
100
1000
100 1000 10000 100000 1000000cycles to failure N
initi
al m
icro
stra
in ε
PM_lab
PM_situ
Figure 4.5: PA and PM fatigue lines
lab situ lab situ lab situ lab situ
C 331.39 550.25 609.50 870.81 338.97 429.23 361.49 198.73
a -0.0599 -0.1083 -0.1168 -0.1777 -0.0841 -0.1318 -0.068 -0.0058
Table 4.1: Laboratory vs. in situ fatigue lines parameters
Moreover, it is interesting to note that the slope of the fatigue line of in situ materials is always greater than that one of labora-
Advanced Characterization of Innovative Environmentally Friendly Bituminous Mixtures
116
tory materials (table 4.1). This behaviour reveals a greater initial strain sensibility probably due to the greater stiffness of the in situ mixes. Again the EC mix shows a dissimilar performance. 4.2.2 Comparison between Different Materials In figure 4.6 the fatigue behaviour of the different materials tested is showed in terms of fatigue lines obtained interpolating results coming from dynamic indirect tensile tests on in situ taken asphalt mixtures.
Fatigue @ 20°C
ε = 198.73N-0.0058
R2 = 0.0067
ε = 550.25N-0.1083
R2 = 0.9526
ε = 870.81N-0.1777
R2 = 0.9183
ε = 429.23N-0.1318
R2 = 0.9951
ε = 2680.1N-0.2693
R2 = 0.9046
ε = 670.07N-0.1414
R2 = 0.8852
y = 500.57x-0.0823
R2 = 0.998310
100
1000
1000 10000 100000 1000000cycles to failure N
initi
al m
icro
stra
in ε
SMA_situ
PA_situ
PM_situ
EC_situ
TSP-EC_situ
GG-AR_situ
OG-AR_situ
Figure 4.6: Fatigue behaviour of in situ HMAs
First of all, it is necessary to underline the significantly high cor-relation factors obtained interpolating experimental results, ex-cepted for the dense graded bituminous mixtures containing expanded clay (EC). This fact raises some doubts about the significance of the results obtained and makes the analysis of them difficult.
Advanced characterization of anti-noise materials – 4.Mechanical properties
117
As a general rule of thumb, open graded materials showed fa-tigue resistance significantly lower than dense graded materials (table 4.2) demonstrating the structural weakness of this kind of asphalt concretes notwithstanding the low stiffness values of them would normally be expected to impart very good fatigue resistance. As exception, it is important to note the very good fatigue resistance proved by the open graded asphalt concrete made up with asphalt rubber binder with respect to the other porous materials investigated (TSP-EC and PA). In particular, OG-AR mixture demonstrated a fatigue life greater than SMA and comparable to EC mix both prepared with polymer modified binder. This result was obtained notwithstanding the very high void and VMA contents and highlights the remarkable proper-ties of the asphalt rubber binder. This seems to be confirmed by the fatigue performance of GG-AR mixture slightly lower than that of SMA (table 4.2) having similar stiffness and air void content.
C 550.25 870.81 429.23 198.73 2680.10 670.07 500.57
a -0.1083 -0.1777 -0.1318 -0.0058 -0.2693 -0.1414 -0.0823
Table 4.2: Fatigue lines parameters of in situ HMAs
Comparing PA and PM fatigue performance it is interesting to note that the PM mixture showed lower resistance because of the photocatalytic mortar applied on its surface. This fact con-firms that an increase in stiffness could provide a worsening of fatigue resistance properties. The same assumption could be done observing the fatigue behaviours of dense graded and open graded asphalt rubber asphalt concretes (GG-AR and OG-AR). This seems to be not valid for EC and TSP-EC mix but the low regression coefficient of EC fatigue law prevents to be-ing more accurate on this subject before further studies. More-over, fatigue lines slopes of materials containing expanded clay were so much different with respect to the others raising other doubts about the significance of the results obtained. In any case, expanded clay seems to reveal itself a weakness element
Advanced Characterization of Innovative Environmentally Friendly Bituminous Mixtures
118
for the fatigue resistance of bituminous mixtures. In fact, the failure of EC specimens occurred not only because of the breaking of the bituminous film but also because of the ob-served brittle breaking of expanded clay grains differently to what happened for the other bituminous mixes (figure 4.7).
Figure 4.7: Fatigue failure of EC (left) and PA (right) mixes
4.3 RUTTING RESISTANCE For what concerns rutting resistance properties of materials studied, the usual evaluations about laboratory and/or in situ taken materials, it was possible in some cases to investigate also the temperature influence on permanent deformation be-haviour performing wheel tracker test at 40 °C and 60 °C. Re-sults were analyzed in terms of final rut depth and rut rate (BSrate), i.e. the asymptotic rate of increase in track depth, cal-culated considering the first 45 minutes of the test. 4.3.1 Laboratory vs. In Situ Results Comparing rutting resistance properties of asphalt mixtures prepared in laboratory vs. taken during construction of trial sec-tion 1, better performance is showed by in situ materials for each mixture and test temperature selected. This result clearly reflects the higher stiffness demonstrated by the in situ asphalt concretes probably due to better qualities of materials employed (binder and aggregates) but also to the greater ageing process with consequent stiffening of in situ mixtures with respect to laboratory-made materials.
Advanced characterization of anti-noise materials – 4.Mechanical properties
119
SMAlab @ 40°C 1,50 0,33SMAsitu @ 40°C 0,31 0,07
Material Rut depth (mm)
BSrate (mm/h)
SMAlab @ 60°C 3,42 0,76SMAsitu @ 60°C 0,84 0,17
Material Rut depth (mm)
BSrate (mm/h)
Table 4.3: Laboratory vs. in situ SMA rutting resistance
WTT @ 40°C
y = 0.0478x0.2962
R2 = 0.79
y = 0.146x0.3708
R2 = 0.8485
0
0.5
1
1.5
2
2.5
3
3.5
4
0 60 120 180 240 300 360 420 480 540time (min)
rut d
epth
(mm
)
SMAsitu @ 40°C
SMAlab @ 40°C
WTT @ 60°C
y = 0.2067x0.2231
R2 = 0.9692
y = 0.3641x0.3561
R2 = 0.9871
0
0.5
1
1.5
2
2.5
3
3.5
4
0 60 120 180 240 300 360 420 480 540time (min)
rut d
epth
(mm
)
SMAsitu @ 60°C
SMAlab @ 60°C
Figure 4.8: Wheel Tracking Test on SMA mix
Observing in depth the results coming from WTT, it is possible to note that SMA and PA mixes proved the greatest difference between laboratory and in situ materials performance showing a rutting resistance 4÷5 times higher in case of asphalt concrete taken during construction (tables 4.3, 4.4 and figures 4.8, 4.9). Lower differences are noticed for EC material which was sub-jected only to WTT at 60 °C (table 4.5 and figure 4.10).
PAlab @ 40°C 1,13 0,23PAsitu @ 40°C 0,37 0,08
Material Rut depth (mm)
BSrate (mm/h)
PAlab @ 60°C 1,94 0,31PAsitu @ 60°C 0,85 0,17
Material Rut depth (mm)
BSrate (mm/h)
Table 4.4: Laboratory vs. in situ PA rutting resistance
Advanced Characterization of Innovative Environmentally Friendly Bituminous Mixtures
120
WTT @ 40°C
y = 0.0449x0.3368
R2 = 0.8184
y = 0.2483x0.2409
R2 = 0.8621
0
0.5
1
1.5
2
2.5
3
3.5
4
0 60 120 180 240 300 360 420 480 540time (min)
rut d
epth
(mm
)
PAsitu @ 40°C
PAlab @ 40°C
WTT @ 60°C
y = 0.1998x0.2308
R2 = 0.7199
y = 0.7546x0.15
R2 = 0.8348
0
0.5
1
1.5
2
2.5
3
3.5
4
0 60 120 180 240 300 360 420 480 540time (min)
rut d
epth
(mm
)
PAsitu @ 60°C
PAlab @ 60°C
Figure 4.9: Wheel Tracking Test on PA mix
EClab @ 60°C 1,58 0,31ECsitu @ 60°C 0,75 0,15
Rut depth (mm)Material BSrate
(mm/h)
Table 4.5: Laboratory vs. in situ EC rutting resistance
WTT @ 60°C
y = 0.187x0.2215
R2 = 0.8656
y = 0.4011x0.2177
R2 = 0.9649
0
0.5
1
1.5
2
2.5
3
3.5
4
0 60 120 180 240 300 360 420 480 540time (min)
rut d
epth
(mm
)
ECsitu @ 60°C
EClab @ 60°C
Figure 4.10: Wheel Tracking Test on EC mix
Moreover, it is interesting to underline that PM showed quite the same results comparing laboratory vs. in situ materials (table 4.6 and figure 4.11). This experimental outcome may reveal that the contribution of the mortar was predominant with respect of the asphaltic component for the permanent deformation re-
Advanced characterization of anti-noise materials – 4.Mechanical properties
121
sistance of PM material. In fact, the photocatalytic mortar em-ployed in both case was the same and the only difference be-tween the two materials (prepared in laboratory and taken in situ) was the porous asphalt concrete that acted as support for the cement mortar application.
PMlab @ 40°C 0,61 0,13PMsitu @ 40°C 0,40 0,09
Material Rut depth (mm)
BSrate (mm/h)
PMlab @ 60°C 1,07 0,18PMsitu @ 60°C 0,88 0,19
Material Rut depth (mm)
BSrate (mm/h)
Table 4.6: Laboratory vs. in situ PM rutting resistance
WTT @ 40°C
y = 0.045x0.3488
R2 = 0.8959
y = 0.0953x0.2948
R2 = 0.9644
0
0.5
1
1.5
2
2.5
3
3.5
4
0 60 120 180 240 300 360 420 480 540time (min)
rut d
epth
(mm
)
PMsitu @ 40°C
PMlab @ 40°C
WTT @ 60°C
y = 0.1427x0.2896
R2 = 0.9907
y = 0.3797x0.1652
R2 = 0.908
0
0.5
1
1.5
2
2.5
3
3.5
4
0 60 120 180 240 300 360 420 480 540time (min)
rut d
epth
(mm
)
PMsitu @ 60°C
PMlab @ 60°C
Figure 4.11: Wheel Tracking Test on PM mix
4.3.2 Comparison between Different Materials As already introduced in §3.2.3, although the rut depth meas-urements showed some variations during the test, the general trend exhibited an increasing monotonic function (figure 4.12). This function, determined as a regression curve, allowed the calculation of the final rut depth and of the vertical displacement at 30, 35, 40 and 45 minutes to evaluate the BS rut rate. As regards WTT test at 40 °C, it can be seen that all materials had comparable performance showing virtually no deformation
Advanced Characterization of Innovative Environmentally Friendly Bituminous Mixtures
122
(table 4.7 and figure 4.13). This is certainly due to the very good properties of materials employed to prepare these asphalt con-cretes but it has not to be neglected that the test temperature was probably not so much elevated to allow a discrimination be-tween different materials.
Table 4.7: Rutting resistance performance at 40 °C
WTT @ 40°C y = 0.0478x0.2962
R2 = 0.79
y = 0.0449x0.3368
R2 = 0.8184
y = 0.045x0.3488
R2 = 0.8959
y = 0.039x0.358
R2 = 0.7793
y = 0.0795x0.2356
R2 = 0.870
0.5
1
1.5
2
2.5
3
3.5
4
0 60 120 180 240 300 360 420 480 540time (min)
rut d
epth
(mm
)
SMAsitu @ 40°C
PAsitu @ 40°C
PMsitu @ 40°C
TSP-ECsitu @ 40°C
OG-ARsitu @ 40°C
Figure 4.13: Wheel Tracking Test at 40 °C
In this sense, the test temperature of 60 °C proved to be choos-ier and it allowed a better differentiation (table 4.8 and figure 4.14). In particular, all the asphaltic materials tested showed
Advanced characterization of anti-noise materials – 4.Mechanical properties
123
approximately a doubling of final rut depth and rate of increase in rut depth, except for OG-AR and TSP-EC open graded as-phalt mixtures that confirmed practically the same excellent rut-ting resistance demonstrated at 40 °C notwithstanding their low stiffness properties. Moreover, it is important to remember that SMA is a high rut resistant material thanks to its strong inter-locking coarse aggregate structure as confirmed by WTT test at both temperatures. Thus, performance of PA, PM, EC and GG-AR mixes has to be considered remarkable under this point of view. This confirms the high quality of granulometric distribution and binder selected.
The very good performance of porous materials notwithstanding the low stiffness and the high air void content could result form the direct contact between coarse aggregate without interposi-tion of bituminous mastic limiting in that way viscous deforma-tions. On the other hand, the bitumen employed has to have
Advanced Characterization of Innovative Environmentally Friendly Bituminous Mixtures
124
very high rheological properties in order to keep unchanged the porosity during time under the traffic load. In this sense, OG-AR mixture showed better rutting resistance than PA probably thanks to the enhanced properties of asphalt rubber binder with respect to a polymer modified one. As regards TSP-EC asphalt concrete, the excellent perform-ance demonstrated could be infused by expended clay grains introduced into the mixture. In fact, this kind of lightweight ag-gregate presents a marked surface texture that may offer a bet-ter interlocking between stony elements limiting the accumula-tion of permanent deformations. If this assumption proved to be true, the slightly better perform-ance of EC mix with respect for example to SMA or OG-AR could be explained in this way. 4.4 WATER SENSITIVITY WITH CAST In addition to the mechanical characterization already pre-sented, the two open graded bituminous mixtures prepared in laboratory with asphalt rubber binder (OG-AR and EC-AR) were tested to evaluate the water sensitivity by means of the innova-tive CoAxial Shear Test (CAST) apparatus developed at EMPA. As already introduced, the influence of both water and tempera-ture was analyzed performing fatigue test in wet and dry condi-tions with and without temperature cycles. For a better under-standing of moisture resistance properties, results coming from CAST test on OG-AR and GG-AR were compared with those obtained during previous studies on porous asphalt concrete having similar composition characteristics and subjected to the same tests [52]. 4.4.1 Experimental Output Figures 4.15 and 4.16 show the mean evolution of the complex modulus E*, normalized with respect to its initial value, and phase angle as a function of the number of fatigue cycles dur-ing temperature cycles, for the OG-AR series, in a dry and wet fatigue test, respectively. By comparing figure 4.15 with figure 4.16, it can be noted that the modulus reduction is not so much evident under wet with respect to dry testing conditions. This
Advanced characterization of anti-noise materials – 4.Mechanical properties
125
seems to suggest that materials tested were not much water sensitive.
This assumption is confirmed observing the black diagrams for all the downward ramps constructed plotting complex modulus versus phase angle. As it can be observed, the curves of four ramps both in the dry test (figure 4.17) and in wet test (figure 4.18) are closely grouped next to each other, whereas previous studies proved that a water sensitive material usually shows a
Advanced Characterization of Innovative Environmentally Friendly Bituminous Mixtures
126
wet black diagram with clearly spaced curves [43, 53, 54]. Re-sults presented are qualitatively the same for the EC-AR mix.
Moreover, for a better understanding of the results obtained from the experimental research carried out through CAST appa-ratus within this work, they are compared also with those ob-tained in a previous study on porous asphalts [52]. The bitumi-nous mix selected as term of comparison was an open graded
Advanced characterization of anti-noise materials – 4.Mechanical properties
127
mixture having 20% air voids, 30% VMA and 15 mm maximum chipping size prepared in laboratory with 5.5% of polymer modi-fied binder.
EC-AR dry EC-AR wet EC-AR dry Phase EC-AR wet Phase EC-AR dry Temperature EC-AR wet Temperature
Figure 4.20: EC-AR CAST tests with temperature cycles
The asphalt rubber materials studied showed lower stiffness than reference material probably due to the reduced maximum chipping size and the greater amount of asphalt rubber binder employed. On the other hand, if stiffness modulus is normalized with respect to its initial value, it is clear that, differently from what happened fro the porous asphalt, complex modulus of
Advanced Characterization of Innovative Environmentally Friendly Bituminous Mixtures
128
OG-AR and EC-AR did not decrease a lot during both wet and dry fatigue test denoting not only an excellent fatigue resistance but also a very low moisture sensitivity (figures 4.19 and 4.20). In fact, experimental output in terms of normalized complex modulus coming from dry and wet fatigue CAST test had quite the same evolution during time for both OG-AR and EC-AR mixes. Moreover, the presence of expanded clay within asphalt rubber mixture does not seem to not affect fatigue and water resistance of this innovative bituminous mixture (figures 4.21 and 4.22).
OG-AR EC-AR Ref. Material OG-AR Temperature EC-AR Temperature Ref. Material Temperature
Figure 4.22: Wet CAST tests with temperature cycles
Advanced characterization of anti-noise materials – 4.Mechanical properties
129
For what concerns the comparison between the studied asphalt mixtures and the reference material, figures 4.21 and 4.22 clearly showed that AR-based materials demonstrated to be much less moisture sensitive than the reference porous asphalt mixture. This assumption is further developed in the following paragraph through the employment of a characteristic index of the damage due to water. 4.4.2 Water Sensitivity Index The Mean Characteristic Modulus (MCMi) for each “i” ramp was calculated as the modulus value at the mid-time of the corre-sponding ramp (i.e. at 900 seconds or 9000 fatigue cycles from the beginning of the temperature ramp) obtained from the evo-lution of the mean modulus values. The MCM was considered as key parameter to better characterize the influence of water presence on fatigue performance. Though a low temperature rate (1°C/h) was selected in the fa-tigue tests, the specimen temperature did not change as fast as the temperature in the temperature chamber. In fact, the meas-ured complex modulus value at the mid-time in an upward ramp was still influenced by the previous lower temperatures. Like-wise, the measured modulus value at the mid-time in a down-ward ramp was still influenced by the previous higher tempera-tures. For this reason, MCMi values were separately analysed with re-gard to Upward Ramps (URi) and Downward Ramps (DRi). Figures 4.23 and 4.24 show the evolution of the MCM, as po-tential regression, for UR and DR as a function of fatigue cycles “n” for the asphalt mixtures studied compared with that of the reference porous bituminous concrete. By considering the asphalt rubber mixtures (OG-AR and EC-AR), in both cases (UR and DR), the trend lines for wet test and for dry test are quite parallel and close each other and are characterized by high correlation coefficients R2 implying that water does not influence the fatigue evolution of this series, sig-nificantly. On the contrary, the wet trend lines of the upward and downward ramps of reference material tend to decrease much more rapidly than the dry ones. Since, the only difference be-tween wet and dry tests is the presence of water, it can be stated that asphalt rubber mixtures tested seems to be very re-
Advanced Characterization of Innovative Environmentally Friendly Bituminous Mixtures
130
sistant to moisture damage while water affects fatigue perform-ance and enhances the weakening process of the reference po-rous material.
UPWARD RAMPS
y = 4,2291x-0,2254
R2 = 0,8364
y = 1,1338x-0,0719
R2 = 0,9981y = 1,43x-0,1031
R2 = 0,9955
y = 1,0558x-0,0701
R2 = 0,9977y = 1,1993x-0,0867
R2 = 0,9954
y = 1,0819x-0,0696
R2 = 0,9876
0,25
0,35
0,45
0,55
0,65
1000 10000 100000 1000000Number of fatigue cycles (n)
Nor
mal
ized
MC
M
OG-AR dry EC-AR dry Ref. Material dryOG-AR wet EC-AR wet Ref. Material wet
Figure 4.23: MCM evolution vs. fatigue cycles (UR)
DOWNWARD RAMPS
y = 1,4269x-0,1055
R2 = 0,9941y = 0,9423x-0,0634
R2 = 0,9996
y = 1,0185x-0,0716
R2 = 0,9988y = 14,173x-0,3317
R2 = 0,8631
y = 0,8591x-0,0561
R2 = 0,9966
y = 1,1617x-0,0882
R2 = 0,9904
0,25
0,35
0,45
0,55
0,65
1000 10000 100000 1000000Number of fatigue cycles (n)
Nor
mal
ized
MC
M
OG-AR dry EC-AR dry Ref. Material dryOG-AR wet EC-AR wet Ref. Material wet
Figure 4.24: MCM evolution vs. fatigue cycles (DR)
Advanced characterization of anti-noise materials – 4.Mechanical properties
131
As practical indicator for the increasing damage due to water presence, the Water Sensitivity Index (WSI) was introduced similarly to what done in previous studies [52]. WSI character-izes the evolution of MCM using data from both upward and downward ramps:
⎟⎟⎠
⎞⎜⎜⎝
⎛ −+
−⋅=
d
dd
u
uu
ddw
ddwWSI
21
where wu is the exponent of MCM potential regression, for up-ward ramps in wet test; du is the exponent of MCM potential re-gression, for upward ramps in dry test; wd is the exponent of MCM potential regression, for downward ramps in wet test and dd is the exponent of MCM potential regression, for downward ramps in dry test. The exponents of MCM potential regressions (wu, wd, du, dd) represent the successive loss of modulus during each tempera-ture cycle and, therefore, indirectly the deterioration gradient due to fatigue cycles, temperature cycles and water action in case of wet test. High WSI means that water considerably af-fects complex modulus of the material. On the contrary, if WSI tends to zero, fatigue performance of the material appears not significantly influenced by the presence of water and the fatigue behaviour does not differ from a dry test. Note, however, that the values of WSI are only valid for the specific testing conditions and are expected to change if tem-perature, fatigue cycles and testing mode are changed. Fur-thermore, WSI is not directly related to a failure criterion and damage law. WSI can therefore not be considered as material constant. On the other hand, in case of a standardized test, WSI can be considered as a practical assessment tool. In fact, it allows an easy evaluation of how water influences different mixtures in specific mechanical tests, such as CAST, character-izing how the regression slopes for the different temperature cycles change when testing the same material under dry and wet condition. Table 4.9 shows the comparison of the slopes, i.e. the exponent of the MCM potential regression, for each series of this investi-gation together with the corresponding mean WSI. Values com-
Advanced Characterization of Innovative Environmentally Friendly Bituminous Mixtures
132
ing from previous studies on the reference material are also re-ported as term of comparison. It is possible to note that the open graded asphalt concrete pre-pared with asphalt rubber binder (OG-AR) proved a very high moisture damage resistance showing a WSI close to zero indi-cating identical fatigue behaviour under both dry and wet test conditions. Slightly higher water sensitivity was demonstrated if a certain percentage of expanded clay is added to the asphalt mix but the WSI value obtained was very low anyway if the high air void content of this bituminous concrete is considered. The high water resistance demonstrated by OG-AR and EC-AR ma-terials may arise from the remarkable qualities of asphalt rubber binder but also to the thicker bituminous film that covered the aggregates with respect to traditional hot mix asphalts.
Material Condition Ramp Exponent WSIup 0,0719
down 0,0634up 0,0701
down 0,0716up 0,0696
down 0,0561up 0,0867
down 0,0882up 0,1031
down 0,1055up 0,2254
down 0,3317
0,05
0,41
1,67
WATER SENSITIVITY WITH CAST
OG-AR
EC-AR
Ref.
dry
wet
dry
wet
dry
wet
Table 4.9: Summary of WSI values
4.4.3 Temperature Sensitivity Index Following the same idea that is the basis of WSI, results coming from CAST fatigue test in dry conditions with temperature cy-cles have been coupled with those obtained from the same kind of test carried out at constant temperature fixed at 27 °C in or-der to obtain an analogous index named Temperature Sensitiv-ity Index TSI defined as follows:
⎟⎟⎠
⎞⎜⎜⎝
⎛ −+
−⋅=
d
dd
u
uu
CoCoCy
CoCoCy
TSI21
Advanced characterization of anti-noise materials – 4.Mechanical properties
133
where Cyu is the exponent of MCM potential regression, for up-ward ramps in dry test with temperature cycles; Cou is the ex-ponent of MCM potential regression, corresponding to upward ramps in dry test without temperature cycles; Cyd is the expo-nent of MCM potential regression, for downward ramps in dry test with temperature cycles and Cod is the exponent of MCM potential regression, corresponding to downward ramps in dry test without temperature cycles. In order to make the results of fatigue test at constant temperature matchable with those com-ing from tests with temperature cycles, the MCMi for the CAST tests without temperature cycles were calculated at the same cycles numbers corresponding to the mid-time of the respective ramps in the CAST tests with temperature cycles.
UPWARD RAMPS
y = 1,1338x-0,0719
R2 = 0,9981y = 1,0819x-0,0696
R2 = 0,9876
y = 1,1902x-0,0525
R2 = 0,9986y = 1,1188x-0,0549
R2 = 0,999y = 1,3772x-0,0735
R2 = 0,9893
y = 1,43x-0,1031
R2 = 0,9955
0,4
0,5
0,6
0,7
0,8
1000 10000 100000 1000000Number of fatigue cycles (n)
Nor
mal
ized
MC
M
OG-AR cycles EC-AR cycles Ref. Mat. cycles
OG-AR no cycles EC-AR no cycles Ref. Mat. no cycles
Figure 4.25: MCM evolution for TSI calculation (UR)
Figures 4.25 and 4.26 show the evolution of the MCM, as po-tential regression, for UR and DR mid-time as a function of fa-tigue cycles n for the asphalt mixtures studied compared with that of the reference porous bituminous concrete. Firstly, it is possible to note that the green lines representing the MCM evolution for the tests on reference material had always a higher slope than materials studied in this research denoting a
Advanced Characterization of Innovative Environmentally Friendly Bituminous Mixtures
134
lower fatigue resistance both with and without temperature cy-cles.
DOWNWARD RAMPS
y = 0,9423x-0,0634
R2 = 0,9996
y = 1,2377x-0,0562
R2 = 0,9983
y = 0,8591x-0,0561
R2 = 0,9966
y = 1,1151x-0,0546
R2 = 0,9714y = 1,4929x-0,0809
R2 = 0,991
y = 1,4269x-0,1055
R2 = 0,9941
0,4
0,5
0,6
0,7
0,8
1000 10000 100000 1000000Number of fatigue cycles (n)
Nor
mal
ized
MC
M
OG-AR cycles EC-AR cycles Ref. Mat. cycles
OG-AR no cycles EC-AR no cycles Ref. Mat. no cycles
Figure 4.26: MCM evolution for TSI calculation (DR)
TSI allowed the influence of cycles temperature on fatigue re-sistance of materials tested to be evaluated taking into account the different behaviour between test with and without tempera-ture cycles. Table 4.10 shows the results calculated for asphalt rubber based materials also compared with those obtained from the reference material.
Material Condition Ramp Exponent TSIup 0,0719
down 0,0634up 0,0549
down 0,0546up 0,0696
down 0,0561up 0,0525
down 0,0562up 0,1031
down 0,1055up 0,0735
down 0,0809
Ref.cycles
0,35no cycles
EC-ARcycles
0,16no cycles
TEMPERATURE SENSITIVITY WITH CAST
OG-ARcycles
0,24no cycles
Table 4.10: Summary of TSI values
Advanced characterization of anti-noise materials – 4.Mechanical properties
135
OG-AR and EC-AR bituminous mixtures showed lower tem-perature sensitivity with respect to the reference material probably thanks to the remarkable qualities of the asphalt rub-ber binder. Moreover, the presence of the expanded clay seems to confer better temperature cycles resistance to the EC-AR mix. This could be due to the thermal properties of the ex-panded clay artificial grains produced in rotatory kiln at around 1100 °C. 4.5 MECHANICAL CHARACTERIZATION OF SSCR MIX The mechanical characterization of the cold slurry surfacing prepared with dry addition of crumb rubber coincided with the mix design of this particular bituminous material. As already in-troduced, once fixed granulometric gradation, bitumen emulsion content and cement content, four different dosages (0%, 10%, 20% and 30% with respect to aggregates weight) of two rubber sizes (2.5÷4 mm and 4÷7.5 mm) were separately tested with different methods. It has to keep in mind that emulsion content changed with rubber content and size taking into account spe-cific surface and volume of rubber grains introduced. Considering results coming form ASTRA test, it is simple to note that 30% of crumb rubber content demonstrated to be ex-cessive because it caused high loss of material, greater than 50%, when subjected to the rubber slider action during the rav-elling test through ASTRA apparatus (figure 4.27). On the other hand, 10% and 20% addition of crumb rubber demonstrated a slight SSI increase with respect to the traditional slurry seal suggesting that it may be possible to prepare the micro-surfacing with anyone of these rubber contents. The only ex-ception was represented by the mixture prepared with 10% ad-dition of 2.5÷4 mm crumb rubber. The SSI value obtained in this case clearly appears out of trend because one can expect that SSI will increase if rubber content increases. Thus, this behav-iour is probably due to an imperfect preparation of slurry seal slabs owing to the restricted time available for mixing and laying operations. Without repeating ASTRA test in this configuration showing anomalous SSI values, 20% of asphalt rubber content was selected as optimum content from this kind of examination. This assumption was based on the idea of adding as much rub-
Advanced Characterization of Innovative Environmentally Friendly Bituminous Mixtures
136
ber as possible in order to enhance acoustic properties of cold micro-surfacing without lowering too much mechanical perform-ance.
2,5-4 mm crumb rubber
50,68
38,47
59,16
28,77
0
20
40
60
80
0% 10% 20% 30%
Rubber content
SS
I (%
)
4-7,5 mm crumb rubber
28,7733,96 33,35
62,37
0
20
40
60
80
0% 10% 20% 30%
Rubber content
SS
I (%
)
Figure 4.27: Mean values of SSI
For a better and wider characterization of this very particular bi-tuminous material, SMA slabs covered with slurry seal with dry addition of 20% of crumb rubber of both dimensions were tested through the Pendulum Test and the Modified Wheel Tracking Test as explained in §3.2.6 and §3.2.7 and results ob-tained were compared with those of the traditional slurry seal. As expected, skid resistance showed by cold micro-surfacings with addition of crumb rubber demonstrated to be significantly lower than that of the plain slurry seal. However, the values ob-tained were anyway high and comparable, for example, with those of SMA demonstrating, in this sense, that the addition of rubber into the slurry seal should not compromise safety (figure 4.28).
Advanced characterization of anti-noise materials – 4.Mechanical properties
137
97
78 79 77
0
20
40
60
80
100
BP
N
plain slurry seal20% of 2,5-4 mm crumb rubber20% of 4-7,5 mm crumb rubberSMA
Figure 4.28: Pendulum test results
Modified Wheel Tracking Test @ 45 °C y = 0,3037x0,3889
R2 = 0,7993
y = 0,4491x0,3028
R2 = 0,9349
y = 0,0916x0,6082
R2 = 0,7571
y = 0,192x0,3919
R2 = 0,8249
y = 0,1931x0,372
R2 = 0,899
y = 0,2461x0,3801
R2 = 0,89
0
0,5
1
1,5
2
2,5
3
0 10 20 30 40 50 60time (min)
rut d
epth
(mm
)
20% of 2,5-4 mm crumb rubber (1) 20% of 2,5-4 mm crumb rubber (2)
20% of 4,5-7 mm crumb rubber (1) plain slurry seal (1)
plain slurry seal (2) 20% of 4,5-7 mm crumb rubber (2)
Figure 4.29: Modified WTT @ 45 °C
plain (1) 0,96 0,50plain (2) 0,89 0,45
2,5-4 mm (1) 1,49 0,782,5-4 mm (2) 1,55 0,664-7,5 mm (1) 1,11 0,814-7,5 mm (2) 1,17 0,60
Micro-Surfacing Rut depth (mm)
BSrate (mm/h)
Table 4.11: Results of Modified WTT
Results obtained from rutting test confirmed slight performance supremacy from slurry seal with addition of coarser crumb rub-ber with respect to finer one. In any case, performance of mi-
Advanced Characterization of Innovative Environmentally Friendly Bituminous Mixtures
138
cro-surfacing with crumb rubber was always lower than that of traditional slurry seal (figure 4.29 and table 4.11). Finally, cohesion test according to the European standard EN 12274-4 properly designed for micro-surfacings was performed. Results showed in figure 4.30 highlighted a more remarkable performance decrease due to the dry addition of crumb rubber coming from reclaimed tires within slurry seal mixes. In particu-lar, the Recommended Performance Guidelines for Micro-Surfacing drew up by International Slurry Seal Association (ISSA) [55] suggest two particular requirements for this kind of evaluation. The torque value after 30 and 60 minutes of curing time should be at least 12 kg×cm and 20 kg×cm respectively. 30 minutes are representative of the set time while 60 minutes are representative of the trafficability time.
COHESION TEST (EN 12274-4)
0
4
8
12
16
20
24
0 15 30 45 60 75 90 105 120curing time (min)
torq
ue v
alue
(Kg
x cm
)
plain Slurry Seal
10% of 2,5-4 mm crumb rubber
20% of 4-7,5 mm crumb rubber
20% of 2,5-4 mm crumb rubber
10% of 4-7,5 mm crumb rubber
Figure 4.30: Results of cohesion test
The recommended value for the set time is always verified ex-cept for an isolated point of the slurry seal with 20% of 4÷7,5 mm crumb rubber. On the other hand, only the plain cold micro-surfacing is able to prove its suitability to a quick traffic opening (60 minutes) while mixes with rubber did not reach the value recommended and their increase in cohesion appeared very slow. This suggests to not exceed with rubber content and to be more “patient” for what concerns traffic opening time in order to assure a good resistance of the slurry seal.
At the end of this innovative and in-depth study and after some mini trial sections, it was chosen to prepare the SSCR mix by
Advanced characterization of anti-noise materials – 4.Mechanical properties
139
adding to the fixed granulometric distribution 8.5% of 4÷7,5 mm crumb rubber. Moreover the material was mixed with 11% of polymer modified bitumen emulsion, 10% of water and 1% of cement. Notwithstanding this proper care and the not fast open-ing to the traffic after the laying down of the material within trial section 1, the SSCR mix denoted the feared problems when subjected to the real action of traffic. In fact, the rubber in the mixture was not able to bind well with the bitumen and it was partially thrown out by vehicles passing over.
Advanced Characterization of Innovative Environmentally Friendly Bituminous Mixtures
140
Advanced characterization of anti-noise materials – 5.Acoustic properties
141
5. Acoustic properties In this section the results coming from the acoustic characteri-zation of the different road materials through in situ and labora-tory tests are presented. In particular, in the first part the in situ studies by means of proper traffic and noise measurements surveys are showed telling them depending on the trial section where they were carried out. On the other hand, the second part of this section deals with the acoustical laboratory investi-gation about the sound absorption properties of bituminous ma-terials studied. 5.1 “IN SITU” ACOUSTIC CHARACTERIZATION Acoustic properties of asphalt concrete were investigated in situ by noise measurement surveys performed along the side of the different trial sections. For a better understanding of results, traffic flow measurements were carried out simultaneously.
5.1.1 Trial Section 1 The construction of this experimental roadway allowed the acoustic properties of SMA, SSCR, PA, PM and EC materials to be investigated. It has to keep in mind that the EC mix was spread in October 2004 while the other 4 materials were laid down nearly two years later. The “in situ” acoustic characteriza-tion was based on the idea of comparing noise levels recorded before and after the laying down of the bituminous materials in-cluded in the study, also providing acoustic measurements at different stages in order to investigate the time dependency of the performance. Results coming from traffic flow and noise level measurements carried out at different stages along the trial section are summa-rized in table 5.1. The results are expressed in terms of mean A-weighted sound pressure level both for night and day periods considering each bituminous material studied with the respec-
Advanced Characterization of Innovative Environmentally Friendly Bituminous Mixtures
142
tive traffic flows, heavy vehicles percentage and mean speed recorded.
Advanced characterization of anti-noise materials – 5.Acoustic properties
143
For what concerns SMA performance it is possible to note that there was a reduction of about 1 dBA after the laying down of this material and this little improvement in noise level disap-peared after six months of practice (figure 5.1).
This could seem to be not a positive outcome but it is possible to see that these results were associated to a traffic flow im-provement of about 10-15% (figure 5.2). Furthermore, the measurement box after the laying down of the wearing course was placed in a section where the mean vehicle speed was a few km/h greater than the control section. So this result can be considered quite positive because it is possible that, under the same conditions, the SMA wearing course would have assured
Advanced Characterization of Innovative Environmentally Friendly Bituminous Mixtures
144
1 or 2 dBA of noise reduction thanks to the reduced maximum chipping size, the “open” texture and the high binder content. Similar considerations about traffic flow improvement and noise abatement properties could be made for SSCR performance. Moreover, in this case results were also influenced by some problems related to the SSCR mix. In fact, as already said, in spite of preliminary careful laboratory studies, the rubber in the mixture was not able to bind well with the bitumen and it was partially thrown out by vehicles passing over. Thus the mixture practically tended to become similar to an ordinary slurry seal that is surely not a quiet mixture because of its rough texture. Thus, more accurate considerations about acoustic perform-ance of this kind of mixture have to be done not before the study of proper solutions able to guarantee a good bonding be-tween rubber and bitumen emulsion. In any case it is important to underline that, differently from other studied materials, SSCR mix improved its acoustic performance during time (figure 5.3). This fact is very encouraging for future developments taking into account also that what happened in terms of durability might be estimated because of the very innovative feature of this material.
SSCR
60.0
62.0
64.0
66.0
68.0
70.0
72.0
74.0
76.0
BEFORE AFTER AFTER 6 MONTHS
AFTER 12 MONTHS
soun
d pr
essu
re le
vel (
dBA
)
30
35
40
45
50
55
60
mean vehicle speed (km
/h)
Leq,wd (dBA)Leq,wn (dBA)Vm,d (km/h)Vm,n (km/h)
Figure 5.3: SSCR in situ noise results
Figure 5.4 represent the pavement surface by the SSCR mate-rial after about two years from the construction. It is possible to note the cavities left by the rubber thrown out but also some grains firmly anchored to the bituminous layer (red rings). They
Advanced characterization of anti-noise materials – 5.Acoustic properties
145
were not sufficient to improve acoustic properties but they could be considered as a positive signal for future developments.
Figure 5.4: SSCR pavement surface
As expected, excellent results were obtained with the PA wear-ing course that showed a 4÷5 dBA reduction in traffic noise, notwithstanding traffic flow improvement, thanks to its high air void content that allowed to obtain a high sound absorption co-efficient, as showed later. As a matter of fact, not only void con-tent but also size and interconnection of the voids contributed to the achievement of very good noise absorption capabilities counterbalancing probable negative effects coming from texture level. It is useful to remember that a reduction of 3 dBA is equivalent to halving traffic flow or doubling the distance be-tween the source and the receiver [9, 16]. Furthermore, this noise reduction agrees with what has been supposed by Euro-pean studies [3, 9] that developed an equation that relates the influence of air voids and thickness of OGFC layer to noise re-duction. According to these studies the reduction in noise level (ΔL in dBA) with respect to bituminous concrete can be evalu-ated by:
veL ××=Δ 005.0 where “e” is the thickness of surfacing layer (mm) and “v” is the air voids (whole number). Thus, for an OGFC wearing surface with 20% air voids, the noise reduction of a 40 mm thick layer
Advanced Characterization of Innovative Environmentally Friendly Bituminous Mixtures
146
would result in approximately 4.0 dBA. However, the most re-cent noise measurements showed that the acoustic benefits started to decrease (figure 5.5) probably due to the pores clog-ging with dust and rubbles (figure 5.6) demonstrating the diffi-culty to keep the acoustic performance of porous asphalt un-changed during pavement service life.
PA
60.0
62.0
64.0
66.0
68.0
70.0
72.0
74.0
76.0
BEFORE AFTER AFTER 6 MONTHS
AFTER 12 MONTHS
soun
d pr
essu
re le
vel (
dBA
)
30
35
40
45
50
55
60
mean vehicle speed (km
/h)
Leq,wd (dBA)Leq,wn (dBA)Vm,d (km/h)Vm,n (km/h)
Figure 5.5: PA in situ noise results
Figure 5.6: PA clogged pores
Moreover, it is also necessary to underline that, as feared, this pavement showed some early ravelling distress (figure 5.7) be-cause of the high air void content that makes this mixture not mechanically suitable for a very busy urban road. PM results show that the noise level of this trial section re-mained practically unchanged (figure 5.8). This is a good result
Advanced characterization of anti-noise materials – 5.Acoustic properties
147
considering the traffic flow improvement (figure 5.9) and the fact that this mixture was not an anti-noise material. In fact, the risk was that this pavement, because of the presence of the cement mortar that makes the mixture more rigid, could increase the noise level of this trial section. Probably the “new” bituminous matrix of the mixture counterbalanced the negative noise effects of the cement.
Figure 5.7: PA ravelling
PM
60.0
62.0
64.0
66.0
68.0
70.0
72.0
74.0
76.0
BEFORE AFTER AFTER 6 MONTHS
AFTER 12 MONTHS
soun
d pr
essu
re le
vel (
dBA
)
30
35
40
45
50
55
60
mean vehicle speed (km
/h)
Leq,wd (dBA)Leq,wn (dBA)Vm,d (km/h)Vm,n (km/h)
Figure 5.8: PM in situ noise results
In detail, it is possible to note an increase in noise level after the realization of the trial section probably due to the presence of the more rigid cement mortar. This level of noise tended to de-crease with time probably due to the progressive surface re-moval of the cement mortar by traffic passing over (figure 5.10).
Advanced Characterization of Innovative Environmentally Friendly Bituminous Mixtures
Figure 5.10: PM surface with and without mortar removal
EC
60.0
62.0
64.0
66.0
68.0
70.0
72.0
74.0
76.0
BEFORE AFTER AFTER 18 MONTHS
AFTER 24 MONTHS
AFTER 30 MONTHS
AFTER 36 MONTHS
soun
d pr
essu
re le
vel (
dBA
)
30
35
40
45
50
55
60
mean vehicle speed (km
/h)
Leq,wd (dBA)Leq,wn (dBA)Vm,d (km/h)Vm,n (km/h)
Figure 5.11: EC in situ noise results
Finally, for what concerns EC bituminous mixture, very good re-sults came out until 24 months after the realization of the
Advanced characterization of anti-noise materials – 5.Acoustic properties
149
pavement with about 2 dBA of noise reduction (figure 5.11). But afterwards these improvements seem to have unexpectedly disappeared without particular reasons linked to traffic (figure 5.12) or to the quality of the surface. Probably, the explanation of this behaviour has to be looked into the greater stiffness of the pavement due to the aging of the asphalt mixture given the good condition of the road surface without serious distresses (figure 5.13).
The wear and tear of the expanded clay grains during time may be another possible explanation of the decrease in acoustic benefits and it has to be proved through proper evaluation in the near future. In any case, by means of the employment of
Advanced Characterization of Innovative Environmentally Friendly Bituminous Mixtures
150
this asphalt concrete it was possible to obtain interesting anti-noise properties avoiding at the same time the problems usually related to porous surfaces in terms of laying down process, maintenance, mechanical and durability performance.
5.1.2 Trial Section 3 Anti-noise performance of GG-AR and OG-AR asphalt con-cretes could be assessed trough sound pressure level meas-urements along the side of the roadway few months after the construction of the trial section 3 in Firenze. Noise level re-corded was also compared with that measured at the same time by a particular section of the near Via di Villamagna cov-ered with a traditional bituminous mixture for wearing courses (table 5.2).
Observing the experimental results obtained, it could seem that noise level recorded for the reference material were not compa-rable with those of asphalt rubber mixtures because of the not negligible difference of traffic flow and speed between the dif-ferent sections (figure 5.14). But actually, the measurement box corresponding to reference material was placed at a greater distance from traffic stream than those mounted along the as-phalt rubber experimental sections in such a way that the dis-tance counterbalanced the different traffic conditions. In fact, it is possible to estimate through, for example, the Italian CNR prediction model [56] that the greater noise level recordable for the reference material due to the higher traffic flow and speed is roughly counterbalanced by the greater distance between measurement box and traffic stream. Thus GG-AR mixture proved to be about 3 dB(A) quieter than a traditional dense graded asphalt concrete (figures 5.15 and 5.16) principally
Advanced characterization of anti-noise materials – 5.Acoustic properties
151
thanks to the asphalt rubber binder employed. Again, it has to keep in mind that 3 dB(A) noise reduction corresponds to halv-ing traffic flow or doubling the distance between the source and the receiver.
A further 2 dB(A) noise reduction was demonstrated to be achieved through the employment of open graded asphalt rub-ber asphalt concrete (figure 5.17) that is able to combine acous-tic benefits arising from asphalt rubber binder with those obtain-able from high air void content in terms of sound absorption ca-pabilities. Moreover, this mix is characterized also by a reduced
Advanced Characterization of Innovative Environmentally Friendly Bituminous Mixtures
152
maximum chipping size that further enhanced rolling noise re-duction properties.
5.1.3 Trial Section 4 Following the same idea of comparing noise levels of two sub-sequent road sections laid down in trial section 4 in Imola, one covered with a traditional asphalt concrete and the other one with a gap graded asphalt rubber bituminous concrete, it was possible to verify the acoustic properties of GG-AR mix again. Results obtained from in situ acoustic and traffic investigations are presented in table 5.3.
Advanced characterization of anti-noise materials – 5.Acoustic properties
Differently to what happened for trial section 3, in this case noise pressure levels recorded (figures 5.18 and 5.19) were not directly comparable. In fact, the two sections were character-
Advanced Characterization of Innovative Environmentally Friendly Bituminous Mixtures
154
ized by the same mean vehicle speed and heavy vehicle con-tent but different total traffic flow, 25% lower for GG-AR material (figure 5.20) owing to an intermediate intersection.
Figure 5.21: Measurement boxes position – trial section 4
Moreover, the sound measurement box corresponding to GG-AR section had to be placed at a distance from traffic stream (figure 5.21 on the right) sensibly greater than that of reference material road section (figure 5.21 on the left). Thus, in the same way as the previous situation, it is possible to estimate that the difference between noise level in GG-AR sec-
Advanced characterization of anti-noise materials – 5.Acoustic properties
155
tion and in reference material section has to be reduced of about 3 dB(A) considering these two fundamental aspects. Tak-ing into account the previous considerations GG-AR proved again to be about 3 dB(A) quieter than a traditional dense graded asphalt concrete having quite the same void content and maximum chipping size. As a consequence, this noise re-duction, corresponding to halving the traffic flow, has to be im-puted to the use of the asphalt rubber binder that confers more elastic properties to the bituminous mixture. 5.2 LABORATORY ACOUSTIC CHARACTERIZATION Acoustic laboratory characterization consisted on the determi-nation of the sound absorption coefficient α of the materials in-vestigated by means of the impedance tube correlating it also with results of “in situ” measurements of A-weighted road noise recorded. Specimens subjected to sound absorption investiga-tion were cored from slabs preferably having the thickness and air void content equal to those obtained in situ. Results were summarized focusing on mean α value for each frequency and specimen and highlighting, for each material, the mean values of sound absorption coefficients for each frequency analyzed. Results obtained from laboratory tests with the impedance tube for the determination of the sound absorption coefficient of ma-terials employed in the different trial sections are organized in tables and figures representing the α values at different test frequencies for all bituminous mixtures investigated. First of all it is possible to note (table 5.4 and figure 5.22) that, as expected, the PM mixture showed very low absorption coef-ficient values because of the particular superficial conformation.
400 500 630 800 1000 1250 1600
PM_1 0.22 0.21 0.09 0.01 0.13 0.05 0.09
PM_2 0.34 0.29 0.15 0.02 0.14 0.04 0.08
PM_3 0.25 0.19 0.06 0.02 0.11 0.07 0.06
PM_4 0.23 0.12 0.09 0.04 0.13 0.04 0.11
PM_5 0.22 0.20 0.10 0.02 0.12 0.04 0.07
mean values 0.25 0.20 0.10 0.02 0.13 0.05 0.08
SOUND ABSORPTION COEFFICIENT α Frequency (Hz)
Specimen
Table 5.4: Laboratory acoustic results – PM
Advanced Characterization of Innovative Environmentally Friendly Bituminous Mixtures
In fact, specimens of this material presented homogenous sur-face of cement that filled all superficial air voids of PA used as the structural matrix of the material. These results in part also explained the not positive results obtained by the “in situ” noise investigation. The surface homogeneity of the specimens al-lowed the Authors to obtain similar results from different speci-mens. Thus, it is possible to assert that for PM mixture had poor acoustic properties due to both high stiffness at the tire/pavement interface and low sound absorption capabilities. As concerns SSCR specimens, they had very inhomogeneous surfaces among them due to the crumb rubber put in the blend. This fact involved very dissimilar and not so interesting results coming from the sound absorption coefficient determination (ta-ble 5.5 and figure 5.23). In any case, low values of sound ab-sorption coefficient were found but it has to keep in mind that the design of this particular kind of cold micro-surfacing was steered into the reduction of tire/road noise generation mecha-nisms instead of into the increase of sound absorption capabili-ties.
400 500 630 800 1000 1250 1600
SSCR_1 0.21 0.25 0.13 0.19 0.19 0.10 0.13
SSCR_2 0.17 0.32 0.26 0.20 0.31 0.15 0.14
SSCR_3 0.21 0.21 0.07 0.11 0.16 0.06 0.07
SSCR_4 0.12 0.17 0.21 0.45 0.49 0.16 0.08
SSCR_5 0.11 0.12 0.06 0.14 0.14 0.17 0.05
mean values 0.16 0.21 0.15 0.22 0.26 0.13 0.09
SOUND ABSORPTION COEFFICIENT α Frequency (Hz)
Specimen
Table 5.5: Laboratory acoustic results – SSCR
Advanced characterization of anti-noise materials – 5.Acoustic properties
For what concerns SMA, PA and EC sound absorption coeffi-cients it is very interesting to underline that these materials had a peak of absorption coefficient at the frequency of 1000 Hz (tables 5.6, 5.7 and 5.8 and figures 5.24, 5.25 and 5.26).
This fact is very important for two main reasons: i) it is well known that the human ear is very sensitive in this frequency
Advanced Characterization of Innovative Environmentally Friendly Bituminous Mixtures
158
range [18, 57]; ii) recent studies have demonstrated that most tires and road combinations show a prominent noise peak, very frequently just at 1000 Hz caused by a multitude of coinciding factors [15, 57]. Thus noise reduction in this frequency range is extremely significant.
In particular, PA mixtures demonstrated the highest sound ab-sorption coefficients, up to about 80% of sound absorption, thanks to the high air void content that clearly explains the very good results obtained by “in situ” noise measurements. SMA mixture showed quite a good peak sound absorption coef-ficient that, however, noticeably decreased at the other test fre-quencies. Thus, the quite good acoustic properties demon-strated in situ by this asphalt concrete are principally due to the reduced maximum chipping size but also to the minimization of sand content creating an “open” texture. Finally, EC bituminous material showed a peak of α lower than SMA but the sound absorption coefficient remained quite steady in the frequency range between 500 Hz and 1250 Hz demon-
Advanced characterization of anti-noise materials – 5.Acoustic properties
159
strating good sound absorption properties in a wider frequency range. This aspect coupled with the reduction of the tire/road noise generation due to the presence of the expanded clay gave the very promising acoustic results measured in situ.
TSP-EC material taken during the construction of the trial sec-tion 2 in Pesaro was compacted in laboratory in order to reach 14% air void content, simulating the in situ condition, and was acoustically tested to determine the sound absorption charac-teristics. Results obtained are showed in table 5.9 and figure 5.27. Again this material showed a peak frequency of absorp-tion at a frequency of 1000 Hz but the sound absorption coeffi-cient values demonstrated to be not so pronounced notwith-standing the presence of the expanded clay grains. This fact seems to confirm not only that expanded clay gives more bene-fits in reducing rolling noise generation rather than in enhancing sound absorption properties but also that a void content lower than 15% is not able to guarantee good absorption properties because the pores are probably not totally interconnected be-
Advanced Characterization of Innovative Environmentally Friendly Bituminous Mixtures
160
tween them. Moreover, the reduced maximum chipping size se-lected probably enhanced the air low resistance of the material limiting sound absorption characteristics.
These assumptions seem to be confirmed by the results of sound absorption determination for the open graded asphalt rubber mixtures. In fact, also OG-AR material, both prepared in laboratory or taken in situ, and EC-AR mix were compacted to 14% air voids and the level of absorption obtained was quite comparable with that of the TSP-EC mix (tables 5.10, 5.11 and 5.12 and figures 5.28, 5.29 and 5.30).
Here it is very interesting to note that OG-AR bituminous mix-tures demonstrated a lower peak frequency of absorption that moved to 630 Hz. According to [1], this may be due to the higher tortuosity, i.e. a pores-shape parameter, that arise from the reduced maximum chipping size coupled with to the high binder content that created narrow channels linking up the in-terconnected pores. The round-shaped expanded clay grains
Advanced Characterization of Innovative Environmentally Friendly Bituminous Mixtures
162
should assure a lower tortuosity and this may be the reason be-cause the peak of sound absorption coefficient of EC-AR mate-rial moved up to the frequency of 800 Hz. However, these as-pects relating to the peak frequency may be done also to spe-cific characteristic properties of the asphalt rubber binder and of the expanded clay grains. The presence of the expanded clay reflects also in a small increase in absorption level.
In order to estimate what was the influence of the reduced air void content and what was the influence of increased air flow resistance an tortuosity on sound absorption capabilities of open graded asphalt rubber materials, the bituminous mixtures prepared in laboratory were also compacted in such a way to achieve 20% of air voids and the results obtained from the acoustic characterization are showed in tables 5.13 and 5.14 and in figures 5.31 and 5.32, respectively. It is possible to note that the absorption levels increased in both cases confirming that 15% air voids could be considered as threshold below that a mixture can not be considered “porous” [1]. However, these
Advanced characterization of anti-noise materials – 5.Acoustic properties
163
materials did not reach sound absorption coefficients compara-ble with those obtained for the PA mixture having the quite the same air voids.
This confirms that the void content has a relative importance on absorption capabilities of asphalt concretes if not coupled with low air flow resistance and tortuosity both related to the maxi-mum grain size. This seems to be confirmed also by the fre-quency peaks of OG-AR and EC_AR materials that resulted at a frequency of 630 Hz and 800 Hz, respectively.
Again, the expanded clay grains within the asphalt mixture caused a small increase of sound absorption but principally are responsible for the shifting of the peak of absorption towards higher frequencies. As a matter of fact, the not elevated sound absorption coeffi-cients recorded the OG-AR materials indirectly proved that the very good anti-noise performance demonstrated in situ by this bituminous mixture is principally due to the acoustic properties in terms of reduction of rolling noise generation arising from the asphalt rubber binder. In this sense, the EC-AR mixture seems to promise very interesting results thanks to the employment of the asphalt rubber binder coupled with the expanded clay grains. Finally, low absorption coefficients were showed by the GG-AR mixture (table 5.15 and figure 5.33). This fact proved once again that the asphalt rubber binder is the main author of the acoustic benefits demonstrated by this kind of mixture through the in situ measurements of noise levels along the side of the roadway in trial sections 3 and 4.
400 500 630 800 1000 1250 1600
GG-AR_1 0.11 0.14 0.14 0.25 0.10 0.04 0.03
GG-AR_2 0.13 0.18 0.12 0.29 0.02 0.07 0.09
GG-AR_3 0.10 0.15 0.18 0.20 0.11 0.01 0.04
GG-AR_4 0.08 0.12 0.18 0.29 0.08 0.05 0.04
GG-AR_5 0.12 0.18 0.20 0.20 0.06 0.05 0.02
mean values 0.11 0.15 0.16 0.25 0.07 0.04 0.04
SOUND ABSORPTION COEFFICIENT α Frequency (Hz)
Specimen
Table 5.15: Laboratory acoustic results – GG-AR
Advanced characterization of anti-noise materials – 5.Acoustic properties
Advanced Characterization of Innovative Environmentally Friendly Bituminous Mixtures
166
Advanced characterization of anti-noise materials – 6.Friction properties
167
6. Friction properties The construction of the trial sections 1 (San Benedetto del Tronto) and 4 (Imola) allowed also the friction properties of the material actually laid down and interested by real traffic to be monitored. This aspect is of primary importance for the fulfil-ment of the fundamental safety requirements when a bitumi-nous mixture for wearing course is designed and laid down. The friction properties are directly connected with pavement texture that was measured in terms of micro and macro surface texture through traditional in situ tests. In order to synthesize the measurements performed and for a better comparison between results obtained in different trial sections, the International Fric-tion Index IFI was calculated. In the following paragraphs the results obtained for each trial section are presented. 6.1 TRIAL SECTION 1 In this case, it was possible to perform texture measurements at different stages in order to investigate also the time depend-ency of the friction performance. In the following paragraphs the friction properties in terms of macrotexture, microtexture and IFI of the different materials studied are showed.
6.1.1 Macrotexture
• SMA As concerns macrotexture offered by the SMA bituminous mix-ture, it is possible to note a remarkable increase in mean tex-ture depth still up to 12 months from the construction of the trial section (figure 6.1). This result was justified from the particular granulometric distribution characterized by a reduced amount of sand. The small decrease in macrotexture experimented after one year of service life with respect to the condition immediately after the realization of the trial section should require a further extension of the monitoring period.
Advanced Characterization of Innovative Environmentally Friendly Bituminous Mixtures
168
D1 (mm) D2 (mm) Dm (mm) MTD (mm)
before 275.0 260.0 267.5 0.44
after (0 months) 188.0 193.0 190.5 0.88
after (12 months) 204.0 220.0 212.0 0.71
Macrotexture (EN 13036-1)
0.00
0.20
0.40
0.60
0.80
1.00
MTD
(mm
)
MTD_beforeMTD_0 monthsMTD_12 months
Figure 6.1: SMA macrotexture level
• SSCR Before evaluating the results obtained by the section covered with cold microsurfacing made up with dry addition of crumb rubber coming from reclaimed tires (SSCR mix) it has to be re-membered that this material evidenced the thrown out of the main part of the rubber grains introduced into the mix because of the traffic passing over.
D1 (mm) D2 (mm) Dm (mm) MTD (mm)
before 298.0 295.0 296.5 0.36
after (12 months) 222.0 230.0 226.0 0.62
Macrotexture (EN 13036-1)
0.00
0.20
0.40
0.60
0.80
MTD
(mm
)
MTD_beforeMTD_12 months
Figure 6.2: SSCR macrotexture level
Advanced characterization of anti-noise materials – 6.Friction properties
169
Figure 6.2 showed a MTD value greater than 0.6 mm still after 12 months of service life. This result has to be considered very good taking into account also that the thrown out of the rubber grains determined an over-dosage of bitumen emulsion that clearly lowered the mean texture depth of the slurry seal mix. However, the result obtained proved to be satisfactory in terms of safety requirements.
• PA As expected, macrotexture level showed by the PA mixture was very high (figure 6.3) because the glass spheres posed on the pavement surface penetrate into the surface voids of the porous asphalt reducing al lot the interested surface.
D1 (mm) D2 (mm) Dm (mm) MTD (mm)
before 230.0 225.0 227.5 0.62
after (0 months) 100.0 85.0 92.5 3.72
after (12 months) 134.0 142.0 138.0 1.67
Macrotexture (EN 13036-1)
0.00
0.50
1.00
1.50
2.00
2.50
3.00
3.50
4.00
MTD
(mm
)
MTD_beforeMTD_0 monthsMTD_12 months
Figure 6.3: PA macrotexture level
In this sense it appears significant to underline the remarkable reduction of mean texture depth denoted after one year of ser-vice life that clearly reflects the clogging of the pores with dust and dirt that lowered also the acoustic properties of this kind of bituminous mixture. • PM The evaluation of surface properties offered by the asphalt pavement covered with the photocatalytic mortar resulted ex-
Advanced Characterization of Innovative Environmentally Friendly Bituminous Mixtures
170
tremely important in order to know how the presence of the ce-ment mortar on the pavement surface could affect friction. As it is possible to observe in figure 6.4, the pavement surface proved satisfactory macrotexture level notwithstanding the presence of the cement mortar. This good result was possible thanks to the proper preparation and laying down of the mortar that was efficaciously distributed on pavement surface thanks to the optimum water content selected. This fact involved the filling of superficial air voids and the formation of a thin film of cement on the top of the porous asphalt that allowed a proper surface texture to be preserved.
D1 (mm) D2 (mm) Dm (mm) MTD (mm)
before 230.0 225.0 227.5 0.62
after (0 months) 218.0 210.0 214.0 0.70
after (12 months) 218.0 250.0 234.0 0.58
Macrotexture (EN 13036-1)
0.00
0.20
0.40
0.60
0.80
1.00
MTD
(mm
)
MTD_beforeMTD_0 monthsMTD_12 months
Figure 6.4: PM macrotexture level
• EC Analyzing the results obtained fro the EC mix it is possible to note that the construction of this particular section immediately gave very high pavement macrotexture levels (figure 6.5). This fact was confirmed during time up to MTD value two times greater than those observed before the laying down of EC ma-terial. However, the increasing of macrotexture with time could be considered anomalous. It may be possible that this phe-nomenon is due to the progressive wear and tear of expanded clay grains exposed to tire contact. This hypothesis not only de-termines the increase in macrotexture due to the surface sharpness of mineral aggregates but also justifies the unex-
Advanced characterization of anti-noise materials – 6.Friction properties
171
pected loss of acoustic benefits denoted after about two years of service life.
D1 (mm) D2 (mm) Dm (mm) MTD (mm)
before 300.0 310.0 305.0 0.34
after (0 months) 240.0 230.0 235.0 0.58
after (18 months) 215.0 205.0 210.0 0.72
after (40 months) 180.0 205.0 192.5 0.86
Macrotexture (EN 13036-1)
0.00
0.20
0.40
0.60
0.80
1.00
MTD
(mm
)
MTD_beforeMTD_0 monthsMTD_18 monthsMTD_40 months
Figure 6.5: EC macrotexture level
The wear of the expanded clay may be caused by the nature of the lightweight aggregate grains. In fact, “resistant” type of ex-panded clay, suggested for dense graded bituminous concrete, rather than the more resistant “structural” one typically em-ployed for open graded mixes, was selected in this case. Thus, if the wearing of expanded clay should be confirmed through suitable controls on cores of EC material taken in situ, the em-ployment of “structural” lightweight aggregates would result ap-propriate also for dense graded asphalt concrete subjected to heavy traffic conditions during its lifetime.
6.1.2 Microtexture
• SMA SMA showed a good level of microtexture also after one year from the construction of the trial section (figure 6.6). This result confirmed the appreciable friction performance obtainable from the employment of this road material for wearing course of very busy road pavement.
Advanced Characterization of Innovative Environmentally Friendly Bituminous Mixtures
172
BPN_1 BPN_2 BPN_3 BPN_4 BPN_5 mean BPN (swings 3,4,5) T (°C) correction BPN
before 38 38 38 39 39 39 35 4 43
after (0 months) 55 54 54 54 54 54 18 1 55
after (12 months) 52 52 54 54 55 54 18 1 55
Microtexture (CNR 105/85)
0
10
20
30
40
50
60
70
80B
PN
BPN_beforeBPN_0 monthsBPN_12 months
Figure 6.6: SMA microtexture level
• SSCR The same considerations could be done for SSCR microtexture level. Notwithstanding an over-dosage of bitumen emulsion due to the thrown out of rubber grains, the BPN index proved to be similar to that demonstrated by SMA after one year of service life (figure 6.7).
BPN_1 BPN_2 BPN_3 BPN_4 BPN_5 mean BPN (swings 3,4,5) T (°C) correction BPN
before 36 35 35 34 34 34 34 4 38
after (12 months) 54 56 56 56 55 56 18 1 57
Microtexture (CNR 105/85)
0
10
20
30
40
50
60
70
80
BPN
BPN_beforeBPN_12 months
Figure 6.7: SSCR microtexture level
Also in this case, the very good properties of basaltic aggre-gates that constitute the solid phase of cold micro-surfacing
Advanced characterization of anti-noise materials – 6.Friction properties
173
played a fundamental rule in order to obtain and maintain a suitable skid resistance. • PA Peculiar results were showed by the porous asphalt wearing course that demonstrated a BPN value similar to that recorded before the construction of the trial section (figure 6.8).
BPN_1 BPN_2 BPN_3 BPN_4 BPN_5 mean BPN (swings 3,4,5) T (°C) correction BPN
before 48 47 47 47 46 47 28 3 50
after (0 months) 48 46 47 49 47 48 22 2 50
after (12 months) 62 62 64 62 62 63 12 -1 62
Microtexture (CNR 105/85)
0
10
20
30
40
50
60
70
80
BPN
BPN_beforeBPN_0 monthsBPN_12 months
Figure 6.8: PA microtexture level
Then, this value denoted a remarkable increase after one year of exercise reaching more suitable microtexture levels. Now it is important to underline that the surface texture of porous asphalt is not as important as for dense graded materials because the porosity of the open graded mixture assure the drainage of the water allowing a good contact between tire and pavement. In any case, a possible explanation of results obtained is that sur-face aggregates were initially covered with an excessive bitumi-nous film. Then, after several vehicles passing over, the film grew thinner and the aggregate surface was able to demon-strate its skid resistance properties. • PM It is interesting to note that, similar to what happened for the macrotexture level, the presence of the cement mortar on the top of the porous asphalt did not prevent to obtain better results than those recorded before the laying down of new material.
Advanced Characterization of Innovative Environmentally Friendly Bituminous Mixtures
174
The BPN value was about 60 up to 12 months after the realiza-tion of the trial section (figure 6.9) assuring the standard safety requirements also with wet pavement surface.
BPN_1 BPN_2 BPN_3 BPN_4 BPN_5 mean BPN (swings 3,4,5) T (°C) correction BPN
before 48 47 47 47 46 47 28 3 50
after (0 months) 60 60 60 59 59 59 16 1 60
after (12 months) 58 60 60 60 60 60 13 -1 59
Microtexture (CNR 105/85)
0
10
20
30
40
50
60
70
80
BPN
BPN_beforeBPN_0 monthsBPN_12 months
Figure 6.9: PM microtexture level
• EC
BPN_1 BPN_2 BPN_3 BPN_4 BPN_5 mean BPN (swings 3,4,5) T (°C) correction BPN
before 50 48 48 48 48 48 16 0 48
after (0 months) 67 70 72 74 74 73 22 2 75
after (18 months) 62 60 60 60 60 60 29 3 63
after (40 months) 68 68 70 70 68 69 15 0 69
Microtexture (CNR 105/85)
0
10
20
30
40
50
60
70
80
BPN
BPN_beforeBPN_0 monthsBPN_18 monthsBPN_40 months
Figure 6.10: EC microtexture level
Microtexture level demonstrated a remarkable increase after the realization of the EC trial section reaching significant BPN
Advanced characterization of anti-noise materials – 6.Friction properties
175
values (figure 6.10). Moreover this level remained very high up to 40 months after the construction demonstrating better skid resistance properties than a generic traditional asphalt concrete having the same age and traffic load. Again, the results ob-tained seem to indirectly confirm the hypothesis of wear of ex-panded clay grains already introduced in §6.1.1. In fact, BPN results seem to stabilize around typical values of mineral ag-gregates after 18 months of service life.
6.1.3 IFI Results obtained from the determinations of macrotexture and microtexture of the different experimental stretches analyzed were synthesized in a single value named International Friction Index IFI according to ASTM E1960. In table 6.1 the F60 and Sp values calculated for the different materials of the trial section 1 are presented:
SMA SSCR PA PM EC
F60 0,15 0,12 0,22 0,22 0,12
Sp [km/h] 38,93 29,53 58,27 58,27 27,27
F60 0,31 - 0,41 0,29 0,29
Sp [km/h] 88,04 - 411,02 67,36 53,88
F60 0,27 0,25 0,43 0,24 -
Sp [km/h] 68,86 59,20 178,28 54,44 -
F60 - - - - 0,30
Sp [km/h] - - - - 70,40
F60 - - - - 0,37
Sp [km/h] - - - - 85,98
AFT
ER
18
MO
NTH
SA
FTER
40 M
ON
THS
BEF
OR
EA
FTER
AFT
ER
12
MO
NTH
S
Table 6.1: International Friction Index – trial section 1
It is possible to note that the low pre-existent friction values were remarkable enhanced for each speed greater than 20 km/h thanks to the laying down of new materials (figures 6.11,
Advanced Characterization of Innovative Environmentally Friendly Bituminous Mixtures
176
6.12, 6.13 and 6.14). In particular, a relevant increase was cal-culated for the PA bituminous mixture thanks to its good water draining capability that reflected on very high level of macrotex-ture.
SMA
0.00
0.15
0.30
0.45
0.60
0.75
0.90
10 30 50 70 90 110S
F(S) BEFORE
AFTER
AFTER 12 MONTHS
Figure 6.11: SMA International Friction Index
PA
0.00
0.15
0.30
0.45
0.60
0.75
0.90
10 30 50 70 90 110S
F(S) BEFORE
AFTER
AFTER 12 MONTHS
Figure 6.12: PA International Friction Index
For all materials tested, friction values after 12 months of prac-tice started to decrease for medium-high speeds but still re-maining above the values before the construction of the new wearing course. On the other hand, for very low speeds they presented a small increase. The first phenomenon is related to the loss of pavement macrotexture that reduced water flow ca-pabilities for wet surfaces while the second one is due to the thinning of the bituminous film that initially covered aggregates with consequent little increase in microtexture.
Advanced characterization of anti-noise materials – 6.Friction properties
177
PM
0.00
0.15
0.30
0.45
0.60
0.75
0.90
10 30 50 70 90 110S
F(S) BEFORE
AFTER
AFTER 12 MONTHS
Figure 6.13: PM International Friction Index
EC
0.00
0.15
0.30
0.45
0.60
0.75
0.90
10 30 50 70 90 110S
F(S) BEFORE
AFTER
AFTER 18 MONTHS
AFTER 40 MONTHS
Figure 6.14: EC International Friction Index
This phenomenon is particularly emphasized for PA mixture whose friction values resulted lower than those immediately af-ter the construction of the trial section only for speeds greater than 75 km/h and the increase in friction at low speeds resulted remarkable. This is the direct consequence of the increase in microtexture level, thanks to the “denudation” of the basaltic aggregates, coupled with the sensible decrease in macrotexture due to the clogging of the pores with dirt and dust. For what concerns SSCR material, it is possible to note a be-haviour similar to that of the other mixes analyzed with a de-crease of friction at low speeds and an increase at high speeds after 12 months of realization of the trial section (figure 6.15). This result, even if considered good if compared with traditional requirements, was lower than that expected for a slurry seal mix. In any case, the friction level achieved resulted satisfactory taking into account also the not excessive vehicles speeds really supported.
Advanced Characterization of Innovative Environmentally Friendly Bituminous Mixtures
178
SSCR
0.00
0.15
0.30
0.45
0.60
0.75
0.90
10 30 50 70 90 110S
F(S) BEFORE
AFTER 12 MONTHS
Figure 6.15: SSCR International Friction Index
Finally, EC mix demonstrated an unusual behaviour that, on the contrary with respect to what expected, denoted during its ser-vice time an increase of friction at high speed and a decrease at low speed. This trend is probably due to the already supposed wear of expanded clay grains that should cause loss of micro-texture and contextual macrotexture increase.
AFTER
0.00
0.15
0.30
0.45
0.60
0.75
0.90
10 30 50 70 90 110S
F(S) SMA
PA
PM
EC
Figure 6.16: Initial International Friction Index
Comparing the different materials at the same period after the realization of the trial section (figures 6.16 and 6.17) it is possi-ble to deduce the notable level of friction at low speed offered by EC mix. This was due to the presence of the expanded clay grains characterized by a remarkable surface microtexture. Moreover, PM surface showed good friction properties compa-rable with those of SMA demonstrating to not affect surface per-formance of asphalt pavement notwithstanding the presence of the cement mortar on surface.
Advanced characterization of anti-noise materials – 6.Friction properties
179
Finally, it is interesting to note the effect of the remarkable PA macrotexture on friction at high speed that was sensibly greater than that of the others surfaces tested where surface water flow is limited.
AFTER 12 MONTHS
0.00
0.15
0.30
0.45
0.60
0.75
0.90
10 30 50 70 90 110S
F(S) SMA
SSCR
PA
PM
Figure 6.17: IFI after 12 months of practice
6.2 TRIAL SECTION 4 The same kind of experimental friction survey was performed for the trial section 4 constructed in Imola doing the in situ tests only about 12 months after the realization of the trial section and comparing results obtained for gap graded asphalt rubber mixture GG-AR with those of a traditional dense graded bitumi-nous mixture laid down in a adjoining section and selected as a reference surface.
6.2.1 Macrotexture Results obtained for the GG-AR material demonstrated to be very good and notable greater than those of the reference ma-terial that were in any case acceptable (figure 6.18). This fact proved that the particular granulometric composition of the as-phalt rubber material was able to assure a very good macrotex-ture level notwithstanding the high binder content characterizing this kind of mixture. The remarkable results of GG-AR were also confirmed by comparing them with those obtained for the materials of trial section 1 after one year from the construction. It is possible to note that MTD values recorded for GG-AR were comparable, for example, with those of SMA and SSCR asphalt concretes.
Advanced Characterization of Innovative Environmentally Friendly Bituminous Mixtures
180
D1 (mm) D2 (mm) Dm (mm) MTD (mm)
Reference Material 260,0 235,0 247,5 0,52
GG-AR 207,0 223,0 215,0 0,69
Macrotexture (EN 13036-1)
0,00
0,20
0,40
0,60
0,80M
TD (m
m)
MTD_Ref. MaterialMTD_GG-AR
Figure 6.18: Macrotexture level of trial section 4
6.2.2 Microtexture Notwithstanding calcareous aggregate employed for both mate-rials and the heavy traffic load passing on the selected trial sec-tion, microtexture level showed by both materials demonstrated to be considered good and comparable with that obtained by the materials studied in trial section 1 (figure 6.19).
BPN_1 BPN_2 BPN_3 BPN_4 BPN_5 mean BPN (swings 3,4,5) T (°C) correction BPN
Reference Material 53 52 52 52 51 52 37 4 56
GG-AR 59 59 59 59 59 59 37 4 63
Microtexture (CNR 105/85)
0
10
20
30
40
50
60
70
80
BPN
BPN_Ref. MaterialBPN_GG-AR
Figure 6.19: Microtexture level of trial section 4
Taking into account that the same kind of calcareous aggre-gates was selected for both GG-AR and dense graded asphalt concrete, the little difference between the two surfaces may be
Advanced characterization of anti-noise materials – 6.Friction properties
181
due to the rubber grains contained in the asphalt rubber binder that when in contact with the rubber slider of the skid tester in-creased the adhesion between the two rubber based materials. Thus, if this fact should be confirmed, an increased skid resis-tance would result from the contact between rubber tire and as-phalt rubber bituminous concretes.
6.2.3 IFI The very good results coming from macro- and microtexture measurements of GG-AR material laid down in trial section 4 reflected on its IFI value. In fact, GG-AR clearly outperformed the reference material friction properties denoting slightly better surface characteristics than those offered by SMA and SSCR material in trial section 1. This was principally due to the specific gradation of asphalt rubber bituminous concrete that is able to guarantee very good surface macrotexture level.
REF. MATERIAL GG-AR
F60 0,21 0,29
Sp [km/h] 47,43 66,63
Table 6.2: International Friction Index – trial section 4
IFI - TRIAL SECTION 4
0,00
0,15
0,30
0,45
0,60
0,75
0,90
10 30 50 70 90 110S
F(S)Ref. Material
GG-AR
Figure 6.20: GG-AR International Friction Index
Advanced Characterization of Innovative Environmentally Friendly Bituminous Mixtures
182
Advanced characterization of photocatalytic materials
183
Part II
Advanced characterization of photocatalytic materials
Advanced Characterization of Innovative Environmentally Friendly Bituminous Mixtures
184
Advanced characterization of photocatalytic materials – 7. Photocatalysis
185
7. Photocatalysis In this section an overview of photocatalytic process and its cor-related properties is presented. In particular, the principles that are the basis of the photocatalysis are briefly explained in such a way to introduce the de-soiling and de-polluting properties of titanium dioxide (TiO2) semiconductor which is the moving spirit behind the photocatalytic process. Then, peculiar characteris-tics of cement-based and coating photocatalytic materials are presented especially focusing on some road applications of such products. 7.1 FUNDAMENTALS It is recognized that many of the substances directly emitted by vehicles and industry in the ambient air represent a serious hazard for human health. In addition, photochemical reactions resulting from the action of sunlight on NO2 and VOCs lead to the formation of ozone, a secondary long-range pollutant, and smog. Acid rain is another long-range pollutant influenced by vehicle NOx emissions and resulting from the transport of NOx, oxidation in the air into nitrate and finally precipitation of nitro-gen acid with harmful consequences for building materials and vegetation [58, 59, 60]. The present levels of air pollution and the necessity to make cities more liveable stimulated research into innovative solutions able to reduce pollutants. The devel-opment of innovative materials which can be easily applied on facades, with both de-soiling and de-polluting properties, would be a significant step towards improvement life quality. Since the report of Honda and Fujishima [61] TiO2 photocataly-sis has been studied on the subject of water treatment and air treatment. Then, it was realized that various organic contami-nants in contact with surface of building materials coated with titanium dioxide can be decomposed by the photocatalytic reac-tion using relatively weak UV light [62]. In fact, materials con-taining titanium dioxide (TiO2) demonstrated to have particular
Advanced Characterization of Innovative Environmentally Friendly Bituminous Mixtures
186
chemical properties able to trigger oxidation process of organic and inorganic air pollutants when exposed to ultraviolet (UV) rays [63, 64, 65, 66, 67] (figure 7.1).
Figure 7.1: NOx reduction from pavement blocks [64]
Moreover, doped TiO2 with other elements (nitrogen, carbon, silver, etc.) demonstrated to be photocatalytically active also under visible light [63, 68, 69]. This offers the opportunity for application in UV-poor areas as well as higher efficiency during cloudy days, twilight and indoor applications, respectively. Thus, TiO2 based materials could be reasonably classified into envi-ronmentally friendly materials because they might give the chance to soften the greenhouse effect, to purify the environ-ment and to make life more worth living. Thanks to the these de-soiling and de-polluting properties, nowadays titanium dioxide is up to now one of the most attrac-tive and efficient semiconductor also because of its stability, commercial availability and ecological safety.
7.1.1 Photocatalysis Principles Catalysis is defined as the acceleration of chemical reactions by certain substances, called catalysts, without consumption of them that gives rise to its chemical durability [58, 59]. Most of the time catalysis takes place by reducing the activation energy. Important for a real catalytic reaction path is the regaining of the catalyst after the end of the reaction in the same state as in-duced. In this sense, semiconductors can also work as a photo-catalyst by absorbing the energy of light and transforming this energy into chemical reactants.
Advanced characterization of photocatalytic materials – 7. Photocatalysis
187
Photocatalysis only requires photonic energy to activate the solid (TiO2) by contrast with conventional catalysis which re-quires heat for thermo-activation. This is the main advantage of photocatalysis for a large variety of environmental applications at room temperature. Titanium dioxide is a semiconductor metal. It is well known that for semiconductors the band gap is defined as the difference between the completely electron-filled valence band (VB) and the completely electron-empty conduction band (CB). In gen-eral, photocatalytic process initiates with the adsorption of UV photons that can excite valence band electrons to conduction band generating an electron-hole-pair called “exciton”. The generated exciton has the possibility to move inside the band structure, into the bulk or onto the surface of the solid where it will react with present water (H2O) and oxygen (O2). This reac-tion produces highly reactive radicals such as OH radicals and superoxides, which are mostly responsible for the strong oxidiz-ing power of titanium dioxide (figure 7.2) [58, 65, 66, 70, 71, 72, 73]. The pollutants are mineralized up to their highest possible oxidation state generating safe substances easily washed off from the surface by water restoring the original photo-activity.
CB
VB
O2
H2O
HO•
HO2•
organic compounds
degradation products
hv
CB
VB
O2
H2O
HO•
HO2•
organic compounds
degradation products
hv
Figure 7.2: Photocatalytic process
It is important to underline that the photocatalytic activity of tita-nia is deeply influenced by the actual features of the particles with respect to both structural and morphological characteristics [66, 74]. Structurally TiO2 can crystallize in three different poly-morphs: anatase, rutile and brookite. The photo-activity of ana-
Advanced Characterization of Innovative Environmentally Friendly Bituminous Mixtures
188
tase is generally considered superior to that of rutile and brookite. As already introduced, in addition to specific properties of a semiconductor small changes in the electronic band structure can be carried out by doping the solid state with certain ele-ments. The incorporation of host-foreign element will result in distortions of the crystal lattice inducing changes inside the electronic band structure by interstates or deformation of the band itself. This may involve a reduction of the band gap energy to make the photocatalytic effect usable with visible light. In general, there exist several physical-chemical parameters which principally govern the photocatalytic activity of titania [70, 72, 75]: the mass of catalyst; the UV-light wavelength; the con-centration of the pollutant; the temperature, the UV-light radiant flux and the humidity. In particular, the photocatalytic activity increases proportionally with the mass of titania till reaching a plateau. As concerns wavelength effect, it confirms that artificial or natural (solar) UV-A photons are necessary. For pollutant degradation, where the concentration is rather low, the rate of the photocatalytic degra-dation reaction is proportional to the concentration. This also explains that the final phase of cleaning of the last traces will become longer and longer. On the opposite, for high concentra-tions such as fatty stains or layers, the local concentrations of pollutants are high and the reaction rate appears as constant. The influence of the temperature in the photocatalytic reaction exhibits three different domains. In particular, at temperatures corresponding to room conditions, the slope of the curve is small, indicating small activation energy of reaction. This means that temperature has little influence upon photo-activity and is a second order parameter. This is in line with the photo-activation mode of photocatalysis which makes it active at room tempera-ture constituting an ideal case for environmental applications. Finally, the radiant flux increases the photocatalytic activity. Fur-thermore, humidity can also affect TiO2 properties both promot-ing and inhibiting photocatalytic activity depending on the amount.
Advanced characterization of photocatalytic materials – 7. Photocatalysis
189
7.1.2 Self-cleaning Properties Photocatalysis has been applied for over a decade to various materials to obtain a “self cleaning” effect in building materials in order to maintain the aesthetic characteristics of structures.
Figure 7.3: De-soiling effect [63]
Photocatalytic products are expected to maintain their aesthetic characteristics unchanged over time, in particular the colour, even in the presence of aggressive urban environments. In fact, TiO2 coated material is able to turn to highly hydrophilic. Thus, stains adsorbed on surface can be easily washed up by water that soaks between stain and the highly hydrophilic TiO2 surface (figure 7.3) [60, 63, 67, 60, 70]. Self-cleaning TiO2-based materials could be applied on a wide range of horizontal and vertical surfaces (panels, walls, manufacts, etc.). Another function blessed with the photo-induced hydrophilicity is the anti-fogging function that prevents water drops to form on the TiO2 surface (figure 7.4) [63].
Figure 7.4: Anti-fogging effect [63]
Advanced Characterization of Innovative Environmentally Friendly Bituminous Mixtures
190
7.1.3 De-polluting Properties The main pollutants emitted by vehicles are carbon monoxide (CO), nitrogen oxides (NOx), volatile organic compounds (VOCs) and particulates. These pollutants have an increasing impact on the urban air quality. Lab-scale examinations have shown that the radicals generated by photocatalytic reaction are able to oxidize nearly all organic molecules and inorganic derivates which are not in their highest oxidation state. This means that the photocatalytic mechanism offers the possibility to reduce pollutants like toxic gases and unpleasant odours. Most of studies were carried out taking into consideration the de-polluting effect on NOx, among the most representative air components, from the pollution point of view demonstrating very good de-pollution capabilities [59, 60, 64, 65, 72, 76, 77] (figure 7.5).
Figure 7.5: Photocatalytic conversion of NO2 by TiO2 [76]
However, some studies demonstrated that the efficiency in re-gard to NOx degradation may vary in a notable scale depending on the different products available on market [78] (figure 7.6). For a good photocatalytic efficiency, a relatively high concentra-tion of NOx is needed. Moreover, it is necessary the presence of daylight, or, as an alternative, an acceptable amount of UV light (for indoor applications) as well as a regular rinsing with rain (or cleaning with water) to wash away the nitrate.
Advanced characterization of photocatalytic materials – 7. Photocatalysis
191
Figure 7.6: Degradation of NO from different products [78]
Figure 7.7: Photocatalytic activity vs. BTEX [60]
Other specific tests have demonstrated that the photocatalytic materials can also oxidise and make harmless sulphur dioxide (SO2) and other noxious compounds such as butadiene, ben-zene, formaldehyde, toluene, etc. [60, 74, 75, 79, 80, 81, 82] (figure 7.7) or PM10 [71]. These organic compounds are known for their carcinogenic nature and are present in exhaust fumes of cars and some of them also in the fumes produced while re-fuelling the gas tank of cars.
Advanced Characterization of Innovative Environmentally Friendly Bituminous Mixtures
192
7.2 TESTING AND MODELS Experience with several applications projects in Europe in early beginning are leading to conclusion that successful industrial commercialization of photocatalytic systems at present is strongly dependent on the development of testing methods ac-cepted as ISO or EN standards to ensure the advertised func-tion and thus worldwide acceptance. In fact, without proper evaluation many of applications are rather doubtful. Standardization protocols are essential for integration of the re-search effort in different laboratories and to compare the per-formance of commercial products, allowing a direct determina-tion of the de-pollution properties of test specimen in realistic ambient conditions. Even though extensive research activities in photocatalysis have been carried out on a worldwide basis for the last twenty years, it was not until 2003 that the Japanese Standard Organi-sation JIS has started an initiative to develop standards in photocatalysis. Based upon this JIS initiative an ISO committee has com-menced with the development of respective standards for photocatalysis at the end of 2003. Working group for test meth-ods for photocatalytic materials within ISO technical committee 206 was established (ISO/TC 206). The proposed methods are evaluating properties of photocatalytic materials for different application such as: test method for air purification performance as NOx, antibacterial activity, self-cleaning performance, water purification performance, etc. In the same context, the European COST Action 540 “Photo-catalytic technologies and novel nanosurfaces materials - criti-cal issues“ developed with the goal to be a joint activity of all European countries to overcome some of the most critical is-sues of photocatalysis mainly concentrated on standardization of the photoactivity testing methods [83]. Similarly, the European project PICADA (Photocatalytic Innova-tive Coverings Applications for Depollution Assessment) [60] gathered academic and industrial stakeholders as well as test-ing laboratories in order to develop a range of photocatalytic materials and to evaluate their effect also at a large scale. First, the products were developed and optimized through laboratory test methods designed to assess the de-soiling and de-polluting
Advanced characterization of photocatalytic materials – 7. Photocatalysis
193
performances due to photocatalysis. The efficiency of most promising formulations was then evaluated thanks to macro-scale tests as well as field trials and numerical simulations.
Figure 7.8: The PICADA partners [60]
7.2.1 Laboratory-scale Test Methods At laboratory scale, the de-polluting properties were evaluated within the European PICADA project through the abatement of NOx and VOCs that are realistic urban pollutants considered at common level. The method for the measurement of the photo-catalytic activity with reference to organic pollutants, in particu-lar hydrocarbon molecules such as benzene, toluene, ethylben-zene and xylenes (BTEX), was based on a specially designed stirred flow reactor. It is aimed at the measuring of the photode-gradation of organic compounds in air at ppb level at the sur-face of photocatalytic materials. The use of an actively mixed flow reactor resulted in a uniform concentration of reactants at the catalytic material surface. This fact allowed measuring the photocatalytic activity bypassing the limitations imposed by the concentration gradients of unmixed flow reactors. The pollutant concentrations and irradiation levels used throughout the study were comparable to those that can be found under real ambient conditions. This test method has been recently approved as Italian Standard (UNI 11238 – part 1) [84]. This protocol (figure 7.9) for the determination of the de-pollution activities of organic volatile compound (BTEX) demonstrated to be very useful for research studies and for photocatalytic material testing pur-poses [79].
Advanced Characterization of Innovative Environmentally Friendly Bituminous Mixtures
194
Figure 7.9: BTEX de-pollution test setup [79]
As concerns NOx abatement, PICADA Project [60] provided for a couple of testing protocols in static chambers using either NOx or NO2 as pollutants, Petri dish as test samples and an UV lamp placed some dozens of centimetres above the samples as UV photons source (figure 7.10). The initial concentration of pollut-ants was about 200 ppb in both cases and disappearance of ni-trogen oxides (NOx or NO2) was monitored using a NOx chemiluminescence analyzer.
Figure 7.10: The NOx test device [60]
Based also on these experiences, further laboratory test meth-ods for NOx abatement capabilities determination of photocata-lytic materials developed. One test protocol is the NOx flow-through method, as described in [85] based on a Japanese standard. The test set-up essentially consists of a metal con-tainer, in which one paving block is placed, with a UV-transparent glass at the top. Air with a selected NO concentra-
Advanced characterization of photocatalytic materials – 7. Photocatalysis
195
tion is blown over the surface with controlled flow rate, humidity, temperature, light intensity and geometrical conditions. The effi-ciency of photocatalytic material is derived from the concentra-tion measured at the outlet of the sample and from the concen-tration of nitrate in the water, in which the sample is immersed. Three different stages are present in the test: i) without light and with NO; ii) with UV light and NO; iii) with light and with pure air (without NO). Two other methods are commonly used, to assess the photo-catalytic activity of inorganic materials on the NOx abatement. These tests are conducted with a fixed concentration of NOx corresponding to a possible atmospheric pollution. The result of the test can be expressed as the NOx photocatalytic decompo-sition percentage of a sample under UV radiation. The intrinsic photocatalytic activity is also derived. All those techniques could be also adapted for the VOCs. In the first method (“static” method), a polluted air is put into cir-culation into a closed circuit, i.e. during the experiment, no air exchange takes place (figure 7.11).
Figure 7.11: NOx abatement “static” test method [85]
One part of this circuit, the reaction chamber, is a glass con-tainer surmounted by a UV source containing the sample. Gas sampling allows following NOx concentration with time. The test procedure is repeated twice: firstly with the sample inside the reaction chamber with the UV light turned off (or when it is pos-sible with an equivalent non-photocatalytic sample with the UV light turned on); secondly with the sample inside the reaction chamber with the UV light turned on. The adsorption on the
Advanced Characterization of Innovative Environmentally Friendly Bituminous Mixtures
196
sample surface is evaluated by assimilating the adsorption part of the abatement of the gas concentration in the dark. The second method (“dynamic” method) is very similar to the flow-through method above described, as it consists in following the NOx content of a continuous gaseous flow after being in contact with the surface of the sample. This test method has been recently approved as Italian standard (UNI 11247) [86] and the set-up is schematized in figure 7.12. The simulated pol-luted air provided by an artificial atmosphere generator system with a NOx source (s1 NOx source + s2 air source) is controlled (C humidifier + F flow controller) and injected into the reaction chamber R containing the sample and surmounted by a UV lamp providing a well-determined light intensity. The measure-ment procedure consists of: i) stabilization of the gas flow with the sample placed inside the reaction chamber which is pro-vided with polluted air flow without being submitted to UV; ii) the irradiation source is then activated, and the system is allowed to equilibrate for certain time; iii) the irradiation source is switched off and the return to the initial equilibrium is checked. NOx level is measured in continuous with a chemiluminescence analyzer A. The result is given as NOx reduction percentage with respect to the initial value.
Figure 7.12: NOx abatement test setup (UNI 11247)
Finally, specific colorimetric laboratory tests were also devel-oped in PICADA Project [60], in order to evaluate the dye de-composition and the efficiency in recovering the original colour of the material surface (figure 7.13). A test method for the de-termination of the photocatalytic activity of hydraulic binders through a colorimetric test has been recently approved by the Italian National Organization for Standardization (UNI) [87]. This
Advanced characterization of photocatalytic materials – 7. Photocatalysis
197
method permits to follow-up the colorimetric evolution of ce-ment-based mortar samples, which are surface-treated with an organic pigment, along the time (until 26 hours), during a con-tinuous exposition to an UV-A radiation, by means of a dedi-cated lamp.
Figure 7.13: Samples subjected to de-soiling test [60]
7.2.2 Macro-scale Test Methods A test at macro-scale was also developed in the European Pro-ject PICADA [60]. This test consisted of a large testing chamber (Indoortron room – 35 m3) with a certain surface of photocata-lytic materials at the walls of this chamber (figure 7.14).
Figure 7.14: A scheme of the “Indoortron” chamber [60]
The photo-conversion of NOx is monitored over time. The test protocol included also blank experiments in order to estimate the loss of NOx due to the side effects. These consisted in tests without samples inside the chamber and tests with samples but without UV light exposure.
Advanced Characterization of Innovative Environmentally Friendly Bituminous Mixtures
198
7.2.3 Pilot Site and Simulations Most assessments of the de-pollution effect of photocatalytic materials are limited to a laboratory-scale test. Those tests, al-though accurate for comparing or demonstrating the de-pollution effect, can hardly take into account external conditions, in particular air flow and thus pollutant dispersion. Moreover, the measurement process is particularly critical because, if the ma-terial must be tested under typical ambient conditions, very low pollutant concentrations are usually involved and the catalytic material activity must be determined under controlled conditions (irradiance, humidity, temperature, etc.). Consequently, the in-terpretation of the result in term of on-site de-pollution is limited and thus generally not reliable for end-users. On the other hand, on-site measurements, although mostly successful, are time and money-consuming and not easy to be generalised. These considerations explain how the very good results obtained in laboratory [58, 60, 64, 65, 71, 75, 80] have to be considered well-established and realistic while the same thing can not be affirmed for the limited experiences performed in situ [64, 88, 89, 90, 91]. As a consequence, it may be very useful to develop proper solutions, such as controlled in situ test or numerical simulation tools, to demonstrate and assess the de-pollution effect of such materials. Within PICADA project [60], a specific pilot site was set up. This pilot site is an intermediate step between the laboratory experi-ments and the real life situations. It allowed the in situ evalua-tion of the de-polluting properties of the photocatalytic materials by taking into account the climatologic phenomena in street canyons (figure 7.15). The site involves a series of three con-secutive artificially constructed street canyons at a scale of 1:5 prepared with commercial cargo containers. The walls of the first canyon were bare while the walls of the second canyon were covered with a photocatalytic cement mortar and the walls of the third canyon were treated with the same mortar but with-out TiO2 (reference material). A pipe perforated every 1 m and installed in the middle, along the street is connected to an en-gine (a power generating unit). This set-up plays the part of the road traffic. Continuous NOx measurements were performed on both sides of the street using NOx chemiluminescence analyz-ers. Background NOx measurements took place on the top of
Advanced characterization of photocatalytic materials – 7. Photocatalysis
199
an upper container. Meteorological parameters were recorded continuously (wind speed and direction, temperature, solar irra-diation, etc.). The difference in pollution levels between the TiO2-treated canyon and the reference indicated the efficiency to remove NOx under normal environmental conditions.
Figure 7.15: The canyon street pilot site [60]
Very good results were obtained but, at the same time, remark-able variations were found owing to differences in pollution source emission, wind direction and wall orientation. Proper simulations could eliminate these uncertainties. A numerical simulation using the three-dimensional model MIMO was developed within PICADA project. A deposition model was also implemented into MIMO, so as to quantify the removal of pollution occurring on the street canyon facades due to photocatalytic effects of the TiO2 treatment. The different deposition velocities were chosen in accordance with the macro-scale tests. Moreover, a particular 3-D simulation tool (figure 7.16) was built by adapting numerical simulation tools incorporating a photo-catalytic material in term of a deposition velocity at the surface [92]. This velocity is then calibrated, for a given reference mate-rial, by using the well-documented experimental measurements obtained on a specific experimental building site, the street can-yon site [60]. The extension to other materials or conditions is simply made by changing the deposition velocity value: the comparison with the reference material is done through the laboratory scale test for NOx described in [60].
Advanced Characterization of Innovative Environmentally Friendly Bituminous Mixtures
200
Figure 7.16: 3-D simulation of NOx concentration [92]
7.3 PHOTOCATALYTIC CEMENTITIOUS MATERIALS A new approach to the material science seems to demonstrate that photocatalytic activity may be conferred to cementitious construction materials such as mortars, concrete, pavements, etc. This seemed confirmed by the results obtained in the general-ised use of self-cleaning surfaces which allows buildings to maintain their aesthetic appearance unaltered over time [60, 68, 69]. In parallel, the capability of photocatalysis in cementitious materials to reduce the levels of urban pollution seemed dem-onstrated in laboratory (figure 7.17), at pilot scale and, more re-cently, with some specific in-field monitoring programs [60, 64, 65, 71, 76, 77, 78, 82].
Figure 7.17: Photo-activity of cement-based materials [58]
Advanced characterization of photocatalytic materials – 7. Photocatalysis
201
Cement-based materials may be applied on both horizontal and vertical surfaces ranging from pavements to paints, from coat-ing for roads to traffic divider elements, etc. As concerns self-cleaning purposes, one of the first applications of photocatalytic cement-based materials dates back to 2003 when the “Dives in Misericordia” Church (figure 7.18) was con-structed in Rome [85, 93]. This application open the way to the widespread development of self-cleaning concrete and surface treated elements (panels, walls and manufacts). After the Church in Rome, photocatalytic cements have been used in other prestigious architectural projects, above all in France, Belgium and Italy [85, 93]. Cementitious coatings (e.g. paints) containing photocatalyst have also been developed and re-cently applied on several buildings and other structures.
Figure 7.18: “Dives in Misericordia” Church [93]
A particularly interesting aspect of TiO2 cementitious materials for de-polluting purposes is that there should be a clear synergy between the cement and TiO2 that makes cement an ideal sub-strate for environmental photocatalysis. Many photo-oxidizing air pollutants are acidic. Thus, the basic nature of the cement matrix should be particularly suitable for fixing both the polluting reagent and the photo-oxidation products at its surface [76]. With reference to these concepts, from the self-cleaning proper-ties, the photocatalytic principle was extended in order to obtain cement-based materials possessing de-polluting properties. Most of studies carried out in Japan, Italy, France, Belgium, the
Advanced Characterization of Innovative Environmentally Friendly Bituminous Mixtures
202
Netherlands, etc. seemed to demonstrate a remarkable attitude to nitrogen oxides (NOx) degradation thanks to the employment of cement based photocatalytic materials. The use of a photo-catalytic cement-based material, in fact, should allow breaking down the noxious NOx gasses to nitrate which is due to the al-kaline binder surface. In the first rain shower, this nitrate is dis-solved from the surface and flows down with the rain water in the sewers. TiO2 facilitates the reaction of NOx but is not itself consumed in the reaction, so that the process is not limited in time. By rinsing the surface (a rain shower is sufficient) the original efficiency is restored. However, for a good photocata-lytic efficiency of the cement-based materials, a relatively high concentration of NOx is needed. Moreover, it is necessary the presence of daylight, or, as an alternative, an acceptable amount of UV light (for indoor applications) as well as a regular rinsing with rain (or cleaning with water) to wash away the ni-trate. As already introduced, other specific tests seemed to demon-strate the photocatalytic activity of cement-based material with regard to other noxious air pollutants such BTEX, PM10, etc. Among the several material parameters which can influence the photocatalytic activity of cement-based materials, the specific surface area of both cement and TiO2 seems to be one of the most relevant, which is strictly connected to the chemisorption rate and to the oxidation capacity. In any case, it was showed that the conversion efficiency increase with increasing resi-dence time and the co-existence of different air pollutants nega-tively affects the photocatalytic degradation of each of them [76].
7.3.1 Road Applications As already said, the achievement of a level of air pollution re-garded as safe for both health and environment is becoming a pressing necessity. So far the pollution due to traffic has been controlled through the reduction of vehicles’ emissions: on the one hand thanks to the setting up of fuels and engines with a low pollutant impact, on the other hand through a suitable traffic management. However, these solutions did not prove to be suf-ficient and, thus, photocatalytic materials may represent, in this sense, a new potential resource for a further air pollutants re-
Advanced characterization of photocatalytic materials – 7. Photocatalysis
203
duction. In fact, the road surface is, both for size and distribu-tion, one of the primary elements constituting urban tissue offer-ing an ideal substrate for photocatalytic applications that, in this case, will be also as near as possible to air pollutants source. In the following, several road applications of cementitious photocatalytic products are presented with the respective envi-ronmental results obtained. However, it has to keep in mind that, as already said, the experiences performed in situ are not so well-established yet because of the problems already intro-duced. Moreover, results are often obtained and made known by the producers themselves that clearly have great interest in outline good performance of such products. In Belgium, 10.000 m² of photocatalytic pavement blocks having the anatase placed in the 8 mm thick wearing course of the tile were placed at the ‘Leien’ in Antwerp (figure 7.19) [64].
Figure 7.19: Road application in Antwerp (Belgium) [64]
The efficiency over time was measured both in laboratory and in situ. Laboratory tests carried out based on a Japanese standard already mentioned showed a significant decrease in NOx de-pending on different test conditions (light, temperature, etc.). A decrease seemed to be noticed also during the first months of in situ measurements comparing results obtained for the photo-catalytic material with those of a reference traditional pavement (figure 7.20). A similar experience was developed in Bergamo (Italy) when a very busy urban street was recently renovated (September 2006), using 12.000 m2 interlocking paving blocks (figure 7.21). Monitoring data obtained by two different in situ environmental
Advanced Characterization of Innovative Environmentally Friendly Bituminous Mixtures
204
surveys and developed by the producers of such a product seemed to demonstrate the efficiency, quantified in almost 40% of NOx abatement with respect to a reference surface, in winter conditions [88] (figure 7.22).
Figure 7.20: NOx measurements in Antwerp [64]
Figure 7.21: Road application in Bergamo (Italy) [88]
This study took into account also the different weather condi-tions in the different monitoring days. It is interesting to report that higher concentrations values of NOx in the asphalt pave-ment area were found near the ground while, on the contrary, the same thing did not happen by the photocatalytic pavement. This seemed to confirm the NOx reduction activities of cement based TiO2 material.
Advanced characterization of photocatalytic materials – 7. Photocatalysis
205
Figure 7.22: NOx measurements in Bergamo (Italy) [88]
Moreover, in an industrial area near Calusco d’Adda, 8000 m2 of a pavement was built using concrete blocks: monitoring re-sults developed by the producers of the photocatalytic blocks seemed to demonstrate a NOx abatement of 45% [85]. Further applications were developed in Italy using a photocata-lytic cement mortar and the environmental monitoring of these areas were developed only by the producers of the cementitious photocatalytic materials. In Ortisei the road SS 242 was inter-ested by the application of such a product. Comparing air pol-lutant levels of the treated surface with those of a not treated adjoining pavement, a 30% of reduction in NO2 concentration was published by the producers [91]. In the city of Segrate (It-aly), a concrete road was built using 7000 m2 of a thin-layer of a photocatalytic mortar (figure 7.23). In this case, an evident re-sult was published (NOx abatement of 57%) [85].
Figure 7.23: Road application in Segrate (Italy)
Advanced Characterization of Innovative Environmentally Friendly Bituminous Mixtures
206
7.4 PHOTOCATALYTIC COATING MATERIALS In some cases there could be the need to apply photocatalytic products that could preserve surface characteristics (colour, roughness, etc.) of substrate. To match these requirements, transparent sols with binders that can be applied to various sur-faces are available on market. Several studies [94, 95] demon-strated the good photo-induced properties of these kind materi-als thanks to the already illustrated properties of titanium diox-ide semiconductor. 7.4.1 Road Applications In the city of Gaiofana (Italy) a TiO2-based spray product was applied on the bituminous pavement wearing course interesting a surface of 2000 m2 (figure 7.24). This product consists of TiO2 nano-particles dispersed into specific inorganic silicone resins. The measurements of NO2 and SO2 levels during the first months of pavement life seemed to demonstrate a reduction of pollutants of about 45% [90]. However, it is important to under-line that, similarly to what explained in the previous sections, this result was obtained and made it known by the manufactur-ing industry itself of such a product.
Figure 7.24: Road application in Gaiofana (Italy)
Other similar applications developed in several Italian urban contexts (Monza, Cantù, Rovereto, etc.) but the results regard-ing the photocatalytic activity of such trial sections are not pub-lished yet.
Advanced characterization of photocatalytic materials – 8. Testing on TiO2 materials
207
8. Testing on TiO2 materials The experimental program concerning the evaluation of the de-polluting properties of photocatalytic materials is presented in this section. The study was developed through in situ and labo-ratory measurements of air purification capabilities of two differ-ent TiO2-based materials specifically formulated for road appli-cations. The experimental program consisted of in situ air pollu-tion measurements on the trial section 1 and laboratory evalua-tion on materials taken in situ during the construction of the ex-perimental stretch. In particular, the photocatalytic materials studied as well as the evaluation method of the de-polluting properties of these materials are detailed in the following para-graphs. 8.1 MATERIALS Two different materials for road applications containing titanium dioxide were selected to be tested in order to evaluate their de-polluting capabilities. This evaluation was performed by means of in situ and laboratory tests. 8.1.1 Photocatalytic Cement Mortar The first material studied was a pre-mixed powdered product composed by photocatalytic cement containing nano-particles of titanium dioxide, selected mineral aggregates (maximum grain size = 1.5 mm) and special additives. This product is ap-plied on the surface to be treated as a mortar by addition of wa-ter. As already introduced in the previous chapter, this kind of material should have particular air purification capabilities aris-ing from the synergy between the cement and the TiO2 in the oxidation of acidic pollutants.
Advanced Characterization of Innovative Environmentally Friendly Bituminous Mixtures
208
8.1.2 Photocatalytic Spray Product The second material studied consists of a liquid product to be cold applied through a particular spray method. This photocata-lytic treatment looks as a clear odourless fluid containing TiO2 nano-particles dispersed into specific inorganic silicone resins. They must keep in suspension the active particles during the nebulization on the road surface and anchor them to the bitu-men. 8.2 TRIAL SECTION The photocatalytic materials were applied within the Trial Sec-tion 1 described in §2.1.10. In particular, the surface of the porous asphalt PA was sub-jected to the treatment with the TiO2-based materials. This road section, about 550 m long, was characterized by building fa-cades very close to the road surface creating the typical “can-yon” configuration that is detrimental for air pollution. As already said, a 40 mm thick PA was laid down over a 50 mm thick dense graded HMA binder course realized after the milling of pre-existent asphalt layer. PA acted as support for the appli-cation the two products selected and was compacted in order to achieve 20% air voids for a better application of the photocata-lytic materials. This experimental stretch was split into two sub-sections treated with the two different TiO2-based products. The first one was realized by partially filling the PA mix with the photocatalytic cement mortar introduced above. It is useful to remember that the mortar was prepared by adding 30% of wa-ter in order to obtain the right fluidity and was applied with a rate of 4 kg/m2 in order to seep into the asphalt concrete at least 10 mm deep matching both economical and technical de-mands. The mortar was prepared with concrete mixers and ap-plied manually the day after the realization of the bituminous road surface in such a way that the pavement was cool to avoid accelerated mortar curing that should affect its penetration into the asphalt layer. The laying of the mortar was followed by a superficial working with scrapers to favour penetration and dis-tribution (figure 8.1). It is clear that in this case the specific func-tional properties of the porous asphalt disappeared and the PA
Advanced characterization of photocatalytic materials – 8. Testing on TiO2 materials
209
mix acted only as structural support for the cement mortar ap-plication.
Figure 8.1: Application of the photocatalytic cement mortar
Figure 8.2: Application of the photocatalytic spray product
Advanced Characterization of Innovative Environmentally Friendly Bituminous Mixtures
210
In the second sub-section the fluid photocatalytic product was directly sprayed by skilled workers on the dry and clean road surface with a rate of 0.05 kg/m2 (figure 8.2). In this case it was possible to not affect the draining and sound-absorbing proper-ties of the PA wearing course. After the treatment the road sur-face had a slightly clearer grey colour and with a close observa-tion it was possible to note small greenish drops stored on the bituminous surface. It is important to underline that both treatments were subjected to a clear surface wear during time owing to mechanical stresses induced by vehicles. For what concerns the cement mortar, the material penetrated into the voids of the porous as-phalt was not completely removed while the spray product ap-peared completely taken off with the naked eye. 8.3 TEST PROGRAM First of all, it is important to remember that these kinds of mate-rial were subjected to an in-depth evaluation of the mechanical, acoustical and surface properties and the test methods and the results obtained are detailed in chapters 3, 4, 5 and 6. Thus, this section deals with the de-polluting capabilities of the photo-catalytic materials studied. In particular, in the following para-graphs the in situ and laboratory test protocols for the assess-ment of air purification properties of both TiO2-based materials are presented. 8.3.1 In Situ Evaluation of De-polluting Properties For the assessment of the effectiveness of the photocatalytic products, several air pollutants measurements surveys at dif-ferent stages were performed by means of a proper “environ-mental” measuring station placed along the side of the experi-mental roadway (figure 8.3). In particular, the measuring station was equipped with three different analyzers that allowed the concentrations of some of the main air pollutants (PM10, NO, NO2, NOx and CO) to be recorded during time. It was also nec-essary to provide the measuring booth with a suction pump to take the air sample to be analyzed, an air conditioner to keep the temperature low and a computer with a modem to transfer
Advanced characterization of photocatalytic materials – 8. Testing on TiO2 materials
211
the data recorded. The air sampler and the modem antenna were placed on the top of the booth (figure 8.3).
Figure 8.3: Environmental measuring station
The measuring surveys concerned both road sub-sections and were performed before and after the realization of the trial sec-tion (figure 8.4). It is appropriate to underline that the measuring period indicated with the symbol in the upper part of the figure refer to the condition before the laying down of the photocata-lytic materials; while the symbols indicated below the road sec-tion refer to the condition after the realization of the trial stretches at different stages. In particular, the first measuring campaign acted as reference value for the subsequent surveys of both road sections and it was performed positioning the measuring station along the side of the road section covered with the photocatalytic cement mortar. In this sense, it is impor-
Advanced Characterization of Innovative Environmentally Friendly Bituminous Mixtures
212
tant to note that the two different locations were quite different (the road section covered the cement mortar had the building facades closer than the other) affecting in part the experimental results.
spray spray productproduct
cement cement mortarmortar
NORTHSOUTH
From 13/12/06 to 19/12/06
From 08/05/07 to 22/05/07
Measuring periods
From 23/05/07 to 31/05/07
From 27/11/07 to 12/12/07
From 12/12/07 to 18/12/07From 20/11/06 to 27/11/06
From 11/10/06 to 15/10/06 From 20/12/06 to 12/01/07
Figure 8.4: Air pollution measurements survey
The data analysis was quite complex. In fact, it is well known that air pollution level strongly depends on atmospheric condi-tions at that moment (temperature, wind, rain, etc.). Thus, it should be not significant comparing air pollution level in the same location at different periods. As a consequence, for a better evaluation of photocatalytic properties of materials studied, variations in air pollution level at different periods with respect to the first reference period were compared with those obtained for the same periods at a near measurement location belonging to the same road.
Figure 8.5: Web-page with data of the control station
Advanced characterization of photocatalytic materials – 8. Testing on TiO2 materials
213
This control section was located about 1 km to the south of the tested sections along the side of a traditional bituminous wear-ing course subjected to the same traffic and quite the same at-mospheric conditions. This control section was equipped with a fixed measuring station and the data recorded were free-available on the website of the Provincia di Ascoli Piceno (figure 8.5). If some values were not available on the website, those measuring days were excluded from the analysis. Data recorded at the tested sections were summarized into minimum, maximum and mean values for each measuring day in such a way to be comparable with those obtained from the control measuring station. Moreover, the integral value was calculated from these values for each measuring period and for each pollutant monitored. This integral value corresponded to the area subtended to the curve obtained plotting air pollutant level (minimum, maximum of mean value) versus measuring day (figure 8.6). In such a way, it was possible to evaluate percentage variations of each integral value with respect to that obtained for the reference pe-riod. It is important to underline that as each measuring period had different length, so each integral value was normalized with respect to the effective measuring days leading to a sort of av-erage daily value.
0,00
1,00
2,00
3,00
4,00
5,00
6,00
08/0
5/20
07
09/0
5/20
07
10/0
5/20
07
11/0
5/20
07
12/0
5/20
07
13/0
5/20
07
14/0
5/20
07
15/0
5/20
07
16/0
5/20
07
17/0
5/20
07
18/0
5/20
07
19/0
5/20
07
20/0
5/20
07
21/0
5/20
07
22/0
5/20
07
23/0
5/20
07
Measuring day
CO m
axim
um le
vel (
μg/
m3 ) pollutant level
integral value
Figure 8.6: Example of data analysis
8.3.2 Laboratory Evaluation of De-polluting Properties From relevant literature it becomes clear that the degradation of nitrogen oxides delivers a suitable model to assess the ability of
Advanced Characterization of Innovative Environmentally Friendly Bituminous Mixtures
214
materials for air purification. NO2 is, among nitrogen oxides, the one having the highest toxicological impact and it stands the reason that authorities having the task of enforcing limitations on NOx in the environment often refer to NO2 as the target spe-cies. In this contest, the laboratory experimental research carried out within this thesis consisted of an innovative test protocol able to assess the capabilities of the materials studied into the degra-dation of the nitrogen dioxide NO2. These tests were directly performed at the laboratory of the Institute of Air Pollution (I.I.A.) of the Italian National Research Council. Samples subjected to this kind of evaluation was 150 mm di-ameter cylindrical specimens (without treatment, treated with cement mortar and treated with spray product) taken from 40 mm thick slabs. These slabs were prepared in laboratory by means of the Roller Compactor [39] with bituminous material taken in situ during the construction of the trial section. More-over, the surface of these slabs was treated in situ with the photocatalytic products effectively employed on the road. For what concerns the test protocol, the cylindrical specimen was placed into a special parallelepiped shape polyethylene case having a quartz sheet on its surface (flat denuder). Within this device a mix of air and pollutant at a known rate passed at a speed such as to have a laminar flow. This fact allowed known equations of fluid dynamics to be applied in order to evaluate variations of pollutant concentration. Furthermore, dur-ing the test it is possible to irradiate the surface of the sample with UV light through a proper glass lid. The calculation of the variation of pollutant concentration that passed through the flat denuder was possible thanks to the measurements of the pol-lutant concentration entering and leaving the denuder through proper chemiluminescence analyzers. Moreover, it was possible to verify the possible formation of secondary products of the oxidation reaction such as nitrous acid. All tests were carried out at 40% relative humidity and at three different air flow (0.5, 1.0 and 1.5 l/min).
Advanced characterization of photocatalytic materials – 9. De-pollution properties
215
9. De-pollution properties In this section the environmental issues concerning the possible reduction of air pollutants concentration through the employ-ment of TiO2-based photocatalytic products specifically imple-mented for road surfaces are presented. As already introduced, the evaluation of the de-polluting properties of materials studied was performed by means of in situ and laboratory tests. Results presented in this section allowed formulating some first consid-erations about the air purification capabilities of the two materi-als investigated. 9.1 IN SITU RESULTS This paragraph shows the main part of the investigation about the de-polluting abilities of photocatalytic materials studied. To this goal, repeated “environmental” measurements were carried out through a proper measuring station according to what ex-plained in §8.3.1. In particular, the in situ experimental program provided for 88 days of measurements for a period of about 15 months taking into account 5 different air pollutants. Results ob-tained were analyzed through the comparison with those re-corded by a control measuring station situated not far from the TiO2-treated surfaces. In the following paragraphs results obtained for the two materi-als studied are illustrated and analyzed in terms of both abso-lute and integral values. 9.1.1 Photocatalytic Cement Mortar As already said, this material should be able to combine the oxidizing properties of TiO2 versus the main air pollutants with the properties of a basic material (cement) able to fix on the surface both the reagents and the products of the photo-oxidation process.
Advanced Characterization of Innovative Environmentally Friendly Bituminous Mixtures
216
Observing the results obtained, it is possible to note that the TiO2-based photocatalytic cement mortar did not demonstrate to reduce the particulates (PM10) concentration (figure 9.1). This experimental result was confirmed also by the integral values obtained from the mean values of the whole periods weighted with respect of the different lengths of those periods (figure 9.2).
PM10 - MEAN VALUES(cement mortar)
-60
-40
-20
0
20
40
1 Month (1) 1 Month (2) 6 Months 12 Months
Varia
tion
(%)
control sectionstudied section
Figure 9.1: Mean PM10 concentration – cement mortar
PM10 - INTEGRAL OF MEAN VALUES
(cement mortar)
-60
-40
-20
0
20
40
1 Month (1) 1 Month (2) 6 Months 12 Months
Varia
tion
(%)
control sectionstudied section
Figure 9.2: Integral of mean PM10 – cement mortar
In fact, it is possible to observe that in the studied section there was not higher decrease or lower increase in PM10 concentra-tion than the control section. These results confirmed what ex-pected because, nowadays, the possible chemical properties of TiO2 in particulates oxidation are still uncertain and under study. A hypothesis formulated is based on the possibility that particu-lates could be attracted on the surface by the excited TiO2 and subsequently degrade in contact with free radicals [91]. How-
Advanced characterization of photocatalytic materials – 9. De-pollution properties
217
ever, the international literature is poor in studies and theories about this issue with rare exceptions [71]. On the other hand, the mechanisms that allow the titanium diox-ide to be a powerful oxidant of the nitrogen oxides are well-known. Especially in urban surroundings, the increasing prob-lem by evolved nitrogen oxides coming from combustion proc-esses is due to the advanced industrialization more and more important. Following the latest reports on world climate the greenhouse effect is much more influenced by nitrogen monox-ide than by other pollutants, and the toxicity of nitrogen monox-ide and nitrogen dioxide is well known. The photocatalytic effect offers the opportunity to reduce the nitrogen oxides by oxidizing them into nitrate, easy washed away by rain.
Figure 9.4: Maximum NOx concentration – cement mortar
In spite of the encouraging expectations, the experimental evaluation of oxidizing capabilities of the photocatalytic cement
Advanced Characterization of Innovative Environmentally Friendly Bituminous Mixtures
218
mortar versus nitrogen oxides showed not positive results. In fact, observing the variations of minimum (figure 9.3), maximum (figure 9.4) and mean value (figure 9.5) for the different monitor-ing periods, it is possible to note that it was recorded a better air quality only with regard to the first monitoring period and only concerning maximum and mean values.
NOx - MEAN VALUES(cement mortar)
-100
-50
0
50
100
150
200
1 Month (2) 6 Months 12 Months
Var
iatio
n (%
)
control sectionstudied section
Figure 9.5: Mean NOx concentration – cement mortar
It should be possible that the photocatalytic cement mortar was effective only versus the peaks of air pollutant concentration af-fecting also the mean values. Moreover, this air purification ca-pability seemed to be effective only during the first period of service life of the pavement when the surface was not dis-tressed and not saturated by the photo-oxidation products or other contaminants.
NOx - INTEGRAL OF MINIMUM VALUES(cement mortar)
-100-80-60-40-20
020406080
1 Month (2) 6 Months 12 Months
Varia
tion
(%)
control sectionstudied section
Figure 9.6: Integral of minimum NOx – cement mortar
Advanced characterization of photocatalytic materials – 9. De-pollution properties
219
These considerations seemed to agree with what explained in the chapter 7. In fact, it was demonstrated that the efficiency in pollutants degradation is proportional to the pollutant concentra-tion and it is necessary a regular rinsing with rain to wash away the reaction products and restore the photo-activity. This trend was confirmed if results were analyzed in terms of NOx integral values. In fact, figures 9.6, 9.7 and 9.8 depict an analogous behaviour when benefits were recorded only for the first survey period, about a month after the construction of the trial section.
NOx - INTEGRAL OF MAXIMUM VALUES(cement mortar)
-100-80-60-40-20
020406080
1 Month (2) 6 Months 12 Months
Varia
tion
(%)
control sectionstudied section
Figure 9.7: Integral of maximum NOx – cement mortar
NOx - INTEGRAL OF MEAN VALUES
(cement mortar)
-100-80-60-40-20
020406080
1 Month (2) 6 Months 12 Months
Varia
tion
(%)
control sectionstudied section
Figure 9.8: Integral of mean NOx – cement mortar
Similar considerations could be done for the two main compo-nents of the nitrogen oxides, i.e. the nitrogen monoxide NO and the nitrogen dioxide NO2, separately monitored within the ex-perimental program performed.
Advanced Characterization of Innovative Environmentally Friendly Bituminous Mixtures
Figure 9.10: Maximum NO2 concentration – cement mortar
NO2 - MEAN VALUES
(cement mortar)
-120
-80
-40
0
40
80
120
160
200
1 Month (2) 6 Months 12 Months
Varia
tion
(%)
control sectionstudied section
Figure 9.11: Mean NO2 concentration – cement mortar
In particular, for what concerns the NO2, the same situations al-ready analyzed for NOx were founded. In fact, better results than the control section were recorded only during the first monitoring period and only regarding maximum and mean pol-
Advanced characterization of photocatalytic materials – 9. De-pollution properties
221
lutant concentrations considering both absolute (figures 9.9, 9.10 and 9.11) and integral (9.12, 9.13 and 9.14) values.
NO2 - INTEGRAL OF MINIMUM VALUES
(cement mortar)
-100-80-60-40-20
020406080
100120
1 Month (2) 6 Months 12 Months
Varia
tion
(%)
control sectionstudied section
Figure 9.12: Integral of minimum NO2 – cement mortar
NO2 - INTEGRAL OF MAXIMUM VALUES
(cement mortar)
-100-80-60-40-20
020406080
100120
1 Month (2) 6 Months 12 Months
Varia
tion
(%)
control sectionstudied section
Figure 9.13: Integral of maximum NO2 – cement mortar
NO2 - INTEGRAL OF MEAN VALUES
(cement mortar)
-100-80-60-40-20
020406080
100120
1 Month (2) 6 Months 12 Months
Var
iatio
n (%
)
control sectionstudied section
Figure 9.14: Integral of mean NO2 – cement mortar
Advanced Characterization of Innovative Environmentally Friendly Bituminous Mixtures
222
A little difference was denoted from the analysis of NO concen-tration. In fact, the positive effects during the first monitoring pe-riod interested also the minimum value (figures 9.15, 9.16 and 9.17). Moreover, environmental benefits concerning the mini-mum air pollutant concentrations were recorded also 12 months after the realization of the trial section. However, it was not pos-sible to find the same benefits when the integral values were analyzed. As a consequence, they can not be considered real environmental benefits also because it is much more important for human health to reduce peaks of air pollution affecting also mean levels of pollutants.
NO - MINIMUM VALUES(cement mortar)
-120
-60
0
60
120
180
240
300
1 Month (2) 6 Months 12 Months
Varia
tion
(%)
control sectionstudied section
Figure 9.15: Minimum NO concentration – cement mortar
NO - MAXIMUM VALUES
(cement mortar)
-120
-60
0
60
120
180
240
300
1 Month (2) 6 Months 12 Months
Varia
tion
(%)
control sectionstudied section
Figure 9.16: Maximum NO concentration – cement mortar
Advanced characterization of photocatalytic materials – 9. De-pollution properties
223
NO - MEAN VALUES(cement mortar)
-120
-60
0
60
120
180
240
300
1 Month (2) 6 Months 12 Months
Varia
tion
(%)
control sectionstudied section
Figure 9.17: Mean NO concentration – cement mortar
The same considerations could be drawn from the analysis of variations of NO integral values (figures 9.18, 9.19 and 9.20).
NO - INTEGRAL OF MINIMUM VALUES(cement mortar)
-80
-40
0
40
80
120
160
200
1 Month (2) 6 Months 12 Months
Var
iatio
n (%
)
control sectionstudied section
Figure 9.18: Integral of minimum NO – cement mortar
NO - INTEGRAL OF MAXIMUM VALUES
(cement mortar)
-80
-40
0
40
80
120
160
200
1 Month (2) 6 Months 12 Months
Varia
tion
(%)
control sectionstudied section
Figure 9.19: Integral of maximum NO – cement mortar
Advanced Characterization of Innovative Environmentally Friendly Bituminous Mixtures
224
NO - INTEGRAL OF MEAN VALUES(cement mortar)
-80
-40
0
40
80
120
160
200
1 Month (2) 6 Months 12 Months
Varia
tion
(%)
control sectionstudied section
Figure 9.20: Integral of mean NO – cement mortar
Results presented for NO, NO2 and NOx air pollutants demon-strated that the oxidation process of nitrogen oxides was stud-ied many times, but still not understood in detail, e.g. the forma-tion of intermediates has to be discussed. The analysis of in situ results obtained from the de-pollution characterization of the photocatalytic cement mortar ends with the evaluation of oxidizing properties of this material versus carbon monoxide (CO) that is mainly produced by vehicles in particular in areas congested by traffic. In this case, it seems possible to state that the photocatalytic cement mortar tested brought a remarkable benefit in the re-duction of CO concentration both in the short and in the middle period of service (figures 9.21, 9.22 and 9.23).
CO - MINIMUM VALUES(cement mortar)
-120-60
060
120180240300360420
1 Month (2) 6 Months 12 Months
Varia
tion
(%)
control sectionstudied section
Figure 9.21: Minimum CO concentration – cement mortar
Advanced characterization of photocatalytic materials – 9. De-pollution properties
225
CO - MAXIMUM VALUES(cement mortar)
-120-60
060
120180240300360420
1 Month (2) 6 Months 12 Months
Varia
tion
(%)
control sectionstudied section
Figure 9.22: Maximum CO concentration – cement mortar
CO - MEAN VALUES
(cement mortar)
-120-60
060
120180240300360420
1 Month (2) 6 Months 12 Months
Varia
tion
(%)
control sectionstudied section
Figure 9.23: Mean CO concentration – cement mortar
Unfortunately, the data of the control measuring station refer-ring to the last period of survey are not available making impos-sible to verify if the benefits recorded were present also 12 moths after the realization of the trial section.
CO - INTEGRALOF MINIMUM VALUES(cement mortar)
-100
0
100
200
300
400
500
1 Month (2) 6 Months 12 Months
Varia
tion
(%)
control sectionstudied section
Figure 9.24: Integral of minimum CO – cement mortar
Advanced Characterization of Innovative Environmentally Friendly Bituminous Mixtures
226
What evidenced by the analysis of absolute values recorded during the measurement of CO concentration in air were con-firmed also by the respective integral values (figures 9.24, 9.25 and 9.26).
CO - INTEGRAL OF MAXIMUM VALUES(cement mortar)
-100
0
100
200
300
400
500
1 Month (2) 6 Months 12 Months
Varia
tion
(%)
control sectionstudied section
Figure 9.25: Integral of maximum CO – cement mortar
CO - INTEGRAL OF MEAN VALUES
(cement mortar)
-100
0
100
200
300
400
500
1 Month (2) 6 Months 12 Months
Varia
tion
(%)
control sectionstudied section
Figure 9.26: Integral of mean CO – cement mortar
9.1.2 Photocatalytic Spray Product Similarly to what done in the previous paragraph, in this section results obtained from the environmental measurements per-formed by the road section treated with the TiO2-based spray product are presented. Also in this case, data collected were compared, in terms of percentage variations of pollutants con-centration, with those recorded by the environmental measuring station of the Provincia di Ascoli Piceno. However, it has to be kept in mind that the reference pre-treatment pollutants level was recorded by the section subsequently covered with the photocatalytic cement mortar (§8.3.1). As already mentioned,
Advanced characterization of photocatalytic materials – 9. De-pollution properties
227
this reference road section had building facades closer than that treated with the photocatalytic spray product. Thus, results ob-tained should be probably worse than those effectively calcu-lated and analyzed in the following.
PM10 - MEAN VALUES(spray product)
-60
-40
-20
0
20
40
1 Month 6 Months 12 Months
Var
iatio
n (%
)
control sectionstudied section
Figure 9.27: Mean PM10 concentration – spray product
PM10 - INTEGRAL OF MEAN VALUES
(spray product)
-60
-40
-20
0
20
40
1 Month 6 Months 12 Months
Varia
tion
(%)
control sectionstudied section
Figure 9.28: Integral of mean PM10 – spray product
Similarly to what found for the TiO2-based cement mortar, the photocatalytic spray product seemed to be not able to reduce PM10 concentration (figures 9.27 and 9.28). Analogous considerations could be formulated referring to the variations showed by nitrogen oxides during the different meas-uring periods (figures 9.29, 9.30 and 9.31). Again, the little im-provement of air quality obtained in the short period referring to the maximum and mean NOx concentrations was confirmed also by the integral values (9.32, 9.33 and 9.34).
Advanced Characterization of Innovative Environmentally Friendly Bituminous Mixtures
Figure 9.30: Maximum NOx concentration – spray product
NOx - MEAN VALUES
(spray product)
-100
-50
0
50
100
150
200
1 Month 6 Months 12 Months
Varia
tion
(%)
control sectionstudied section
Figure 9.31: Mean NOx concentration – spray product
Advanced characterization of photocatalytic materials – 9. De-pollution properties
229
NOx - INTEGRAL OF MINIMUM VALUES(spray product)
-100-80-60-40-20
020406080
1 Month 6 Months 12 Months
Varia
tion
(%)
control sectionstudied section
Figure 9.32: Integral of minimum NOx – spray product
NOx - INTEGRAL OF MAXIMUM VALUES
(spray product)
-100-80-60-40-20
020406080
1 Month 6 Months 12 Months
Varia
tion
(%)
control sectionstudied section
Figure 9.33: Integral of maximum NOx – spray product
NOx - INTEGRAL OF MEAN VALUES
(spray product)
-100-80-60-40-20
020406080
1 Month 6 Months 12 Months
Varia
tion
(%)
control sectionstudied section
Figure 9.34: Integral of mean NOx – spray product
The same evaluations could be repeated also referring to data obtained from the analysis of nitrogen dioxide NO2 concentra-tions during the different survey periods.
Advanced Characterization of Innovative Environmentally Friendly Bituminous Mixtures
Figure 9.36: Maximum NO2 concentration – spray product
NO2 - MEAN VALUES
(spray product)
-120
-80
-40
0
40
80
120
160
200
1 Month 6 Months 12 Months
Varia
tion
(%)
control sectionstudied section
Figure 9.37: Mean NO2 concentration – spray product
The only exception to this trend seemed to be represented by the minimum absolute value recorded six months after the con-struction of the trial section (figure 9.35). However, this value was not confirmed either from the respective maximum and
Advanced characterization of photocatalytic materials – 9. De-pollution properties
231
mean concentrations (figures 9.36 and 9.37) or from the varia-tion of the integral value of minimum concentration calculated for the same measuring period (figure 9.38). As a consequence, this odd result could be due to a particular extemporary condi-tion and not to a definite general trend. Again, taking into account the integral values, the beneficial ef-fect in the short period was not limited to the maximum and mean values but it reached also the minimum concentrations (figures 9.38, 9.39 and 9.40).
NO2 - INTEGRAL OF MINIMUM VALUES(spray product)
-100-80-60-40-20
020406080
100120
1 Month 6 Months 12 Months
Varia
tion
(%)
control sectionstudied section
Figure 9.38: Integral of minimum NO2 – spray product
NO2 - INTEGRAL OF MAXIMUM VALUES
(spray product)
-100-80-60-40-20
020406080
100120
1 Month 6 Months 12 Months
Varia
tion
(%)
control sectionstudied section
Figure 9.39: Integral of maximum NO2 – spray product
Advanced Characterization of Innovative Environmentally Friendly Bituminous Mixtures
232
NO2 - INTEGRAL OF MEAN VALUES(spray product)
-100-80-60-40-20
020406080
100120
1 Month 6 Months 12 Months
Varia
tion
(%)
control sectionstudied section
Figure 9.40: Integral of mean NO2 – spray product
More conflicting results came from the analysis of percentage variations of NO concentrations. In fact, observing the absolute values recorded during the different measuring periods (figures 9.41, 9.42 and 9.43), it is possible to note that the maximum values seemed to be worse for each period considered while the mean values appeared slightly positive with a slender im-provement also 12 months after the realization of the trial sec-tion. On the other hand, the minimum values showed to be positive only on the short period. This situation appeared more uniform when the integrals calcu-lated from the minimum, maximum and mean values in the dif-ferent periods were considered (figures 9.44, 9.45 and 9.46). In fact, it is possible to note that an improvement of air quality was recorded only for the first survey period for all indicators con-sidered.
NO - MINIMUM VALUES(spray product)
-120
-60
0
60
120
180
240
300
1 Month 6 Months 12 Months
Varia
tion
(%)
control sectionstudied section
Figure 9.41: Minimum NO concentration – spray product
Advanced characterization of photocatalytic materials – 9. De-pollution properties
233
NO - MAXIMUM VALUES(spray product)
-120
-60
0
60
120
180
240
300
1 Month 6 Months 12 Months
Varia
tion
(%)
control sectionstudied section
Figure 9.42: Maximum NO concentration – spray product
NO - MEAN VALUES
(spray product)
-120
-60
0
60
120
180
240
300
1 Month 6 Months 12 Months
Var
iatio
n (%
)
control sectionstudied section
Figure 9.43: Mean NO concentration – spray product
NO - INTEGRAL OF MINIMUM VALUES
(spray product)
-80
-40
0
40
80
120
160
200
1 Month 6 Months 12 Months
Varia
tion
(%)
control sectionstudied section
Figure 9.44: Integral of minimum NO – spray product
Advanced Characterization of Innovative Environmentally Friendly Bituminous Mixtures
234
NO - INTEGRAL OF MAXIMUM VALUES(spray product)
-80
-40
0
40
80
120
160
200
1 Month 6 Months 12 Months
Varia
tion
(%)
control sectionstudied section
Figure 9.45: Integral of maximum NO – spray product
The only exception to this trend was the integral value referring to the mean pollutant concentrations recorded about 12 months after the construction of the experimental road (figure 9.46). In fact, in that situation an improvement of environmental condi-tions was recorded. However, this value was not coupled with a reduction either of integral of minimum values or of integral of maximum values being an isolated reply within a general con-test of failure of expected de-pollution performance.
NO - INTEGRAL OF MEAN VALUES
(spray product)
-80
-40
0
40
80
120
160
200
1 Month 6 Months 12 Months
Varia
tion
(%)
control sectionstudied section
Figure 9.46: Integral of mean NO – spray product
Finally, observing the results obtained with regard of carbon monoxide CO concentrations it was possible to note very posi-tive replies confirming what previously demonstrated by the photocatalytic cement mortar. In fact, data showed a remark-able improvement in air quality both in the short and in the long period with respect to absolute minimum, maximum and mean CO concentrations (figures 9.47, 9.48 and 9.49).
Advanced characterization of photocatalytic materials – 9. De-pollution properties
235
CO - MINIMUM VALUES(spray product)
-120-60
060
120180240300360420
1 Month 6 Months 12 Months
Varia
tion
(%)
control sectionstudied section
Figure 9.47: Minimum CO concentration – spray product
CO - MAXIMUM VALUES
(spray product)
-120-60
060
120180240300360420
1 Month 6 Months 12 Months
Varia
tion
(%)
control sectionstudied section
Figure 9.48: Maximum CO concentration – spray product
CO - MEAN VALUES
(spray product)
-120-60
060
120180240300360420
1 Month 6 Months 12 Months
Varia
tion
(%)
control sectionstudied section
Figure 9.49: Mean CO concentration – spray product
The trend emerged from the absolute values was further con-firmed by results obtained calculating the integral values for the different measuring periods (figures 9.50, 9.51 and 9.52). Moreover, in this case it was possible to expand the evaluation
Advanced Characterization of Innovative Environmentally Friendly Bituminous Mixtures
236
also with the data recorded 12 months after the realization of the trial section, except for the mean values. The results ob-tained confirmed the very good replies showed in all other cases.
CO - INTEGRAL OF MINIMUM VALUES(spray product)
-100
0
100
200
300
400
500
1 Month 6 Months 12 Months
Varia
tion
(%)
control sectionstudied section
Figure 9.50: Integral of minimum CO – spray product
CO - INTEGRAL OF MAXIMUM VALUES
(spray product)
-100
0
100
200
300
400
500
1 Month 6 Months 12 Months
Varia
tion
(%)
control sectionstudied section
Figure 9.51: Integral of maximum CO – spray product
CO - INTEGRAL OF MEAN VALUES
(spray product)
-100
0
100
200
300
400
500
1 Month 6 Months 12 Months
Varia
tion
(%)
control sectionstudied section
Figure 9.52: Integral of mean CO – spray product
Advanced characterization of photocatalytic materials – 9. De-pollution properties
237
9.2 LABORATORY RESULTS Results obtained from proper laboratory analysis carried out by the Air Pollution Institute of the Italian National Research Centre in order to evaluate the photocatalytic activity of the materials studied are presented in this section. These innovative labora-tory tests were carried out at 40% of relative humidity and with three different air flows and interested samples treated both with cement mortar and spray product. A further sample manu-factured with the same bituminous material and not treated with photocatalytic products was subjected to the same study in or-der to obtain a reference value. Figure 9.53 shows data obtained with the reference asphalt specimen subjected to an air flow of 0.5 l/min. These results have to be compared with those obtained on the TiO2-treated samples subjected to the same test conditions and showed in the following paragraphs.
Campione di asfalto senza Malta Fotocatalitica 40% RH
Figure 9.53: Laboratory test – reference sample (0.5 l/min)
Observing the results plotted in figure 9.53 it is possible to not that the reference sample not treated with titanium dioxide showed a remarkable reduction of NO2 concentrations leaving the flat denuder, i.e. the box where the specimen was posi-tioned. This reduction could be quantified in about 74% of the entering pollutant level. This fact was probably due to the high air void content of specimen tested. Moreover, it is important to underline the absolute indifference of the system to the pres-ence of UV light because of the absence of photocatalytic mate-rial. What changed with UV light was the NO concentration that
Advanced Characterization of Innovative Environmentally Friendly Bituminous Mixtures
238
increased when the lamp was switched on and reached the previous level when the UV irradiation ended. Figures 9.54 and 9.55 showed the laboratory results obtained subjecting the reference specimen to the same kind of test with an air flow of 1.0 an 1.5 l/min respectively. It is possible to note that the NO2 reduction rate remarkably decreased consolidating its value in about 10% probably owing to the increased air tur-bulence.
Asfalto senza Malta Fotocatalitica 40%RH
1,0 l/min
0
20
40
60
80
100
120
140
160
180
04/06/200711.02
04/06/200711.31
04/06/200712.00
04/06/200712.28
04/06/200712.57
04/06/200713.26
04/06/200713.55
04/06/200714.24
04/06/200714.52
04/06/200715.21
Data e Ora
Can
cent
razi
one
NO
2 (pp
b)
0
20
40
60
80
100
120
140
160
180
Can
cent
razi
one
NO
(ppb
)
NO2NO
InseritoCampione Asfalto
ToltoCampione Asfalto
LampadaUV
Reference asphalt specimen40% RH1,0 l/min
Date and Time
NO
2co
ncen
tratio
n (p
pb) N
O concentration (ppb)
Sample connected Sample cut off
UV light
Figure 9.54: Laboratory test – reference sample (1.0 l/min)
Campione di asfalto senza Malta Fotocatalitica
40% RH 1,5 L/min
0
20
40
60
80
100
120
04/03/19799.36
04/03/197914.24
04/03/197919.12
04/04/19790.00
04/04/19794.48
04/04/19799.36
04/04/197914.24
04/04/197919.12
04/05/19790.00
Data e ora
Con
cent
razi
one
NO
2 (pp
b)
0
5
10
15
20
25
30
35
40
45
50
Con
cetr
azio
ne N
O (p
pb)
NO2NO
InseritoCampione di Asfalto
ToltoCampione di Asfalto
Lampada UV
Reference asphalt specimen40% RH1,5 l/min
Date and Time
NO
2co
ncen
tratio
n (p
pb) N
O concentration (ppb)
Sample connected
Sample cut off
UV light
Campione di asfalto senza Malta Fotocatalitica40% RH
1,5 L/min
0
20
40
60
80
100
120
04/03/19799.36
04/03/197914.24
04/03/197919.12
04/04/19790.00
04/04/19794.48
04/04/19799.36
04/04/197914.24
04/04/197919.12
04/05/19790.00
Data e ora
Con
cent
razi
one
NO
2 (pp
b)
0
5
10
15
20
25
30
35
40
45
50
Con
cetr
azio
ne N
O (p
pb)
NO2NO
InseritoCampione di Asfalto
ToltoCampione di Asfalto
Lampada UV
Reference asphalt specimen40% RH1,5 l/min
Date and Time
NO
2co
ncen
tratio
n (p
pb) N
O concentration (ppb)
Sample connected
Sample cut off
UV light
Figure 9.55: Laboratory test – reference sample (1.5 l/min)
9.2.1 Photocatalytic Cement Mortar Results presented in this section refer to a bituminous sample manufactured with the same porous asphalt and superficially treated with the cement mortar containing titanium dioxide.
Advanced characterization of photocatalytic materials – 9. De-pollution properties
239
Observing the experimental results obtained from the test car-ried out with an air flow of 0.5 l/min (figure 9.56) it is possible to note that also without UV light there was a reduction of NO2 concentration of about 47%. When the UV lamp was switched on, this reduction further increased with a percentage reduction due only to the photocatalytic reactivity of about 48%.
Asfalto con Malta Fotocatalitica Non Usurata 40% RH
Figure 9.56: Laboratory test – cement mortar (0.5 l/min)
However, it is right to highlight that an increase in nitrogen monoxide NO and nitrous acid HONO was recorded with the reduction of NO2 concentration. Once the UV light was switched off, these substances turned back to NO2 that came back to its previous level. This fact seemed to suggest that, taking into ac-count the global level of nitrogen oxides, the presence of the photocatalytic cement mortar subjected to UV irradiation gave a limited benefit.
Asfalto con Malta Fotocatalitica Non Usurata 40% RH
Figure 9.57: Laboratory test – cement mortar (1.0 l/min)
Advanced Characterization of Innovative Environmentally Friendly Bituminous Mixtures
240
Similarly to what observed above, if the air flow increased (fig-ures 9.57 and 9.58) the reductions of air pollutants decreased up to about 10÷20% without UV light. Further reductions of NO2 of about 20÷30% were demonstrated with UV irradiation. How-ever, also in this case, an increase in NO and HONO levels was recorded.
Asfalto con Malta Fotocatalitica Non Usurata 40% RH
1,5 L/min
0
20
40
60
80
100
120
140
160
180
03/16/200714.52
03/16/200715.21
03/16/200715.50
03/16/200716.19
03/16/200716.48
03/16/200717.16
03/16/200717.45
03/16/200718.14
03/16/200718.43
03/16/200719.12
Data e Ora
Con
cent
razi
one
NO
2 (pp
b)
0
100
200
300
400
500
600
Con
cent
razi
one
NO
(ppb
)
NO2NO
InseritoCampione
Asfalto
ToltoCampione
Asfalto
Denuder Carbonato
LampadaUV
Cement mortar40% RH1,5 l/min
Date and Time
NO
2co
ncen
tratio
n (p
pb) N
O concentration (ppb)
Sample
connected
Sample
cut off
UV light
Carbonate Denuder
Figure 9.58: Laboratory test – cement mortar (1.5 l/min)
9.2.2 Photocatalytic Spray Product Analyzing the results obtained when the bituminous sample treated with the photocatalytic spray product was subjected to this specific laboratory test at 0.5 l/min of flow rate it is possible to note a 30% of NO2 reduction without UV light (figure 9.59).
Figure 9.59: Laboratory test – spray product (0.5 l/min)
Advanced characterization of photocatalytic materials – 9. De-pollution properties
241
Moreover, when the lamp was switched on, the pollutant reduc-tion increased up to 43% thanks to a further reduction of 60 ppb of NO2. Taking into account the other test configurations, one can ob-serve that the NO2 concentration decreased when the flat de-nuder containing the tested specimen treated with the photo-catalytic material was connected. This pollutant reduction grew wider when the surface was irradiated with UV rays (figures 9.60 and 9.61).
Malta trattata con Spray Fotocatalitico 1,0 L/min
40%RH
0
20
40
60
80
100
120
140
160
180
04/12/200714.24
04/12/200716.48
04/12/200719.12
04/12/200721.36
04/13/20070.00
04/13/20072.24
04/13/20074.48
04/13/20077.12
04/13/20079.36
04/13/200712.00
04/13/200714.24
04/13/200716.48
Data e Ora
Con
cetr
azio
ne N
O2 (
ppb)
0
10
20
30
40
50
60
70
80
90
100
Con
cent
razi
one
NO
(ppb
)
NO2NO
CollegatoCampione Asfalto
ScollegatoCampione Asfalto
Lampada UV
Spray product40% RH1,0 l/min
Date and Time
NO
2co
ncen
tratio
n (p
pb) N
O concentration (ppb)
Sample connected Sample cut off
UV light
Figure 9.60: Laboratory test – spray product (1.0 l/min)
Malta trattata con Spray Fotocatalitico
1,5 L/min 40%RH
0
20
40
60
80
100
120
04/13/200713.26
04/13/200713.55
04/13/200714.24
04/13/200714.52
04/13/200715.21
04/13/200715.50
04/13/200716.19
04/13/200716.48
04/13/200717.16
04/13/200717.45
04/13/200718.14
Data e Ora
Con
cetr
azio
ne N
O2 (
ppb)
0
10
20
30
40
50
60
70
80
90
100
Con
cent
razi
one
NO
(ppb
)
NO2NO
CollegatoCampione Asfalto
ScollegatoCampione Asfalto
Lampada UV
Spray product40% RH1,5 l/min
Date and Time
NO
2co
ncen
tratio
n (p
pb) N
O concentration (ppb)
Sample connectedSample cut off
UV light
Malta trattata con Spray Fotocatalitico 1,5 L/min
40%RH
0
20
40
60
80
100
120
04/13/200713.26
04/13/200713.55
04/13/200714.24
04/13/200714.52
04/13/200715.21
04/13/200715.50
04/13/200716.19
04/13/200716.48
04/13/200717.16
04/13/200717.45
04/13/200718.14
Data e Ora
Con
cetr
azio
ne N
O2 (
ppb)
0
10
20
30
40
50
60
70
80
90
100
Con
cent
razi
one
NO
(ppb
)
NO2NO
CollegatoCampione Asfalto
ScollegatoCampione Asfalto
Lampada UV
Spray product40% RH1,5 l/min
Date and Time
NO
2co
ncen
tratio
n (p
pb) N
O concentration (ppb)
Sample connectedSample cut off
UV light
Figure 9.61: Laboratory test – spray product (1.5 l/min)
However, it is possible to observe that these air pollutant reduc-tions were not drastic. In the case of 1.5 l/min air flow, for in-stance, the pure photocatalytic reaction produced a decrease of only 3÷4 ppb of NO2, corresponding to about the 5% of the ini-tial gas level. Moreover, it is important to underline that, again,
Advanced Characterization of Innovative Environmentally Friendly Bituminous Mixtures
242
a part of NO2 was converted into NO and HONO during the UV light irradiation, likewise to what recorded for the sample treated with the cement mortar.
Conclusions
243
Conclusions This thesis focused on some environmental issues related to road infrastructures. In particular, roads have a negative impact on environment mainly because of acoustic and atmospheric pollution caused by traffic travelling on them, lowering the stan-dard of living of millions of people. In this context, innovative so-lutions for road pavement environmentally friendly materials able to reduce rolling noise or air pollution were studied. This work mainly consisted of the evaluation of noise or air pol-lution reduction capabilities by several bituminous materials for road wearing courses. All materials selected were also me-chanically characterized because they can be successfully con-sidered as long as they satisfy transportation agency require-ments in terms of safety and durability. Subsequently, trial sec-tions in different Italian urban roads were laid down allowing acoustic, photocatalytic and friction properties to be evaluated. Moreover, materials taken during the construction of the trial sections allowed mechanical and functional (anti-noise and de-polluting) properties to be verified also by laboratory test proto-cols. In particular, the materials studied were: i) dense graded bitu-minous mixture containing expanded clay (EC); ii) porous as-phalt concrete (PA); iii) Splittmastixasphalt (SMA); iv) cold mi-cro-surfacing with dry addition of crumb rubber coming from re-claimed tires (SSCR); v) porous asphalt partially filled with a photocatalytic cement mortar containing titanium dioxide (PM); vi) thin open graded Hot Mix Asphalt containing expanded clay (TSP-EC); vii) gap graded Asphalt Rubber asphalt concrete (GG-AR); viii) open graded Asphalt Rubber asphalt concrete (OG-AR); ix) open graded Asphalt Rubber asphalt concrete containing expanded clay (EC-AR). In general, mechanical performance was analyzed in terms of stiffness, permanent deformation and fatigue behaviour. More-over, specific test protocols were selected for more innovative
Advanced Characterization of Innovative Environmentally Friendly Bituminous Mixtures
244
materials such as the cold micro-surfacing with crumb rubber and open graded asphalt concretes manufactured with asphalt rubber binder. The mechanical evaluation of asphalt mixes was performed on materials both manufactured in laboratory and taken in situ. Through the mechanical characterization carried out, all materi-als studied demonstrated to be suitable for the employment on heavy loaded road pavements taking into account also that bearing capacity of porous mixture is limited and mainly em-powered to the lower pavement layers. In particular, materials manufactured with asphalt rubber binder showed remarkable performance strictly related to the use of this kind of bitumen. The very good condition of pavement surfaces of the different trial sections constructed some time ago is a partial confirma-tion of what obtained in laboratory. In this sense, not so positive results were found for the slurry seal containing crumb rubber but this behaviour should be ex-pected due to the very innovative feature of this material. In par-ticular, notwithstanding the not bad results obtained from the laboratory mechanical characterization of this particular surface treatment, when the SSCR mix was laid down the rubber in the mix did not bind well with the bitumen and it was partially thrown out by vehicles passing over. Notwithstanding some not favour-able environmental and operating conditions took place, such as low air temperature, not sufficient traffic opening time, high water content, etc., technical and constituent improvements (use of additives, less rubber content, less rubber grain size, etc.) have to be bring in order to obtain that rubber stays incor-porated into the mix. OG-AR and EC-AR materials were tested also to evaluate their water and temperature sensitivity by means of the innovative CoAxial Shear Test (CAST) apparatus developed by the Fed-eral Swiss Laboratories (EMPA). Results coming from this ex-perimentation demonstrated that the asphalt rubber asphalt concretes studied had not only an excellent fatigue resistance but also very low moisture sensitivity also in presence of ex-panded clay grains. These properties probably arose from the remarkable qualities of asphalt rubber binder but also from the thicker bituminous film that covered the aggregates with respect to traditional hot mix asphalts. Moreover, the presence of the
Conclusions
245
expanded clay grains seemed to confer better temperature cy-cles resistance to the EC-AR mix. As it was demonstrated that road traffic noise is the dominant noise source, so the development of “low noise” road surface is considered a strategic abatement procedure. In general, a low noise road surface can be built trying to minimize noise genera-tion and/or to maximize noise absorption principally acting on texture, porosity and stiffness. Acoustic properties of materials were studied through in situ and laboratory tests. In situ test provided for the measurement of sound levels alongside the roadway while laboratory tests al-lowed sound absorption properties to be determined. Confirming what can be found in literature, in situ and laboratory results clearly demonstrated remarkable acoustic performance of the porous asphalt mixture thanks to its high sound absorp-tion capabilities. However, the high void content of this kind of material involved several durability and clogging issues affect-ing also acoustic properties. Thus, alternative as well as effec-tive solutions for urban areas must be looked for. In this sense, the employment of dense graded materials hav-ing some particular acoustic properties may be the proper solu-tion to these problems. The dense graded asphalt concrete containing expanded clay demonstrated good acoustic per-formance until about 2 years of practice. Then, the probable wear of expanded clay grains decreased the noise-reducing properties. Laboratory tests showed that acoustic properties of expanded clay principally reflect on reduction of rolling noise emission. Similar results, even if less positive, were showed by the SMA mix. However, better results may be obtained acting on its composition. This purpose should be pursued not forgetting to keep adequate friction and mechanical properties. The employment of wearing courses manufactured with asphalt rubber asphalt concretes allowed very good acoustic perform-ance to be obtained thanks the great elasticity of the bituminous binder. In particular, the dense graded mixtures showed to be 3 dB(A) quieter than the reference bituminous surfaces and this noise reduction reached even 5 dB(A) in the case of the open graded mixture. Furthermore, laboratory results demonstrated that this acoustic behaviour was mainly due to the reduction of
Advanced Characterization of Innovative Environmentally Friendly Bituminous Mixtures
246
rolling noise conferred by the use of the asphalt rubber binder rather than to the increase of sound absorption capabilities. In this sense, the EC-AR mixture seems to promise very interest-ing results thanks to the asphalt rubber binder coupled with the expanded clay grains. The porous asphalt partially filled with the photocatalytic cement mortar was not an anti-noise material and was acoustically tested only to verify how the rigid cement mortar affected the acoustic properties of this material. Observing the results ob-tained, it is possible to assert that, as expected, the PM mixture had poor acoustic properties due to both high surface stiffness and low sound absorption capabilities. A very innovative idea for an anti-noise road surface was a Slurry Seal with the “dry” addition of crumb rubber. However, the rubber thrown out from the SSCR mix did not allow the acoustic properties of this kind of surface treatment to be prop-erly evaluated. As already introduced, further researches need surely to be carried out to find a solution that allows a correct bonding between rubber and slurry seal because this asphalt mix could be a very interesting, clever and effective alternative to lower traffic noise level. Confirming this idea, this bituminous mix showed a noise level decreasing with time until one year of service life. Finally, as a general rule of thumb, laboratory results demon-strated that not only the absolute value of the void content but also the shape and the dimension of the voids affect the sound absorption capabilities of a bituminous mixture. Within this thesis, the air purification capabilities of two photo-catalytic products specifically implemented for road applications were evaluated too. The experimental program provided for both in situ and laboratory evaluations and the materials tested were a photocatalytic cement mortar containing titanium dioxide and a TiO2-based liquid spray product both applied on the sur-face of a porous asphalt. In situ results clearly showed a not positive picture for both ma-terials investigated since the air pollutant reductions recorded were isolated and not much significant and they were almost exclusively limited to the carbon monoxide. If these results were confirmed by other more specific studies, the higher costs needed for the employment of these products would be hard to
Conclusions
247
justify. An important condition that could cause the not perfect outcome of these applications was the poor rainfall of the site investigated. This fact probably did not guarantee the necessary washing away of the photocatalytic surface from the products of oxidation reaction. Another important aspect that has to be taken into account in order to justify the performance obtained is the crystalline polymorph of the titanium dioxide employed. However, it is important to underline that, in spite of the accu-racy of the measurements and the analysis of results, it was ex-tremely complicate to exactly establish the real de-polluting po-tentialities of these materials directly from in situ surveys. In fact, with this kind of measurements it is not possible to control all the “environmental” conditions strongly affecting the pollut-ants concentration. As a consequence, it is complicated to iden-tify the air pollutant reduction exclusively due to the presence of the photocatalytic material. This confirmed that it is necessary to develop proper numerical and simulation models able to an-ticipate the pollutants concentration being known the site char-acteristics and the meteorological parameters (temperature, wind, humidity, etc.). Then, it should be possible to recognize the de-polluting share given by the photocatalytic product by comparing the real pollutant concentration with that expected without the photocatalytic treatment. On the other hand, the laboratory tests demonstrated a certain photocatalytic activity due to the presence of the titanium diox-ide but this activity resulted not much important because of the contextual increase in NO and HONO and the good results ob-tained also with the not treated sample. Based on these outcomes it was difficult to express a definitive advice about the employment of such products for road pave-ments in order to reduce air pollution in open surroundings sub-jected to complex phenomena of ventilation and lighting. In this sense, further experimental studies should be necessary. Dif-ferent evaluations could be done if potentialities of these prod-ucts would be analyzed for more controlled applications such as, for example, close surroundings or tunnels. Finally, for what concerns the fundamental aspect related to the friction properties of materials investigated, the measurements of surface texture demonstrated that all materials studied pro-vided good friction for road vehicles. In particular, this assump-
Advanced Characterization of Innovative Environmentally Friendly Bituminous Mixtures
248
tion was indirectly confirmed for trial section 1 by the drastic de-crease in dead and injured (about 50%) recorded after the re-alization of road section.
Book”, Informex, Kisa, 2002. [2] Bernhard R., Wayson R.L., “An Introduction to
Tire/Pavement Noise of Asphalt Pavement” Institute of Safe, Quiet and Durable Highways, Purdue University, 2005.
[3] Hanson D.I., Donavon P., James R., “Tire/Pavement Noise Characteristics of HMA Pavements” Journal of the Association of Asphalt Paving Technologists, vol. 74, pp. 1005-1039, 2005.
[4] Swanlund M.E., “Quiet Pavement Scan and Implementa-tion Activities”, Journal of the Association of Asphalt Pav-ing Technologists, vol. 74, pp. 1043-1056, 2005.
[5] Descornet G., “Low-Noise Road Surfaces: European State of the Art”, Journal of the Association of Asphalt Paving Technologists, vol. 74, pp. 1059-1083, 2005.
[6] Bendtsen H., Andersen B., “Noise-Reducing Pavement for Highways and Urban Roads – State of the Art in Den-mark“, Journal of the Association of Asphalt Paving Tech-nologists, vol. 74, pp. 1085-1103, 2005.
[7] Rymer B., Donavan P., “Tire/Pavement Noise Intensity Testing in Europe: the NITE Study and its Relationship to Ongoing Caltrans Quiet Pavement Activities”, Journal of the Association of Asphalt Paving Technologists, vol. 74, pp. 1107-1137, 2005.
[8] Leung F., Tighe S., Macdonald G., Penton S., “Noise Re-ducing Asphalt Pavements: a Canadian Case Study”, 10th International Conference on Asphalt Pavements, Quebec City, 2006.
[9] Hanson D.I., James R.S., NeSmith C., “Tire/pavement noise study”, NCAT (National Center for Asphalt Technol-ogy) Report 04-02, Auburn, 2004.
[10] de Fortier Smit A., Waller B., “Sound Pressure and Inten-sity Evaluations of Low Noise Pavement Structures with
Advanced Characterization of Innovative Environmentally Friendly Bituminous Mixtures
250
Open-Graded Asphalt Mixtures“, NCAT (National Center for Asphalt Technology) Report 07-02, Auburn, 2007.
[11] McNerney M.T., Landsberger B.J., Turen T., Pandelides A., “Comparative field measurements of tire/pavement noise of selected Texas pavements”, Final Research Re-port of Texas Department of Transportation, 2000.
[12] DG XI, European Commission, “Future Noise Policy - Eu-ropean Commission Green Paper”, Brussels, 1996.
[13] Boscaino G., La Torre F., Praticò, F.G., “Rumore di roto-lamento - Rumore e vibrazioni da traffico. L’influenza delle caratteristiche superficiali delle pavimentazioni” Quaderni AIPCR (Associazione Mondiale della Strada – Comitato Nazionale Italiano), 1998.
[14] Haider M., Descornet G., Sandberg U., Praticò F.G., “Road Traffic Noise Emission: Recent Developments and Future Prospects” 4th International SIIV Congress, Pal-ermo, 2007.
[15] Woodside A.R., Hetherington J.O., Woodward W.D.H., Anderson G.A.L., “A comparison of the various methods used in the reduction of road traffic noise”, 3rd European Symposium, Performance and Durability of Bituminous Materials and Hydraulic Stabilised Composites, Leeds, 1999, 289-300.
[16] Washington State Department of Transportation, “Quieter Pavements: Options and Challenges for Washington State”, Final Research Report of Washington State De-partment of Transportation, 2005.
[17] EN ISO 13473-1, “Characterization of pavement texture by use of surface profiles – Part 1: Determination of Mean Profile Depth”, 2004.
[18] Crocker M.J., Hanson D., Li Z., Karjatkar R., Vissamraju K.S., “Measurement of the Acoustical and Mechanical Properties of Porous Road Surfaces and Tire/Road Noise”, 83rd TRB Annual Meeting, Washington, D.C., 2004.
[19] ASTM D8, “Standard Terminology Relating to Materials for Roads and Pavements”, 2002.
[20] EN 13055-2, “Lightweight aggregates - Part 2: Lightweight aggregates for bituminous mixtures and surface treat-ments and for unbound and bound applications”, 2005.
References
251
[21] Santagata E., Barbati S.D., “Sviluppo di metodologie di prova per la misura del coefficiente di assorbimento acu-stico dei conglomerati bituminosi” 12° International SIIV Congress, Parma, 2002.
[22] De Palma C., Bassani M., “Manti d’usura fonoassorbenti realizzati con conglomerati bituminosi alleggeriti di tipo chiuso”, Strade & Autostrade, 5-2000.
[23] Bucchi A., Dondi G., Simone A. “Laboratory and field ex-perimental investigations about the properties of a thin bi-tuminous layer with porous aggregate”, 9th International Conference on Asphalt Pavements, Copenhagen, 2002.
[24] Tessonneau H., Serfass J.P., “Light-aggregate asphalt concrete for improved skid resistance”, First Eurasphalt & Eurobitume Congress, Strasbourg, 1996.
[25] Meiarashi S., “Porous Elastic Road Surface as an Urban Highway Noise Measure”, 83rd TRB Annual Meeting, Washington, D.C., 2004.
[26] Morgan P. A., “IPG Research Report - Innovative mitiga-tion measures for road traffic noise”, DVS Project Report DVS-2008-018, Centre for Transport and Navigation of Rijkswaterstaat, Delft, 2008.
[27] EN ISO 11819-1, “Acoustics - Measurement of the influ-ence of road surfaces on traffic noise - Part 1: Statistical Pass-By method”, 2004.
[28] NF S 31 119-2, “Acoustique : Caractérisation in situ des qualités acoustiques des revêtements de chaussées – Mesurages acoustiques au passage – Procédure «Véhi-cules Maîtrisés» ”, 1999.
[29] ISO/CD 11819-2, “Acoustics - Measurement of the influ-ence of road surfaces on traffic noise - Part 2: Close-proximity method”, 2001.
[30] EN ISO 10534-1, “Acoustics - Determination of sound ab-sorption coefficient and impedance in impedances tubes - Method using standing wave ratio”, 2001.
[31] ISO 13472-1, “Acoustics - Measurement of sound absorp-tion properties of road surfaces in situ - Part 1: Extended surface method”, 2002.
[32] do Nascimento L.A.H., Leite L-F.M., “Evaluation of pave-ments acoustic behaviour in Brazil” ISAP Symposium on Asphalt Pavement and Environment, Zurich, pp. 385-396, 2008.
Advanced Characterization of Innovative Environmentally Friendly Bituminous Mixtures
252
[33] Bendtsen H., Voskuilen J.L.M., Thomsen S.N., Sule M.S., “Optimization of noise reducing thin pavement layers in Denmark and the Netherlands” ISAP Symposium on As-phalt Pavement and Environment, Zurich, pp. 397-408, 2008.
[34] Haberl J., Litzka J., “Tests of different noise reducing as-phalt pavements on an Austrian motorway” ISAP Sympo-sium on Asphalt Pavement and Environment, Zurich, pp. 409-420, 2008.
[35] Harvey J., Ongel A., Kohler E., Lu Q., Steven B., Motumah L., “Overview of research on flexible quiet pavement in California” ISAP Symposium on Asphalt Pavement and Environment, Zurich, pp. 373-384, 2008.
[36] EN 12697-8, “Bituminous mixtures – Test methods for hot mix asphalt – Determination of void characteristics of bi-tuminous specimens”, 2003.
[37] Kandhal P.S., Mallick R.B., “Design of new-generation open-graded friction courses” NCAT (National Center for Asphalt Technology) Report 99-03, Auburn, 1999.
[38] EN 12697-31, “Bituminous mixtures - Test methods for hot mix asphalt - Part 31: Specimen preparation by gyratory compactor”, 2004.
[39] EN 12697-33, “Bituminous mixtures - Test methods for hot mix asphalt - Part 33: Specimen prepared by roller com-pactor”, 2007.
[40] EN 12697-26, “Bituminous mixtures - Test methods for hot mix asphalt - Part 26: Stiffness”, 2004.
[41] BS DD ABF, “Method for the determination of the fatigue characteristics of bituminous mixtures using indirect ten-sile fatigue”, 1997.
[42] BS 598-110, “Sampling and examination of bituminous mixtures for roads and other paved areas. Methods of test for the determination of wheel-tracking rate and depth”, 1998.
[43] Sokolov K., Gubler R., Partl M. N., “Extended numerical modelling and application of the coaxial shear test for as-phalt pavements”, Materials and Structures, vol. 38, no. 279, p. 515-522, 2005.
[44] Ferrotti G., “Theoretical and experimental characterization of interlayer shear resistance in flexible pavements”, PhD
References
253
dissertation, Università Politecnica delle Marche, Ancona, 2007.
[45] Canestrari F., Santagata E., Santagata, F.A., “Perform-ance-based evaluation of slurry surfacings by means of the ASTRA test method”, 3rd International Conference Bi-tuminous Mixtures and Pavements, Thessaloniki, 2002.
[46] ISSA Technical Bulletin No. 147, “Test Methods for Meas-urement of Stability and Resistance to Compaction, Verti-cal and Lateral Displacement of Multilayered Fine Aggre-gate Cold Mixes”, 1989.
[47] CNR B.U. n. 105, “Norme per la misura delle caratteristi-che superficiali delle pavimentazioni. Metodo di prova per la misura della resistenza di attrito radente con l’apparecchio portatile a pendolo”, 1985.
[48] EN 12274-4, “Slurry surfacing – Test method – Part 4: De-termination of cohesion of the mix”, 2003.
[49] DPCM 16/03/98, “Tecniche di rilevamento e di misurazio-ne dell’inquinamento acustico”, 1998.
[50] EN 13036-1, “Road and airfield surface characteristics - Test methods - Measurement of pavement surface macro-texture depth using a volumetric patch technique”, 2002.
[51] ASTM E 1960, “Standard Practice for Calculating Interna-tional Friction Index of a Pavement Surface”, 1998.
[52] Grilli A., “Advanced Testing and Theoretical Evaluation of Bituminous Mixtures for Flexible Pavements”, PhD disser-tation, Università Politecnica delle Marche, Ancona, 2008.
[53] Gubler R., Partl M. N., Canestrari F., Grilli A., “Influence of water and temperature on mechanical properties of se-lected asphalt pavements”, Materials and Structures, vol. 38, no. 279, p. 523-532, 2005.
[54] Gubler R., Baida L.G., Partl M. N., “A New Method to De-termine the Influence of Water on Mechanical Properties of Asphalt Concrete”, International Journal of Road Mate-rials and Pavement Design, Hermes Science Publications, Special Issue EATA 2004, pp. 259-279, 2004.
[55] ISSA A143, “Recommended Performance Guidelines for Micro-Surfacing”, 2005.
[56] Canale S., Ventura F., “Rumore da traffico e progettazione stradale – metodologie di previsione e possibilità di atte-nuazione”, Autostrade, 2-1986.
Advanced Characterization of Innovative Environmentally Friendly Bituminous Mixtures
254
[57] Sandberg U., “The Multi-Coincidence Peak around 1000 Hz in Tire/Road Noise Spectra”, Euronoise Conference, Naples, 2003.
[58] Vallée F., Ruot B., Bonafus L., Guillot, L., Pimpinelli N., Cassar L., Strini A., Mapelli E., Schiavi L., Gobin C., André H., Moussiopoulos N., Papadopoulos A., Bartzis J., Mag-gos T., McIntyre R., Lehaut-Burnouf C., Henrichsen A., Laugesen P., Amadelli R., Kotzias D., Pichat P., “Cementi-tious Materials for Self-cleaning and De-polluting Façade Surfaces”, RILEM International Symposium on Environ-ment-Conscious Materials and Systems for Sustainable Development, Koriyama, pp. 337-346, 2004.
[59] Ianniello A., De Santis F., Esposito G., Spataro F., Alle-grini I., “Photocatalytic Destruction of NO2 and HONO in the Gas Phase using Titanium Dioxide Coatings”, 13th World Clean Air and Environmental Protection, London, 2004.
[60] PICADA “Innovative Facade Coatings with De-soiling and De-polluting Properties” Official Presentation of PICADA Project (www.picada-project.com), 2006.
[61] Fujishima A., Honda K., “Electrochemical Photolysis of Water at a Semiconductor Electrode”, Nature 238, pp. 37-38, 1972.
[62] Fujishima A., Hashimoto K., Watanabe T., “TiO2 Photo-catalysis: Fundamentals and Applications”, BKC, Tokyo, 1999.
[63] Hashimoto K., “TiO2 Photocatalysis toward Novel Building Materials”, RILEM International Symposium on Photocata-lysis, Environment and Construction Materials, Firenze, pp. 3-8, 2007.
[64] Beeldens A., “Air Purification by Road Materials: Results of the Test Project in Antwerp”, RILEM International Sym-posium on Photocatalysis, Environment and Construction Materials, Firenze, pp. 187-194, 2007.
[65] Beeldens A., Van Gemert D., “Experimental Investigation of Efficiency of TiO2-Cement Coating for Self-cleaning and Air Purification” RILEM International Symposium on Envi-ronment-Conscious Materials and Systems for Sustain-able Development, Koriyama, pp. 353-359, 2004.
[66] Dehn F., Bahnemann D., Bilger B., “Development of Photocatalytically Active Coatings for Concrete Sub-
References
255
strates” – RILEM International Symposium on Environ-ment-Conscious Materials and Systems for Sustainable Development, Koriyama, pp. 347-352, 2004.
[67] Kemmitt T., Al-Salim N.I., Waterland M., Kennedy V.J., Markwitz A., “Photocatalytic titania coatings”, Current Ap-plied Physics, vol. 4, pp. 189-192, 2004.
[68] Tryba B., Czerwińska M., Morawski W., “Synthesis of TiO2-Ag Doped Slurry for Concrete Impregnation” – RILEM International Symposium on Photocatalysis, Envi-ronment and Construction Materials, Firenze, pp. 235-242, 2007.
[69] Pepe C., Amadelli R., Pimpinelli N., Cassar L., “Doped-TiO2/Cement Matrices Photoactive Materials” – RILEM In-ternational Symposium on Environment-Conscious Mate-rials and Systems for Sustainable Development, Kori-yama, pp. 331-336, 2004.
[70] Herrmann J.M., Peruchon L., Puzenat E., Guillard C., “Photocatalysis: from Fundamentals to Self-cleaning Glass Applications” RILEM International Symposium on Photo-catalysis, Environment and Construction Materials, Firenze, pp. 41-48, 2007.
[71] Campanella L., Borzetti F., Cassar L., “Photocatalytic Ce-ment: a New Approach to Environmental Protection”, RILEM International Symposium on Photocatalysis, Envi-ronment and Construction Materials, Firenze, pp. 203-210, 2007.
[72] Devahasdin S., Fan C., Li K., Chen D.H., “TiO2 Photocata-lytic Oxidation of Nitric Oxide: Transient Behavior and Re-actions Kinetics”, Current Applied Physics, vol. 156, pp. 161-170, 2003.
[73] Mills A., Le Hunte S., “An Overview of Semiconductor Photocatalysis”, Journal of Photochemistry and Photobiol-ogy A: Chemistry, vol. 108, pp. 1-35, 1997.
[74] Bianchi C.L., Ardizzone S., Cappelletti G., Pirola C., Ra-gaini V., “The role of the synthetic procedure of nano-crystalline TiO2 on the photodegradation of toluene”, RILEM International Symposium on Photocatalysis, Envi-ronment and Construction Materials, Firenze, pp. 17-24, 2007.
[75] Bengtsson N., Castellote M., “Photocatalytic testing of immobilized titanium dioxide and its efficiency for degrada-
Advanced Characterization of Innovative Environmentally Friendly Bituminous Mixtures
256
tion of air contaminants” RILEM International Symposium on Photocatalysis, Environment and Construction Materi-als, Firenze, pp. 101-108, 2007.
[76] Amadelli R., Samiolo L., “Concrete containing TiO2: an Overview of Photocatalytic NOx Abatement”, RILEM Inter-national Symposium on Photocatalysis, Environment and Construction Materials, Firenze, pp. 155-162, 2007.
[77] Kawakami M., Furumura T., Tokushige H., “NOx removal effect and physical properties of cement mortar incorporat-ing titanium dioxide powder”, RILEM International Sympo-sium on Photocatalysis, Environment and Construction Materials, Firenze, pp. 163-170, 2007.
[78] Hüsken G., Hunger M., Brouwers H.J.H., “Comparative study on cementitious products containing titanium dioxide as photo-catalyst”, RILEM International Symposium on Photocatalysis, Environment and Construction Materials, Firenze, pp. 147-154, 2007.
[79] Strini A., Cassese S., Bossi E., “Precision Measurement of BTEX Depollution in Air by Photocatalytic Building Materi-als using a Stirred Flow Reactors”, RILEM International Symposium on Photocatalysis, Environment and Con-struction Materials, Firenze, pp. 77-84, 2007.
[80] Pieraccini G., Dani F.R., Turbanti L., Boscaro F., Pepe C., Moneti G., “A SPME-GC-MS Method for the Evaluation of Dropping Capacity of Organic Pollutants by TiO2 Added Plasters Used in Building Industry”, RILEM International Symposium on Photocatalysis, Environment and Con-struction Materials, Firenze, pp. 93-100, 2007.
[81] Strini A., Bossi E., “Interfering Effects in the Measure-ments of BTEX Depollution in Air by Pure Catalyst”, RILEM International Symposium on Photocatalysis, Envi-ronment and Construction Materials, Firenze, pp. 117-122, 2007.
[82] Maury A., De Belie N., Demeestere K., Mäntylä T., “Tita-nium dioxide cementitious materials: characterization and air cleaning potential”, RILEM International Symposium on Photocatalysis, Environment and Construction Materials, Firenze, pp. 227-234, 2007.
[83] Peterka F., Jirkovský J., St’ahel P., Navrátil Z., “Limits of Application of Photocatalytic Technologies to Construction Materials”, RILEM International Symposium on Photocata-
References
257
lysis, Environment and Construction Materials, Firenze, pp. 49-56, 2007.
[84] UNI 11238-1, “Determination of the catalytic degradation of organic micropollutants in air – Part 1: Photocatalytic cementitious materials”, 2007.
[85] Cassar L., Beeldens A., Pimpinelli N:, Guerrini G.L., “Photocatalysis of cementitious materials” RILEM Interna-tional Symposium on Photocatalysis, Environment and Construction Materials, Firenze, pp. 131-145, 2007.
[86] UNI 11247, “Determination of the catalytic degradation of nitrogen oxides in air by photocatalytic inorganic materi-als”, 2007.
[87] UNI 11259, “Determination of the photocatalytic activity of hydraulic binders – Rodammina test method”, 2008.
[88] Guerrini G.L., Peccati E., “Photocatalytic Cementinous Road for Depollution”, RILEM International Symposium on Photocatalysis, Environment and Construction Materials, Firenze, pp. 179-188, 2007.
[89] Hamada H., Komure K., Takahashi R., Yamaji T., “NOx Emission, Local Concentration and Reduction by TiO2-Photocatalysis in Airport Area”, RILEM International Sym-posium on Environment-Conscious Materials and Systems for Sustainable Development, Koriyama, pp. 361-366, 2004.
[90] Leotta U., “Il Biossido di Titanio: un Prodotto, una Tecno-logia”, Strade & Autostrade, vol. 3-2006, pp. 2-3, 2006.
[91] Punzo S., “Il Futuro della Lotta all’Inquinamento: le Pavi-mentazioni Fotocatalitiche”, Strade & Autostrade, vol. 3-2006, pp. 134-136, 2006.
[92] Plassais A., Rousseau F., Eriksson E., Guillot L., “Photo-catalytic coverings assessment: from canyon street meas-urements to 3-D modelling”, RILEM International Sympo-sium on Photocatalysis, Environment and Construction Materials, Firenze, pp. 85-91, 2007.
[93] Guerrini G.L., Plassais A., Pepe C., Cassar L., “Use of Photocatalytic Cementinous Materials for Self-cleaning Applications”, RILEM International Symposium on Photo-catalysis, Environment and Construction Materials, Firenze, pp. 219-226, 2007.
[94] Bonetta Si., Bonetta Sa., Strini A., Carraro E., “Evaluation of the antimicrobial activity of a surface-coated with TiO2”,
Advanced Characterization of Innovative Environmentally Friendly Bituminous Mixtures
258
RILEM International Symposium on Photocatalysis, Envi-ronment and Construction Materials, Firenze, pp. 267-272, 2007.
[95] Dinelli M., Bonini M., Giorgetti A., Casucci F., Ridi F., Fratini E., Baldanzini N., Citti P., Baglioni P., “Flame spraying of TiO2 nanoparticles: deposition onto glasses substrate”, RILEM International Symposium on Photocata-lysis, Environment and Construction Materials, Firenze, pp. 281-288, 2007.
Acknowledgments
259
Acknowledgments I would like to especially thank Prof. F. Santagata for giving me the opportunity to develop the special experience of the doctoral degree in the best possible way and to be a member of his prestigious Research School. I am sincerely very thankful to Prof. Canestrari. He has been an example and a reference for my research studies and not only. Special thanks are due to Dr. Partl and to his staff at EMPA for offering me the chance and the honour to cooperate with them. I would also like to thank Prof. Bocci and Prof. Virgili for their precious suggestions during my studies. Thanks are due to the staff of the Istituto di Idraulica ed Infra-strutture Viarie of the Università Politecnica delle Marche, and in particular Pierluigi Priori, Stefania Mercuri e Gabriele Galli, for the essential help received. Special thanks go to my friends and colleagues Fabrizio Cardone, Gilda Ferrotti, Valter Pannunzio, Andrea Graziani and Andrea Grilli (my “old” friend!!) for the invaluable friendship and scientific support. Thanks are also due to everyone that helped me in the experi-mental work that was not possible to carry out in our laborato-ries and/or with our resources: Prof. Ayr and Dr. Pisciotta of the Politecnico di Bari for the sound absorption measurements; Dr. Inês Antunes and BITEM SRL for the execution of the cohesion tests on slurry seal mixes; Prof. Cesini, Dr. Valter Lori and Dr. Fabio Serpilli of the Dipartimento di Energetica of the Università Politecnica delle Marche for what concerns the in situ acoustic measurements; Dr. Ivo Allegrini and the staff of the Istituto sull’Inquinamento Atmosferico of the CNR for the laboratory tests on photocatalytic materials and ECOS SAS for the in situ environmental measurements.
Advanced Characterization of Innovative Environmentally Friendly Bituminous Mixtures
260
Un ringraziamento particolare va a mia moglie Michela. Con in-telligenza, pazienza e comprensione ha percorso insieme a me questo cammino. Senza di lei tutto sarebbe stato più duro, se non impossibile. Un immenso grazie va anche alla mia famiglia che mi ha consi-gliato, incoraggiato e sostenuto nella, per alcuni versi, scomoda scelta di approfondire i miei studi. Solo grazie al loro supporto, il raggiungimento di questo prestigioso obiettivo non ha compor-tato rinunce altrettanto importanti.