74
Click To Edit Master Title Style Advancing Commercial and Industrial Energy Efficiency Policies and Programs 5/28/15

Click To Edit Master
Title Style
Advancing Commercial and
Industrial Energy Efficiency
Policies and Programs
5/28/15
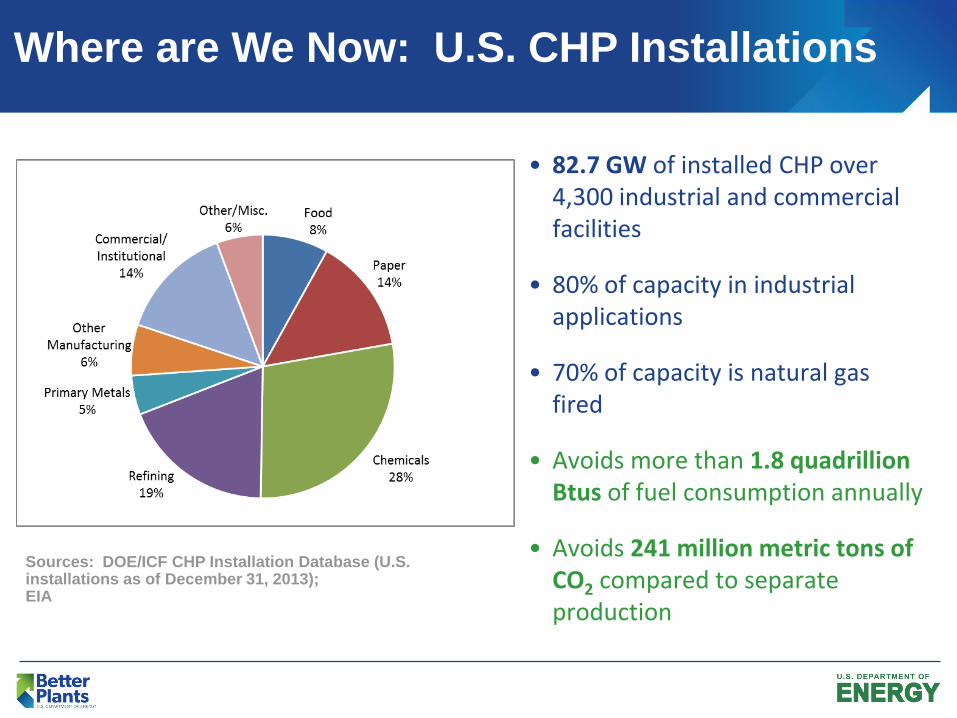
Where are We Now: U.S. CHP Installations
• 82.7 GW of installed CHP over 4,300 industrial and commercial facilities
• 80% of capacity in industrial applications
• 70% of capacity is natural gas fired
• Avoids more than 1.8 quadrillion Btus of fuel consumption annually
• Avoids 241 million metric tons of CO2 compared to separate production
Sources: DOE/ICF CHP Installation Database (U.S. installations as of December 31, 2013); EIA

CHP is Everywhere
Source: DOE CHP Installation Database (U.S. installations as of Dec. 31, 2013)
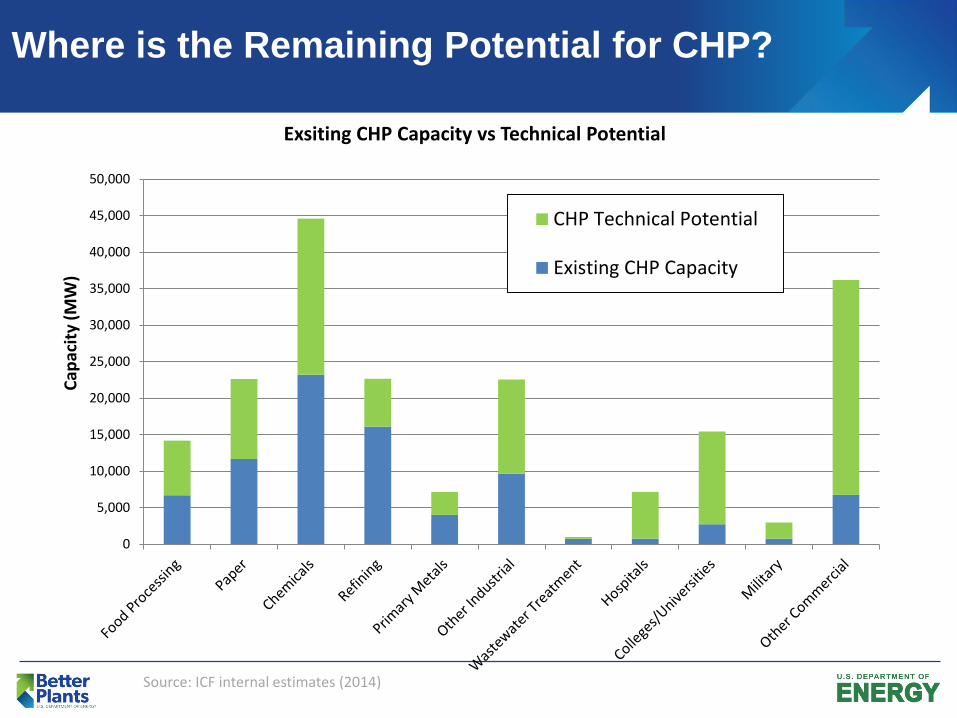
Where is the Remaining Potential for CHP?
Source: ICF internal estimates (2014)
0
5,000
10,000
15,000
20,000
25,000
30,000
35,000
40,000
45,000
50,000
Cap
acit
y (M
W)
Exsiting CHP Capacity vs Technical Potential
CHP Technical Potential
Existing CHP Capacity

Where is the Remaining Potential for CHP?
CHP Technical Potential (MW)
1,000-3,000 MW
3,000-5,000 MW
<1,000 MW
> 5,000 MW
Source: ICF Internal Estimates (2014)

Come to the Better Plants Recognition Event!
• Light snacks and cash bar
• Network with industry peers and Advanced Manufacturing
Office (AMO) technology experts
• View posters of ongoing AMO projects
Where: Main ballroom (Salons 1 and 2)
When: 5:15-6:00 PM, Thursday evening

Panelists
Jessica Burdette, Minnesota Department of
Commerce
Michael Leslie, Maryland Energy Administration
Marty Stipe, Oregon Department of Energy
Bill Edmonds, NW Natural

Jessica Burdette
Minnesota Department of Commerce

Better Buildings Summit - 2015
Combined Heat and Power: Minnesota Update
Jessica Burdette
Conservation Improvement Program (CIP) Supervisor

11
Minnesota: Statewide Energy Policy Objectives
Conservation Improvement Program (CIP)
•MN Statute 216B.241
•Utility Energy Efficiency and Conservation Goals
•1.5% = Electric
•1% = Natural Gas
•CHP/WHR Eligibility included in 2013
Renewable Energy Standard (RES)
•MN Statute 216C.05, Subd. 2
•Portfolio standard = 25% by 2025
•Biomass CHP Eligible for inclusion in the RES
Greenhouse Gas Emissions Goals
(GHG)
•MN Statute 216H.02
•15% by 2015
•30% by 2025
•80% by 2050
•CHP is a potential tool to achieve increased GHG emissions reductions

Minnesota’s Past CHP Work
12
Energy Savings Goal Study (2013-14)
Conservation Applied Research & Development CHP Studies (2013-14)
Department of Energy CHP Grant (2014-15)

Energy Savings Goal Study (ESG)
13
Legislation
H.F. 729, 4th Engrossment, Article 12, Section 8 established the Energy Savings Goal Study (ESG)
• The Department of Commerce was charged with completing this work
Stakeholder Process
Commerce conducted stakeholder meetings on various topics in late 2013:
• Industrial energy efficiency
• Combined heat and power
Report
Report and ESG findings presented to the Minnesota Legislature in 2014:
• Recommendations were made for continued evaluation of CHP

Energy Savings Goal Study CHP Key Findings
14
1. The policy objective for greater CHP implementation and eligibility in
CIP needs to be better defined
2. Stand-by rates identified as a barrier to increased CHP
implementation
3. More detailed data on CHP potential in Minnesota is needed
4. Any CHP program or standard should reduce risk to customers and
utilities, and have long-term achievement objectives focusing on
system reliability and utility/operator relationships
5. Questions remain regarding CHP system ownership structures from
customer and utility perspectives

CHP Studies – Conservation Applied Research and Development (CARD)
• CHP Standby Rates and Net Metering – Conducted by Energy Resources Center (University
of Illinois)
– Published April 2014
• Minnesota CHP Policies and Potential – Conducted by FVB Energy/ICF International
– Published September 2014
15

CHP Standby Rate Study Key Recommendations
16
1. Standby rates should be transparent, concise and easily understandable
2. Standby energy usage fee should reflect both demand and time-of-use cost drivers
3. Forced Outage Rate should be used in the calculation of a customer’s reservation charge
4. Standby demand usage fees should only apply during on-peak hours and be charged on a daily basis
5. Grace periods exempting demand usage fees should be removed where they exist
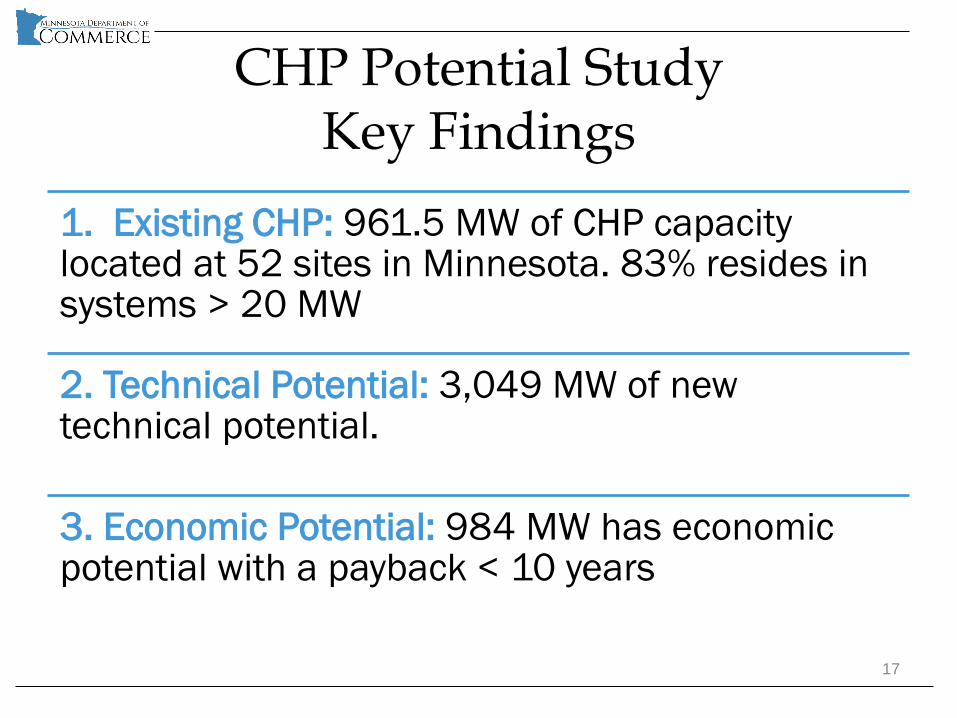
CHP Potential Study Key Findings
17
1. Existing CHP: 961.5 MW of CHP capacity located at 52 sites in Minnesota. 83% resides in systems > 20 MW
2. Technical Potential: 3,049 MW of new technical potential.
3. Economic Potential: 984 MW has economic potential with a payback < 10 years

-
200
400
600
800
1,000
1,200
1.1
Ca
p In
c
1.2
Op
In
c
1.3
Ca
p &
Op
In
c
2.1
Ca
p In
c
2.2
Op
In
c
2.3
Ca
p &
Op
In
c
3.1
Ga
s U
tility
3.2
Ele
c U
tility
4 B
ioe
ne
rgy
go
al
5.1
AP
S L
ow
Go
al
5.2
AP
S H
igh
Go
al
Base
Case
Natural Gas CIP Electric CIP CIP with Utility
WACC
RPS Alternative
Portfolio
Standard
CH
P C
ap
acit
y b
y 2
03
0 (
MW
)
Biomass
Natural Gas
CHP Regulatory Study Key Findings: Impacts of Policy Options

19
• Significant increases in implementation of CHP will require investment by utilities in CHP
• CHP within the EERS has a significant advantage
• Must examine issues relating to utility investment in CHP
• Integrated Resource Planning (IRP) is a tool that should be used to evaluate CHP.
CHP Regulatory Study Key Findings (continued)

U.S. Department of Energy CHP Project
Commerce was awarded a DOE grant in 2014 to conduct stakeholder engagement in Minnesota regarding CHP
20
Info
rm S
take
ho
lde
rs
Current activity underway to increase CHP Implementation
Fa
cilit
ate
Dis
cu
ssio
n
Barriers and Opportunities for greater deployment of CHP technologies
So
licit
Id
ea
s
Solutions to the challenges presented during discussion of CHP implementation P
rovid
e In
form
ati
on
Develop an action plan and provide details of steps necessary to increase CHP activity in Minnesota

DOE CHP Grant Stakeholder Engagement Process
21
8/04-8/15
Pre-Engagement
Survey
9/03/14
CHP Meeting #1 –
CHP Baseline, Value
Proposition, and Path
Forward
9/24/14
CHP Meeting #2 –
CHP Standby Rates
and Net Metering
9/24-10/10
Comment Period #1
10/15/14
CHP Meeting #3 –
Stakeholder
Presentations and
Path Forward
11/05/14
CHP Meeting #4 –
Education/Training,
Synthesis of
Information, Next Steps
12/09/14-1/02/15
Post-Engagement
Survey
April/May 2015
Comment Period
#2 and Webinar #1
March 2015
Draft CHP Action
Plan
June 2015
Final CHP Action
Plan
June 2015
Webinar #2
June-Dec 2015
Continued
Stakeholder
Engagement
Next Steps
Work Completed

DOE CHP Grant Stakeholder Meeting Themes
1. CHP Evaluation Criteria
2. Mapping CHP Opportunities
3. CHP Ownership Problems and Solutions
4. Adapting CIP for Supply-Side Investments
5. Education and Training Needs
22

Questions?
Contact:
• Jessica Burdette [email protected] or 651-539-1871
• Adam Zoet [email protected] or 651-539-1798
23

Michael Leslie
Maryland Energy Administration

C H P A N D C O M M E R C I AL & I N D U S TR I A L E N E R G Y E F F I C I E N CY P O L I C I E S A N D P R O G R A M S P R E S E N T ATI O N
D O E B E T T E R B UI LDI N G S S U M M I T - 2 0 1 5 M I C H A E L L E S L I E , M S C ,
C L E A N E N E R G Y C H P A N D C & I P R O G R A M M A N A G E R
“Clean, Affordable and Reliable Energy for all Marylanders”
May 28, 2015

MEA Overview
The mission of the Maryland Energy Administration (MEA) is to promote affordable, reliable, clean energy. MEA’s programs and policies help lower energy bills, fuel the creation of jobs, drive economic development, and promoting energy independence.

MEA Strategic Goals
The strategic goals of the Maryland Energy Administration are:
• Make the State of Maryland a leader in energy efficiency;
• Reduce energy costs for our citizens; • Reduce greenhouse gas emissions from energy; • Increase the use of renewable energy; • Leverage public/private partnerships in order to
improve the competitive position of Maryland industry; and
• Lower the operating expenses of State and local governments while contributing to the improvement of air and water quality in Maryland.

CHP Benefits and Policy Attributes
Energy Efficiency • EmPOWER Maryland initiative, the State has a goal of reducing
energy consumption by 15 percent by 2015
Economic Development • The use of CHP systems creates LOCAL jobs in manufacturing,
engineering, installation, ongoing operation and maintenance, and many other areas.
Grid and Facility Resiliency • Complies with Executive Order demand to identify how to
improve the resiliency and reliability of the Maryland electric distribution system
Greenhouse Gas Reduction • Supports the Greenhouse Gas Reduction Plan (the Plan) that will
reduce greenhouse gases 25 percent by the year 2020.

Current CHP Policy Attributes (continued)
Job Creation • Job Creation Tax Credit (JCTC) managed by the Maryland
Department of Business & Economic Development
Maryland Clean Energy Production Tax Credit • CHP systems powered by renewable fuels such as biomass can
potentially claim a credit equal to 0.85 cents per kilowatt-hour ($0.0085/kWh) against the state income tax, for a five-year period, for electricity generated by eligible resources. Scheduled to end on 12/31/2016
Maryland Renewable Energy Portfolio Standard • Maryland legislature passed legislation (S.B. 690) expanding the
portfolio standard’s Tier I definition to include waste-to-energy systems.

CHP’s Higher Efficiency Results in Energy and Emissions Savings
Suggested revisions and updated footnote
Category 10 MW
CHP
10 MW
PV
10 MW
Wind
10 MW
NGCC
Annual Capacity Factor 85% 22% 34% 70%
Annual Electricity 74,446 MWh 19,272 MWh 29,784 MWh 61,320 MWh
Annual Useful Heat
Provided 114,544 MWht None None None
Footprint Required 6,000 sq ft 1,740,000 sq
ft 76,000 sq ft N/A
Capital Cost $19.8 million $35.6
million
$22.1
million $9.2 million
Annual Energy Savings,
MMBtu 318,221 196,462 303,623 154,649
Annual CO2 Savings,
Tons 43,343 17,887 27,644 28,172
Annual NOx Savings 61.9 16.1 24.9 46.2

Maryland’s Installed CHP Base
ICF International http://www.eea-inc.com/chpdata/States/MD.html
Prime Mover Sites Capacity (kW)
Total 29 717,277
Boiler/Steam Turbine 8 585,200
Combined Cycle 2 25,500
Combustion Turbine 5 89,100
Fuel Cell 0 0
Microturbine 1 65
Other 0 0
Reciprocating Engine 8 15,060
Waste Heat to Power 1 902

Current Utility led CHP Program
Eligibility (BGE, PHI, and PE) Minimum requirement of 65% efficiency (Higher Heating Value) All qualifying systems must not export electricity to the grid Projects must be pre-approved
Incentive (BGE, PHI, and PE) $2.5 million per project incentive cap ($1.25m capacity and $1.25
production) Capacity Incentive Payment: Design incentive ($75/kW): Capacity Incentive Payment: Installation incentive ($275/kW) for
projects under 250 kW and ($175/kW) for projects greater than 250 kW Production incentive: ($0.07/kWh for 18 months): Three payments
subsequent to review of metering data at the end of the 6th, 12th and 18th months
SMECO Currently, SMECO does not offer standalone CHP rebates and, instead, provide rebates under the Custom programs

How is the MEA positioned to help?
Collaboration
Lawton Loan Program
Maryland Clean Energy Center (MCEC)
Financing Program
MEA EmPowerMdCHP Program

Eligible Entities (Please see the MEA EmPowerMdCHP website for more details)
Healthcare facilities (e.g. hospital, assisted living, nursing home, and surgical center)
Publicly Owned Wastewater Treatment facilities
Minimum Project Requirements Located in the State of Maryland Ground breaking will take place and materials will be
onsite by January 1, 2016 Operational no later than January 1, 2017 Minimum system efficiency of 60% Higher Heating Value
FY15 MEA EmPOWER Maryland CHP Program

FY15 MEA EmPowerMdCHP Incentive
MEA EmPowerMdCHP Capacity Grant Incentive
System Size Capacity Payment per kW
Equal to or less than 75kW Up to $575
Between 76kW and 150kW Up to $550
Between 151kW and 300kW Up to $525
Between 301kW and 500kW Up to $500
Between 501kW and 750kW Up to $475
Between 751kW and 1MW Up to $450
1MW and greater Up to $425
Sample Incentive Calculations: A 75kW CHP system is eligible to receive up to a $43,125 grant award. 75kWx$575/kW=$43,125 A 1MW CHP system is eligible for up to a $450,000 award. 1MWx$450/kW=$450,000

FY15 MEA EmPowerMdCHP Results
Results Received 1o applications within the grant deadline totaling over
13 MW of new CHP capacity
Approved 7 applications to receive grant funds
6 out of 7 are healthcare facilities
No biomass or biofuel projects had been submitted
Projects range in size from 130 – 2,000 kW
Grant recipients are eligible to receive between $71,500 -
$464,700
Assuming all eligible grantees comply with the grant conditions
the 7 projects will provide over 9 MW of new CHP capacity

Helpful Links
• MEA EmPowerMdCHP Program
• Jane E. Lawton Conservation Loan Program (Managed by MEA)
• Maryland Clean Energy Center (MCEC) Financing Program
• BGE Smart Energy Savers Program® Combined Heat and Power (CHP)
• Pepco Combined Heat & Power (CHP) program
• Delmarva Power Combined Heat & Power (CHP) program
• Potomac Edison Combined Heat and Power Incentives Program
• Maryland utility territory map

The NGEEG program funds training and consulting efforts that help Maryland manufacturers in the BGE service territory implement energy conservation measures (ECMs).
• The Regional Manufacturing Institute of Maryland (RMI) is the Program developer and administrator.
• MEA disburses the funds and provides financial, consultation, outreach support, and oversight
Next Generation Energy Efficiency Gains Program
(NGEEG)

NGEEG Program Benefits
Participating Manufactures can receive up to $30,000 worth of business services to include:
• No-cost comprehensive energy audit • Compressed air leak detection service • Energy monitoring system equipment and installation,
including monthly benchmarking and engineering analysis • Strategic operational and equipment improvement
planning report • Energy efficiency training • Green Team Employee engagement program • Review and process utility and State rebate and financial
resources • Share best practices through monthly leadership
engagement
Examples of Manufactures Benefiting from NGEEG

NGEEG Case Study #1 C-Care
• C-Care 135,000 sq ft; spending $700,00 annually on energy (78% on electricity)
• The program identified significant HVAC, retro-commissioning, controls, and lighting ECMs
• RMI and C-Care predicts $1.5 million project will reduce 1 million kWh cut energy costs by at least $160,000 annually
• Awarded $434,473 MEA grant to help offset the costs of implementing the ECMs

NGEEG Case Study #2 Tenax
• Baltimore City fencing manufacturer; 160,000 sq ft factory and office space
• Spent $460,000 last year on energy; no previous energy audit or utility rebates
• The program identified multiple ECMs to include lighting upgrades, controlling exhaust, and HVAC upgrades providing up to a 600,000 kWh annual reduction
• Applied for MEA Lawton Loan, which provides a cash positive opportunity to implement ECMs, thereby, saving Tenax approximately $100,000 in annual energy costs

NGEEG Results
• As of January, 17 companies have graduated from the NGEEG program
• Completed 2,704,173 kWh reductions with another 7,647,133 kWh reduction in process, thereby, surpassing the companies 6,800,000 kWh goal for the group
• Collectively saving $1,098,900 annually
• 21 remaining companies projected to reduce more than 8.4 million kWh once they graduate in the next 6 months

Implement upgrades that achieve deep electricity savings of 20% or more
Incentivize projects that incorporate multiple efficiency upgrades in a whole building approach
Showcase best practices
FY15

FY15 C&I Grant Program in Brief
Competitive grants to implement and showcase upgrades to commercial and industrial buildings that reduce electricity usage by 20 percent or more
Grants cover up to 50% of project costs after other incentives
Awards can range from $20,000 to $500,000
No limit on maximum project size

FY15 C&I Grant Eligibility
Any commercial or non-profit enterprise Examples: senior living facilities, hotels, supermarkets,
office buildings, retail facilities, office areas associated with industrial plants, and restaurants
Buildings must be located in Maryland Projects must improve whole building or
dedicated space An area/space that has its own meter An area/space with a purpose distinct from the
surrounding space
Eligible electricity efficiency measures Technology upgrades Operational changes (when combined with technology
upgrades)

FY15 C&I Grant Eligible Efficiency Measures
Technology upgrades
Building insulation and envelope
Lighting
Controls
Motors and variable frequency drives
Heating, ventilation and air conditioning (HVAC)
Refrigeration
Other electric-only projects
Operational changes
Staff training and credentialing
Re- or retro-commissioning
Energy data analytics
Strategic energy management or ISO 150001 implementation
Must be combined with technology upgrades and
result in measureable energy savings

FY14 C&I Grant Results
21 Projects Funded
7 Deep Retrofit Projects (5 Measures)
14 Multi-measure Retrofit Projects
27 % avg kWh savings (exceeds 20% program goal by
7%)
Awards range from $$20,000 to $400,000
Estimated savings of more than 20 million kWh annually

Fy15 C&I Grant Support
Resources available at program website:
http://energy.maryland.gov/Business/
Contact [email protected] for all
programmatic questions
MEA CHP Presentation
Contact Info:
MICHAEL LESLIE, MSC Clean Energy CHP and C&I Program Manager
o:(410) 260-7543 m:(443) 694-7475 [email protected]

Marty Stipe, Oregon Department of Energy
Bill Edmonds, Northwest Natural

Combined Heat and Power in Oregon
Marty Stipe, Oregon Department of Energy
May 28, 2015

CHP History in Oregon
• Paper and Wood Products + Food Processing
• Challenging economics
• Support from state government

CHP History in Oregon
• Policy and Incentives
– Supporting CHP since 1980
– Business Energy Tax Credits (BETC)
• 17 projects supported
• $24,458,788 in tax credits
CHP Program Expansion
• Keep tax credits, added outreach
• Framework of current efforts
– Opportunity Assessment
– Economics
– Partnerships
– Support from the US DOE
– Legislation

Doing the Homework
• Opportunity Assessment
– Washington State University / ICF International report
– CHP Technical Assistance Partnership

Where Is The Opportunity?
CHP Technical Potential by Electric Utility Territory (MW Capacity)
Electric Utility 50-500
kW 500-1 MW
1-5 MW 5-20 MW >20 MW Total
Portland General Electric
163 105 182 76 87 614
Pacific Power & Light
97 76 99 102 98 471
Eugene Water & Electric Board
21 12 51 0 0 84
Other Electric Companies
57 51 94 16 71 289
Total 338 244 425 195 255 1,457

Analysis Is Important
• Economics
– Realistic opportunities
– Industry and large investments
– Multiple incentives
– Analysis

Stacked Incentives To Reach the Target

The Value of Teamwork
• Partnerships
– Acknowledge multiple goals
– Aim for long-term outcomes
– Support during stakeholder engagement
– Anchor on common metrics and values

Increased Focus and Support
• Support from the US DOE
– National support
– New perspectives and programs
• Legislation
– Game changing
– Allows long-term program commitment
Thank you!
Marty Stipe
Oregon Department of Energy
503-378-4926

US Department of Energy Better Buildings Summit
May 27-29, 2015 Washington DC
NW Natural’s CHP Program:
A Team Approach to Meeting
State & National CHP Goals

Solar PV & Solar Thermal
Natural Gas Certified to Responsible Production Standards
Food Waste RNG
Landfill Waste RNG
Agricultural Waste RNG
Waste Water Treatment RNG
Conventional Gas Supply from Multiple Sources
Isolated Communities
District Energy System
NGV Fueling Station
CHP & Fuel Cells Pipeline Maintenance
Best Practices

Oregon SB 844 Overview
Oregon SB 844 (passed in the 2013 session) allows Oregon natural gas utilities to voluntarily develop greenhouse gas reduction projects.
Projects must:
• Reduce net GHG emissions
• Go beyond business as usual
• Result in customer benefits
Utility can receive an incentive for these projects

State Carbon Reduction Potential
Total Natural-Gas Related Abatement Potential 2014-2035 (MMT CO2e)
CHP Market Solicitation Program
Clean Heat Program
Methane Abatement Program
Under Review / Development
Based on findings from the Oregon Department of Energy and Center for Climate Solutions, Energy Trust of Oregon and The Climate Trust.

Policy Context
Obama Administration (Exec Order, August 30, 2012) – Goal of deploying 40 gigawatts of new CHP in US by 2020.
Existing incentives and isolated efforts not moving market.
In the State of Oregon currently only two known CHP installations (excluding bio-mass), with total of 24 MWs.
ICF International, under contract to ODOE, identified 1,457 MWs of technical potential and 319 MWs of economic potential in Oregon.
67

Program Designed to Leverage Multiple Efforts
and to Stack Incentives
NW Natural Incentives for Carbon Reduction
Federal Incentives for Business Investment
US EPA CHP Partnership and US DOE Technical Assistance Program (Washington State University)
State Incentives for Investments in Energy Efficiency
Utility incentives for Electric Generation Efficiency and/or Thermal Efficiency (Administered through the Energy Trust of Oregon)

NW Natural Program
• Enabled by SB844 & motivated by potential to reduce
carbon emissions
• Designed to set common eligibility criteria and a
coordinated approach (project evaluation, monitoring
and verification).
Designed to:
• Promote customer-sponsored CHP projects that are
more efficient than grid supplied electricity generation
• Promote carbon savings on regional basis
• Keep customers motivated over time to continue
achieving energy efficiency and carbon savings

Consistency with Existing Programs
70
Federal Oregon Department
of Energy EIP NW Natural
Energy Trust of
Oregon
Efficiency
Requirement
Basis for
Incentive
Incentive
M&V
Requirement
Effectively 10% more efficient than CCGT at 50% efficiency (60% efficient, produce at
least 20% of its useful energy as electricity and at least 20% as useful thermal energy)
10% more efficient than CCGT Heat Rate
10% more efficient than CCGT Heat Rate
10% more efficient than CCGT Heat Rate
Capital Investment on Projects up to 50 MW
Capital Investment Carbon Reduction Energy Efficiency
10% Investment Tax Credit on first 15 MW
Accelerated Depreciation
35% of project cost over 5 years (28.5% NPV)
(WSU modeled $5 Million maximum per project)
$30/Mte CO2 up to $4.5 Million
per year
$0.08 per annual kWh up to 50 % of
eligible project cost up to $500K
Not Required Not Required
Common reporting to the ETO & NW Natural- M& V
basis for payment of incentive for up to 40 operating quarters
Common reporting to the ETO & NW Natural- Short term
M&V at time of project completion
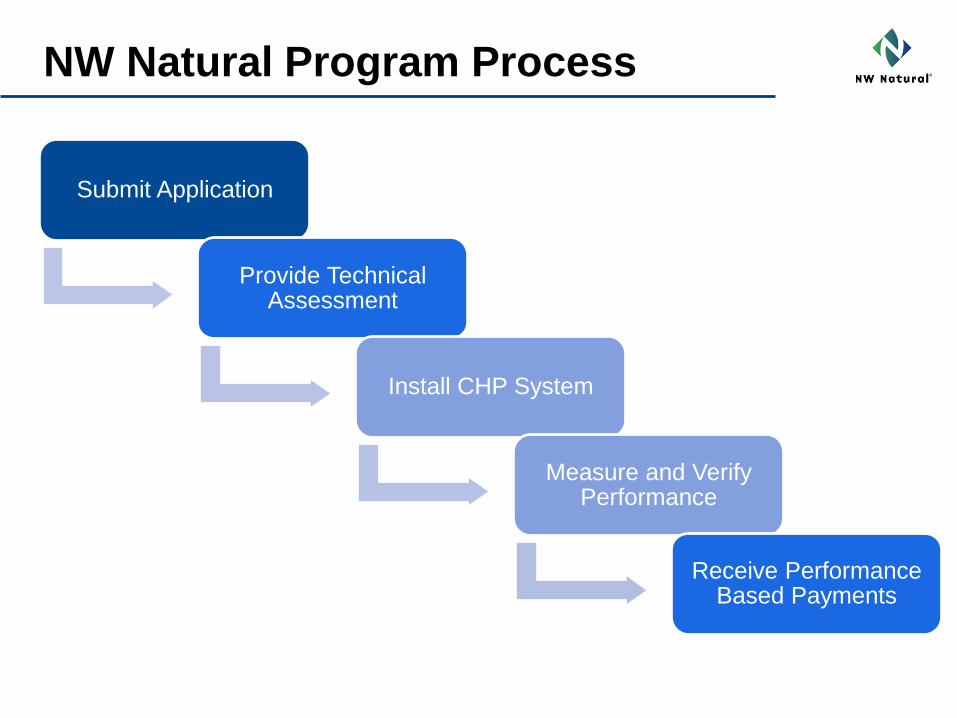
NW Natural Program Process
Submit Application
Provide Technical Assessment
Install CHP System
Measure and Verify Performance
Receive Performance Based Payments
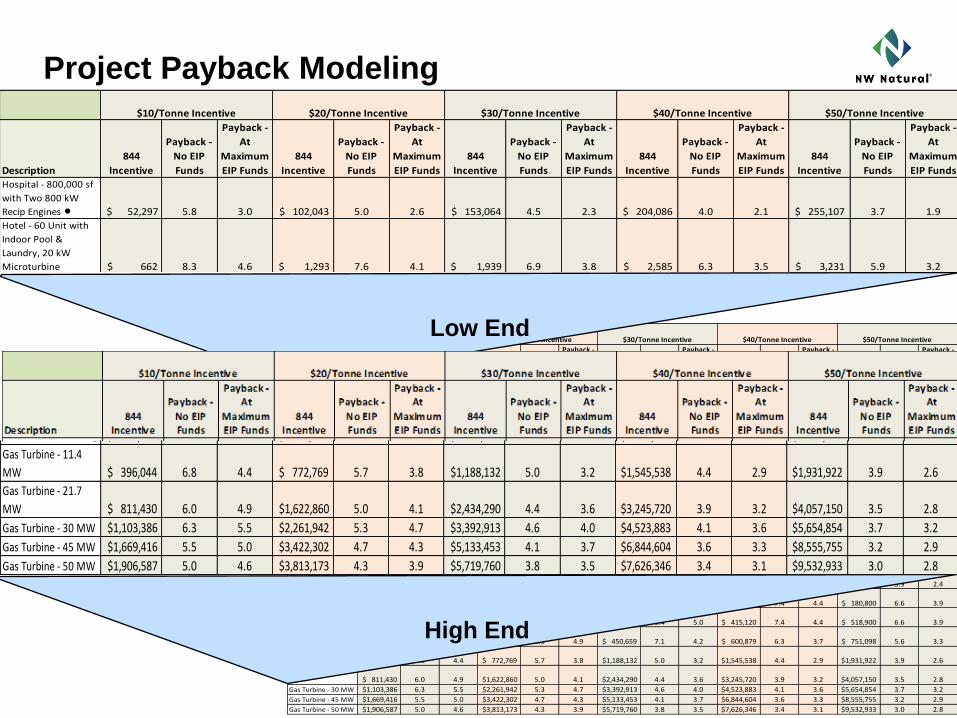
Project Payback Modeling
• Driving to achieve a 3-4 year payback to achieve 30% penetration in segment
identified as “economic”.
• Incentive rate set based on modeling by USDOE, TAP with WSU.
• “High Case” goal of 110 MWs by 2020.
Description
844
Incentive
Payback -
No EIP
Funds
Payback -
At
Maximum
EIP Funds
844
Incentive
Payback -
No EIP
Funds
Payback -
At
Maximum
EIP Funds
844
Incentive
Payback -
No EIP
Funds
Payback -
At
Maximum
EIP Funds
844
Incentive
Payback -
No EIP
Funds
Payback -
At
Maximum
EIP Funds
844
Incentive
Payback -
No EIP
Funds
Payback -
At
Maximum
EIP Funds
Hospital - 800,000 sf
with Two 800 kW
Recip Engines $ 52,297 5.8 3.0 $ 102,043 5.0 2.6 $ 153,064 4.5 2.3 204,086$ 4.0 2.1 255,107$ 3.7 1.9
Hotel - 60 Unit with
Indoor Pool &
Laundry, 20 kW
Microturbine $ 662 8.3 4.6 $ 1,293 7.6 4.1 $ 1,939 6.9 3.8 2,585$ 6.3 3.5 3,231$ 5.9 3.2
Reciprocating Engine -
500 kW $ 21,573 9.5 4.1 $ 42,094 7.1 3.1 $ 63,140 5.7 2.4 84,187$ 4.7 2.0 105,234$ 4.0 1.7
Reciprocating Engine -
800 kW $ 36,908 6.1 2.3 $ 72,016 4.8 1.8 $ 108,025 3.9 1.5 144,033$ 3.4 1.3 180,041$ 2.9 1.1
Reciprocating Engine -
1 MW $ 45,969 5.8 2.5 $ 91,938 4.6 2.0 $ 137,907 3.9 1.7 183,876$ 3.3 1.4 229,845$ 2.9 1.3
Reciprocating Engine -
2 MW $ 85,164 7.4 3.9 $ 170,329 5.9 3.1 $ 255,493 4.9 2.6 340,658$ 4.2 2.2 425,822$ 3.6 1.9
Reciprocating Engine -
3.3 MW $ 142,003 7.8 4.4 $ 284,006 6.2 3.5 $ 426,010 5.1 2.9 568,013$ 4.4 2.5 710,016$ 3.8 2.2
Reciprocating Engine -
4.3 MW $ 221,226 5.6 3.2 $ 442,453 4.6 2.7 $ 663,679 3.9 2.3 884,906$ 3.4 2.0 1,106,132$ 3.0 1.7
Reciprocating Engine -
9.3 MW $ 391,545 7.4 4.6 $ 783,090 6.0 3.7 $1,174,635 5.1 3.1 1,566,180$ 4.4 2.7 1,957,725$ 3.9 2.4
Gas Turbine - 1.2 MW $ 36,160 11.7 6.9 $ 72,320 9.9 5.8 $ 108,480 8.5 5.0 144,640$ 7.4 4.4 180,800$ 6.6 3.9
Gas Turbine - 3.5 MW $ 103,780 11.7 6.9 $ 207,560 9.8 5.8 $ 311,340 8.4 5.0 415,120$ 7.4 4.4 518,900$ 6.6 3.9
Gas Turbine - 4.6 MW $ 150,220 9.8 5.8 $ 300,439 8.3 4.9 $ 450,659 7.1 4.2 600,879$ 6.3 3.7 751,098$ 5.6 3.3
Gas Turbine - 11.4
MW $ 396,044 6.8 4.4 $ 772,769 5.7 3.8 $1,188,132 5.0 3.2 1,545,538$ 4.4 2.9 1,931,922$ 3.9 2.6
Gas Turbine - 21.7
MW $ 811,430 6.0 4.9 $1,622,860 5.0 4.1 $2,434,290 4.4 3.6 3,245,720$ 3.9 3.2 4,057,150$ 3.5 2.8
Gas Turbine - 30 MW $1,103,386 6.3 5.5 $2,261,942 5.3 4.7 $3,392,913 4.6 4.0 4,523,883$ 4.1 3.6 5,654,854$ 3.7 3.2
Gas Turbine - 45 MW $1,669,416 5.5 5.0 $3,422,302 4.7 4.3 $5,133,453 4.1 3.7 6,844,604$ 3.6 3.3 8,555,755$ 3.2 2.9
Gas Turbine - 50 MW $1,906,587 5.0 4.6 $3,813,173 4.3 3.9 $5,719,760 3.8 3.5 7,626,346$ 3.4 3.1 9,532,933$ 3.0 2.8
$50/Tonne Incentive$10/Tonne Incentive $20/Tonne Incentive $30/Tonne Incentive $40/Tonne IncentiveLow End
High End
Description
844
Incentive
Payback -
No EIP
Funds
Payback -
At
Maximum
EIP Funds
844
Incentive
Payback -
No EIP
Funds
Payback -
At
Maximum
EIP Funds
844
Incentive
Payback -
No EIP
Funds
Payback -
At
Maximum
EIP Funds
844
Incentive
Payback -
No EIP
Funds
Payback -
At
Maximum
EIP Funds
844
Incentive
Payback -
No EIP
Funds
Payback -
At
Maximum
EIP Funds
Hospital - 800,000 sf
with Two 800 kW
Recip Engines $ 52,297 5.8 3.0 $ 102,043 5.0 2.6 $ 153,064 4.5 2.3 204,086$ 4.0 2.1 255,107$ 3.7 1.9
Hotel - 60 Unit with
Indoor Pool &
Laundry, 20 kW
Microturbine $ 662 8.3 4.6 $ 1,293 7.6 4.1 $ 1,939 6.9 3.8 2,585$ 6.3 3.5 3,231$ 5.9 3.2
Reciprocating Engine -
500 kW $ 21,573 9.5 4.1 $ 42,094 7.1 3.1 $ 63,140 5.7 2.4 84,187$ 4.7 2.0 105,234$ 4.0 1.7
Reciprocating Engine -
800 kW $ 36,908 6.1 2.3 $ 72,016 4.8 1.8 $ 108,025 3.9 1.5 144,033$ 3.4 1.3 180,041$ 2.9 1.1
Reciprocating Engine -
1 MW $ 45,969 5.8 2.5 $ 91,938 4.6 2.0 $ 137,907 3.9 1.7 183,876$ 3.3 1.4 229,845$ 2.9 1.3
Reciprocating Engine -
2 MW $ 85,164 7.4 3.9 $ 170,329 5.9 3.1 $ 255,493 4.9 2.6 340,658$ 4.2 2.2 425,822$ 3.6 1.9
Reciprocating Engine -
3.3 MW $ 142,003 7.8 4.4 $ 284,006 6.2 3.5 $ 426,010 5.1 2.9 568,013$ 4.4 2.5 710,016$ 3.8 2.2
Reciprocating Engine -
4.3 MW $ 221,226 5.6 3.2 $ 442,453 4.6 2.7 $ 663,679 3.9 2.3 884,906$ 3.4 2.0 1,106,132$ 3.0 1.7
Reciprocating Engine -
9.3 MW $ 391,545 7.4 4.6 $ 783,090 6.0 3.7 $1,174,635 5.1 3.1 1,566,180$ 4.4 2.7 1,957,725$ 3.9 2.4
Gas Turbine - 1.2 MW $ 36,160 11.7 6.9 $ 72,320 9.9 5.8 $ 108,480 8.5 5.0 144,640$ 7.4 4.4 180,800$ 6.6 3.9
Gas Turbine - 3.5 MW $ 103,780 11.7 6.9 $ 207,560 9.8 5.8 $ 311,340 8.4 5.0 415,120$ 7.4 4.4 518,900$ 6.6 3.9
Gas Turbine - 4.6 MW $ 150,220 9.8 5.8 $ 300,439 8.3 4.9 $ 450,659 7.1 4.2 600,879$ 6.3 3.7 751,098$ 5.6 3.3
Gas Turbine - 11.4
MW $ 396,044 6.8 4.4 $ 772,769 5.7 3.8 $1,188,132 5.0 3.2 1,545,538$ 4.4 2.9 1,931,922$ 3.9 2.6
Gas Turbine - 21.7
MW $ 811,430 6.0 4.9 $1,622,860 5.0 4.1 $2,434,290 4.4 3.6 3,245,720$ 3.9 3.2 4,057,150$ 3.5 2.8
Gas Turbine - 30 MW $1,103,386 6.3 5.5 $2,261,942 5.3 4.7 $3,392,913 4.6 4.0 4,523,883$ 4.1 3.6 5,654,854$ 3.7 3.2
Gas Turbine - 45 MW $1,669,416 5.5 5.0 $3,422,302 4.7 4.3 $5,133,453 4.1 3.7 6,844,604$ 3.6 3.3 8,555,755$ 3.2 2.9
Gas Turbine - 50 MW $1,906,587 5.0 4.6 $3,813,173 4.3 3.9 $5,719,760 3.8 3.5 7,626,346$ 3.4 3.1 9,532,933$ 3.0 2.8
$50/Tonne Incentive$10/Tonne Incentive $20/Tonne Incentive $30/Tonne Incentive $40/Tonne Incentive

NW Natural Program
Potential Size of NWN Opportunity
• Technical potential: 1,457 MWs (from ICF Study)
• Economic potential: 319 MW (although decreasing due to
changes in forest products)
• Program target: approx. 110 MW by 2020
• Carbon benefit: approx 260,000 tons CO2e/year at full build out
Broader Application
• National challenge to “crack the nut” on CHP
• Purposefully built using national tools (US DOE modeling, eGRID
emissions, etc.)
• Most powerful to have national program that allows multi-state
industrial customers access to CHP

Questions & Opportunities
Bill Edmonds Director, Environmental Management & Sustainability NW Natural


