Aerosol Dynamics: Applications in Respiratory Drug Delivery by Emadeddin Javaheri A thesis submitted in partial fulfillment of the requirements for the degree of Doctor of Philosophy Department of Mechanical Engineering University of Alberta c ⃝ Emadeddin Javaheri, 2014
Transcript
Aerosol Dynamics:
Applications in Respiratory Drug Delivery
by
Emadeddin Javaheri
A thesis submitted in partial fulfillment of the requirements for the degree of
Doctor of Philosophy
Department of Mechanical Engineering
University of Alberta
c⃝ Emadeddin Javaheri, 2014
Abstract
This study comprises four integral parts. Each part focuses on one aspect of the
general problem of drug delivery by respiration. The morphological features of
human respiratory tract, the dynamics of inhaled pharmaceutical particles, and the
mechanics of inhaler devices are particularly taken into consideration.
In the first part, an idealized geometry of the infant nasal airways is developed
with the goal of mimicking the average inertial filtration of aerosols by the nasal
passages. Paramount geometrical features of 10 previously published nasal replicas
of infants aged 3–18 months have been considered in creating the idealized version.
A series of overall deposition measurements have been carried out in the idealized
replica over a range of particle sizes and breathing patterns. A satisfactory agree-
ment was observed between deposition data for the idealized geometry and those
from 10 in vitro subjects.
In the second part, the effect of using helium–oxygen mixture instead of air on
hygroscopic size change of inhaled droplets is investigated, with the focus on the fa-
vorable transport properties of helium-oxygen. Initially isotonic saline droplets with
lognormal size distribution are considered. The effect of mass fraction of the inhaled
droplets is highlighted. For high mass fraction, evaporation of smaller droplets satu-
rates the carrier gas, and prevents the evaporation of larger droplets, so hygroscopic
effects are believed to be of marginal importance regardless of the carrier gas. In
contrast, for medium and low mass fractions, the carrier gas remains less affected by
the dispersed phase, and larger droplets are more likely to shrink and pass through
the upper airways. In this case, the effects of the physical properties of the carrier
gas are more pronounced.
ii
In the third part, the problem of hygroscopic size change of nebulized aerosols is
considered, and two approaches to size manipulation of saline droplets are investi-
gated. First, heating the aerosol stream, and second, adding solid sodium-chloride
particles to the aerosol stream. The two approaches are aimed at altering the vapor
pressure balance between the surface of the droplets and their carrier gas. These
processes help the droplets which are larger than optimal to evaporate and shrink,
thereby producing desirable droplets for drug delivery, which have less deposition in
the extra-thoracic airways and more deposition in the alveolar region of the lung.
In the fourth part, the dynamic equation for the flocculation and upward drift of
the suspended drug particles within the canister of a metered dose inhaler is solved
numerically. The technique employed is based upon discretizing the particle size
distribution using orthogonal collocation on finite elements. This is combined with
a finite difference discretization of the canister geometry in the axial direction, and
an explicit Runge-Kutta-Fehlberg time marching scheme. The solution represents
the particle size distribution as a function of time and position within the canister.
The method allows prediction of the effects of the initial conditions and physical
properties of the suspension on its dynamic behavior and phase separation.
iii
Preface
This thesis is an original work by Emadeddin Javaheri. Chapter 2 of this the-
sis has been published as E. Javaheri, L. Golshahi, and W.H. Finlay, 2013. “An
idealized geometry that mimics average infant nasal airway deposition,” Journal
of Aerosol Science, vol. 55, 137–148. I was responsible for the development of the
idealized geometry as well as the manuscript composition. L. Golshahi assisted in
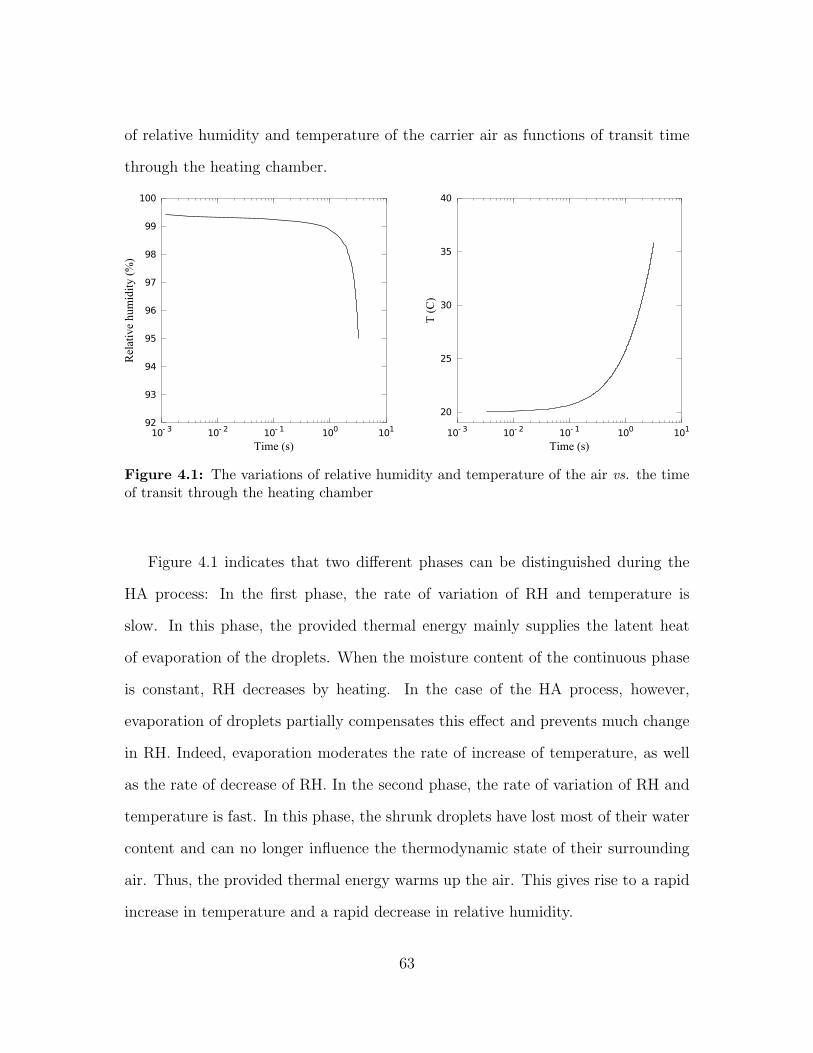
measuring deposition of particles in the geometry, and contributed to manuscript
edits.
Chapter 3 of this thesis has been published as E. Javaheri, F.M. Shemirani,
M. Pichelin, I.M. Katz, G. Caillibotte, R. Vehring, and W.H. Finlay, 2013. “De-
position modeling of hygroscopic saline aerosols in the human respiratory tract:
Comparison between air and helium–oxygen as carrier gases,” Journal of Aerosol
Science, vol. 64, 81–93. I was responsible for the numerical simulation (develop-
ing a computational code) as well as the manuscript composition. F.M. Shemirani
assisted in measuring deposition of stable particles inhaled with helium–oxygen,
and contributed to manuscript edits. M. Pichelin, I.M. Katz, G. Caillibotte, and
R. Vehring were all involved with concept formation, and also helped edit and revise
the manuscript.
Chapter 4 of this thesis has been published as E. Javaheri, and W.H. Finlay,
2013. “Size manipulation of hygroscopic saline droplets: Application to respiratory
drug delivery,” International Journal of Heat and Mass Transfer, vol. 67, 690–695. I
was responsible for the numerical simulation (developing a computational code) as
well as the manuscript composition.
iv
Chapter 5 of this thesis has been published as E. Javaheri, and W.H. Finlay,
2014. “Numerical simulation of flocculation and transport of suspended particles:
Application to metered-dose inhalers,” International Journal of Multiphase Flow,
vol. 64, 28–34. I was responsible for the numerical simulation (developing a compu-
tational code) as well as the manuscript composition.
In all the aforementioned publications W.H. Finlay was the supervisory author
and was involved with concept formation and manuscript composition.
v
Dedication
To my beloved wife Sara
vi
Acknowledgement
I would like to express my deepest appreciation to my supervisor Professor
Dr. Warren H. Finlay, you have been a tremendous mentor for me. I would like
to thank you for encouraging my research, and also for your supportive attitude.
Without your supervision and constant help this dissertation would not have been
possible. A special thanks to Dr. Reinhard Vehring for valuable discussions and
useful suggestions, and to Dr. Carlos Lange for serving as my committee member.
vii
Contents
1 Introduction 1
2 An idealized geometry that mimics average infant nasal airway de-
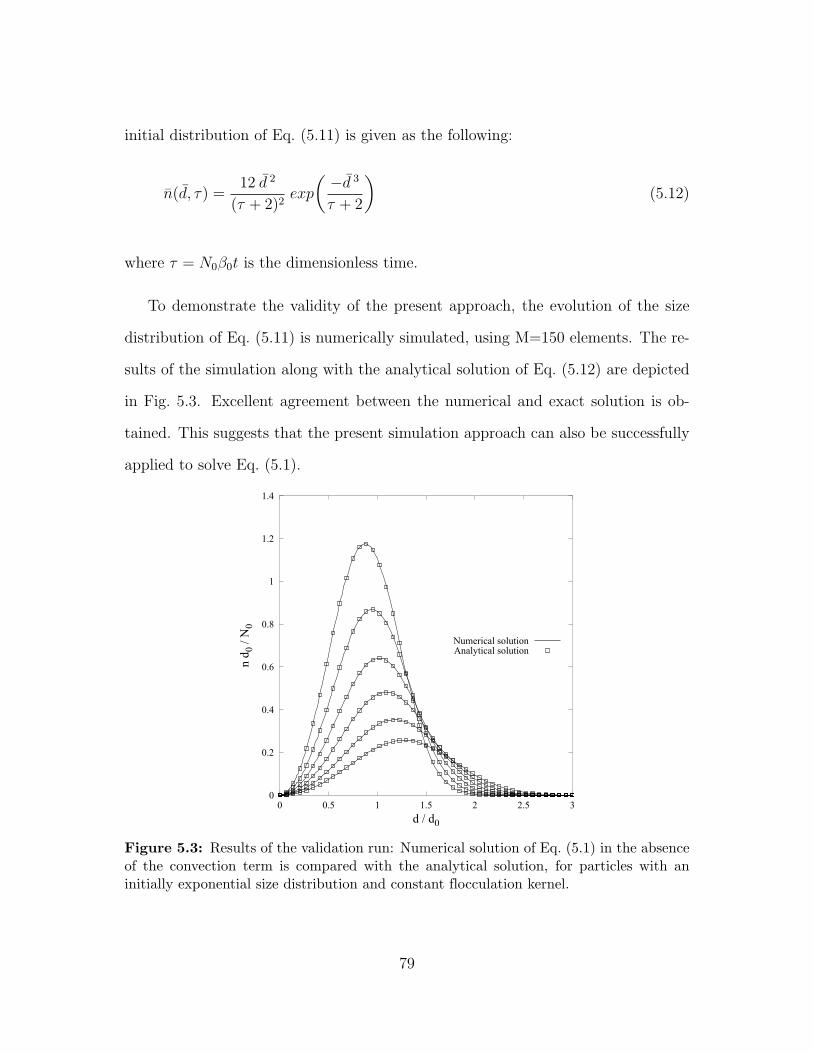
5.9 Variations of the size distribution at the location z = 0.8 for case 1,
during the first few minutes. . . . . . . . . . . . . . . . . . . . . . . 86
xvii
1. Introduction
The material of this thesis is organized in four parts, contained in chapters 2 to 5.
Each part tackles a challenge in respiratory drug delivery.
In the second Chapter, an idealized geometry is developed that mimics the av-
erage deposition of micrometer-sized particles in the extrathoracic nasal airways of
human infant. The extrathoracic airways behave somewhat like a coarse filter dur-
ing inhalation of aerosol particles. However, morphological aspects strongly affect
the characteristics of deposition in these airways. These aspects depend on the age,
gender, race, health and certain physical features. Measured deposition data are
scattered over a wide range due to inter-subject variability (Stahlhofen et al., 1989).
Efforts have been made to eliminate or decrease the effect of inter-subject variability
on the deposition data and collapse the data points on a single plot (Cheng, 2003;
Storey-Bishoff et al., 2008; Garcia et al., 2009; Golshahi et al., 2010).
Of particular interest is the deposition of micrometer-sized pharmaceutical and
environmental toxic aerosols in the upper airways. For particle sizes larger than
approximately a half micrometer, this is controlled by inertial impaction (Cheng,
2003), and is traditionally reported via the impaction parameter d2aQ where da is the
aerodynamic diameter and Q is the volume flow rate (Yu et al., 1981). Although this
form of impaction parameter is widely accepted, it does not collapse the scattered
data, even for a single subject (Stahlhofen et al., 1989).
1
Pressure drop across the airway depends on the mass flow rate as well as the
shape and size of the airway. Thus, if pressure drop is included in the impaction
parameter, these factors will be indirectly considered. In this way, d2a ∆p originally
suggested by Hounam et al. (1971), could be used as an impaction-related parameter.
While pressure drop is not available for most existing deposition studies, Storey-
Bishoff et al. (2008); Garcia et al. (2009); Golshahi et al. (2010, 2011) found that
inclusion of pressure drop in an inertial parameter did appreciably reduce the scatter
of deposition data in child nasal airways.
Another alternative for impaction parameter, which may effectively decrease the
effects of inter-subject variability, is a combination of Reynolds and Stokes dimen-
sionless numbers in the form Reα Stkβ. In defining Reynolds and Stokes numbers,
a length scale must be specified. While the choice of length scale depends on the
shape of the airway, for the oral airway, which is quasi-circular in many cross sec-
tions, Grgic et al. (2004a) found that the square root of the volume over the length
of the airway provides an excellent collapse of oral deposition data. For the nasal
airway, Swift (1991) used the cross sectional area at the site of maximum velocity
(the nasal valve) to determine the length scale.
To further collapse inter-subject variability, one may plot deposition data vs. an
impaction parameter containing Reynolds and Stokes numbers as well as a length
scale of the airway. In other words, an extra geometric factor, beyond Reynolds and
Stokes numbers, could be considered. This length scale also depends on the shape
of the airway, and should be similar to that which is used in definition of Reynolds
and Stokes numbers. Storey-Bishoff et al. (2008) found that airway volume divided
by airway surface area best collapses the deposition data in infant nasal airways for
micrometer- sized particles.
2
All the aforementioned approaches can reduce the scatter of data to some extent.
However, as long as one deals with several subjects or replicas, deposition data can-
not be collapsed exactly onto a single unique characteristic curve. An alternative
paradigm is to construct a representative idealized airway to capture average depo-
sition. Regarding the effects of passage geometry, there are some cardinal features
that dominate deposition. Once these features are captured in a unique geometry,
the deposition characteristic for such geometry could be considered as an average
representation of the real airways. This stimulates development of simplified ideal-
ized geometries for particular segments of the respiratory tract.
The idealized adult oral airway of Stapleton and Finlay (1997) exemplifies the
possibility of developing idealized airways. This model is widely accepted and ap-
plied as typical of oral airway geometries and its utility in the study of the pharma-
ceutical aerosol administration is well established (Stapleton et al., 2000; DeHaan
and Finlay, 2001; Grgic et al., 2004b; Wang et al., 2006; Brouns et al., 2007; Coates
et al., 2007; Jin et al., 2007; Mitsakou et al., 2007; Zhang et al., 2007; Zhou et al.,
2011).
The second Chapter is aimed at developing an idealized geometry for infant nasal
airways. Considering the existence of several realistic replicas as well as their cor-
responding deposition data (Swift, 1991; Cheng et al., 1995; Janssens et al., 2001;
Mitchell, 2008; Storey-Bishoff et al., 2008; Laube et al., 2010), constructing a new
idealized model for infant nasal airway is attractive. The importance of studying the
infant nasal geometry is underlined by the fact that infants tend to breathe through
the nose more than other age groups, partly because this facilitates breathing while
breast feeding. (Sasaki et al., 1977; Becquemin et al., 1991; Amirav and Newhouse,
2012). Furthermore, in vitro deposition measurements in realistic airways neces-
3
sitate using computed tomography scans, which produce harmful radiation, and
especially for the case of infants, should be performed only when absolutely neces-
sary. This may be considered as a further advantage of an idealized geometry as a
reference airway model.
Developing an idealized geometry is inherently a heuristic task, i.e., no standard
algorithm exists for producing an idealized version representing a number of real
geometries. In fact, design of an idealized geometry is a compromise between sim-
plicity and exactness. A possible strategy is to explore many subjects, and calculate
a generalized average for each cross section, and build the average geometry based
on the average cross sections (Liu et al., 2009). Such an idealized geometry can
mimic average deposition in the real subjects, but, due to its complicated cross sec-
tions, it is difficult or impossible to manufacture using inexpensive, readily available
methods that would be amenable to specification in pharmacopeial standards. An
alternative strategy, which is adopted in the second Chapter, is to simplify the fea-
tures which do not significantly influence particle deposition but make the geometry
unnecessarily convoluted.
In order to address the paramount geometrical characteristics of infant nasal air-
ways, which dominate trans-nasal particle impaction, a simplified idealized geometry
is developed, thereby providing a reference model to study the inertial filtration ef-
fects of the infant nasal passage. Deposition measurements, for different breathing
patterns and particle sizes, are conducted to ensure that the deposition characteris-
tics of the idealized airway agree with the average of the in vitro inertial deposition
data provided by Storey-Bishoff et al. (2008).
The third Chapter deals with hygroscopic size change of inhaled droplets, and
4
underlines the effects of thermodynamic and transport properties of carrier gas on
these size changes.
The particle diameters of inhaled hygroscopic aerosols can change due to evap-
oration and condensation. This results in transfer of heat and vapor between the
particles or droplets and the surrounding gas. The driving force of this process is
the vapor concentration difference between the particle or droplet surface and the
bulk gas. Either volatile droplets or initially solid hygroscopic particles may expe-
rience size changes. Volatile droplets evaporate and shrink because of high vapor
concentration at the immediate vicinity of their surface (Persons et al., 1987; Chan
et al., 1994; Phipps and Gonda, 1994; Finlay and Stapleton, 1995; Finlay et al., 1996;
Finlay, 1998). Hygroscopic particles can instead undergo condensational growth by
absorbing vapor from nearly saturated air in the respiratory passages (Martonen,
1982; Broday and Georgopoulos, 2001; Londahl et al., 2007; Longest and Xi, 2008;
Hindle and Longest, 2012).
When hygroscopic droplets are inspired, the shrinkage or growth as well as the
rate of approach to thermodynamic equilibrium between droplets and the carrier
gas are influenced by the physical properties of the gas. In pharmaceutical aerosol
applications, evaporation of drug-containing droplets could be beneficial because this
can lead to smaller droplet sizes during passage through the upper airways, thereby
reducing unwanted extra-thoracic deposition. This points to the use of alternative
gases with more favorable transport properties than air.
A helium-oxygen mixture is a low density gas with potential advantages in in-
halation therapy (Svartengren et al., 1989; Habib et al., 1999; Goode et al., 2001;
Corcoran and Gamard, 2004), particularly for treating patients with severely ob-
5
structed airways. When drug particles are carried by helium-oxygen, unwanted
deposition in delivery devices decreases (Corcoran et al., 2003). Helium-oxygen
can also lessen undesirable ex vivo losses of aerosol associated with deposition in
breathing supply circuitry with ventilated patients (Goode et al., 2001; Dhand,
2004). Furthermore, when particles are inspired with helium-oxygen, deposition in
the extra-thoracic airways decreases (Gemci et al., 2003; Darquenne and Prisk, 2004;
Peterson et al., 2008); Thus, higher deposition in the lung is expected. The role of
helium-oxygen in respiratory medicine, and the relation between its potential effects
and physical properties has been reviewed by Ari and Fink (2010). Recently, Con-
way et al. (2012) have conducted in-vivo deposition measurements which include
both air and helium-oxygen as carrier gases. Because of the high mass fraction of
droplets, hygroscopic effects are deemed to be insignificant in that study.
The present work focuses instead on hygroscopic effects when helium-oxygen
mixture is the carrier gas. Shrinkage and growth of droplets can be mathematically
modeled using simplified hygroscopic theory (Fuchs, 1959; Mason, 2010). Earlier
models do not account for the effects the droplets have on the surrounding gas
(Persons et al., 1987; Ferron et al., 1988-b; Stapleton et al., 1994). However, trans-
fer of vapor and heat from the surface of the dispersed droplets may considerably
change the temperature and moisture content of the gas. In realistic situations,
the final temperature and humidity of the gas could determine the state of equi-
librium. A more advanced approach is to consider two way coupling in which the
thermodynamic state of the gas may change due to heat and vapor exchange with
the dispersed droplets (Finlay and Stapleton, 1995; Longest and Hindle, 2010).
The present study examines the behavior of initially isotonic hygroscopic aerosols
inhaled into the respiratory tract by applying the methodology provided by Finlay
6
and Stapleton (1995) with several modifications to allow consideration of helium-
oxygen. These modifications include calculation of the coefficients of heat and vapor
transfer between the carrier gas and the airway walls using computational fluid
dynamics simulations in the Alberta idealized upper airway geometry. In addition,
a recently developed dimensionless correlation (Golshahi et al., 2013) for extra-
thoracic deposition during tidal breathing is used. The results allow comparison of
the behavior of inhaled hygroscopic aerosols when helium-oxygen vs. air is used as
the carrier gas.
The fourth Chapter introduces two approaches to controlled evaporation of neb-
ulized volatile droplets. Nebulizers are inhaler devices that provide therapeutic
materials in the form of aqueous solution aerosols. However, the size of some nebu-
lized droplets is not necessarily optimal for drug delivery to the lungs (O’Callaghan
and Barry, 1997; Nerbrink and Dahlback, 1994). Fortunately, smaller droplets can
be obtained by evaporation. The driving force for the evaporation of the aqueous
droplets is the gradient of vapor concentration between the vicinity of the droplet
surface and the surrounding air. Therefore, when the temperature and relative
humidity (RH) at the surface of droplet equal those of the surrounding air, evapora-
tion does not take place. Nevertheless, increasing the temperature of the dispersed
droplets, or decreasing the moisture content of the continuous phase can trigger
evaporation. When an aerosol stream is heated, the vapor concentration at the
surface of the droplets rapidly increases, e.g. the concentration of water vapor at
the flat surface of liquid water at 15◦C is 12.9 g/m3 while at 30◦C it is 30.2 g/m3
(Seinfeld and Pandis, 2006). This is a familiar concept in heating ventilation and
air-conditioning (HVAC) applications and also could be used to adjust the size dis-
7
tribution of aqueous aerosols. Throughout the present study, heating the aerosol
stream will be referred to as the HA approach.
A different way to trigger the evaporation of droplets is to remove water vapor
from the carrier air. This could be performed by adding excipient salt (e.g. sodium
chloride) particles to the aerosol stream. These particles absorb the water vapor and
undergo condensational growth. As a consequence, vapor concentration in the bulk
air decreases and the original saline droplets start to evaporate. Adding excipient
particles to the aerosol stream will be referred to as the EA approach. This was
first developed by Longest and Hindle (2011, 2012).
Alternative size manipulation approaches consider creating submicrometer par-
ticles which effectively pass through the extrathoracic airways, and then increasing
the aerosol size in the thoracic airways to prevent exhalation of the particles. This
may be accomplished by combining the aerosol stream with saturated or supersat-
urated air stream a few degrees above body temperature, or by creating initially
submicrometer particles containing both drug and a hygroscopic excipient. The
former is referred to as the Enhanced Condensational Growth (ECG) (Hindle and
Longest, 2010), and the latter as the Excipient Enhanced Growth (EEG) (Longest
et al., 2012b).
Hygroscopic size changes are accompanied by transfer of mass and heat between
the dispersed droplets and their surrounding air. This yields changes in temperature
and moisture content of the air, i.e. the mass and heat transfer between the phases
are two-way coupled. The higher the mass concentration of the dispersed droplets,
the higher the influence on the surrounding air. Shrinkage and growth of droplets
can be mathematically modeled using simplified hygroscopic theory (Fuchs, 1959;
8
Mason, 2010). Two way coupling can be also modeled using the approach of Finlay
and Stapleton (1995). Subsequent to size manipulation, saline droplets will be in-
spired. They will continue their size changes during progress through the respiratory
airways. Regional deposition of these size varying droplets can be predicted using
the approach of Finlay and Stapleton (1995) and Javaheri et al. (2013b).
Chapter 4 focuses on the dynamics of droplet shrinkage during the HA and
EA processes, prior to inspiration. The shrunk droplets are supposed to penetrate
deeper into the lung. This is examined using the approach given by Javaheri et al.
(2013b).
The fifth Chapter introduces a numerical approach to simulate flocculation and
convective transport of drug particles suspended in a liquid propellant, within the
canister of a pressurized metered-dose inhaler (MDI), the most commonly used
device for respiratory drug delivery (Hickey and Evans, 1996; Finlay, 2001). Within
the canister of an MDI, drug is either dissolved or colloidally suspended in a liquid
propellant. The latter is the subject of Chapter 5. The ability of a drug-propellant
suspension to remain in its original state, i.e. its stability, is critical because any
change may interfere with the consistency of the drug delivery. Such changes may
include any variation in the drug particle size distribution, and any macroscopic
transport of the particulate phase. Inter-particle collisions and floc formation can
alter the particle size distribution. Relative motion of the dispersed particles, as well
as their natural tendency to decrease the large specific surface area may give rise
to collisions. Thus, a proclivity towards instability is inherent in many suspensions.
However, whether or not particles collide and flocculate is determined by inter-
particle forces.
9
In colloidal systems, inter-particle forces are usually described by the DLVO1
theory (Derjaguin and Landau, 1941; Verwey and Overbeek, 1948). Two types of
particle interactions are considered in this theory: attractive van der Waals force,
and repulsive electrostatic force due to the presence of electrical double layers. Dom-
inance of the repulsive force gives rise to stability, and dominance of the attractive
force causes flocculation and instability. However, in non-aqueous liquids with low
conductivity and low dielectric constant, like propellants, the repulsive forces are
thought to be trivial, mainly because of the insignificance of the electrical double
layer (Albers and Overbeek, 1959a,b; Chen and Levine, 1973; Feat and Levine, 1975,
1976; Johnson, 1996). Thus the electrostatic repulsion is presumed to be negligi-
ble in the present study, and under the dominance of the van der Waals force, the
evolution of an unstable suspension from an arbitrary initial condition is considered.
The van der Waals force, however, is a short range force and decays rapidly
to zero away from the surface of the particle. In fact, within the MDI canister,
particle collision frequency is controlled by two other mechanisms: upward velocity
differential and Brownian motion, and the van der Waals force indeed enhances
these mechanisms.
Simultaneous with flocculation, particles drift upward or sediment under the
effect of gravity. Without reducing generality, only the case in which the true
density of particles is lower than that of propellant, and particles drift upward, is
presented here.
In the present study, flocculation is modeled via the continuous form of the
particle number balance equation of Smoluchowski (Chandrasekhar, 1943; Fried-
1Derjaguin-Landau-Verwey-Overbeek
10
lander, 2000; Benjamin, 2011), and the upward transport of the particulate phase
is described by a convection term. The overall mathematical model is a nonlin-
ear transient partial integro-differential equation, which is a reduced form of the
general dynamic equation (GDE) of aerosols (Gelbard and Seinfeld, 1979; Williams
and Loyalka, 1991; Friedlander, 2000). In reality, the GDE takes many and vari-
ous forms, which typically must be solved numerically. Because of the variety of
the mathematical terms which may appear in the GDE, there is no generally ac-
cepted numerical solution approach. Some classic numerical work on discrete and
continuous forms of the GDE is reported by Gelbard (1979). In the present form of
the GDE, flocculation is the challenging term. Several numerical approaches have
been established to analyze flocculation, including orthogonal collocation on finite
elements (Gelbard and Seinfeld, 1978), cubic splines (Gelbard and Seinfeld, 1978;
Gelbard et al., 1980), sectional representation (Gelbard et al., 1980), modal aerosol
dynamic model (Whitby and McMurry, 1997), to mention a few. A comparative
review of algorithms used to simulate aerosol dynamics is given by Williams and
Loyalka (Williams and Loyalka, 1991) and also by Zhang et al (Zhang et al., 1999).
The method of orthogonal collocation on finite elements (Gelbard and Seinfeld, 1978;
Carey and Finlayson, 1975; De Boor and Swartz, 1973; Douglas and Dupont, 1973)
is used here.
From a particle interaction point of view, the system under consideration is in-
herently unstable. The consequence of instability is phase separation into a concen-
trated particulate phase and a dilute propellant. The goal of the present simulation
is to predict the state of the system, i.e. the particle size distribution as a function
of time and position, and to calculate a characteristic time of phase separation.
11
2. An idealized geometry that mimics
average infant nasal airway deposition
2.1 Introduction
Inter-subject biological variability, due to shape and size differences, is one of the
most challenging aspects in the study of aerosol deposition in the extrathoracic res-
piratory passages. An idealized geometry of the infant nasal airways is developed in
this Chapter, with the goal of mimicking the average inertial filtration of aerosols
by the nasal passages, thereby providing a reference model for aerosol deposition
studies (Javaheri et al., 2013a). Paramount geometrical features of 10 previously
published nasal replicas of infants aged 3–18 months (Storey-Bishoff et al., 2008)
are considered in creating the idealized version. Simplifications are made to features
that do not significantly influence deposition but that make the airway unnecessar-
ily convoluted. A series of overall deposition measurements have been carried out
in the idealized replica over a range of particle sizes and breathing patterns. De-
position data for the idealized geometry are compared with those from 10 in vitro
subjects. Satisfactory agreement between deposition in the idealized and real ge-
ometries suggests that the idealized version can characterize average deposition in
the real airways. The present idealized airway could be useful as a reference geom-
12
etry in experimental and theoretical studies of aerosol delivery through infant nasal
airways.
2.2 Methods
2.2.1 Real nasal geometry
The nasal cavity is separated into two distinct airways by a vertical dividing wall
termed the nasal septum. The nasal cavity is essentially symmetric about the sep-
tum, although during normal breathing, each of the two passages is preferentially
used alternately for several hours at a time. Inhaled air enters the nasal airway
through the nostril and then passes through the nasal valve, which is usually the
narrowest part of the nose. Being the segment with minimum cross-section area, it
acts as a flow limiter. The main nasal passages, with an abrupt increase in cross-
sectional area, are located posterior to the nasal valve. This part of the airway is
mainly shaped by the nasal septum and three projections referred to as the inferior,
middle, and superior turbinates (also called the nasal conchae) (Marieb and Hoehn,
2007). One role of the turbinates is to promote local turbulent mixing. However,
previous studies (Hahn et al., 1993; Keyhani et al., 1995; Schreck et al., 1993) in-
dicate that flow in the adult nasal cavity is mostly laminar during normal resting
breathing. The passages between the nasal conchae are narrower in infants, and
volume flow rates are noticeably lower compared to adults. As a result, flow distur-
bances are damped and turbulence is unlikely. From a heat transfer point of view,
turbinates are extended surfaces which crucially contribute to heat and moisture
transfer from airway walls to the inhaled air. The narrow passages between the
13
Figure 2.1: Schematic of cross section of the nasal cavity.
turbinates are called the meatus. Most inhaled airflow travels between the inferior
turbinate and the middle turbinate (through the middle meatus). The maxillary
sinuses lie lateral to the middle meatus. Figure 2.1 schematically illustrates a cross
section of the nasal cavity, with physiological nomenclature (Proctor and Andersen,
1982).
In some subjects, particularly in infants, one or both of the maxillary sinuses and
middle meatus are connected through an orifice (Storey-Bishoff et al., 2008). The
inclusion of sinuses makes the geometry of this region highly convoluted. Turbinates
direct the air stream into the nasopharynx. There is no separating wall in the
nasopharynx, so the airflows coming from left and right nasal passages are mixed
together here. From a fluid dynamics point of view, the nasopharynx is a 90 degree
bend which directs air towards the larynx and trachea.
While different regions of adult and infant nasal airways can be qualitatively
described in nearly the same way, the overall morphology of the infant nasal airway
is quite different from that of adults. In contrast to adults, the cross section of min-
imum area in infant nasal airway is noticeably larger than that of the oral airway,
14
mainly because of the close distance between the epiglottis and palate (Amirav and
Newhouse, 2012). The infant nasal airway is in some sense optimized to facilitate
nose breathing. This can partially explain the anatomical differences. Partly be-
cause of these differences, effective drug delivery to infants and younger children
requires special considerations (Becquemin et al., 1991; Phalen and Oldham, 2001;
Bennett et al., 2008).
2.2.2 Idealized nasal geometry for infants
Deposition of micrometer-sized particles in the extrathoracic airway is dominated
by inertial impaction. Impaction of particles is characterized by two dimensionless
numbers that arise from a dimensional analysis of the governing equations i.e. the
Reynolds and Stokes numbers. The Reynolds number is the ratio of inertial fluid
forces to viscous fluid forces. The Stokes number is the ratio of stopping distance
of a particle in the flow to a characteristic length in the geometry. The deviation of
particles from curved streamlines is of order of magnitude given by their stopping
distance. Thus, the higher the Stokes number the more the probability of deposition.
As a general rule, all geometrical features that bend the streamlines may cause the
particles to deviate from them, thereby depositing on the airway walls. Therefore,
such features should be taken into consideration in the idealized model.
We started our design by extensively exploring the nasal geometries of 10 infants
aged 3–18 months. The geometries were obtained by Storey-Bishoff et al. (2008)
from computed tomography (CT) scans of seven male and three female infants.
These CT scan images had been used subsequently by Storey-Bishoff et al. (2008) for
preparing STL files, fabricating the nasal passage replicas, and measuring deposition
15
Figure 2.2: Placement of the 24 cross sections on a real airway.
of micrometer-sized particles in them.
In order to create the idealized geometry, cross sections of different regions of
the real airways and face were surveyed using ScanTo3D (SolidWorks Premium,
Dassault Systemes). The previously prepared digitized data were imported into
SolidWorks in the form of STL files. Cross-sectional curves on the point cloud
data were created, and then used as reference to build a parametric model. In an
attempt to determine the primary features of the real geometries, and design the
idealized version, 24 cross sections of each subject were explored. Segments with
more complexity were surveyed using preferentially more cross sections. Figure 2.2
shows the placement of the 24 cross sections on a real airway.
Care was taken to maintain the primary features. Idealized cross sections were
created with the aid of two dimensional splines, and the idealized airway took shape
based on these cross sections. SolidWorks uses non-uniform rational basis spline
(NURBS), which is a generalization of both B-spline and Bezier curve and is com-
monly used in computer-aided- design (CAD) software. See Lombard (2008) for a
16
Figure 2.3: Proximal region of the idealized geometry. The markings on the ruler indicate1 mm.
complete discussion on using splines for complex shape modeling in SolidWorks.
The idealized model extends from the nostril entrance to just past the larynx.
Also, the surface of the face from the chin to forehead is included. The nasal
cavities are bounded medially by the nasal septum, which is a vertical cartilage.
The idealized nasal septum is exactly midline, separating the left and right sides of
the nose into passageways of equal size. Although a normal septum is neither off-
middle nor deviated, because septum cartilage is thicker at the margins than at the
center, its surface is not quite smooth. However, septum bumps do not compare in
scale with the major geometrical features that form the air flow, so that deviation of
the septum surface from flatness is not expected to impact the curvature of the flow
streamlines. Therefore, the idealized nasal septum was created as a flat plane. The
first region of the idealized nasal airway is depicted in Fig. 2.3 with three different
views. This proximal region includes the nostril and the nasal valve.
As in the real airways, the turbinate region is designed to be located posterior
to the nasal valve. In most of the 10 subjects, a connection between the maxillary
sinus and middle meatus was observed in the form of an orifice or a narrow slit
17
Figure 2.4: Two different cross sections from real airways in the turbinate region fromthe Storey-Bishoff et al. (2008) subjects: one with maxillary sinus and middle meatus notconnected (left) compared to one with maxillary sinus and middle meatus connected inthe left passage (right).
(see Fig. 2.4). In addition to its small opening, this connection is perpendicular to
the direction of the main flow. Therefore, the effect of sinuses on normal inertial
deposition was deemed to be trivial and they are excluded from the idealized airway.
Figure 2.4 is the cross-sectional view of the nasal cavity in the turbinate region, for
two different real replicas. This figure illustrates the possibility of interconnection
between maxillary sinus and middle meatus.
Nasal conchae are projections with irregular shape. Accordingly, meatus airways,
the narrow passages between nasal conchae, have irregular cross sections. Flow in
these narrow airways is laminar, and the streamlines have little curvature. Thus,
the irregularity of the nasal meatus is deemed not to have a marked contribution
to total deposition, and they have been simplified in the idealized geometry to be
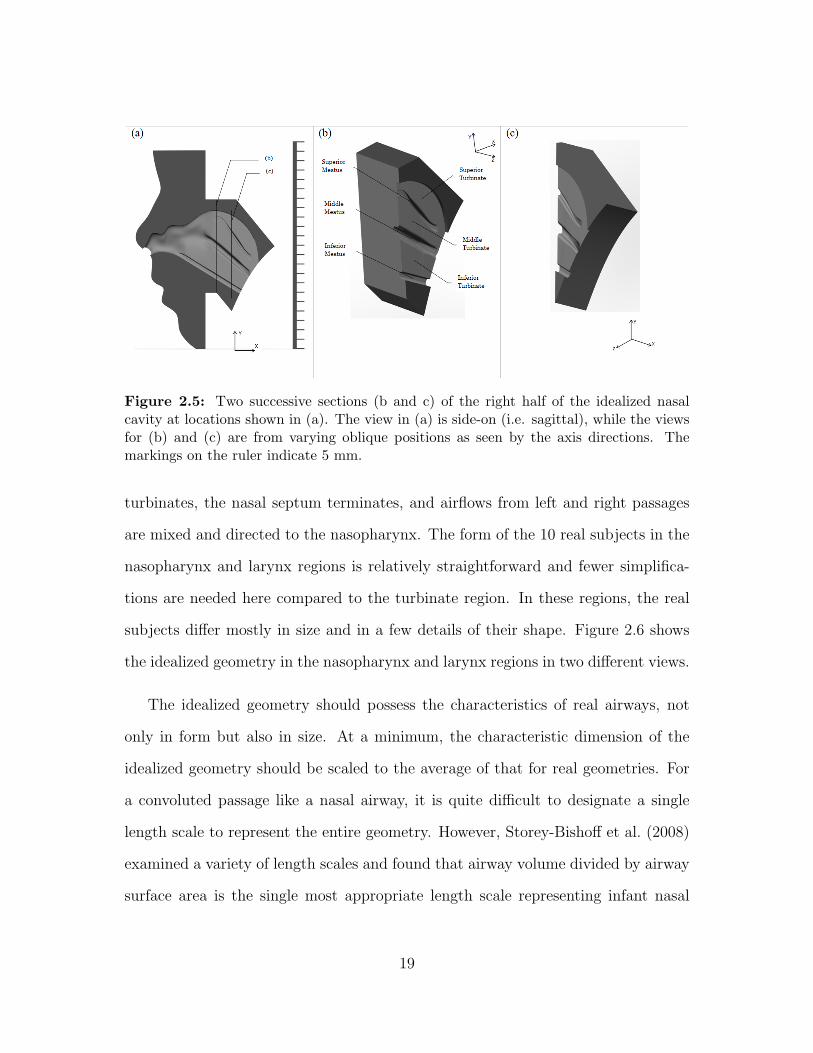
airways of regular cross section. Figure 2.5 depicts the general form of the idealized
nasal cavity. Sections (b) and (c) illustrate the idealized configuration of the nasal
conchae and meatus airways.
The turbinate region is the region of highest geometric complexity. Distal to the
18
Figure 2.5: Two successive sections (b and c) of the right half of the idealized nasalcavity at locations shown in (a). The view in (a) is side-on (i.e. sagittal), while the viewsfor (b) and (c) are from varying oblique positions as seen by the axis directions. Themarkings on the ruler indicate 5 mm.
turbinates, the nasal septum terminates, and airflows from left and right passages
are mixed and directed to the nasopharynx. The form of the 10 real subjects in the
nasopharynx and larynx regions is relatively straightforward and fewer simplifica-
tions are needed here compared to the turbinate region. In these regions, the real
subjects differ mostly in size and in a few details of their shape. Figure 2.6 shows
the idealized geometry in the nasopharynx and larynx regions in two different views.
The idealized geometry should possess the characteristics of real airways, not
only in form but also in size. At a minimum, the characteristic dimension of the
idealized geometry should be scaled to the average of that for real geometries. For
a convoluted passage like a nasal airway, it is quite difficult to designate a single
length scale to represent the entire geometry. However, Storey-Bishoff et al. (2008)
examined a variety of length scales and found that airway volume divided by airway
surface area is the single most appropriate length scale representing infant nasal
19
Figure 2.6: The right half of the idealized nasopharynx and larynx: (a) side-on (sagittal)view and (b) anterior oblique view as seen by the axis directions. The markings on theruler indicate 5 mm.
Table 2.1: Comparison of the geometrical dimensions of the idealized replica with averagegeometrical dimensions in 10 real replicas, given as mean ± standard deviation (n=10).Here, Dh denotes hydraulic diameter, Amin denotes the minimum cross sectional areataken perpendicular to expected airflow, V is the volume of the airway, and As is the areaof the interior surface.
airway dimension as far as aerosol deposition of micrometer-sized particles is con-
cerned. They also reported a value of 1.2 mm for the average of this length scale
for their 10 replicas. This length scale is adopted in the current study with a trivial
modification. In particular, to be quantitatively more sensible, the former length
scale is redefined by multiplying by 4.0. This corresponds to the average hydraulic
diameter for the overall airway, and its value is much closer to the actual physical
airway sizes.
The present idealized geometry was scaled to have an average hydraulic diameter
equal to the average value of the 10 Storey-Bishoff et al. (2008) subjects. Further-
more, to calculate the dimensionless Reynolds and Stokes numbers, the average of
hydraulic diameter is considered here as the length scale for the overall airway.
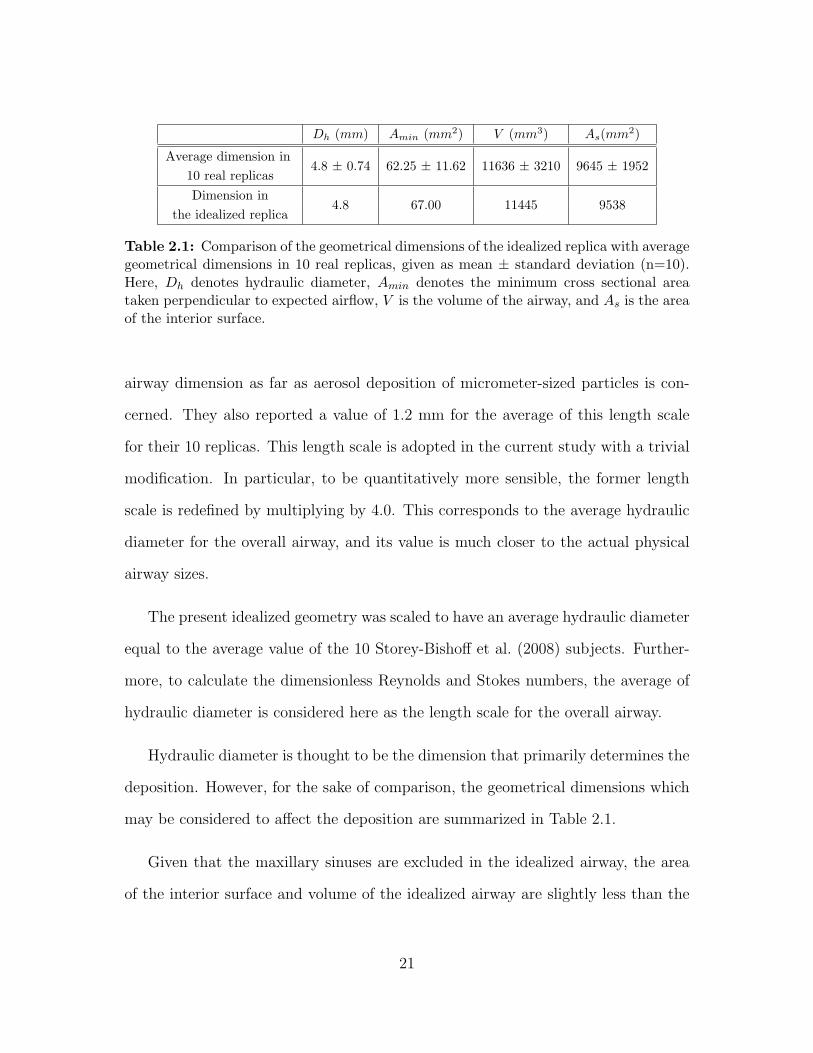
Hydraulic diameter is thought to be the dimension that primarily determines the
deposition. However, for the sake of comparison, the geometrical dimensions which
may be considered to affect the deposition are summarized in Table 2.1.
Given that the maxillary sinuses are excluded in the idealized airway, the area
of the interior surface and volume of the idealized airway are slightly less than the
21
Figure 2.7: Finalized idealized infant nasal geometry: (a and b) internal airway anatomyand (c) The exterior of the replica with idealized face prepared for deposition measure-ments. The minor markings on the ruler indicate 1 mm.
average of the real airways. Also, the minimum cross-sectional area in the idealized
geometry is just 8% more than the average. However, the average value of the
hydraulic diameter in 10 realistic replicas, which is the cardinal dimension, is equal
to the hydraulic diameter of the idealized airway.
Figure 2.7 depicts the final idealized internal airway geometry as well as the
exterior of the model that includes an idealized face prepared for deposition mea-
surements.
Rapid prototyping (Invision SR, 3D Systems, USA using Visijet SR200) was used
to produce the idealized replica from the 3D computer model. In order to conduct
the preliminary deposition measurements, we built the replica out of plastic and
used jojoba oil particles for which the effect of charge is not considered to be an
issue. Subsequently, to test the replica with charged particles and to conduct further
complementary tests, a metal replica was built.
22
The roughness of the interior surfaces may considerably impact the fluid flow and
deposition through the airways (Kelly et al., 2004; Schroeter et al., 2011). Deposition
in the present idealized geometry is compared with those of 10 real replicas. The
idealized and real replicas are all made from the same material and using the same
build process; thus, in terms of surface roughness, they can be considered similar.
Therefore, we do not expect any deposition discrepancy due to surface roughness
differences. Previous publications have also shown good agreement with in vivo data
using the present build process and materials in adults (Golshahi et al., 2011).
2.2.3 Deposition measurement
Subsequent to design and construction, deposition of micrometer-sized particles in
the idealized geometry was measured. For this purpose, aerosol laden air was pulled
through the replica with sinusoidal flow patterns representing tidal infant breathing.
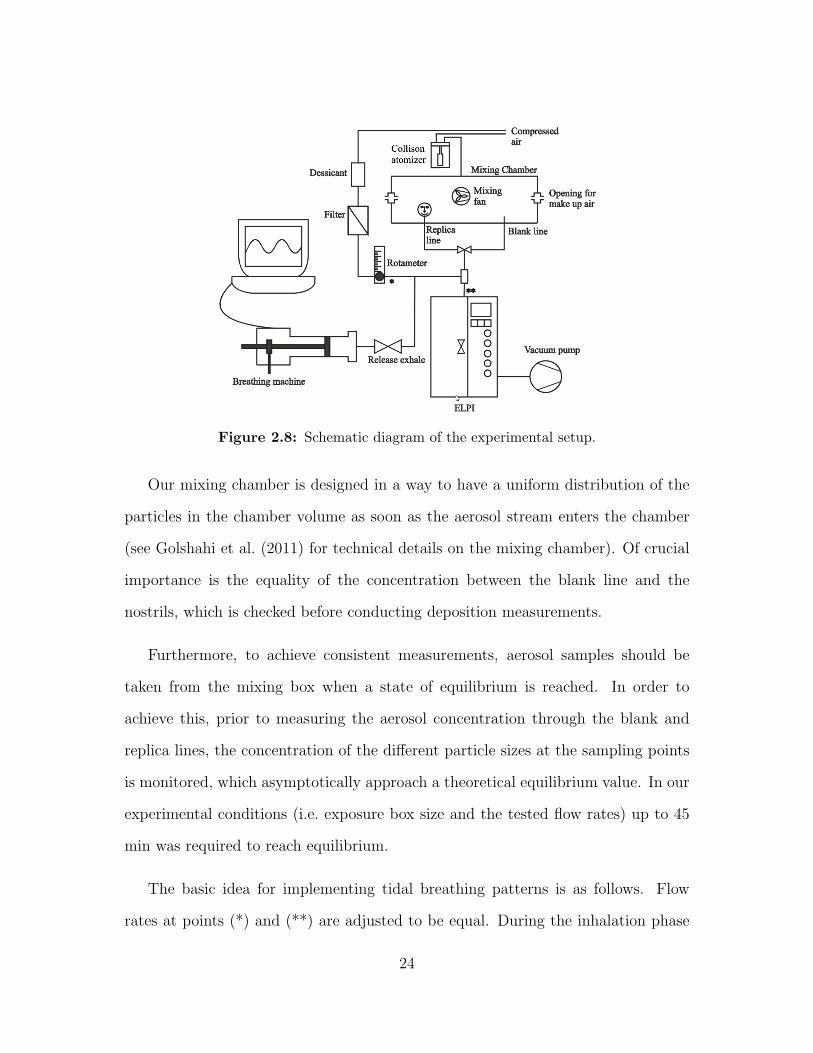
Figure 2.8 depicts a schematic of the experimental setup. Briefly, a collision atom-
izer generates particles from jojoba oil. The resulting aerosol flows into a mixing
chamber. The replica, located inside the chamber, inhales the aerosol. A sinusoidal
flow pattern is generated by an in-house computer controlled pulmonary waveform
generator (breathing machine), and an electrical low pressure impactor (ELPI) mea-
sures the average number concentration of the aerosol streams.
Regarding particle concentration in the mixing chamber, two significant con-
cepts should be considered: uniformity and equilibrium. In the state of uniformity,
the concentration and distribution of the particles does not change from point to
point inside the chamber, whereas in the state of equilibrium concentration and
distribution of the particles in a particular point remain unchanged through time.
23
Figure 2.8: Schematic diagram of the experimental setup.
Our mixing chamber is designed in a way to have a uniform distribution of the
particles in the chamber volume as soon as the aerosol stream enters the chamber
(see Golshahi et al. (2011) for technical details on the mixing chamber). Of crucial
importance is the equality of the concentration between the blank line and the
nostrils, which is checked before conducting deposition measurements.
Furthermore, to achieve consistent measurements, aerosol samples should be
taken from the mixing box when a state of equilibrium is reached. In order to
achieve this, prior to measuring the aerosol concentration through the blank and
replica lines, the concentration of the different particle sizes at the sampling points
is monitored, which asymptotically approach a theoretical equilibrium value. In our
experimental conditions (i.e. exposure box size and the tested flow rates) up to 45
min was required to reach equilibrium.
The basic idea for implementing tidal breathing patterns is as follows. Flow
rates at points (*) and (**) are adjusted to be equal. During the inhalation phase
24
of the breathing machine, the flow which is drawn by the breathing machine is
simultaneously compensated by the replica line (or alternatively blank line). As a
result, the flow pattern generated by the breathing machine is indirectly induced
to the replica. During its exhalation phase, the breathing machine does not cause
flow in the system, because its exhalation flow rate is released by a valve. The
inspiration:expiration duty cycle I:E was 0.5 as in Storey-Bishoff et al. (2008). Flow
rates in the lines were measured using a mass flow meter (4143 series, TSI, Shoreview,
MN).
In order to determine deposition in the idealized replica, average number con-
centration of the aerosol streams from the blank line and replica line were measured
at discrete particle size ranges using the ELPI, and then subtracted from each other.
For more details on the experimental setup see Storey-Bishoff et al. (2008); Golshahi
et al. (2011).
2.3 Results and discussion
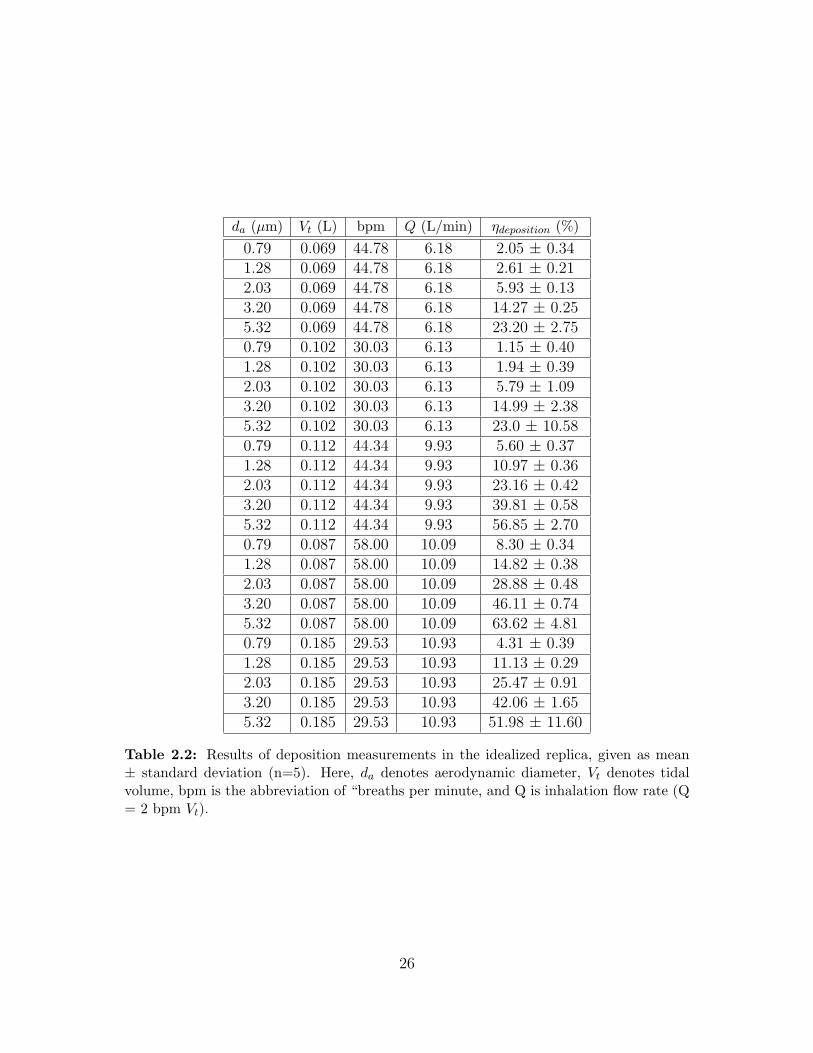
The results of deposition measurements in the idealized geometry as well as particle
sizes and breathing patterns are summarized in Table 2.2.
In Table 2.2, Q is the average flow rate during the inhalation period only, which
here is the same as the average flow rate since we use equal inhalation and exhalation
times in order to be consistent with Storey-Bishoff et al. (2008).
Deposition data for the idealized geometry as well as from Storey-Bishoff et al.
(2008) are depicted vs. impaction parameter, d2aQ, in Fig. 2.9. As reported by
Storey-Bishoff et al. (2008), a great deal of inter-subject variability is evident, mainly
Table 2.2: Results of deposition measurements in the idealized replica, given as mean± standard deviation (n=5). Here, da denotes aerodynamic diameter, Vt denotes tidalvolume, bpm is the abbreviation of “breaths per minute, and Q is inhalation flow rate (Q= 2 bpm Vt).
26
Figure 2.9: Comparison of deposition data for idealized infant nasal airway with thosemeasured by Storey-Bishoff et al. (2008) for 10 in vitro subjects. Error bars for theidealized replica data points indicate standard deviation.
because of inter-subject geometrical differences. Furthermore, even for the idealized
geometry, deposition is not captured by a single curve. This form of impaction
parameter is used in Fig. 2.9 for two reasons. First, it incorporates the two important
parameters which affect impaction: particle size and flow rate. Second, previous in
vitro measurements often present data using this widely accepted parameter, so that
one can compare deposition data for the idealized nasal airway without further data
reduction.
Figure 2.9 indicates that deposition in the idealized geometry lies near the aver-
age of the 10 Storey-Bishoff et al. (2008) subjects. This suggests that in spite of its
simplified form, the present idealized geometry satisfactorily mimics total extratho-
racic deposition in real in vitro airways for particles in the micrometer size range
considered here.
27
As noted earlier, airway geometry is not taken into consideration in the impaction
factor d2aQ. This partly accounts for the scattering of deposition data in Fig. 2.9.
Instead, a combination of Reynolds and Stokes numbers along with the dimensionless
length scale, in the form of ReαStkβ (Dh/Dhave)ν , is a more relevant parameter. For
the sake of consistency, the curve fit developed by Storey-Bishoff et al. (2008) to
capture the deposition data of the 10 in vitro subjects is adopted here. The curve
is trivially modified according to the aforementioned factor of 4 in the length scale,
and is written in the following form:
η = 1−
(566
566 + Re1.118 Stk1.057 (Dh/Dhave)−2.84
)0.851
(2.1)
whereDh andDhave are the hydraulic diameter of the idealized model (i.e. 4V/As)
and the average hydraulic diameter of the 10 real airways, respectively. In the
case of the idealized model Dh and Dhave are set to be the same. Also, Re =
4 ρairQ/π µDh and Stk = 2 ρwater d2aCcQ/ 9π µD
3h. This curve along with the
deposition data of the idealized replica and 10 in vitro subjects is shown in Fig. 2.10.
In accord with Fig. 2.9, Fig. 2.10 suggests a satisfactory agreement between
deposition in the idealized version and the average of deposition in 10 in vitro
subjects. For intermediate values of the impaction parameter in Fig. 2.10, the
idealized geometry has somewhat higher deposition than the average of the realistic
replicas. This may be due to complexities in the flow that are not captured by the
idealized replica. Similar differences at intermediate impaction parameter values
are seen in an idealized adult replica (Grgic et al., 2004a) and in an idealized child
replica (Golshahi and Finlay, 2012). Although such differences are an anticipated
aspect of using a simplified geometry, they have negligible effect when comparing to
28
Figure 2.10: Comparison of deposition data for the idealized infant nasal airway withthose measured by Storey-Bishoff et al. (2008) for 10 in vitro subjects, plotted using adimensionless x-axis based on Eq. 2.1.
in vivo data with inhalers in adults (Zhang et al., 2007). Whether the same is true
for infants is a topic for future research, although Fig. 2.9 suggests that the present
idealized infant geometry should match average infant deposition fairly well.
It may be convenient to have an empirical equation that explicitly fits the depo-
sition data for the present idealized infant geometry. To allow the best collapse of
both particle size and flow rate dependence, we follow the form of Eq. 2.1 used by
Storey-Bishoff et al. (2008) and fit the following curve to our idealized infant data
by minimizing the root mean square of the errors with the aid of MATLABs genetic
algorithm toolbox:
η = 1−
(8.35× 10⁷
8.35× 10⁷ + Re2.812 Stk1.094
)0.4
(2.2)
Here Dh=4.8 mm is the hydraulic diameter of our idealized infant geometry,
29
Figure 2.11: Same as Fig. 2.10 but showing curve fit to deposition data of the idealizedreplica, plotted using a dimensionless x-axis based on Eq. 2.2.
which is the same as the average hydraulic diameter of the replicas studied by
Storey-Bishoff et al. (2008). Equation 2.2 along with the deposition data of the
idealized replica and 10 in vitro subjects is shown in Fig. 2.11. It is to be noted,
however, that for an actual nasal replica, with a hydraulic diameter different from
that of the idealized replica, Eq. 2.1 is preferable.
It should be noted that deposition of smaller diameter particles than considered
here is affected by diffusion, while that of much larger particles is affected by sedi-
mentation. The present idealized geometry was not developed with either of these
deposition mechanisms in mind. For this reason, while Golshahi et al. (2010) ex-
amined deposition of ultrafine particles in the same replicas used by Storey-Bishoff
et al. (2008), we have not explored the ability of the present idealized geometry to
mimic ultrafine aerosol particle deposition.
30
3. Deposition modeling of hygroscopic
saline aerosols in the human respiratory
tract: Comparison between air and
helium-oxygen as carrier gases
3.1 Introduction
When hygroscopic aerosols are inspired, the size and temperature of the dispersed
droplets, as well as the temperature and moisture content of the carrier gas may
change due to heat and mass transfer between the dispersed phase and the gas,
and also between the gas and the airway walls. This two-way coupled problem is
numerically analyzed in this Chapter, with the focus on the effect of using helium-
oxygen instead of air as the carrier gas on hygroscopic size changes and deposition
of aqueous solution aerosols (Javaheri et al., 2013b). Coefficients of heat and mass
transfer in each generation of an idealized respiratory tract are specified based on
realistic assumptions. Aerosols of initially isotonic droplets are considered. Differ-
ential equations of heat and mass transfer for both the continuous and dispersed
phases are numerically solved to simulate the evaporation and condensation. Once
the droplet sizes are determined in each respiratory tract generation, deposition is
31
estimated based on existing correlations for stable particles. The results include
regional deposition, in percentage of inhaled NaCl, for both helium-oxygen and air
for a variety of size distributions: MMD between 2.5 and 8.5 micrometers and GSD
of 1.7. Moreover, the size and temperature variations of the droplets as well as the
temperature and humidity variations of the carrier gas are reported. To investigate
the impact on deposition caused by hygroscopic size changes, the hygroscopic ef-
fectiveness is defined, which specifies the differences in He–O2 and air deposition
caused by hygroscopic size changes. The results, in general, suggest that the lowest
deposition fraction in the extra-thoracic region and the highest deposition fraction
in the alveolar region correspond to droplets with low mass fraction, inspired with
helium-oxygen.
3.2 Methodology
3.2.1 Thermodynamic and transport properties
Helium-oxygen is a low density inhalable gas (nearly 3 times lighter than air, for
an oxygen mole fraction of 20%). Its specific heat and transport properties, i.e.
kinematic viscosity, thermal conductivity and coefficient of diffusion of water vapor,
are remarkably higher than air. The thermodynamic and transport properties of
air and helium-oxygen are compared in Table 3.1 for an 80:20 volume mixture of
helium:oxygen, which we refer to simply as helium-oxygen or He-O2 throughout this
Chapter. The property values of Table 3.1 are estimated using formula provided by
Katz et al. (2011). For a thorough discussion on estimating transport properties see
Reid et al. (1987).
32
Thermodynamic and transport property Air Helium-Oxygen
Molecular weight (M) [ kgk mol ] 29 9.6
Density (ρ) [ kgm3 ] 1.139 0.377
Mean free path (λ) [nm] 72 147
Specific heat capacity at constant pressure (cp) [J
Table 3.1: Thermodynamic and transport properties of air and helium-oxygen (20 volumepercent of Oxygen and 80 volume percent of Helium) at 310 K and 1 atm
The properties of the carrier gas change due to variations of temperature and
moisture content, e.g., between 20◦C and 37◦C, the density and dynamic viscosity
of air and He-O2 vary up to 6%. However, uncertainties involved in calculating
the variations of properties of a gas mixture with temperature and humidity are
deemed to be comparable with the error of neglecting these variations. Thus, ther-
modynamic and transport properties of the gases are assumed to remain unaffected
by temperature and moisture content.
33
3.2.2 Aerosol characteristics, breathing pattern, and lung
model
Inspired aerosol is assumed to contain initially isotonic droplets with a lognormal size
distribution. To deal with heat and mass transfer processes, the continuous droplet
size distribution is discretized into N=100 evenly spaced size bins of width 0.2 µm in
the range between 0 and 20 µm. The carrier gas is assumed to be initially at 20◦C
and 99.5% relative humidity (RH). This represents a thermodynamic equilibrium
between the gas and a flat surface of an isotonic solution.
The nebulization of pharmaceutical aqueous formulations commonly involves the
inhalation of hygroscopic aerosols. Therefore, tidal breathing, which is the normal
breathing pattern used with nebulizers, is considered here. Inhalation volume flow
rate and tidal volume are assumed to be 18 l/min and 750 cm3, respectively, which
are approximate average values for adult males (Finlay, 2001). Inhalation, hold, and
exhalation times are assumed to be 2.5, 0.37, and 2.87 s, respectively; the relative
durations are consistent with those suggested by the Task Group on Lung Dynamics
(Morrow et al., 1966).
The mass fraction of the dispersed droplets, i.e., the total mass of droplets per
unit volume of the carrier gas, is an important parameter in the study of hygroscopic
effects. Given that the droplets are initially isotonic, for a particular breathing pat-
tern, the mass fraction of droplets could also be specified in terms of total inhaled
salt (NaCl) per minute, denoted by ψ. The effect of droplet mass fraction on hy-
groscopic size changes will be examined here by considering three values of ψ: 0.01
mg/min, corresponding to low droplet mass fraction; 0.1 mg/min, corresponding
to medium droplet mass fraction; and 1.0 mg/min, corresponding to high droplet
34
mass fraction. The typical range of nebulizer outputs is between 0.1–1.0 g/min,
depending on the nebulizer type. This corresponds to a range of ψ between 0.39–3.9
mg/min. In terms of nebulizer output, ψ=1.0 mg/min corresponds to a nebulizer
aerosol output of 0.255 g/min, ψ=0.1 mg/min corresponds to a nebulizer aerosol
output of 0.0255 g/min, and ψ=0.01 mg/min corresponds to a nebulizer aerosol
output of 0.00255 g/min. This indicates that the high value of ψ lies in the typical
range of nebulizer outputs, while the medium and low values of ψ are chosen to
represent the cases where hygroscopic effects are more noticeable.
A cylindrical tube with 1.87 cm diameter and 4.0 cm length represents the mouth-
piece. Its wall is assumed to be adiabatic and impermeable, i.e., no heat and mass
transfer takes place at the wall. The Alberta Idealized Mouth Throat (Stapleton
et al., 2000) is adopted as the upper airway geometry for determining heat and
mass transfer coefficients and for determining particle residence times. The sym-
metric lung model of Finlay et al. (2000), with the lung volume (functional residual
capacity) scaled to 3000 cm3, is used for the thoracic airways geometry.
3.2.3 Heat and mass transfer from airway walls
When hygroscopic aerosol is inhaled, heat and mass transfer occur by two mecha-
nisms: 1) convective transfer between the carrier gas and walls of the airway, and
2) diffusive transfer between the individual droplets and the carrier gas. Convective
heat and mass transfer coefficients can be calculated based on estimates of temper-
ature and humidity profiles in the respiratory tract when no droplets are present in
the inhaled gas (Finlay and Stapleton, 1995). In order to estimate the temperature
and humidity of the gas flow for air, Ferron et al. (1988-a) solved the governing
35
transport equations in cylindrical geometries with laminar parabolic velocity pro-
files. They considered the effect of turbulence in the upper airways via additional
eddy diffusivity. Daviskas et al. (1990) used the analytical solution of a one di-
mensional transient diffusion equation to estimate temperature and humidity. To
obtain more realistic results, they also modified the diffusivity coefficient based on
the volume flow rate. Unfortunately, the previous estimations of temperature and
humidity in the respiratory tract are for air, not He-O2. Moreover, the available
profiles are obtained from highly simplified mathematical models. In the present
study, we instead calculate heat and mass transfer coefficients in the extra-thoracic
airways using computational fluid dynamics (CFD) simulations of heat and mass
transport in the Alberta Idealized Mouth Throat (Stapleton et al., 2000). Fluid flow
as well as heat and water vapor transfer is simulated in this mouth-throat geometry
using Ansys CFX (Release 12.1) with Dirichlet boundary conditions at the walls
for temperature (310 K) and water vapor concentration (99.5% RH). A total num-
ber of 1577726 elements (469502 nodes) was used, which is sufficient to yield grid
converged results based on previously published works in this geometry (Stapleton
et al., 2000; Heenan et al., 2003). Given that the values of the Pr and Sc numbers
for air and helium–oxygen mixture are of the order of magnitude of 1.0 (Table 3.1),
the thickness of the hydrodynamic, thermal, and mass transfer boundary layers are
deemed to be almost similar. Thus, regarding grid convergence, this grid size is
thought to be also sufficient for heat and mass transfer simulations. Miyawaki et al.
(2012) conducted Large Eddy Simulations for different volume flow rates through a
realistic replica of a human mouth-throat, and found that depending on the physical
properties of the gas, laminar, transitional, or turbulent flow may occur. They de-
fined a Reynolds number based on the hydraulic diameter of the trachea (Ret) and
36
found that the critical Reynolds for transition between laminar and turbulent flows
(Retc) is approximately 430. In the present study, for the volume flow rate of 18
l/min, airflow in the upper airway was therefore assumed turbulent (Ret = 1474),
and a low Reynolds number SST turbulence model was used, while helium-oxygen
flow remained laminar (Ret = 400). The average coefficients of heat transfer, h, and
mass transfer, g, in the mouth, throat, and trachea are obtained in a post processing
operation using the following formula:
h =ρg cpg [
∫∫ outT V . dS−
∫∫ inT V . dS]
Awall (Twall − T∞)(3.1)
g =[∫∫ out
CV . dS−∫∫ in
CV . dS]
Awall (Cwall − C∞)(3.2)
Here, C is the water vapor concentration, T is temperature, V is the gas velocity
and the subscript ∞ designates the bulk gas. cpg is the specific heat capacity at
constant pressure and ρg is the density of the carrier gas, as given in Table 3.1. The
above formula are simply derived by considering conservation of energy and mass
for a control volume coinciding with the mouth, throat or trachea (Bergman et al.,
2011). Calculated values of heat and mass transfer coefficients in the extra-thoracic
passages for the volume flow rate of 18 l/min using this approach are summarized
in Table 3.2.
For heat and mass transfer coefficients distal to the trachea, the airway passages
are assumed to be circular cylinders with diameter D from our idealized lung model
(Finlay et al., 2000). For the volume flow rate of 18 l/min, the value of Reynolds
number in these passages is always less than 1850; thus we assume laminar flow
there. The theory of laminar heat and mass transfer in tubes is well developed.
37
Air He-O2
h [ Wm2 K
] g [ msec ] h [ Wm2 K
] g [ msec ]
Mouth 14.9 0.0144 25.3 0.0189
Throat 27.0 0.0259 42.4 0.0311
Trachea 31.5 0.0309 53.71 0.0375
Table 3.2: Convective heat and mass transfer coefficients in the upper airways for volumeflow rate of 18 l/min, for both air and helium-oxygen
However, the effect of hydrodynamic and thermal development should be considered.
An accurate numerical solution for simultaneously developing laminar flow in an
isothermal circular tube has been presented by Jensen (1989). The results of this
simulation involve the average Nusselt number (Nuave = hD/κ) as a function of
dimensionless tube length and the Prandtl number (Pr = ν/α). Considering the
similarity between mass and heat transfer, the average Sherwood number (Shave =
gD/Γ) as a function of dimensionless tube length, and Schmidt number (Sc = ν/Γ),
can be also inferred from Jensen’s data. The average values of the coefficients of
heat and mass transfer in the thoracic airways are directly calculated using Nuave
and Shave.
In each generation, the heat and mass transfer rate from airway walls to the
aerosol bolus can be written as
qwall = h A (Twall − T∞) (3.3)
mwall = g A (Cwall − C∞) (3.4)
where A is the area of interface between the bolus and the airway walls, and is
38
estimated as follows:
A = VA
V(3.5)
Here, V is the volume of the bolus and A and V are the internal area and volume
of the airway, respectively.
3.2.4 Heat and mass transfer between continuous and dis-
persed phases
Hygroscopic size changes amount to a transfer of mass (water vapor) between the
carrier gas and the dispersed droplets normally associated with heat transfer, yield-
ing differential equations of heat and mass transfer that govern the diameter di and
temperature Ti of the droplets in the ith size bin. These equations are discussed in
detail by Fuchs (1959), Mason (2010), and Finlay (2001), and are given here for the
sake of completeness and clarity.
The equation governing the diameter di of the ith droplet size can be written as:
ddidt
=−4 Γ (Ci − C∞)
ρw di(3.6)
where Ci is the water vapor concentration at the surface of the ith droplet size. For
solution droplets, the water vapor concentration at the surface is less than that for
droplets of pure water. In contrast, the surface curvature tends to increase the vapor
concentration at the surface (via the Kelvin effect). For the present saline droplets,
these effects are formulated using the correlations given by Cinkotai (1971).
39
An equation of heat transfer governs the temperature of the ith droplet size:
ρ cpdi
2
12
dTidt
= −LΓ (Ci − C∞)− κ (Ti − T∞) (3.7)
Here, cp is the specific heat capacity and ρ is the density of the saline droplet, and
L is the latent heat of evaporation of the liquid water, which is assumed to be
independent of temperature.
3.2.5 Variation of temperature and vapor concentration of
the carrier gas
In the two way coupled mathematical model for heat and mass transfer, temperature
and moisture content of the carrier gas change due to transport of heat and vapor
with dispersed droplets and airway walls, and are governed by:
ρg cpg VdT∞dt
= qwall +N∑i=1
ni V qci (3.8)
VdC∞
dt= mwall −
N∑i=1
ni Vdmi
dt(3.9)
Here, ni is the number of droplets in the ith size bin per unit volume and dmi/dt
is the rate of change of mass of the ith size which could be simply derived from
Eq. 3.6. qci is the rate of conductive heat transfer from the surface of the ith droplet
size:
qci = 2π di κ (Ti − T∞) (3.10)
40
Substituting from Eq. 3.3, 3.4, 3.6, and 3.10 into Eq. 3.8 and 3.9 yields:
ρg cpgdT∞dt
=h A
V(Twall − T∞) +
N∑i=1
2 π κni di (Ti − T∞) (3.11)
dC∞
dt=g A
V(Cwall − C∞) +
N∑i=1
2π Γni di (Ci − C∞) (3.12)
Equations 3.6, 3.7, 3.11, and 3.12 represent a set of moderately stiff 2N+2 non-
of time, associated with the diameters and temperatures of the N droplet sizes and
bulk temperature and water vapor concentration of the carrier gas. Finlay and
Stapleton (1995) and Stapleton et al. (1994) validated this mathematical model for
both small and large number of droplets per unit volume, while Saleh and Shihadeh
(2007) provided experimental validation.
Because of the stiffness of the equations, the CVODE (the C Version of a Variable
Coefficient ODE Solver) routine of the Lawrence Livermore National Laboratory,
Numerical Mathematics Group (Cohen and Hindmarsh, 1994) was used. The un-
derlying integration method implemented in CVODE is a variable order Backward
Differentiation Formula (BDF), an implicit scheme with satisfactory stability for stiff
ODEs. To validate the numerical analysis, the ODE system was also solved with
the aid of an in- house developed code, using the explicit Runge-Kutta-Fehlberg
(RKF45) algorithm, with adaptive variable size time step. A validation run was
performed for air, initially at 20◦C and 50% RH, carrying a medium mass frac-
tion (ψ=0.1 mg/min) of polydisperse droplets with MMD of 6 µm and GSD of 1.7.
Maximum differences between the predictions of CVODE and RKF45 were observed
during the first few hundred time steps of CVODE, when droplets and air were far
41
from equilibrium. However, even for that case, the results including the size and
temperature of the droplets as well as the temperature and RH of the air, were
always less than 3% different. Due to excessively small time steps, the execution
time for the RKF45 was considerably higher compared to the implicit BDF.
3.2.6 Deposition calculation
To determine deposition, the tidal volume is considered to comprise several hundred
hypothetical small segments, with each segment reaching different depths in the
lung. As a result, only a fraction of the tidal volume passes entirely through each
lung generation. The amount of drug delivered to each generation by each hypo-
thetical segment of the gas depends on its final destination in the lung. In order
to accommodate this effect, the tidal volume is discretized into 500 small segments.
Each segment is a small aerosol bolus which is tracked during inhalation, inspiratory
pause and exhalation. Once the droplet sizes are calculated in each lung generation,
deposition is estimated based on previously published equations for stable particles.
In the thoracic airways, the following equations are used to estimate the deposi-
tion: Chan and Lippmann (1980) for inertial impaction, Heyder (1975) and Heyder
and Gebhart (1977) for sedimentation, and Ingham (1975) for diffusion. Density of
the carrier gas, which is the distinguishing physical property of the helium-oxygen,
does not appear in these equations. Dynamic viscosity, however, which always tends
to decrease the deposition, and is 22% higher for helium-oxygen than for air, appears
in all of these equations. See Finlay (2001) for a comprehensive discussion of these
equations.
In the extra-thoracic airways, deposition of micrometer size droplets is controlled
42
by impaction. Dimensional analysis reveals that the Reynolds and Stokes numbers
determine impaction. Therefore, when deposition data are reported vs. a com-
bination of Re and Stk, they are believed to be applicable for all carrier gases.
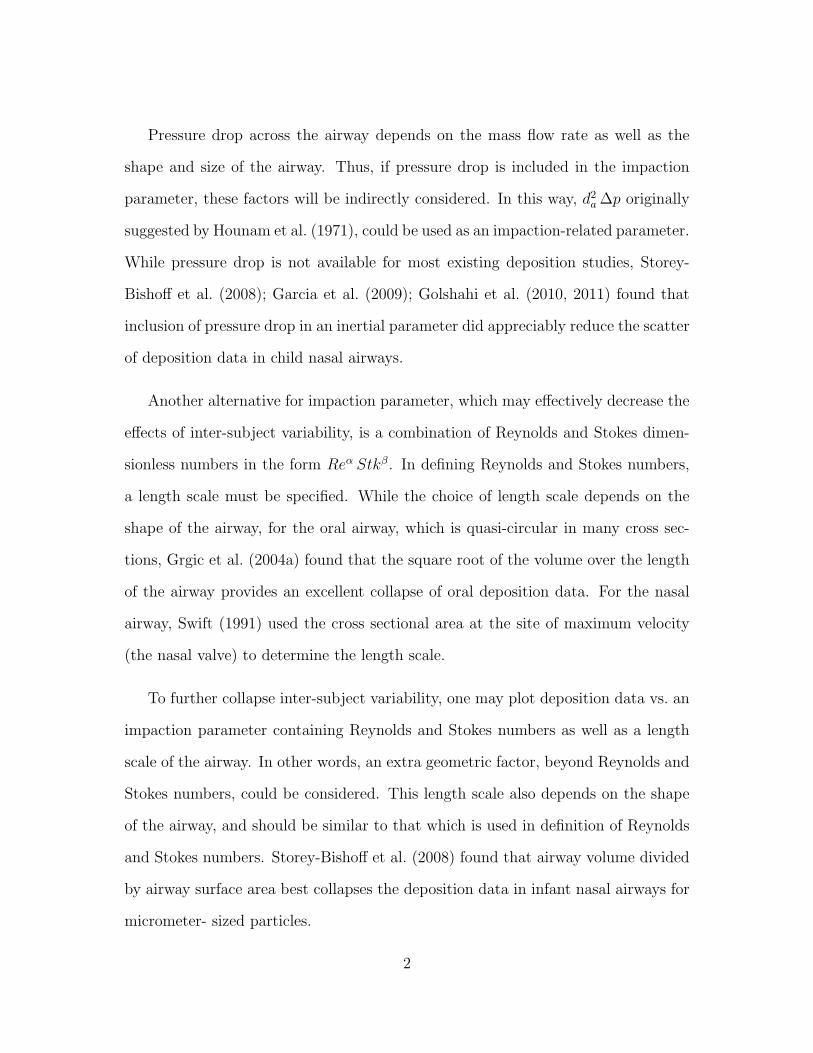
Sandeau et al. (2010) numerically simulated the deposition in a reconstructed oral
extra-thoracic replica for air and helium- oxygen. Using Stk Re0.3 as the impaction
parameter, their deposition data for the two gases successfully collapsed into a sin-
gle curve. To confirm this notion, in a supplementary part of the present study,
deposition of nebulized stable jojoba oil droplets, inhaled with helium-oxygen was
experimentally measured, using the Alberta Idealized Mouth Throat at flow rates
from 30-90 l/min. The aerosol stream was monitored using a Next Generation Im-
pactor (NGI), with and without the Alberta Idealized Throat in line. This allowed
determination of deposition fraction in the Alberta Idealized Throat for droplets
in each size range of the NGI. In Fig. 3.1, the results of these deposition measure-
ments are plotted vs. Stk Re0.37 and compared with the deposition correlation of
Grgic et al. (2004b). Satisfactory agreement is observed. This evidence supports
the reasonable hypothesis that available deposition correlations of air can be used
for other gases provided two conditions are fulfilled. First, deposition is reported
vs. Reα Stkβ, and second, the correlation should be used for its valid ranges of Stk
and Re numbers. The second condition means that only correlations which are valid
for low Re ranges are applicable for helium-oxygen (since the much lower density of
helium-oxygen results in much lower Re than in air).
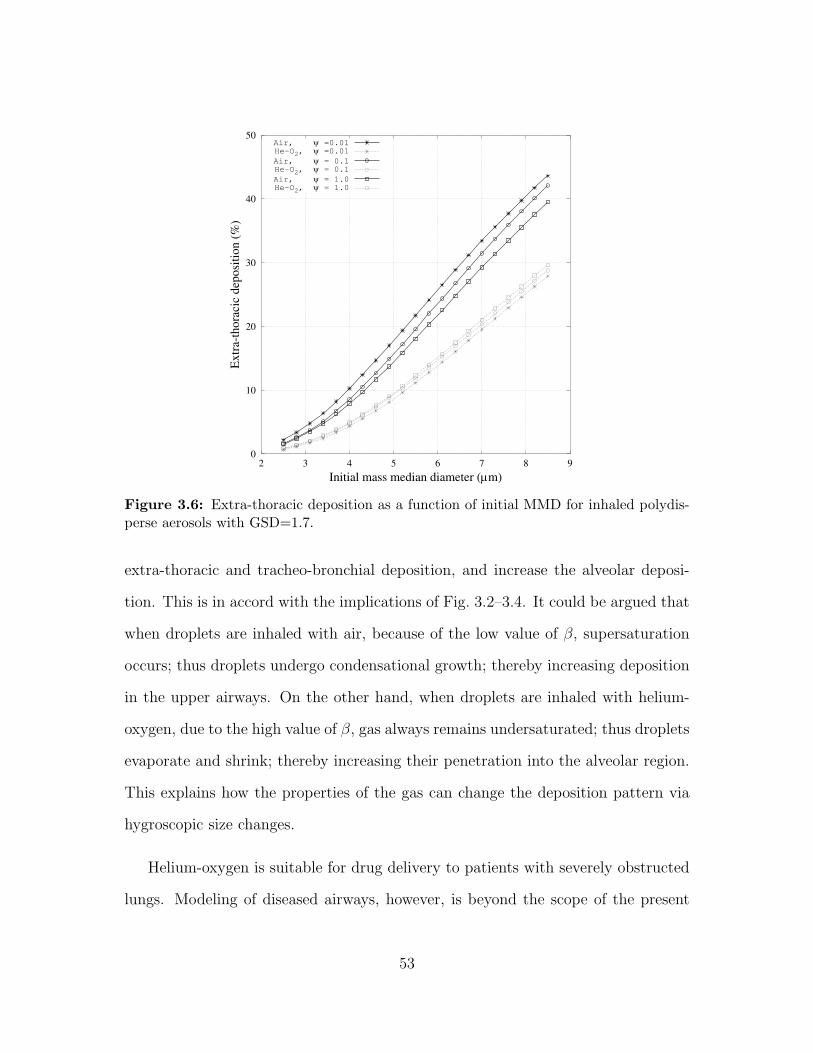
Recently, Golshahi et al. (2013) have conducted an in-vitro study on deposition
of micrometer size particles in extra-thoracic airways during tidal oral breathing.
This study includes volume flow rates as low as 12.2 l/min, corresponding to the low
Re number range, and deposition is reported vs. Stk3.03Re0.25. Moreover, deposition
43
0
10
20
30
40
50
10-1
Ex
tra-
thora
cic
dep
osi
tion (
%)
Stk Re0.37
Helium-Oxygen
Grgic et al. (2004)
Figure 3.1: Extra-thoracic deposition of stable particles shown as a function ofStk Re0.37. The solid curve is the correlation of Grgic et al. (2004b) for deposition mea-surements in air, while the markers indicate the results of deposition measurements inhelium-oxygen.
is measured during tidal breathing which is the breathing pattern used in the present
study. As a result, the following correlation suggested by Golshahi et al. (2013) is
adopted here for estimating extra-thoracic deposition of stable particles, for both
air and helium-oxygen:
η = 1− 1
1 + 1.51× 10⁵ (Stk3.03Re0.25)(3.13)
Carrier gas density appears in Eq. 3.13 via the Reynolds number. Thus, even
though deposition in the thoracic airways does not explicitly depend on carrier
gas density, its influence on extra-thoracic deposition will indirectly affect thoracic
deposition.
44
3.3 Results and discussion
3.3.1 Carrier gas relative humidity
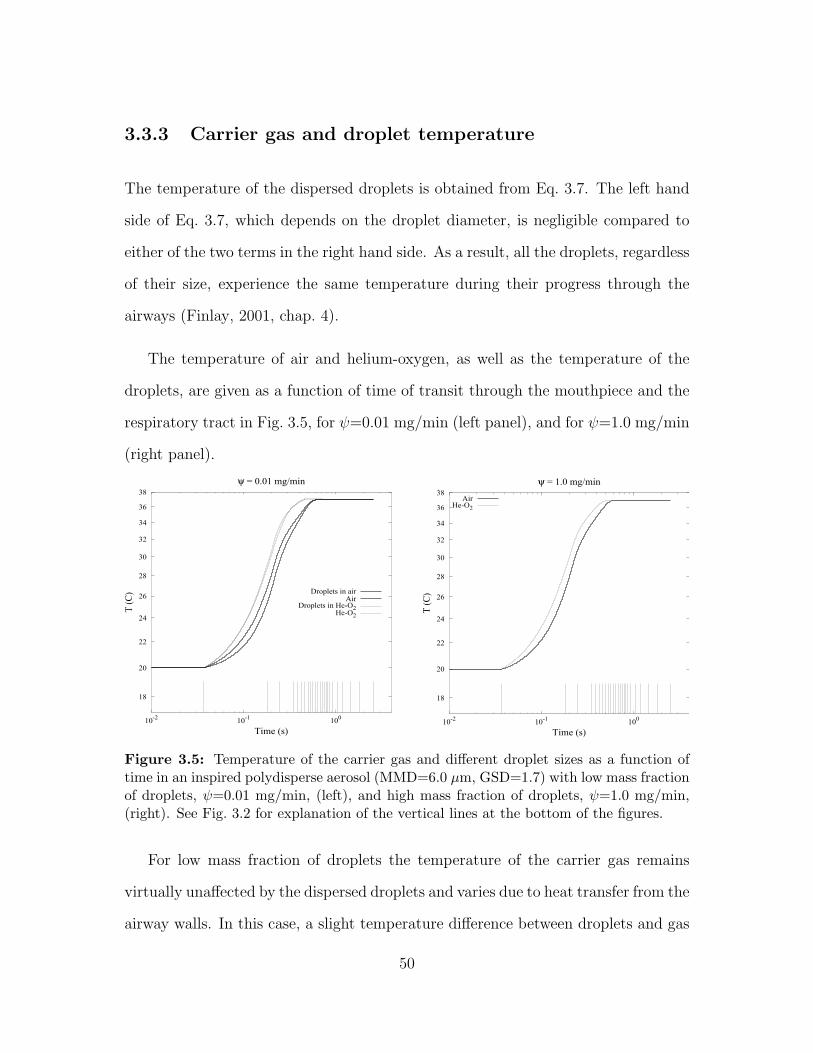
For low mass fraction (ψ=0.01 mg/min), the carrier gas remains virtually unaf-
fected by the dispersed droplets, and hygroscopic effects are more easily explained.
Of practical interest, however, is the high mass fraction (ψ=1.0 mg/min) which is
comparable to the mass fraction of actual nebulized aerosols. Therefore, the varia-
tions of relative humidity and temperature of the carrier gas as well as the diameter
and temperature of the droplets are presented in detail here for both low and high
mass fractions. Full presentation of all three mass fractions will be given when
examining deposition in a later subsection.
Relative humidity of the carrier gas has a pronounced effect on the shrinkage
and growth of the droplets. For air and helium-oxygen, it is given as a function of
time of transit through the mouthpiece and respiratory tract in Fig. 3.2, for ψ=0.01
mg/min (left panel) and ψ=1.0 mg/min (right panel). For ψ=0.01 mg/min, relative
humidity changes only because of vapor and heat transfer from the airway walls. The
former tends to increase the relative humidity, whereas the latter tends to decrease
it. Therefore, variation of relative humidity depends on the relative rate of vapor
and heat transfer processes. For ψ=1.0 mg/min , relative humidity changes partly
because of vapor and heat transfer from the walls, and partly because of heat and
vapor exchange with the dispersed droplets.
To investigate the effect of heat and vapor transfer from the walls on the gas,
we define a dimensionless number β to be the ratio of thermal diffusivity to the
45
95
100
105
110
10-1
100
Relativehumidity(%
)
Time (s)
ψ = 0.01 mg/min
AirHe-O2
98.8
99
99.2
99.4
99.6
99.8
100
100.2
100.4
10-1
100
Relativehumidity(%
)
Time (s)
ψ = 1.0 mg/min
AirHe-O2
Figure 3.2: Relative humidity of the carrier gas as a function of time for a polydisperseaerosol (MMD=6.0 µm, GSD=1.7) with low mass fraction of droplets, ψ=0.01 mg/min,(left), and high mass fraction of droplets, ψ=1.0 mg/min, (right). The vertical lines atthe bottom of the figures determine the generation, e.g., the time interval prior to the firstvertical line represents the mouthpiece, the time interval between the first and the secondline represents the mouth, followed by the throat, the trachea, the main bronchi, etc.
coefficient of diffusion of water vapor:
β =α
Γ(3.14)
A lower value of β implies that transport of water vapor from airway walls is
more effective than transport of heat. Considering that vapor transfer tends to
increase the RH and heat transfer tends to decrease that, a lower value of β will
result in a higher relative humidity. The value of β is 2.06 for helium-oxygen and
0.83 for air. This suggests that in similar conditions, compared with helium-oxygen,
higher relative humidity for air should be expected, as is confirmed in Fig. 3.2.
Isotonic droplets, on the other hand, tend to prevent the deviation of RH from
99.5%, which is the value of RH at the flat surface of an isotonic solution. This effect
46
is also evident in Fig. 3.2: For ψ=0.01 mg/min, deviation of RH from 99.5% is much
more than that for ψ=1.0 mg/min, in which the number of droplets is sufficient to
influence their carrier gas.
3.3.2 Variation of droplet size
The rate of evaporation of droplets, as is defined in Eq. 3.6, depends on the aerosol
size distribution. For a monodisperse or narrow size distribution, the droplets evap-
orate at essentially the same rate. For a wide size distribution, in contrast, small
droplets evaporate much faster than the large ones, since the characteristic time of
evaporation is proportional to the inverse square of droplet diameter (see Eq. 3.6).
100
101
10-2
10-1
100
d/d0
Time (s)
Air
100
101
10-2
10-1
100
d/d0
Time (s)
Helium-Oxygen
d0 = 0.5 µmd0 = 1.5 µmd0 = 3.5 µmd0 = 5.5 µm
Figure 3.3: Variation of droplet diameters in an inspired polydisperse aerosol (MMD=6.0µm, GSD=1.7) with low mass fraction of droplets (ψ=0.01 mg/min). See Fig. 3.2 forexplanation of the vertical lines in the figures.
The variation of the diameter of the droplets, normalized by the initial diameter,
as a function of time of transit through the mouthpiece and respiratory tract, is
47
given in Fig. 3.3 for ψ=0.01 mg/min and in Fig. 3.4 for ψ=1.0 mg/min. These
figures compare the role of air and helium-oxygen as the carrier gases in growth
and shrinkage of different droplet sizes in a polydisperse aerosol (MMD=6 µm,
GSD=1.7). Figures 3.3 and 3.4 confirm that smaller droplets are more sensitive and
respond faster to the variations in the thermodynamic state of the carrier gas. The
behavior of droplets initially larger than 5.5 µm can also be predicted by considering
the trends of Fig. 3.3 and 3.4. They follow the pattern of the size change of d0 = 5.5
µm droplets, but always with a smaller rate of variation.
0.7
0.8
0.9
1.0
1.2
1.5
10-3
10-2
10-1
100
d/d0
Time (s)
Air
0.7
0.8
0.9
1.0
1.2
1.5
10-3
10-2
10-1
100
d/d0
Time (s)
Helium-Oxygen
d0 = 0.5 µmd0 = 1.5 µmd0 = 3.5 µmd0 = 5.5 µm
Figure 3.4: Variation of droplet diameters in an inspired polydisperse aerosol (MMD=6.0µm, GSD=1.7) with high mass fraction of droplets (ψ=1.0 mg/min). See Fig. 3.2 forexplanation of the vertical lines in the figures.
There is a close relationship between the relative humidity of the carrier gas
and the shrinkage and growth of the droplets. Droplets can grow larger than their
initial size only when the vapor pressure in their surrounding gas is more than vapor
pressure at their surface vicinity. The growth of droplets inspired with air (Fig. 3.3
and 3.4, left panel) is because of the supersaturation of air (see Fig. 3.2), while the
48
shrinkage of those droplets is because of their curvature (Kelvin effect). For droplets
inspired with helium-oxygen (Fig. 3.3 and 3.4, right panel), however, both curvature
and undersaturation of He-O2 give rise to evaporation.
The final thermodynamic state of the inspired aerosol is determined by the liquid
covering the airway walls, which is an isotonic saline solution. In other words, the
droplets and the carrier gas finally come into thermodynamic equilibrium with this
liquid. In this state, the vapor pressure at the surface of the airway walls and at the
surface of the dispersed droplets should be equal. The latter is determined by droplet
temperature, droplet size (curvature), and ionic composition of the droplet. The rate
at which droplets approach their final size depends on the transport properties of the
carrier gas, i.e. faster in helium-oxygen and slower in air. Figures 3.3 and 3.4 make
it obvious that droplets inhaled with helium-oxygen can reach their final size at the
end of the inhalation time, but those inhaled with air may need more time to reach
equilibrium with their environment. Given that the inhalation time is much more
than the characteristic time of the size change of droplets, and also that the carrier
gas reaches its equilibrium state by the end of inhalation and remains in equilibrium,
the size change of droplets during exhalation is deemed to be negligible.
Since the amount of drug contained in droplets varies with the cube of droplet
diameter, it is the larger particles that significantly determine drug delivery. For
higher mass fractions, the faster evaporation of smaller sizes can saturate the sur-
rounding gas, thus restricting the slower evaporation of larger droplets. As a result,
the shrinkage of large droplets, containing most of the drug, is insignificant, and
differences in hygroscopic effects in helium-oxygen and air trivially impact regional
drug delivery.
49
3.3.3 Carrier gas and droplet temperature
The temperature of the dispersed droplets is obtained from Eq. 3.7. The left hand
side of Eq. 3.7, which depends on the droplet diameter, is negligible compared to
either of the two terms in the right hand side. As a result, all the droplets, regardless
of their size, experience the same temperature during their progress through the
airways (Finlay, 2001, chap. 4).
The temperature of air and helium-oxygen, as well as the temperature of the
droplets, are given as a function of time of transit through the mouthpiece and the
respiratory tract in Fig. 3.5, for ψ=0.01 mg/min (left panel), and for ψ=1.0 mg/min
(right panel).
18
20
22
24
26
28
30
32
34
36
38
10-2
10-1
100
T(C)
Time (s)
ψ = 0.01 mg/min
Droplets in airAir
Droplets in He-O2He-O2
18
20
22
24
26
28
30
32
34
36
38
10-2
10-1
100
T(C)
Time (s)
ψ = 1.0 mg/min
AirHe-O2
Figure 3.5: Temperature of the carrier gas and different droplet sizes as a function oftime in an inspired polydisperse aerosol (MMD=6.0 µm, GSD=1.7) with low mass fractionof droplets, ψ=0.01 mg/min, (left), and high mass fraction of droplets, ψ=1.0 mg/min,(right). See Fig. 3.2 for explanation of the vertical lines at the bottom of the figures.
For low mass fraction of droplets the temperature of the carrier gas remains
virtually unaffected by the dispersed droplets and varies due to heat transfer from the
airway walls. In this case, a slight temperature difference between droplets and gas
50
is detectable (Fig. 3.5, left panel). The implication of higher thermal conductivity of
helium-oxygen is that the temperature difference between air and droplets is more
than the temperature difference between helium-oxygen and droplets.
In terms of heat transfer between the droplets and the gas, an increase in number
concentration of droplets has the same effect as an increase in the thermal conduc-
tivity of the gas (see Eq. 3.11): This means that for high concentration of droplets,
no detectable temperature difference between the gas and the droplets should be
expected. In Fig. 3.5, right panel, the curve designated “Air”, actually illustrates
the temperature of air and its droplets, and similarly for “He-O2”.
3.3.4 Regional deposition vs. droplet size
Regional deposition data, for both helium-oxygen and air are given as a function
of initial MMD, in the range of 2.5-8.5 µm. This includes fractional deposition for
extra-thoracic, tracheo- bronchial, and alveolar regions. Because the salt content
of the hygroscopic droplets remains constant, fractional deposition is defined as the
regional deposited NaCl divided by total inhaled NaCl. The effect of droplet mass
fraction is examined by considering three values of ψ, i.e. the total mass of droplets
per unit volume of the carrier gas.
Not all the differences between air deposition and helium-oxygen deposition can
be attributed to hygroscopic effects, since differences in deposition of stable particles
can occur, for example, due to the differences in Re and Stk in the extra-thoracic
deposition (Eq. 3.13). In particular, for equal volume flow rates through a passage,
the Reynolds number of the airflow is nearly three times that of helium-oxygen.
Therefore, when helium-oxygen is inspired, turbulence may be reduced in the up-
51
per respiratory tract, and lower deposition due to turbulence mixing is expected
(Darquenne and Prisk, 2004; Peterson et al., 2008). For stable aerosols, most of
the advantages of helium-oxygen over air are attributed to its low density (Ari and
Fink, 2010).
All the differences between the deposition of volatile droplets and their corre-
sponding stable particles are actually attributed to the hygroscopic effects. In order
to examine the effect of hygroscopicity on the regional deposition, the variable hy-
groscopic effectiveness is defined as the following
λ =∣∣∣deposition in air − deposition in He-O2
∣∣∣Hygroscopic droplets
−∣∣∣deposition in air − deposition in He-O2
∣∣∣Stable particles
(3.15)
In addition, λlow, λmed, and λhigh designate the hygroscopic effectiveness in low,
medium, and high mass fractions, respectively. A negative value of λ indicates that
hygroscopicity decreases the difference between deposition with helium-oxygen vs.
air. A value of λ = 0 means that hygroscopicity does not affect the difference
between deposition with helium-oxygen vs. air, while a positive value of λ indicates
that hygroscopicity increases the difference between deposition with helium-oxygen
vs. air.
Deposition in extra-thoracic, tracheo-bronchial, and alveolar regions is illus-
trated in Fig. 3.6, 3.7, and 3.8, respectively. These figures make obvious that
for droplets inspired with air, hygroscopicity tends to increase the extra-thoracic
and tracheo-bronchial deposition, and decrease the alveolar deposition. In contrast,
when droplets are inspired with helium-oxygen, hygroscopicity tends to decrease the
52
0
10
20
30
40
50
2 3 4 5 6 7 8 9
Extr
a-th
ora
cic
dep
osi
tion (
%)
Initial mass median diameter (µm)
Air, ψ =0.01
He-O2, ψ =0.01
Air, ψ = 0.1
He-O2, ψ = 0.1
Air, ψ = 1.0
He-O2, ψ = 1.0
Figure 3.6: Extra-thoracic deposition as a function of initial MMD for inhaled polydis-perse aerosols with GSD=1.7.
extra-thoracic and tracheo-bronchial deposition, and increase the alveolar deposi-
tion. This is in accord with the implications of Fig. 3.2–3.4. It could be argued that
when droplets are inhaled with air, because of the low value of β, supersaturation
Figure 4.3: The variations of normalized diameter of the saline droplets (left) and saltparticles (right) vs. the time of transit through the mixing chamber
Figure 4.3 confirms that evaporation of the saline droplets occurs subsequent
to the growth of the salt particles. At the end of the EA process, a state of mass
balance is reached, i.e. the vapor pressure at the surface of all of the droplets and
that of the surrounding air are the same. This implies that the mass concentration
of NaCl in all the resultant droplets should be nearly the same, although not exactly
65
the same because of the Kelvin effect. Note that the addition of the salt results in
the initially isotonic droplets becoming hypertonic upon exiting the mixing chamber,
with a concentration of (50-55 mg/ml), which is a concentration in the range used
in the treatment of certain pulmonary diseases (Elkins and Bye, 2006).
The variations of relative humidity and temperature of air during the EA process
are given in Fig. 4.4 as functions of time of transit through the mixing chamber.
In accord with Fig. 4.3, Fig. 4.4 also confirms that the growth of the salt particles
occurs prior to the evaporation of the saline droplets. In the first stage of the EA
process, when the condensational growth dominates, the RH of the air decreases,
and because condensation is a heat generating process, the temperature of the air
increases. In the second stage, the trend is reversed, i.e. evaporation dominates,
the RH of the air increases and the temperature decreases. The final temperature
in the EA process is higher than the initial temperature. Given that this process is
adiabatic, this means that the total mass of the condensed vapor is more than the
total mass of the evaporated water.
4.3.3 Deposition in the respiratory tract
The goal of the both HA and EA processes is to manipulate the size of the saline
droplets and produce smaller droplets which are more appropriate for drug delivery
to the lungs. Therefore, the effectiveness of these processes is evaluated by determin-
ing the deposition characteristics of their resultant droplets. The droplets produced
during the HA and EA processes will continue their size change after inspiration.
The shrunken droplets absorb water vapor and undergo condensational growth dur-
ing their progress through the thoracic airways. Our simulations show that these
66
88
90
92
94
96
98
100
10- 5
10- 4
10- 3
10- 2
10- 1
100
101
Relativehumidity(%)
Time (s)
19
19. 5
20
20. 5
21
21. 5
22
22. 5
23
10- 5
10- 4
10- 3
10- 2
10- 1
100
T(C)
Time (s)
Figure 4.4: The variations of relative humidity and temperature of the air vs. the timeof transit through the mixing chamber
droplets grow sufficiently not to be exhaled for the parameter ranges considered
here. In the alternative size manipulation approaches of Hindle and Longest (2010)
and Longest et al. (2012b), (ECG and EEG), submicrometer particles pass through
the extrathoracic airways, and undergo a controlled condensational growth when
advancing through the thoracic airways.
Extra-thoracic Tracheo-Bronchial Alveolar
Fractional deposition of21.9% 27.2% 33.5%
nebulizer output
Fractional deposition of HA8.9% 19.6% 48.4%
processed droplets
Fractional deposition of EA7.2% 20.4% 48.7%
processed droplets
Table 4.1: Deposition of the droplets produced in HA and EA processes compared todeposition of the unaltered nebulizer output.
The regional deposition of HA and EA processed droplets is calculated using the
methodology explained in Javaheri et al. (2013b). The results are summarized in
67
Table 4.1. Based on the deposition data of Table 4.1, the HA and EA processes
can enhance deep lung deposition of the nebulized saline droplets: alveolar deposi-
tion improves by 45% increase, while extra-thoracic deposition decreases 59% in the
HA process and 67% in the EA process. Despite these noteworthy improvements,
implementation of the HA and EA processes is an issue by itself. Laboratory im-
plementation of the HA process seems straightforward: the thermal energy could
be supplied by an electric resistance heater wrapped around the lateral surface of a
heating chamber. In the HA process, once the dispersed droplets were fully evap-
orated, the steep increase of temperature is a major consideration (see Fig. 4.1).
Longest et al. (2012a) considered different methods of providing thermal energy.
Uniform heat flux, or a wire type wall heater were found to be unsafe for direct
inhalation, while a counter-flow heater design (Longest et al., 2012a, 2013) provided
more control over temperature. The EA process, however, may not be straightfor-
ward to implement. A separate device, synchronized with the nebulizer is needed
to appropriately add the salt particles to the aerosol stream. The goal of this study
does not involve addressing these issues.
68
5. Numerical Simulation of Flocculation
and Transport of Suspended Particles:
Application to Metered-Dose Inhalers
5.1 Introduction
This Chapter investigates the dynamics of flocculation and convective transport of
solid particles suspended in a liquid propellant (Javaheri and Finlay, 2014), within
the canister of a pressurized metered-dose inhaler (MDI). Polydisperse particles with
lognormal size distribution are considered. Collision of particles is presumed to be
controlled by two mechanisms: upward velocity differential, which is schematically
illustrated in Fig. 5.1, and Brownian motion. These mechanisms are enhanced by
the van der Waals force. Flocculation of the particles is described using the con-
tinuous form of the Smoluchowski equation. Flocculation produces larger particles
with higher upward velocity. Upward transport of the particles is specified via a
convection term. A schematic of phase separation and formation of a cream layer
at the surface of the propellant due to the upward drift of the particles is depicted
in Fig. 5.2. The general dynamics of the system is governed by a nonlinear tran-
sient partial integro-differential equation which is solved numerically. The technique
employed is based on discretizing the size distribution function using orthogonal col-
69
location on finite elements. This is combined with a finite difference discretization of
the physical domain, and an explicit Runge-Kutta-Fehlberg time marching scheme.
The numerical analysis is validated by comparing with a closed form analytical so-
lution. The simulation results represent the particle size distribution as a function
of time and position. The method allows prediction of the effects of the initial con-
ditions and physical properties of the suspension on its dynamic behavior and phase
separation.
(1) (2) (3)
Figure 5.1: Schematic of collision of particles by upward velocity differential.
5.2 Methodology
5.2.1 Mathematical formulation
Within the canister, particles flocculate and simultaneously drift upward. These
two processes are not independent, i.e. flocculation generates larger particles with
higher drift velocity. This increases the rate of collision of upward moving particles,
thereby accelerating flocculation. The mathematical model governing this dynamics
70
Cream Layer
Diluted Region
(1) (2) (3)
Unchanged Region
Figure 5.2: Schematic of an MDI canister at 3 subsequent points (1), (2), and (3) in time,showing phase separation and formation of a cream layer at the surface of the propellant.
is a reduced form of the GDE, and is given by
∂n(d, z, t)
∂t+∂(Ud n(d, z, t)
)∂z
=d2
2
∫ d
0
β(d, φ)
φ2n(φ, z, t) n(d, z, t) dd (5.1)
−n(d, z, t)∫ ∞
0
β(d, d) n(d, z, t) dd
in which φ = (d 3 − d 3)1/3 and n(d, z, t) is the size distribution function, where
n(d, z, t)dd is the number of particles per unit volume of propellant, at location
z and time t, having diameters in the range d to d+dd. Here z is the vertically
upward distance from the canister bottom, and we assume no spatial variation in
other directions. The flocculation of particles is formulated using the continuous
form of the Smoluchowski equation (Friedlander, 2000). The flocculation kernel,
β(d, d), is determined by the mechanisms of particle collision. The upward drift of
particles is described by the convection term on the left hand side. Ud is particle
71
drift velocity, and is given by
Ud = (1− Vfr)6.0 Λ
g d2
18 µ(5.2)
where Vfr is the volume fraction of particles in the suspension. The term (1−Vfr)6.0
represents a hindrance function and takes into account the effect of concentration
on drift velocity (Russel et al., 1992); Λ = (1 − ϕ) (ρf − ρt) is an effective density
difference in which ϕ is the porosity of the particles and ρf and ρt are the density
of the propellant, and the true density of the particle, respectively. Finally, g is
gravitational acceleration and µ is the dynamic viscosity of propellant.
To render the problem tractable, the following assumptions and simplifications
are also made:
• Particles are initially spherical. Moreover, the flocs built up by the collision
and aggregation of particles are also spherical. In reality, flocs are not neces-
sarily spherical and their geometrical characteristics are specified by defining
equivalent diameters (Jarvis et al., 2005). However, considering the effects of
floc fractal dimensions on the rate of flocculation is beyond the scope of the
present study.
• When particles collide, they remain attached to each other with a presumed
efficiency, which is equal to 100% for the current simulation.
• The frequency of particle collision is controlled by two mechanisms: upward
velocity differential and Brownian motion. These mechanisms are enhanced by
the van der Waals force. The electrostatic repulsion potential is thought to be
insignificant in the propellant media (Albers and Overbeek, 1959a,b; Chen and
72
Levine, 1973; Feat and Levine, 1975, 1976; Johnson, 1996). This is attributed
to the relatively large ratio of double layer thickness to inter-particle separation
distance in non-aqueous media (Albers and Overbeek, 1959b; Johnson, 1996).
The repulsion potential also strongly diminishes when the volume fraction
of particles is not extremely low (Albers and Overbeek, 1959b). Assuming
additivity of the rates of collision by the different mechanisms, the flocculation
kernel for two particles with diameters d1 and d2 can be expressed (Friedlander,
2000; Williams and Loyalka, 1991; Seinfeld and Pandis, 2006; Jacobson, 2005)
as
β(d1, d2) =
(2 kB T
3 µ(1
d1+
1
d2)(d1+d2)
)/W + (Ud1−Ud2)
π
4(d1+d2)
2 (5.3)
where the first term specifies the effect of Brownian motion and van der Waals
force. The latter appears in the denominator and is given by Friedlander
(2000):
W =
∫ 1
0
exp
(−Υ
[1−Ψ
12(
x2
1− x2+
x2
1−Ψ x2) +
1
6ln(
1− x2
1−Ψ x2)
])dx (5.4)
in which Ψ = (d1 − d2)2/(d1 + d2)
2 and Υ = A/kBT where A is the Hamaker
constant, kB is the Boltzmann constant, and T is temperature. The value of
the Hamaker constant is not reported for drug particles in liquid propellants.
However, the value of A = 10−20J which is used here lies in the range for
the solid particles dispersed in liquids (Tadros, 2012). Flocculation kernel is
not very sensitive to the Hamaker constant (Friedlander, 2000). Nevertheless,
the right value of Hamaker constant is needed for more accurate results. The
second term in Eq. (5.3) specifies the effect of upward velocity differential,
73
i.e. collision of particles moving upward with different velocities (see Fig. 5.1)
(Seinfeld and Pandis, 2006).
It is to be noted that the applicability of the current numerical method does
not depend on the mathematical form of the flocculation kernel, i.e. the kernel may
be modified to account for some neglected effects, and the method will be still
applicable. However, if the nature of the inter–particle forces is very different from
what is considered here, the results of the current simulation may not agree well
with experimental observations.
The bottom of the canister is the location where phase separation appears first
(see Fig. 5.2). The dose of the drug is also usually taken from that place. Thus,
even in its first stages, phase separation interferes with the consistency of drug
delivery. In order to investigate this phenomenon quantitatively, the characteristic
time of phase separation is defined to be the time, Tps, when the volume fraction of
particles at the bottom is reduced by 50%.
5.2.2 Numerical approach
Equation (5.1) is a nonlinear transient partial integro-differential equation. Overall,
this equation cannot be solved analytically. Thus, a numerical approach is needed.
Equation (5.1) is comprised of three different parts: the time derivative on the left
hand side, the first order position derivative (convection term) on the left hand
side, and the integrals on the right hand side. Each term can be tackled using a
particular numerical scheme. The integrals on the right hand side, which specify the
flocculation of particles at a particular time and position, are the most challenging
terms. These integrals are discretized using a combination of orthogonal collocation
74
on finite elements (Carey and Finlayson, 1975), and Gauss-Legendre quadrature.
The application of orthogonal collocation on finite elements for particulate systems
is elucidated by Gelbard and Seinfeld (1978).
In order to discretize the size distribution function, the diameter domain is as-
sumed to be finite, with boundaries dmin and dmax. Depending on the initial size
distribution, dmin and dmax are set to span at least three orders of magnitudes of
particle diameters, e.g. dmin = 0.1 µm and dmax = 100 µm. This essentially elimi-
nates the so-called finite-domain error (Gelbard and Seinfeld, 1978). The diameter
domain is divided into M elements. The size of elements is not uniform, i.e. smaller
elements in small diameter ranges, and larger elements in large diameter ranges.
The elements represent a geometric sequence with a common ratio between 1.02 to
1.05, depending on the initial GSD (geometric standard deviation) of the particles.
Each element has two interior collocation points, taken as the roots of the shifted
Legendre polynomial. The values of the distribution function are to be determined
at each collocation point (not the grid points), at any time and position. Within
each element, the diameter is scaled from 0 to 1 to reduce round-off error. The
distribution function, n(d, z, t), is also represented using a cubic polynomial.
Equations (5.6) to (5.9) can be solved for the 4M unknown coefficients of the M
cubic polynomials. Once the coefficients are determined, the integrals in Eq. (5.1)
can be calculated using Gauss-Legendre quadrature, i.e. the right hand side of
Eq. (5.1) is evaluated for all the 2M collocation points.
On the left hand side of Eq. (5.1), the convection has a hyperbolic nature and
describes the upward transport of the particulate phase. Because of the small values
of the drift velocity, upwinding is not a concern here and the convection term is
discretized using a second order finite difference method (Patankar, 1980). Along
the z-axis of symmetry of the canister geometry, the physical domain of the particle-
76
propellant system is discretized into N uniformly spaced grid points. The time step
for explicit time marching, demanded by the convection term, can be estimated
using the CFL (Courant-Friedrichs-Lewy) condition, based on the Courant number
(LeVeque, 2002):
Ud ∆t
∆z< Cmax (5.10)
where ∆z is the grid size, and Cmax is the maximum allowed Courant number. The
maximum value of Ud, corresponding to the largest flocs which may appear in the
canister, is of order of magnitude 1 mm/sec. The order of magnitude of the grid
size is 1 mm, and Cmax is set to be 1. Therefore, the time step demanded by the
CFL condition is of order of magnitude of 1 sec. The CFL condition provides an
upper bound for the time step.
The time scale of flocculation does not remain constant throughout the evolution
of the process. It is short at the beginning, but when the size distribution approaches
a steady state, the time scale approaches infinity. In contrast, the time scale of
convection has its maximum value at the beginning, and becomes shorter as larger
particles gradually appear in the canister. Due to the marked changes of time
scale, normally by two orders of magnitude, the first order time derivative on the
left hand side of Eq. (5.1) needs special treatment. The fourth order - fifth order
Runge-Kutta-Fehlberg (RKF45) (Atkinson et al., 2011; Burden and Faires, 2010) is
an appropriate scheme for this purpose. RKF45 adaptively adjusts the time steps
so that the estimated relative error falls between two prescribed bounds. Here, the
minimum and maximum values for the relative error are set to be 10−5 and 10−4,
respectively.
77
To implement the numerical approach, an in-house C program was developed. To
investigate grid independence of the results, two different size computational grids
were considered. One with M=150 and N=75, and another one with M=200 and
N=100. The variation of the volume fraction of particles at the canister bottom was
calculated as a function of time, using the two grids. The differences between the
results were observed to be less than 3.5% during the first six minutes of evolution
of the process.
5.2.3 Validation of the numerical approach
In the absence of the convection term, numerical solution of Eq. (5.1) can be val-
idated against an analytical solution (Scott, 1968; Gelbard and Seinfeld, 1978).
Since the mathematical model of flocculation poses the greatest numerical challenge
whereas the convection term does not pose any numerical difficulty, validation of the
numerical solution of Eq. (5.1) in the absence of the convection term is worthwhile.
To obtain an analytical solution, an exponential initial size distribution is con-
sidered:
n(d, 0) = 3 d 2 exp(−d 3) (5.11)
in which d = d/d0 where d0 is the mean initial diameter. Also n = n d0/N0
where N0 is the total initial number concentration of particles. Assuming a con-
stant flocculation kernel, β = β0, analytical solution of the flocculation equation for
78
initial distribution of Eq. (5.11) is given as the following:
n(d, τ) =12 d 2
(τ + 2)2exp
(−d 3
τ + 2
)(5.12)
where τ = N0β0t is the dimensionless time.
To demonstrate the validity of the present approach, the evolution of the size
distribution of Eq. (5.11) is numerically simulated, using M=150 elements. The re-
sults of the simulation along with the analytical solution of Eq. (5.12) are depicted
in Fig. 5.3. Excellent agreement between the numerical and exact solution is ob-
tained. This suggests that the present simulation approach can also be successfully
applied to solve Eq. (5.1).
0
0.2
0.4
0.6
0.8
1
1.2
1.4
0 0.5 1 1.5 2 2.5 3
nd
0/
N0
d / d0
Numerical solutionAnalytical solution
Figure 5.3: Results of the validation run: Numerical solution of Eq. (5.1) in the absenceof the convection term is compared with the analytical solution, for particles with aninitially exponential size distribution and constant flocculation kernel.
79
The finite-domain error, which arises from bounding the infinite domain of par-
ticle diameter, could potentially give rise to spurious results. In fact, the value of
the upper bound of the finite domain, dmax, is a major consideration, because that
should be higher than the size of the largest particles which may appear in the
canister. Our numerical experiments reveal that these large particles remain of the
order of magnitude of the initial MMD, see e.g. Fig. 5.9 in the next section, while
in the computational code, dmax is set to be at least 33 times larger than the initial
MMD. This promises a negligible finite-domain error. A method for quantitative
analysis of the finite-domain error in the absence of the convection term is given by
Gelbard and Seinfeld (1978).
5.3 Results and Discussion
Inside the canister, the variations of volume fraction and phase separation are
affected by several physical parameters. Among these, the effects of the follow-
ing, which are most relevant to the present mathematical model, are underscored:
the initial volume fraction Vfr0 , effective density difference Λ, and initial size dis-
tribution, i.e. MMD0 and GSD0. To demonstrate the current method, the effect
of these parameters on the characteristic time of phase separation, Tps, is simulated
for nine different cases, and the results are summarized in Table 5.1. The first case
is the reference, representing typical values of these parameters, while the other
eight cases represent variations of the parameters within their practical range. The
parameter values of Table 5.1 are also used in the following illustrations.
The present numerical approach deals with the size distribution function, not
the number of particles with a particular size. For monodisperse particles, the
80
initial size distribution is singular. Instead, in Table 5.1, case 4, monodispersity is
approximated by a narrow size distribution with initial GSD of 1.02.
Case Vfr0 Λ( kgm3 ) MMD0 (µm) GSD0 Tps (s)
1 0.03 150 2.0 1.5 71.5
2 0.03 150 1.0 1.5 74.2
3 0.03 150 3.0 1.5 65.7
4 0.03 150 2.0 1.02 74.3
5 0.03 150 2.0 2.0 43.0
6 0.03 50 2.0 1.5 141.0
7 0.03 300 2.0 1.5 46.2
8 0.01 150 2.0 1.5 99.6
9 0.05 150 2.0 1.5 63.3
Table 5.1: The effects of the initial volume fraction, effective density difference, andinitial size distribution on the characteristic time of phase separation.
The evolution of the particulate phase in the canister is a process with a varying
time scale. The explicit RKF45 scheme adaptively adjusts its time steps to the
time scale. Thus, variations of the time step are an indication of the variations of
the time scale, and provide insight into the rate of evolution of the process. The
time steps of RKF45 are given in Fig. 5.4 as a function of time for case 2. It is
evident that the time step varies by two orders of magnitude. Though the time step
demanded by flocculation increases through time, the gradual appearance of large
flocs tends to decrease the time step demanded by the convection term. This leads
to some fluctuations in the time step after t=30 s, as is illustrated in Fig. 5.4. The
maximum time step, however, is always restricted by the CFL condition.
Of particular interest is the bottom of the canister, where the dose is usually
81
10-2
10-1
100
10-1
100
101
102
Tim
e st
ep (
s)
Time (s)
Figure 5.4: Variations of the time step of explicit time marching as a function of timefor case 2.
taken. The other place of interest is the surface of the propellant, where drug par-
ticles accumulate and build up a cream layer (see Fig. 5.2). The present simulation
can predict the variations of the size distribution throughout the canister except
at the surface, i.e. the cream layer where the flocs are highly concentrated and
the present model of flocculation is no longer valid. Indeed, much larger flocs may
appear within the cream layer, compared to those which appear in the bulk of the
propellant. Nevertheless, the simulation can still predict the total mass of the par-
ticles which accumulate at the surface, since that is governed by convection, not
flocculation.
The variations of the normalized volume fraction at the bottom of canister, as a
function of time is given in Fig. 5.5. The volume fraction divided by its initial value
is referred to as the normalized volume fraction. The variations of the normalized
mass accumulated at the surface of the propellant, as a function of time, is given in
82
0
0.2
0.4
0.6
0.8
1
0 50 100 150 200 250 300 350 400
Vfr
/ V
fr0 a
t th
e b
ott
om
of
the c
anis
ter
Time (s)
Case 1Case 2Case 3Case 4Case 5Case 6Case 7Case 8Case 9
Figure 5.5: Normalized volume fraction vs. time, at the bottom of the canister.
Fig. 5.6. The normalized mass is defined to be the mass of the concentrated cream
layer divided by the total mass of the particles in the canister.
All the nine cases listed in Table 5.1 are considered in Fig. 5.5 and 5.6. Both
figures make obvious that the effective density difference is the most significant pa-
rameter that controls the transport of the particulate phase. This parameter directly
contributes to the convection term as well as the flocculation kernel (Eq. (5.1)-(5.3)).
In Fig. 5.5, the steep decline of normalized volume fraction for case 5 is due to the
rapid migration of the large particles existing in the initial size distribution. Fig-
ures 5.5 and 5.6 also illustrate the marked effect of initial volume fraction, and
insignificant effect of initial size distribution (except for the case of GSD0=2.0).
Figure 5.7 illustrates the normalized volume fraction vs. normalized height level
at different times, for case 1 in Table 5.1. The normalized height level (z) is de-
fined to be the height of a position (z) divided by the height of the surface of the
83
0
5
10
15
20
25
30
35
0 50 100 150 200 250 300 350 400
Norm
ali
zed
mass
accum
ola
ted
at
the s
urf
ace (
%)
Time (s)
Case 1Case 2Case 3Case 4Case 5Case 6Case 7Case 8Case 9
Figure 5.6: Normalized mass accumulated at the surface, as a function of time.
propellant (H), i.e. z = z/H. The changes in the volume fraction, as depicted in
Fig. 5.7, propagate like a wave through different height levels, from the bottom to
the top. As a result, at each time, the volume fraction is reduced at some lower
levels but remains virtually unchanged at upper levels which have not yet received
the wave of diminution. For instance, at t=213 s, the normalized volume fraction at
normalized heights higher than 0.2 is almost unchanged. This implies that nearly
all the particles that have convected upward accumulate at the propellant surface
instead of distributing over levels below the surface. It should be noted that the
normalized volume fraction at the propellant surface is not given in Fig. 5.7.
While the normalized volume fraction does not change for sufficiently high z
levels, the particle size distribution varies significantly at all levels. For example,
Fig. 5.8 depicts the variations of the size distribution of particles through time,
at the bottom of the canister, for case 1 in Table 5.1. The results are illustrated
84
0.2
0.4
0.6
0.8
1
10-2
10-1
100
Vfr
/ V
fr0
z / H
t= 76.74 s
t= 94.66 s
t= 116.21 s
t= 142.53 s
t= 174.51 s
t= 213.31 s
t= 260.95 s
t= 319.48 s
Figure 5.7: Normalized volume fraction vs. normalized height level for case 1.
in terms of dimensionless groups. The independent variable is d/MMD0, and the
dependent variable is nMMD0/N0 whereN0 is the total initial number concentration
of particles. The left panel of Fig. 5.8 depicts the size distribution during the first few
seconds, and the right panel depicts that during the first few minutes. These figures
illustrate an increase in the average size through the first few seconds, followed by
a decrease. The former is because of the flocculation, and the latter is caused by
the faster upward migration of the larger particles. Figure 5.9 depicts the variations
of the size distribution through time, at the location z = 0.8, for case 1 in Table
5.1. In this figure, the size distribution initially remains unaffected by the wave of
diminution for a relatively long time. Thus, the average size of particles in Fig. 5.9
keeps growing much longer compared to Fig. 5.8.
85
0
0.5
1
1.5
2
0 0.5 1 1.5 2 2.5 3
nMMD0/N0
d / MMD0
t=0 s
t=0.35 s
t=0.79 s
t=1.34 s
t=1.97 s
t=2.75 s
t=3.87 s
t=5.33 s
0
0.001
0.002
0.003
0.004
0.005
0.006
0.007
0.008
0 1 2 3 4 5 6
nMMD0/N0
d / MMD0
t=76.74 s
t=94.66 s
t=116.21 s
t=142.53 s
t=174.51 s
t=213.31 s
t=260.95 s
t=319.48 s
Figure 5.8: Variations of the size distribution at the bottom of the canister for case 1,during the first few seconds (left panel), and first few minutes (right panel).
0
0.002
0.004
0.006
0.008
0.01
0 1 2 3 4 5 6 7 8 9
n M
MD
0 /
N0
d / MMD0
t=76.74 s
t=94.66 s
t=116.21 s
t=142.53 s
t=174.51 s
t=213.31 s
t=260.95 s
t=319.48 s
Figure 5.9: Variations of the size distribution at the location z = 0.8 for case 1, duringthe first few minutes.
86
6. Conclusion
An idealized geometry representative of real infant nasal geometries in its aerosol
deposition characteristics was introduced in Chapter 2. While real infant nasal
airways are morphologically quite complicated, the idealized geometry presented
here enjoys the advantage of simplicity. In spite of its fairly simple form, its aerosol
deposition agrees with the average of deposition in real airways for 10 subjects in
the 3–18 month age range. This geometry is proposed as a possible in vitro reference
for examining the lung delivery of aerosols to infants.
The effect of using helium-oxygen instead of air on hygroscopic size changes and
deposition of inhaled volatile aerosols was investigated in Chapter 3. The effects
of aerosol mass fraction variation were also underscored. Three different values for
total inhaled mass of salt (NaCl) per minute, ψ, were examined. The high value
of ψ represents the total inhaled salt from a typical high output rate nebulizer,
while the low value of ψ represents the case in which hygroscopic size changes are
significant. To investigate the differences in He-O2 and air deposition caused by
hygroscopic size changes, the hygroscopic effectiveness, λ, was defined. The values
of λ confirm that the differences between deposition with helium-oxygen vs. air,
caused by hygroscopicity, are trivial for high mass fraction, and more noticeable for
medium and low mass fractions.
87
Two size manipulation processes were suggested in Chapter 4, aimed at improv-
ing the deposition of nebulized saline aerosols. Each process provides the necessary
circumstances for the evaporation and shrinkage of the droplets. In the HA process,
the aerosol stream is warmed up. The vapor pressure at the surface of the droplets
increases, and evaporation starts as a result. The HA process takes place within
a heating chamber. In the second process, EA, solid NaCl particles are added to
the aerosol flow. These particles absorb water vapor from the air and result in the
evaporation of the saline droplets. The EA process takes place within a mixing
chamber. Both the HA and EA processes are shown to produce shrunk droplets
with favorable lung deposition characteristics. The results could be useful in the
development and design of add-on devices to improve aqueous aerosol drug delivery
to the lungs.
In Chapter 5 a simulation approach was presented to model the flocculation and
transport of solid particles suspended in a liquid propellant. The collision frequency
of particles, and thereby flocculation, was presumed to be influenced by upward
velocity differential, Brownian motion and van der Waals force. The repulsive elec-
trostatic force was assumed negligible. The governing mathematical model was a
nonlinear transient partial integro-differential equation in which flocculation was
described by the Smoluchowski equation and transport of the particles was speci-
fied via a convection term. Different terms in the mathematical model were tackled
using different numerical schemes. The time derivative was resolved using fourth
order - fifth order Runge-Kutta-Fehlberg (RKF45) scheme, the convection term was
discretized using a second order finite difference approach, and the flocculation in-
tegrals were analyzed using the method of orthogonal collocation on finite elements.
88
The results specify the evolution of the suspension from an arbitrary initial con-
dition. The influences of the initial volume fraction of particles, effective density
difference, and initial size distribution of particles are documented. The results in-
dicate that, compared to the other parameters, the effective density difference has
a more pronounced effect on the transport of the particulate phase and phase sepa-
ration. The present model and numerical approach may be useful to those desiring
to understand and predict the behaviors of new and existing MDI formulations for
the purpose of improved respiratory drug delivery.
89
Bibliography
Albers, W., Overbeek, J.T.G., 1959a. Stability of emulsions of water in oil: I. the cor-
relation between electrokinetic potential and stability. Journal of Colloid Science 14,
501–509.
Albers, W., Overbeek, J.T.G., 1959b. Stability of emulsions of water in oil: II. charge as
a factor of stabilization against flocculation. Journal of Colloid Science 14, 510–518.
Amirav, I., Newhouse, M.T., 2012. Deposition of small particles in the developing lung.
Paediatric Respiratory Reviews 13, 73–78.
Ansys CFX, Release 12.1. help system. ANSYS, Inc.
Ari, A., Fink, J.B., 2010. Aerosol drug administration with helium-oxygen (heliox) mix-
tures: An overview. Current Respiratory Medicine Reviews 6, 80–85.
Atkinson, K., Han, W., Stewart, D.E., 2011. Numerical solution of ordinary differential
equations. Wiley.
Becquemin, M., Swift, D., Bouchikhi, A., Roy, M., Teillac, A., 1991. Particle deposition
and resistance in the noses of adults and children. European Respiratory Journal 4,
694–702.
Benjamin, M.M., 2011. Clarification of a common misunderstanding of collision frequencies
in the Smoluchowski equation. Journal of Environmental Engineering 137, 297–300.
Bennett, W.D., Zeman, K.L., Jarabek, A.M., 2008. Nasal contribution to breathing and
fine particle deposition in children versus adults. Journal of Toxicology and Environ-