Aerosol Penetration Through Protective Fabrics Milan Jamriska Human Protection and Performance Division Defence Science and Technology Organisation DSTO-TR-2348 ABSTRACT The aerosol penetration efficiency and quality factor for three Chemical Biological Radiological protective fabrics were evaluated using a particle counting technique. Both parameters characterise aerosol penetration through tested material; the latter accounts for the effect of fabrics air permeability. The overall and size dependent penetrations of 0.03–3 μm sized Sodium Chloride (NaCl) and Di-Ethyl-Hexyl-Sebacate (DEHS) aerosols were measured through fabrics at three different constant air face velocities (5, 10 and 25 cm/s). Penetration was size dependent with the most penetrating particle size (MPPS) at about 0.5 μm. Increasing the air face velocity increased the penetration of ultrafine particles (smaller than 0.3 μm), decreased penetration of the supermicrometer particles (larger than 1 μm) and shifted the MPPS towards smaller diameters. The quality factors were governed by air permeability. The fabrics with higher permeability showed higher quality factor values, thus indicating better protection for a given air pressure drop. The observed dependencies were generally in good agreement with air filtration theory. RELEASE LIMITATION Approved for public release
Transcript
Aerosol Penetration Through Protective Fabrics
Milan Jamriska
Human Protection and Performance Division Defence Science and Technology Organisation
DSTO-TR-2348
ABSTRACT The aerosol penetration efficiency and quality factor for three Chemical Biological Radiological protective fabrics were evaluated using a particle counting technique. Both parameters characterise aerosol penetration through tested material; the latter accounts for the effect of fabrics air permeability. The overall and size dependent penetrations of 0.03–3 µm sized Sodium Chloride (NaCl) and Di-Ethyl-Hexyl-Sebacate (DEHS) aerosols were measured through fabrics at three different constant air face velocities (5, 10 and 25 cm/s). Penetration was size dependent with the most penetrating particle size (MPPS) at about 0.5 µm. Increasing the air face velocity increased the penetration of ultrafine particles (smaller than 0.3 µm), decreased penetration of the supermicrometer particles (larger than 1 µm) and shifted the MPPS towards smaller diameters. The quality factors were governed by air permeability. The fabrics with higher permeability showed higher quality factor values, thus indicating better protection for a given air pressure drop. The observed dependencies were generally in good agreement with air filtration theory.
The base fabrics from three CBR protective suits were evaluated against two different aerosol challenges at a range of air face velocities which were representative of incident wind speeds. In particular, the total and size dependent penetration of Sodium Chloride (NaCl) and Di-Ethyl-Hexyl-Sebacate (DEHS) aerosols were measured in the particle size range 0.03–3 m through (i) Remploy Mark IV NBC over-garment (MKIV); (ii) Melba Industries Black CB coverall (BCB), and (iii) Paul Boye two piece suit (PB). Penetration efficiency characterising the ability of aerosol to penetrate through tested fabrics, and quality factors (QF) characterising fabrics performance independently of their air permeability, were measured at constant air face velocities of 5, 10 and 25 cm/s and PM10 (Particulate Matter smaller than 10 µm) challenge levels between 1 – 30 mg/m3. Testing was conducted for new swatch samples in typical indoor environmental conditions (T~22°C; RH~45%). The total penetration was relatively high 70–90%, and corresponding quality factor values varied from 0.8 to 34 kPa-1. The optimum performance (lowest penetration measured at a constant air face velocity) was observed for the MKIV. Penetration through BCB and PB fabrics was comparable and higher than for the MKIV. The best performance based on quality factor, that is penetration normalised by air pressure drop across fabrics for a given air velocity, was observed for BCB fabrics. Measurements of the size dependent penetration were conducted for particles in three size categories: (i) ultrafine (UFP; 0.03 – 0.3 m); (ii) fine (FP; 0.3–1 m), and (iii) coarse particles (CP; 1–3 m). The highest penetration was observed for fine particles (77–93%) which was expected, as this includes the most penetrating particle size (MPPS) range at about 0.5 m. Penetration of ultrafine and coarse particles through the fabrics was lower and in the range of 66–88% and 28–80%, respectively. The penetration was dependent on air face velocity: a direct relationship was observed for UFP and FP (penetration increased with air face velocity), and indirect for CP. Aerosol material and size characteristics played a significant role in penetration efficiency. Testing using the DEHS aerosols produced higher total penetration compared to NaCl results and thus the DEHS may be a more suitable challenge for evaluation of fabric performance, where a conservative estimate is required. The effects of aerosol material and size characteristics were statistically significant (p=0.05). The observed dependencies were in good agreement with air filtration theory. Performance evaluation of fabrics based on total penetration should be done with simulants matching the size parameters of anticipated CBR agents and tested at air face velocity ranges occurring in real-world conditions. The presented results provide total and size dependent quantification of penetration efficiency measured for a range of test conditions and can be used as part of an accurate assessment of dermal exposure to personnel operating in CBRN environments.
Author
Milan Jamriska Human Protection and Performance Division Dr Jamriska is a Senior Research Scientist with 15 years of academia experience in aerosol physics. He has published more than thirty research papers in peer reviewed scientific journals and attracted research funding totalling close to one million dollars. Dr Jamriska joined DSTO in 2005 to establish and support CBRN aerosol R&D capabilities. His current work is focused on the characterisation of protective barrier fabrics and respirators against airborne CBRN threats and development of new IPE materials. Other areas of his research include T&E and R&D of aerosol sampling devices and development of new detection methods for aerosols of biological and non-biological origin.
3.2.1 Total Aerosol Penetration in 0.03–3 m Size Range ......................... 10 3.2.1.1 Comparison of Total Penetration through Individual Fabrics........ 11 3.2.1.2 The Effect of Air Face Velocity on Total Penetration ....................... 12 3.2.2 Total Quality Factor for Aerosol in the 0.03–3 m Size Range........ 12
3.3 Penetration of Aerosol of Different Size Classes ............................................. 13 3.3.1 Penetration of NaCl Aerosol ................................................................ 13 3.3.2 Penetration of DEHS Aerosol .............................................................. 15
3.4 Quality Factors for Aerosol of Different Size Classes ..................................... 17 3.4.1 Quality Factor for NaCl Aerosol ......................................................... 17 3.4.2 Quality Factor for DEHS Aerosol........................................................ 18
ASHRAE American Society for Heating Air-conditioning and Engineering
ASTER Aerosol Swatch Test Rig
CDw Concentration Downstream
CUp Concentration Upstream
CMD Count Median Diameter
CBRN Chemical, Biological, Radiological and Nuclear
CMD Count Median Diameter
CP Coarse Particles
Dp Particle Diameter
DEHS Di-Ethyl–Hexyl-Sebacate
E Collection Efficiency
FP Fine Particles
Air Permeability
HEPA High Efficiency Particle Air filter
IPE Individual Protective Equipment
MPPS Most Penetrating Particle Size
NaCl Sodium Chloride
P Penetration Efficiency
PSD Particle Size Distribution
PM10 Particulate Matter with aerodynamic diameter smaller than 10 m
QF Quality Factor
SMPS Scanning Mobility Particle Sizer
SDF Singapore Defence Force
UFP Ultrafine Particles
ΔP Pressure Drop across the swatch sample
DSTO-TR-2348
1. Introduction
Provision of effective protection for personnel operating in Chemical, Biological Radiological and Nuclear (CBRN) environments requires the use of individual protective equipment (IPE) to eliminate or minimise respiratory and dermal exposure to hazardous materials. Efforts in dermal protection for the Australian Defence Force (ADF) have traditionally focused on CBRN threats in liquid, gaseous or vaporous forms with minimal research into protection against aerosolised threats. An aerosol in this context is defined as a solid or liquid (droplet) particle suspended in the air [1]. Relatively little information is available on the performance of IPE fabrics against aerosols, including understanding of the aerosol-fabric interaction; aerosol collection mechanisms; governing parameters and their dependencies. The assessment of performance of in-service IPE against aerosols will provide information regarding the protection levels afforded by these materials. Such assessments will also assist in selection or development of appropriate IPE materials for future protective ensembles against relevant CBRN aerosolised threats. Evaluation of the performance of IPE fabrics against aerosols provides only one component of the information required to determine the performance of entire ensembles, as fabric testing does not account for suit system level effects, suit closures or suit design aspects. The aim of this study was to quantify the aerosol penetration through IPE suit fabrics against a range of representative challenges. Specific objectives were to quantify aerosol penetration through three types of air permeable IPE fabric swatches with regards to the following test conditions:
Characterisation of fabric performance as a function of aerosol size
Determination of aerosol penetration as a function of air face velocity
Determination of aerosol penetration as a function of aerosol challenge material
2. Methodology
2.1 Theory
Aerosols are captured by air permeable fabrics either on the fabric surface or within its structure and the process is affected by the following factors:
1. Hydrostatic force causing air and aerosol to pass through the fabric. The force is induced by wind or relative movement of air against the body and is characterised by the air pressure difference across the fabrics;
2. Fabric characteristics including: material porosity, structure, thickness, and air permeability;
3. Aerosol characteristics including: size; concentration; shape, type of material, and electrostatic charge.
1
DSTO-TR-2348
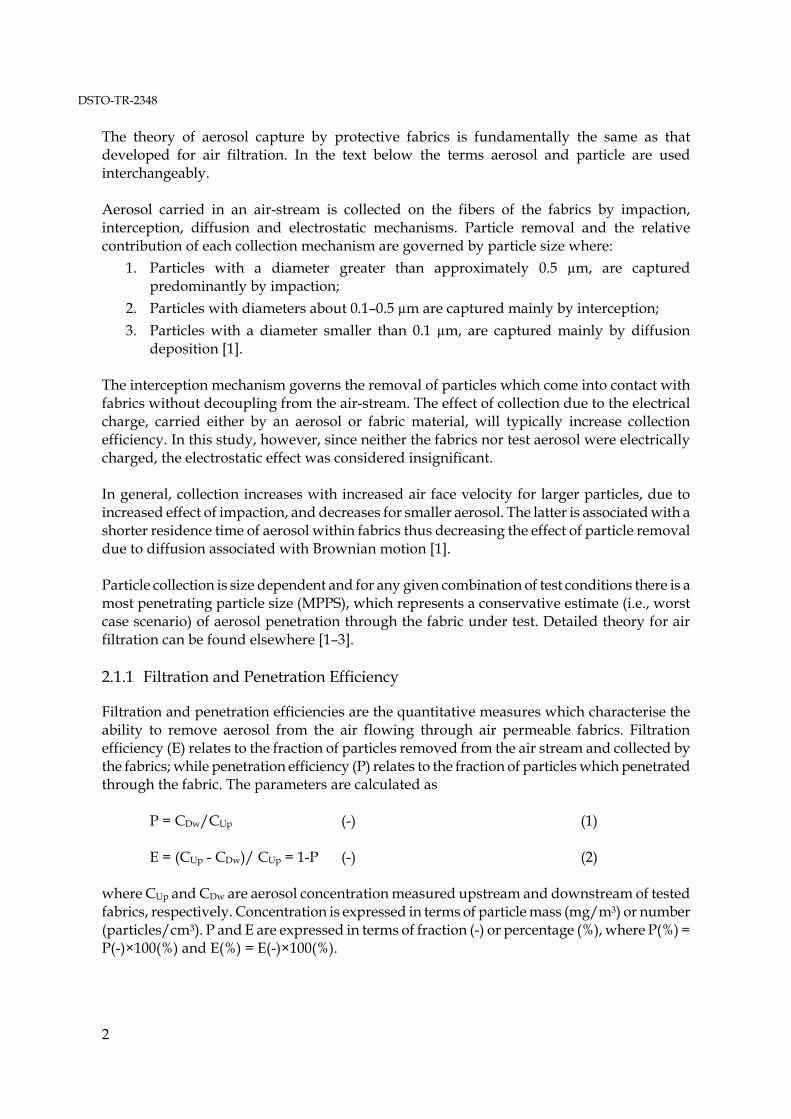
The theory of aerosol capture by protective fabrics is fundamentally the same as that developed for air filtration. In the text below the terms aerosol and particle are used interchangeably. Aerosol carried in an air-stream is collected on the fibers of the fabrics by impaction, interception, diffusion and electrostatic mechanisms. Particle removal and the relative contribution of each collection mechanism are governed by particle size where:
1. Particles with a diameter greater than approximately 0.5 µm, are captured predominantly by impaction;
2. Particles with diameters about 0.1–0.5 µm are captured mainly by interception;
3. Particles with a diameter smaller than 0.1 µm, are captured mainly by diffusion deposition [1].
The interception mechanism governs the removal of particles which come into contact with fabrics without decoupling from the air-stream. The effect of collection due to the electrical charge, carried either by an aerosol or fabric material, will typically increase collection efficiency. In this study, however, since neither the fabrics nor test aerosol were electrically charged, the electrostatic effect was considered insignificant. In general, collection increases with increased air face velocity for larger particles, due to increased effect of impaction, and decreases for smaller aerosol. The latter is associated with a shorter residence time of aerosol within fabrics thus decreasing the effect of particle removal due to diffusion associated with Brownian motion [1]. Particle collection is size dependent and for any given combination of test conditions there is a most penetrating particle size (MPPS), which represents a conservative estimate (i.e., worst case scenario) of aerosol penetration through the fabric under test. Detailed theory for air filtration can be found elsewhere [1–3]. 2.1.1 Filtration and Penetration Efficiency
Filtration and penetration efficiencies are the quantitative measures which characterise the ability to remove aerosol from the air flowing through air permeable fabrics. Filtration efficiency (E) relates to the fraction of particles removed from the air stream and collected by the fabrics; while penetration efficiency (P) relates to the fraction of particles which penetrated through the fabric. The parameters are calculated as
P = CDw/CUp (-) (1)
E = (CUp - CDw)/ CUp = 1-P (-) (2)
where CUp and CDw are aerosol concentration measured upstream and downstream of tested fabrics, respectively. Concentration is expressed in terms of particle mass (mg/m3) or number (particles/cm3). P and E are expressed in terms of fraction (-) or percentage (%), where P(%) = P(-)×100(%) and E(%) = E(-)×100(%).
2
DSTO-TR-2348
Aerosol penetration through swatch samples is typically tested using either (i) constant air face velocity, as used in this study; or (ii) constant air pressure drop across the fabric. The resistance to air flowing through fabrics creates the pressure drop expressed as the difference between static pressures measured upstream and downstream of a swatch sample. The airflow resistance is characterised by air permeability (, calculated as the ratio of air face velocity (v) and corresponding pressure drop (ΔP)
v/ΔP [m s-1/kPa] (3) Fabrics with higher air permeability exhibit a lower pressure drop at a given air face velocity and allow higher air flowrate (i.e., air face velocity) for a given pressure drop [1]. The performance of fabrics with different air permeability values was compared using a Quality Factor (QF) defined as [1][4]:
QF=-ln(1/P)/ΔP (1/kPa) (4) where P (-) is the aerosol penetration; and ΔP (kPa) the pressure drop across the swatch sample. The quality factor expresses penetration (natural logarithm of P value) normalised by air pressure drop. The parameter allows comparison of performance of fabrics with different air permeability. Comparison of QFs must be made at the same air face velocity and aerosol size characteristics [1]. The greater the QF value, the better the protection provided by the fabric, where the optimum fabric is one which provides the best collection efficiency with the least pressure drop. Depending on the aerosol size range and resolution considered for calculation, three categories of penetration efficiency P and quality factor QF are presented in this study:
1. Total Penetration and Quality Factor (PTotal, QFTotal) for particles with diameter Dp within the measured size range (0.03–3.00 m in this study)
2. Fractional Penetration P(Dpi) for particles within a specific size range, which corresponds to one of the 32 particle size channels (equi-spaced on the logarithmic scale) used to break up the dataset. Dpi refers to the mid-point of each data channel; and
3. Average Fractional Penetration (PAvg(Dp1, Dp2)) calculated as an average of P(Dpi) values for particles within a given size range (Dp1, Dp2). In this study the size ranges selected were representative of different types of filtration mechanisms and the type of biological particle, Table 1.
Table 1: Average fractional penetration ranges with the representative collection mechanism and
biological particle type
Particle size range Representative Biological particle type Particle classification
0.03–0.30 m Viruses [5] Ultrafine particles (UFP) 0.30–1.00 m Bacteria [5] Fine particles (FP) 1.00–3.00 m Anthrax spores[6] Coarse particles (CP)
3
DSTO-TR-2348
4
The notation for average fractional penetration (P) and quality factors (QF) of particles of different size categories is as follows:
(1) P(UFP); QF(UFP) penetration and quality factor for ultrafine particles;
(2) P(FP); QF(FP) penetration and quality factor for fine particles;
(3) P(CP); QF(CP) penetration and quality factor for coarse particles. 2.2 Experimental
2.2.1 Aerosol Test Rig
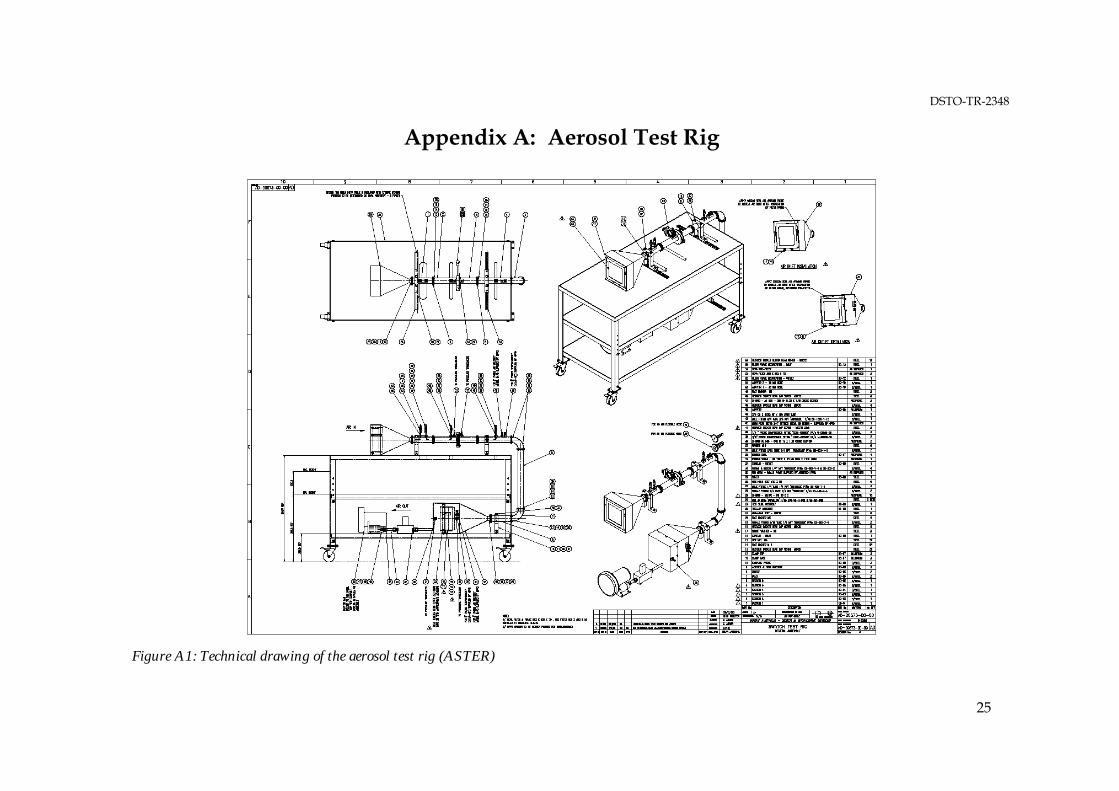
Aerosol penetration efficiency was measured in an aerosol swatch test rig (ASTER). Its design and test methodology were based on ASHRAE 52.2–1999 [7] for measuring size dependent collection efficiency of air filters. Modifications to the standard included a scale-down of the test rig, less stringent conditions for data quality assurance (QA) and a simplified method to calculate aerosol penetration and efficiency. The schematic diagram of the measuring system and a technical drawing are presented in Figure 1 and Figure 1A (Appendix A). 2.2.2 Experimental System
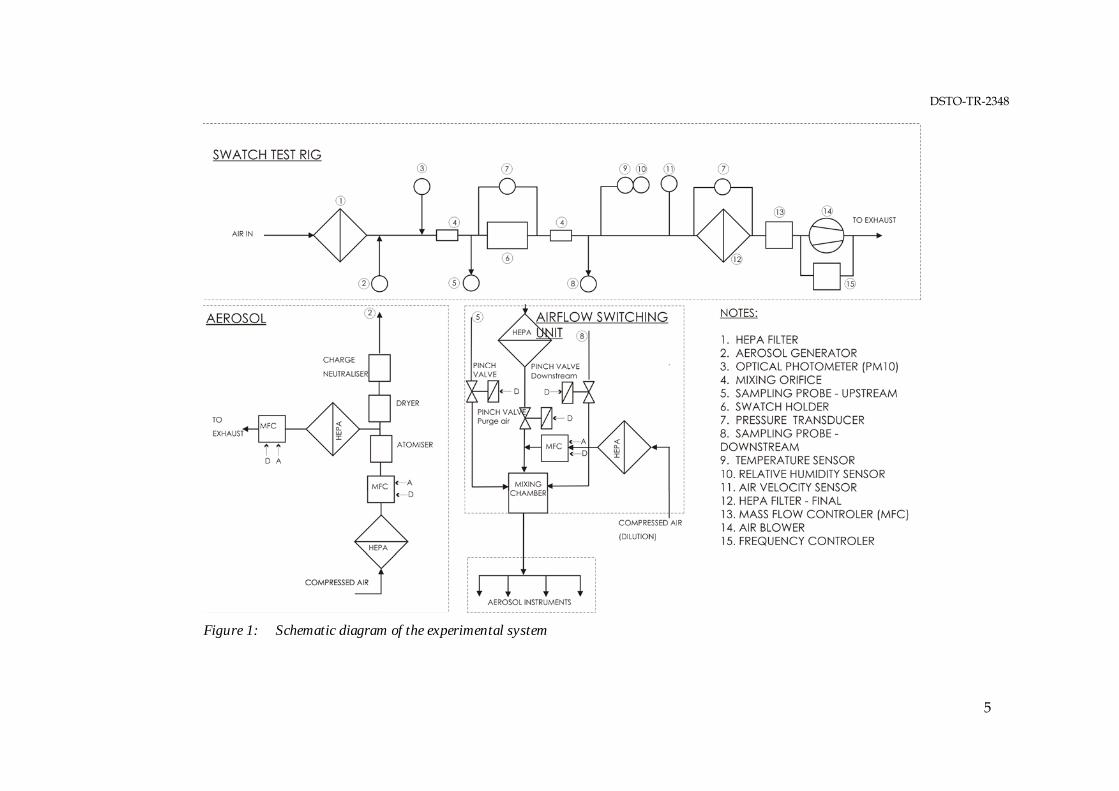
The system is operated as follows:
HEPA-filtered air was drawn into the main flow channel by a variable speed control air blower (see items (1) and (14) in Figure 1). The system operated under negative pressure and the airflow in the main channel was laminar [1].
Test aerosol generated by an aerosol generator (2) was introduced into, and mixed with, air flowing through the main flow channel (ID 46 mm). Perfectly mixed aerosol (mixing achieved by mixing orifices (4)) passed through the measured swatch sample, placed in a sample holder (6).
Pressure drop across the fabric swatch (surface area 16.6 cm2) was measured by a differential pressure sensor (TSI DP-Calc Model 8710). Air temperature and relative humidity were measured by sensors (10, 11) located downstream of the swatch sample.
Two identical, thin-wall iso-axial sampling probes (ID 7.6 mm) were used for upstream (5) and downstream (8) aerosol sampling [1, 8, 9].
ASTER and sampling lines were made of conductive materials (stainless steel and conductive rubber, respectively) and electrically grounded.
Upstream concentration of the aerosol challenge in the PM10 size range (particulate matter smaller than 10 m) was monitored by an Optical Photometer (DustTrak, TSI Model 8520) (3).
Aerosols not captured by the fabric swatch were filtered by a 2nd HEPA filter (12) and discharged into a fume hood.
DSTO-TR-2348
Figure 1: Schematic diagram of the experimental system
5
DSTO-TR-2348
2.2.3 Aerosol Sampling
The sampling was conducted under iso-kinetic sampling conditions [1, 8, 9], characterised by equal air face velocity in the main flow channel and at the inlet of air sampling probes. The conditions were achieved by adjusting flow rates of the measuring instrumentation and make–up air of the dilution system, as presented in Figure 1. 2.2.4 Aerosol Generation
The aerosol challenge was generated by a Collison nebuliser (BGI CN24) operated at 20 psi and airflow of approximately 1.7 L/min using clean compressed air. Generated particles were passed through a charge neutraliser (TSI Model 3054) and a diffusion dryer (TSI Model 3062) before being introduced into the main airflow channel. The air flowrate through the aerosol generator was controlled by a mass flow controller (MFC AAHLBORG). A schematic diagram of the aerosol generation system is presented in Figure 1. Both a liquid and a solid aerosol were used: (i) Sodium chloride (NaCl) 0.01% (w/v) solution in pure distilled water produced solid, cube-shaped particles. Since NaCl is hydroscopic, the measurements were conducted below its deliquescence point (RH~76%) [1]. (ii) Di-Ethyl-Hexyl-Sebacate (DEHS) produced spherical liquid droplets with density of 0.919 g/cm3. DEHS is an oily material commonly used for aerosol filtration testing [10]. 2.2.5 Measured Characteristics and Instrumentation
The aerosol challenge was characterised in terms of the particle number size distribution and concentration and PM10 mass concentration. The number size parameters were measured using a Scanning Mobility Particle Sizer (SMPS, TSI Model 3936L75) and Aerodynamic Particle Sizer (APS, TSI Model 3321) for the measurements of aerosol in 0.01–0.7 m and 0.7–10 m size ranges, respectively. Both instruments operated in parallel with a time resolution of 120 seconds. The sampling was performed in a sequence: (i) upstream; (ii) purging (HEPA filtered air); (iii) downstream. The air flow path was controlled semi-automatically by an airflow switching unit (TOPAS Model SYS 520). SMPS and APS were calibrated prior to measurements using monodisperse PSL (latex) spheres of known size. The mass concentration of aerosol challenge in the PM10 size range was monitored upstream of the swatch sample by an optical photometer (DustTrak) which provided readings every second. The aerosol challenge levels were controlled by regulating the flowrate of the air delivered from the aerosol generator into ASTER. The excess from the aerosol generator was exhausted into a fume hood. An overview of the aerosol measurement instrumentation is presented in Table 2.
6
DSTO-TR-2348
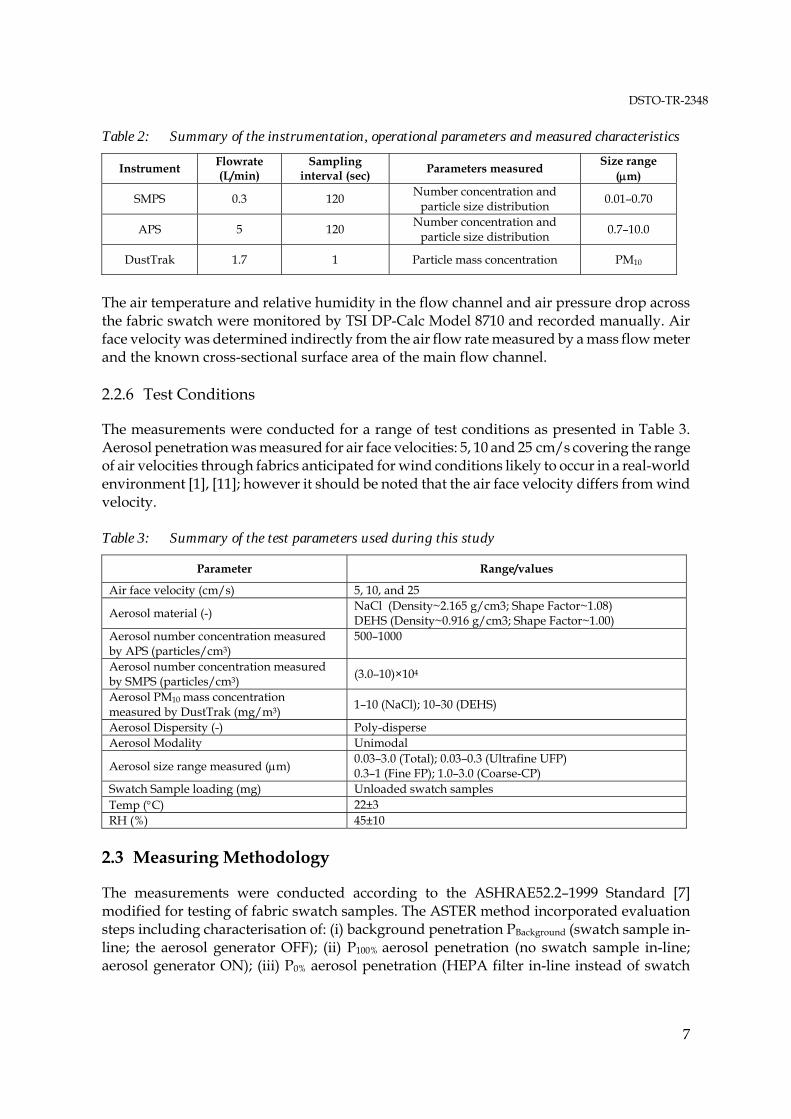
Table 2: Summary of the instrumentation, operational parameters and measured characteristics
Instrument Flowrate (L/min)
Sampling interval (sec)
Parameters measured Size range
(m)
SMPS 0.3 120 Number concentration and
particle size distribution 0.01–0.70
APS 5 120 Number concentration and
particle size distribution 0.7–10.0
DustTrak 1.7 1 Particle mass concentration PM10
The air temperature and relative humidity in the flow channel and air pressure drop across the fabric swatch were monitored by TSI DP-Calc Model 8710 and recorded manually. Air face velocity was determined indirectly from the air flow rate measured by a mass flow meter and the known cross-sectional surface area of the main flow channel. 2.2.6 Test Conditions
The measurements were conducted for a range of test conditions as presented in Table 3. Aerosol penetration was measured for air face velocities: 5, 10 and 25 cm/s covering the range of air velocities through fabrics anticipated for wind conditions likely to occur in a real-world environment [1], [11]; however it should be noted that the air face velocity differs from wind velocity. Table 3: Summary of the test parameters used during this study
The measurements were conducted according to the ASHRAE52.2–1999 Standard [7] modified for testing of fabric swatch samples. The ASTER method incorporated evaluation steps including characterisation of: (i) background penetration PBackground (swatch sample in-line; the aerosol generator OFF); (ii) P100% aerosol penetration (no swatch sample in-line; aerosol generator ON); (iii) P0% aerosol penetration (HEPA filter in-line instead of swatch
7
DSTO-TR-2348
sample; aerosol generator ON). These parameters were measured at the beginning and at the end of a set of experiments performed for a given test condition (i.e., type of fabrics; aerosol material and air face velocity). Prior to each round of measurements, ASTER was run for at least 30 minutes to achieve steady-state test conditions. The aerosol measurements (particle size distribution and number concentration) were conducted in a sequence: Upstream – Purge – Downstream – Purge. The purging cycle aimed to eliminate the memory effect of previous sampling. The sequence was repeated at least 5 times on triplicate fabric swatches for each test condition. The penetration efficiency and quality factors were calculated according to Equations 1 and 2, corrected for the effect of background and P100% [7]. To account for the effect of fluctuations in aerosol concentration between upstream-downstream measurements (measured in series), an average of two consecutive upstream readings was used as the Cup value (Equations 1, 2). For each sequence (upstream-downstream), a penetration value Pi was calculated as Pi=CDwi/((CUi+CUi+1)/2); i=1,2,…5. The presented results are the average of Pi values (±standard deviation). Particle size distributions measured by SMPS and APS were merged using commercial software (TSI Model 390069 Data Merge module) allowing analysis and characterisation of measured data over a 0.03–3.00 m aerosol size range. The results are expressed as particle number concentration versus aerodynamic particle diameter. 2.4 CBRN Protective Fabrics
Three different types of CBRN IPE suits used by Australian (ADF) and Singapore (SDF) Defence Force were evaluated. The fabrics evaluated were the base fabric for each of the following suits: (i) Remploy No.1 NBC MKIV over-garment (MKIV), which is in-service with the ADF; (ii) Melba Industries Black CB Suit (BCB), in-service with the Australian Incident Response Regiment; and (iii) Paul Boye (PB) suit, in-service with the Singapore defence Forces (SDF). The basic characteristics are presented in Table 4; for additional information see [12–14]. Swatches were cut from the garments assuming homogeneity of material. The assumption that the selected samples are representative for each fabric material was validated and confirmed by air permeability measurements.
8
DSTO-TR-2348
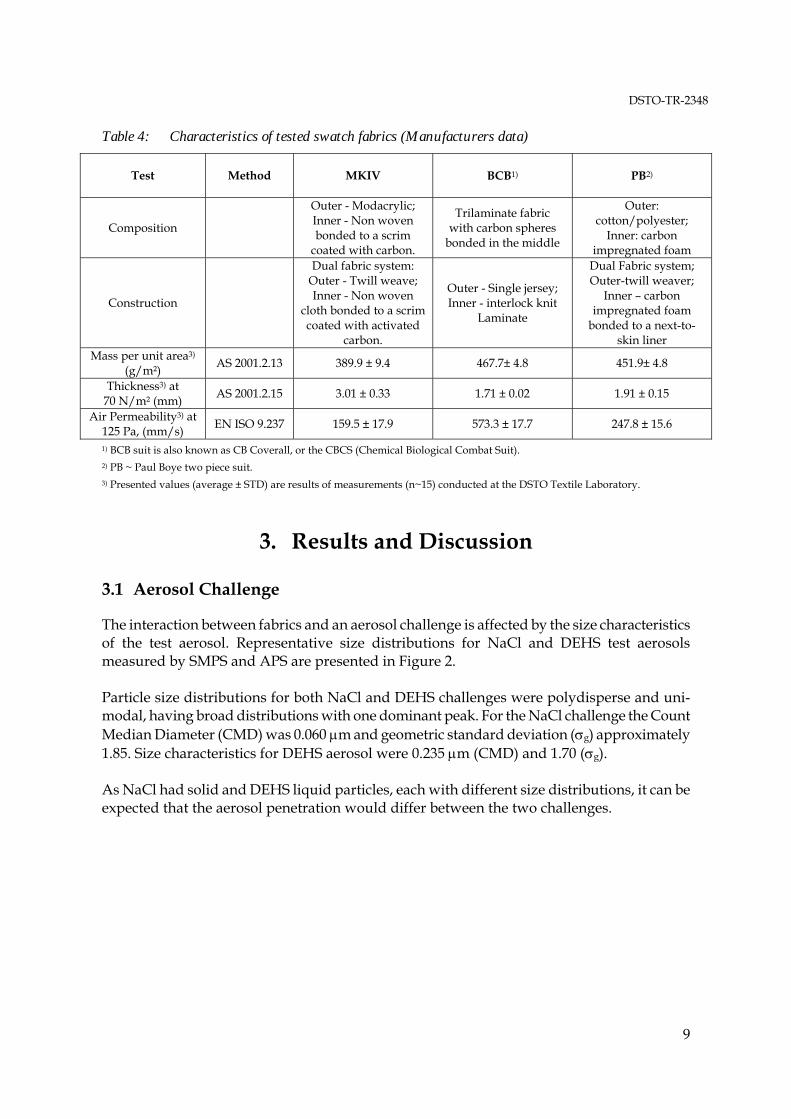
Table 4: Characteristics of tested swatch fabrics (Manufacturers data)
Test Method MKIV BCB1)
PB2)
Composition
Outer - Modacrylic; Inner - Non woven bonded to a scrim
EN ISO 9.237 159.5 ± 17.9 573.3 ± 17.7 247.8 ± 15.6
1) BCB suit is also known as CB Coverall, or the CBCS (Chemical Biological Combat Suit). 2) PB ~ Paul Boye two piece suit. 3) Presented values (average ± STD) are results of measurements (n~15) conducted at the DSTO Textile Laboratory.
3. Results and Discussion
3.1 Aerosol Challenge
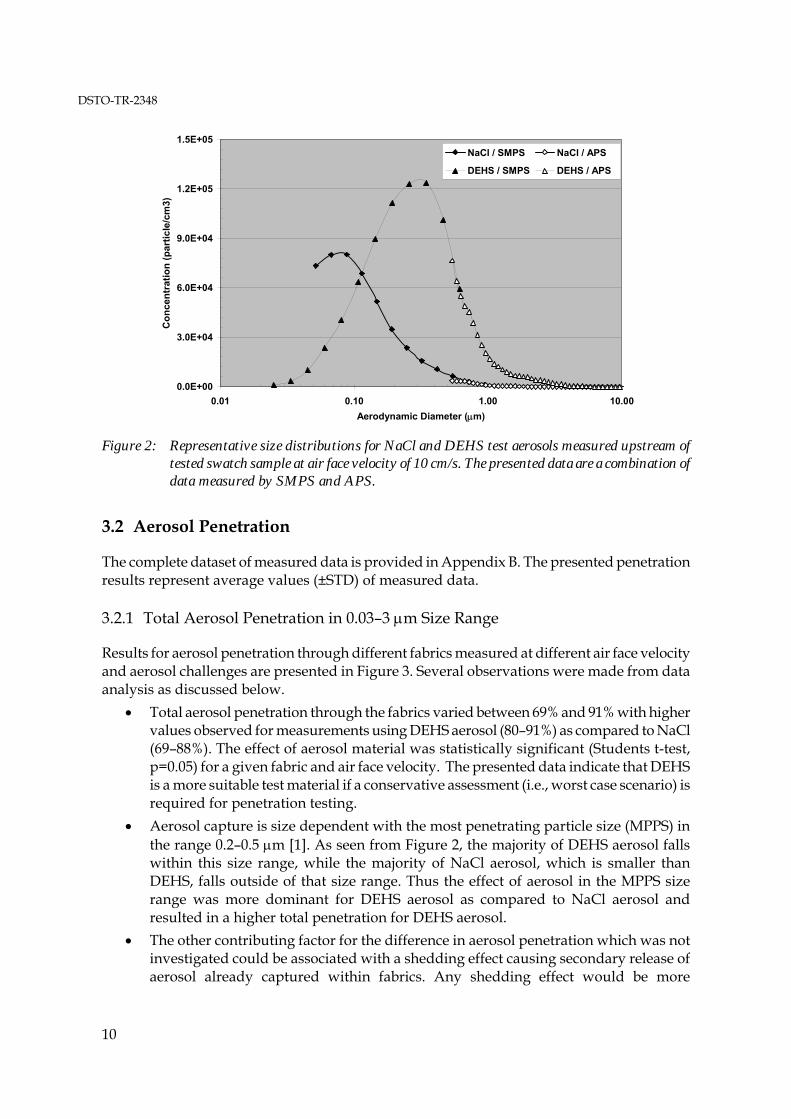
The interaction between fabrics and an aerosol challenge is affected by the size characteristics of the test aerosol. Representative size distributions for NaCl and DEHS test aerosols measured by SMPS and APS are presented in Figure 2. Particle size distributions for both NaCl and DEHS challenges were polydisperse and uni-modal, having broad distributions with one dominant peak. For the NaCl challenge the Count Median Diameter (CMD) was 0.060 m and geometric standard deviation (g) approximately 1.85. Size characteristics for DEHS aerosol were 0.235 m (CMD) and 1.70 (g). As NaCl had solid and DEHS liquid particles, each with different size distributions, it can be expected that the aerosol penetration would differ between the two challenges.
9
DSTO-TR-2348
0.0E+00
3.0E+04
6.0E+04
9.0E+04
1.2E+05
1.5E+05
0.01 0.10 1.00 10.00
Aerodynamic Diameter (m)
Co
nce
ntr
atio
n (
par
tic
le/c
m3)
NaCl / SMPS NaCl / APS
DEHS / SMPS DEHS / APS
Figure 2: Representative size distributions for NaCl and DEHS test aerosols measured upstream of
tested swatch sample at air face velocity of 10 cm/s. The presented data are a combination of data measured by SMPS and APS.
3.2 Aerosol Penetration
The complete dataset of measured data is provided in Appendix B. The presented penetration results represent average values (±STD) of measured data. 3.2.1 Total Aerosol Penetration in 0.03–3 m Size Range
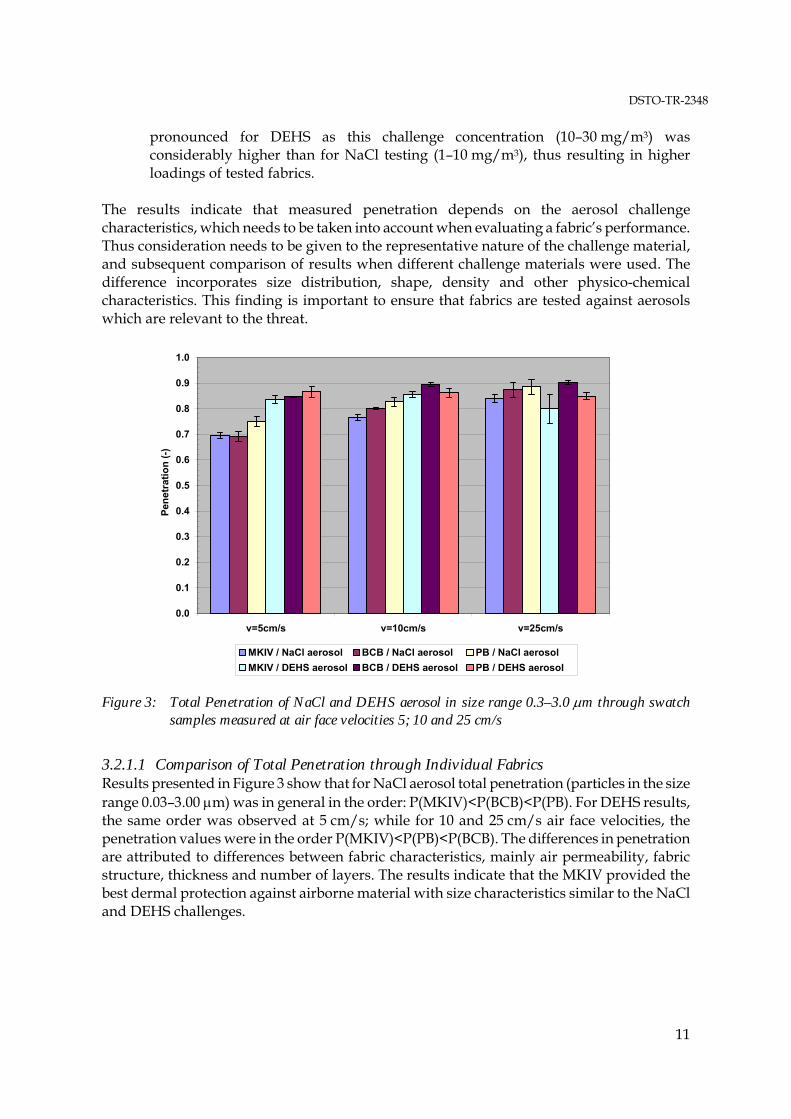
Results for aerosol penetration through different fabrics measured at different air face velocity and aerosol challenges are presented in Figure 3. Several observations were made from data analysis as discussed below.
Total aerosol penetration through the fabrics varied between 69% and 91% with higher values observed for measurements using DEHS aerosol (80–91%) as compared to NaCl (69–88%). The effect of aerosol material was statistically significant (Students t-test, p=0.05) for a given fabric and air face velocity. The presented data indicate that DEHS is a more suitable test material if a conservative assessment (i.e., worst case scenario) is required for penetration testing.
Aerosol capture is size dependent with the most penetrating particle size (MPPS) in the range 0.2–0.5 m [1]. As seen from Figure 2, the majority of DEHS aerosol falls within this size range, while the majority of NaCl aerosol, which is smaller than DEHS, falls outside of that size range. Thus the effect of aerosol in the MPPS size range was more dominant for DEHS aerosol as compared to NaCl aerosol and resulted in a higher total penetration for DEHS aerosol.
The other contributing factor for the difference in aerosol penetration which was not investigated could be associated with a shedding effect causing secondary release of aerosol already captured within fabrics. Any shedding effect would be more
10
DSTO-TR-2348
pronounced for DEHS as this challenge concentration (10–30 mg/m3) was considerably higher than for NaCl testing (1–10 mg/m3), thus resulting in higher loadings of tested fabrics.
The results indicate that measured penetration depends on the aerosol challenge characteristics, which needs to be taken into account when evaluating a fabric’s performance. Thus consideration needs to be given to the representative nature of the challenge material, and subsequent comparison of results when different challenge materials were used. The difference incorporates size distribution, shape, density and other physico-chemical characteristics. This finding is important to ensure that fabrics are tested against aerosols which are relevant to the threat.
Figure 3: Total Penetration of NaCl and DEHS aerosol in size range 0.3–3.0 m through swatch samples measured at air face velocities 5; 10 and 25 cm/s
3.2.1.1 Comparison of Total Penetration through Individual Fabrics Results presented in Figure 3 show that for NaCl aerosol total penetration (particles in the size range 0.03–3.00 m) was in general in the order: P(MKIV)<P(BCB)<P(PB). For DEHS results, the same order was observed at 5 cm/s; while for 10 and 25 cm/s air face velocities, the penetration values were in the order P(MKIV)<P(PB)<P(BCB). The differences in penetration are attributed to differences between fabric characteristics, mainly air permeability, fabric structure, thickness and number of layers. The results indicate that the MKIV provided the best dermal protection against airborne material with size characteristics similar to the NaCl and DEHS challenges.
11
DSTO-TR-2348
3.2.1.2 The Effect of Air Face Velocity on Total Penetration Analysis of measured results indicates that total aerosol penetration increases with increasing air face velocity. The effect was more pronounced for NaCl aerosol measurement as compared to DEHS data which was expected from aerosol theory as discussed previously. As the air face velocity increased, the results for penetration through all fabrics for NaCl challenges increased significantly (Student t-test, p=0.05). The MKIV fabric showed an overall increase of about 15% penetration between 5 cm/s and 25 cm/s, with similar increases for the other two fabrics. Results for DEHS challenges were less conclusive; there was an increase in penetration of around 5% for the results obtained for BCB suits at air face velocities of 5 and 10 cm/s, however no significant difference was observed for BCB suits at 10 and 25 cm/s (p=0.593). No significant difference was seen between the MKIV suits at 5 and 25 cm/s (p=0.063), nor for the PB suits at all air velocities (p>0.276). The difference compared to NaCl results could be attributed to the size characteristics of DEHS aerosol with a dominant peak at 0.3 m (close to the MPPS) which dominated the overall penetration. The findings highlight the importance and need to conduct measurements of total aerosol penetration through protective fabrics under the test conditions (air face velocity) corresponding to those expected in an operational scenario. 3.2.2 Total Quality Factor for Aerosol in the 0.03–3 m Size Range
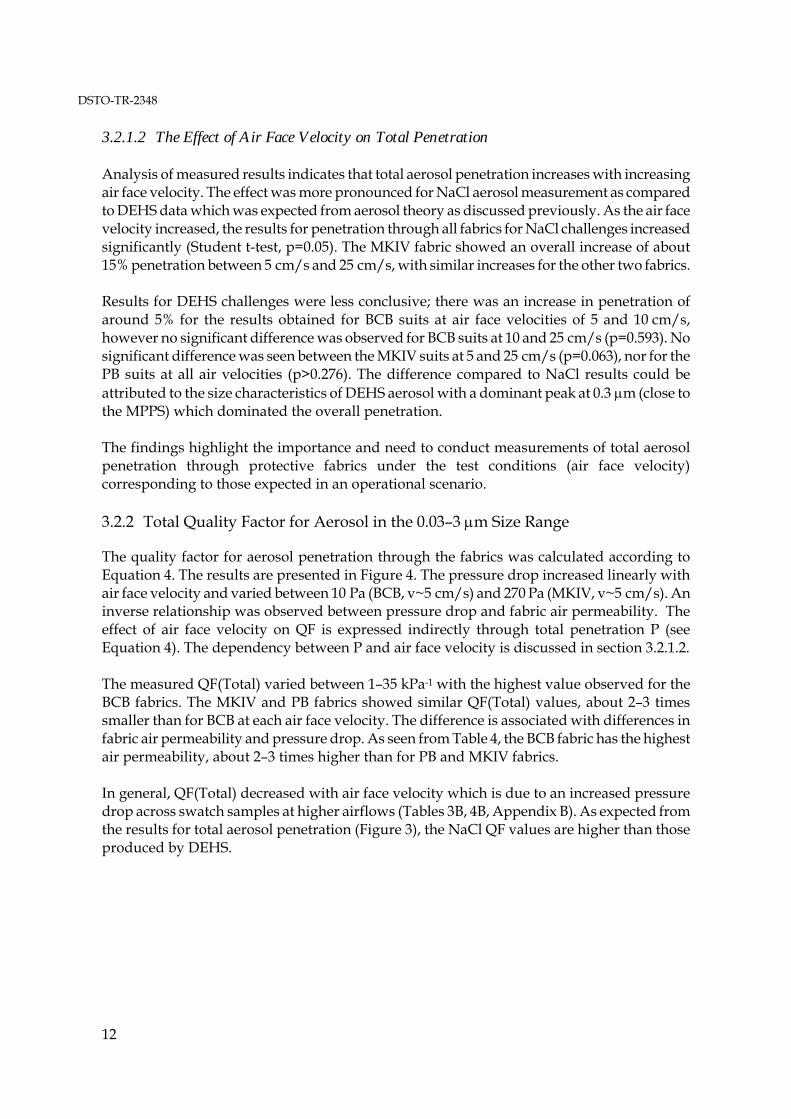
The quality factor for aerosol penetration through the fabrics was calculated according to Equation 4. The results are presented in Figure 4. The pressure drop increased linearly with air face velocity and varied between 10 Pa (BCB, v~5 cm/s) and 270 Pa (MKIV, v~5 cm/s). An inverse relationship was observed between pressure drop and fabric air permeability. The effect of air face velocity on QF is expressed indirectly through total penetration P (see Equation 4). The dependency between P and air face velocity is discussed in section 3.2.1.2. The measured QF(Total) varied between 1–35 kPa-1 with the highest value observed for the BCB fabrics. The MKIV and PB fabrics showed similar QF(Total) values, about 2–3 times smaller than for BCB at each air face velocity. The difference is associated with differences in fabric air permeability and pressure drop. As seen from Table 4, the BCB fabric has the highest air permeability, about 2–3 times higher than for PB and MKIV fabrics. In general, QF(Total) decreased with air face velocity which is due to an increased pressure drop across swatch samples at higher airflows (Tables 3B, 4B, Appendix B). As expected from the results for total aerosol penetration (Figure 3), the NaCl QF values are higher than those produced by DEHS.
Figure 4: Quality Factor for particles in the 0.03–3 m size range as a function of air face velocity and aerosol material
Analysis of the total penetration data provides information about the overall performance of fabrics against aerosol measured over a broad size range. In some cases this may be limiting, since penetration of specific agents with different size characteristics may differ, leading to potential under- or over-estimation of dermal exposure. Further characterisation of aerosol penetration as a function of aerosol size can reduce this impact, and is presented in the following section. 3.3 Penetration of Aerosol of Different Size Classes
The average penetration for particles in the three different particle size ranges: Ultrafine (UFP), Fine (FP) and coarse (CP) particles, were calculated as per Section 2.1.1 using data presented in Appendix B. 3.3.1 Penetration of NaCl Aerosol
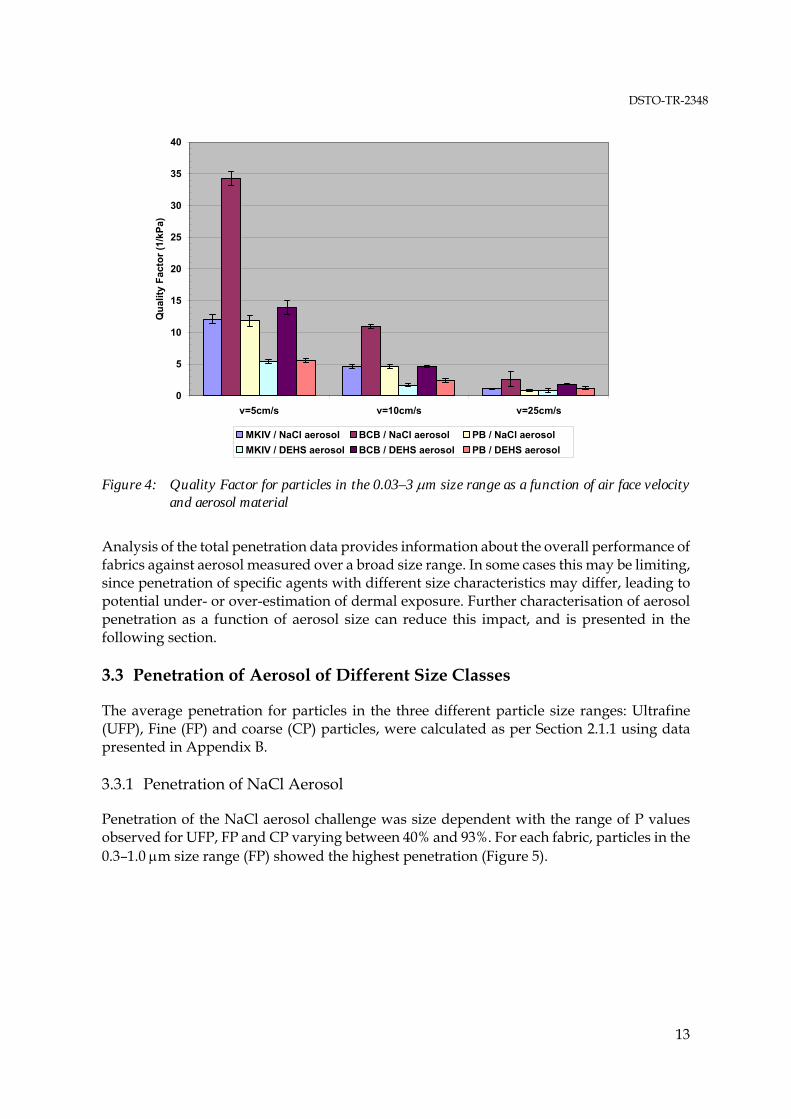
Penetration of the NaCl aerosol challenge was size dependent with the range of P values observed for UFP, FP and CP varying between 40% and 93%. For each fabric, particles in the 0.3–1.0 m size range (FP) showed the highest penetration (Figure 5).
Figure 5: Penetration of NaCl aerosol through (a) MKIV, (b) BCB, and (c) PB swatch samples
measured at different air face velocities
14
DSTO-TR-2348
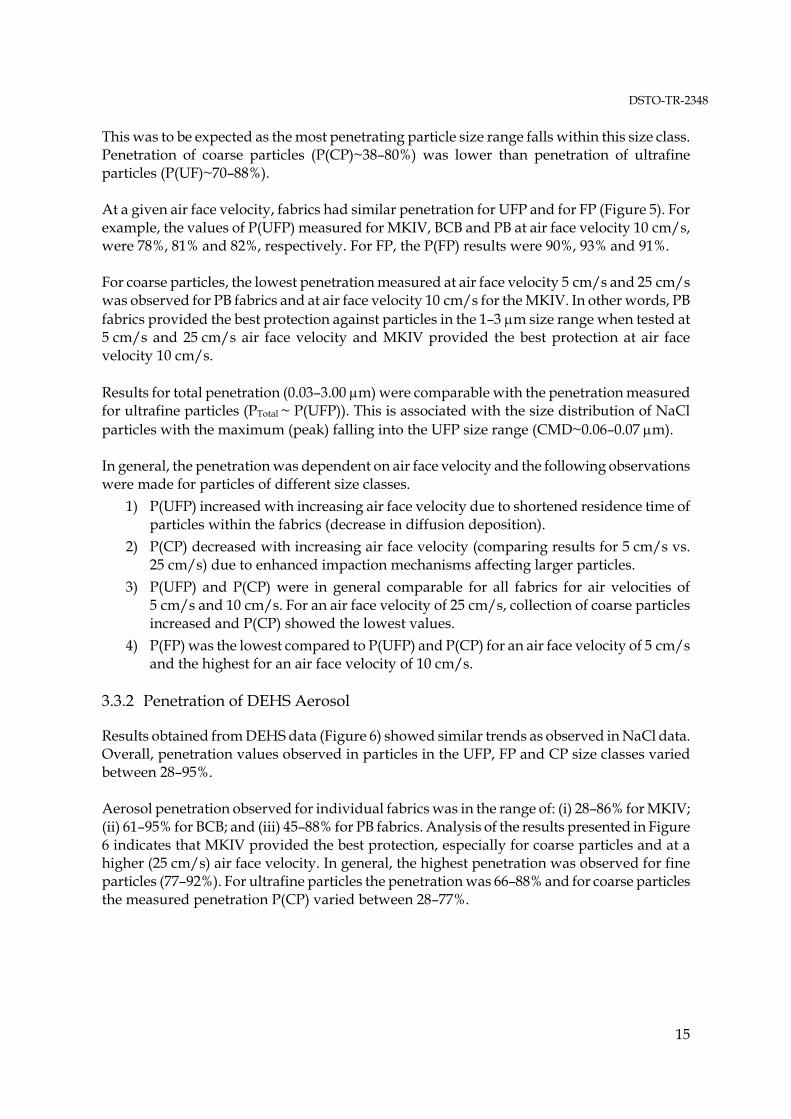
This was to be expected as the most penetrating particle size range falls within this size class. Penetration of coarse particles (P(CP)~38–80%) was lower than penetration of ultrafine particles (P(UF)~70–88%). At a given air face velocity, fabrics had similar penetration for UFP and for FP (Figure 5). For example, the values of P(UFP) measured for MKIV, BCB and PB at air face velocity 10 cm/s, were 78%, 81% and 82%, respectively. For FP, the P(FP) results were 90%, 93% and 91%. For coarse particles, the lowest penetration measured at air face velocity 5 cm/s and 25 cm/s was observed for PB fabrics and at air face velocity 10 cm/s for the MKIV. In other words, PB fabrics provided the best protection against particles in the 1–3 m size range when tested at 5 cm/s and 25 cm/s air face velocity and MKIV provided the best protection at air face velocity 10 cm/s. Results for total penetration (0.03–3.00 m) were comparable with the penetration measured for ultrafine particles (PTotal ~ P(UFP)). This is associated with the size distribution of NaCl particles with the maximum (peak) falling into the UFP size range (CMD~0.06–0.07 m). In general, the penetration was dependent on air face velocity and the following observations were made for particles of different size classes.
1) P(UFP) increased with increasing air face velocity due to shortened residence time of particles within the fabrics (decrease in diffusion deposition).
2) P(CP) decreased with increasing air face velocity (comparing results for 5 cm/s vs. 25 cm/s) due to enhanced impaction mechanisms affecting larger particles.
3) P(UFP) and P(CP) were in general comparable for all fabrics for air velocities of 5 cm/s and 10 cm/s. For an air face velocity of 25 cm/s, collection of coarse particles increased and P(CP) showed the lowest values.
4) P(FP) was the lowest compared to P(UFP) and P(CP) for an air face velocity of 5 cm/s and the highest for an air face velocity of 10 cm/s.
3.3.2 Penetration of DEHS Aerosol
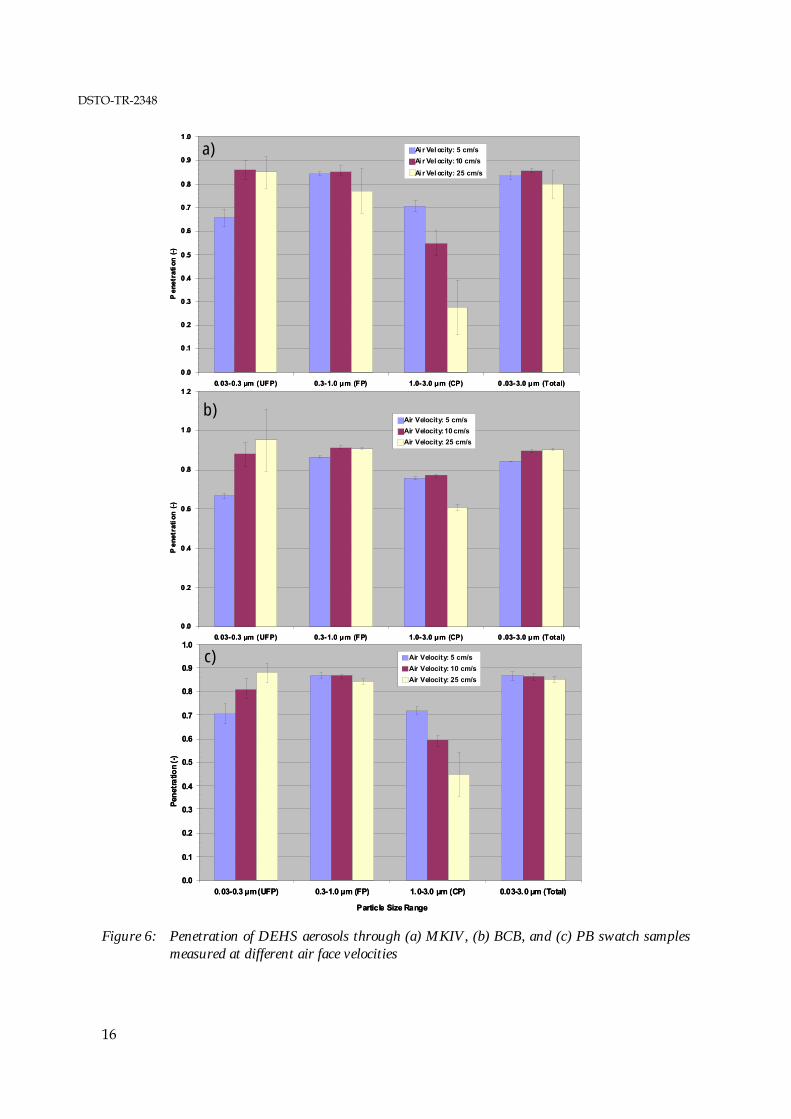
Results obtained from DEHS data (Figure 6) showed similar trends as observed in NaCl data. Overall, penetration values observed in particles in the UFP, FP and CP size classes varied between 28–95%. Aerosol penetration observed for individual fabrics was in the range of: (i) 28–86% for MKIV; (ii) 61–95% for BCB; and (iii) 45–88% for PB fabrics. Analysis of the results presented in Figure 6 indicates that MKIV provided the best protection, especially for coarse particles and at a higher (25 cm/s) air face velocity. In general, the highest penetration was observed for fine particles (77–92%). For ultrafine particles the penetration was 66–88% and for coarse particles the measured penetration P(CP) varied between 28–77%.
Figure 6: Penetration of DEHS aerosols through (a) MKIV, (b) BCB, and (c) PB swatch samples
measured at different air face velocities
16
DSTO-TR-2348
Penetration of DEHS aerosol was dependent on air face velocity, and the following trends were observed from measured data:
1) For ultrafine particles P(UFP) increased with air face velocity;
2) For fine particles the effect of air face velocity on P(FP) was insignificant;
3) For coarse particles P(CP) decreased with air face velocity. In summary, presenting the aerosol penetration through fabrics by particle class size, it shows clearly the different amounts of protection provided against different types of threats at different air face velocities. For example, estimating an Anthrax threat [6] with an air face velocity of 10 cm/s against the MkIV fabric, the penetration based on P(Total) values would be 76.6±1.1%, while penetration based on size class testing (P(CP)) is 66.6±2.0%. This means that by using P(Total) values the dermal exposure through fabrics is overestimated by about 10%. For a higher air face velocity (25 cm/s) the difference is even higher: 84±1.6% for P(Total) compared to 50.3±5.7% observed for P(CP), hence an overestimation of about 30%. In a similar way the results could be used for more accurate characterisation of threat by airborne particle of different size ranges, including the ultrafine size range for viruses and the fine size range for bacteria. 3.4 Quality Factors for Aerosol of Different Size Classes
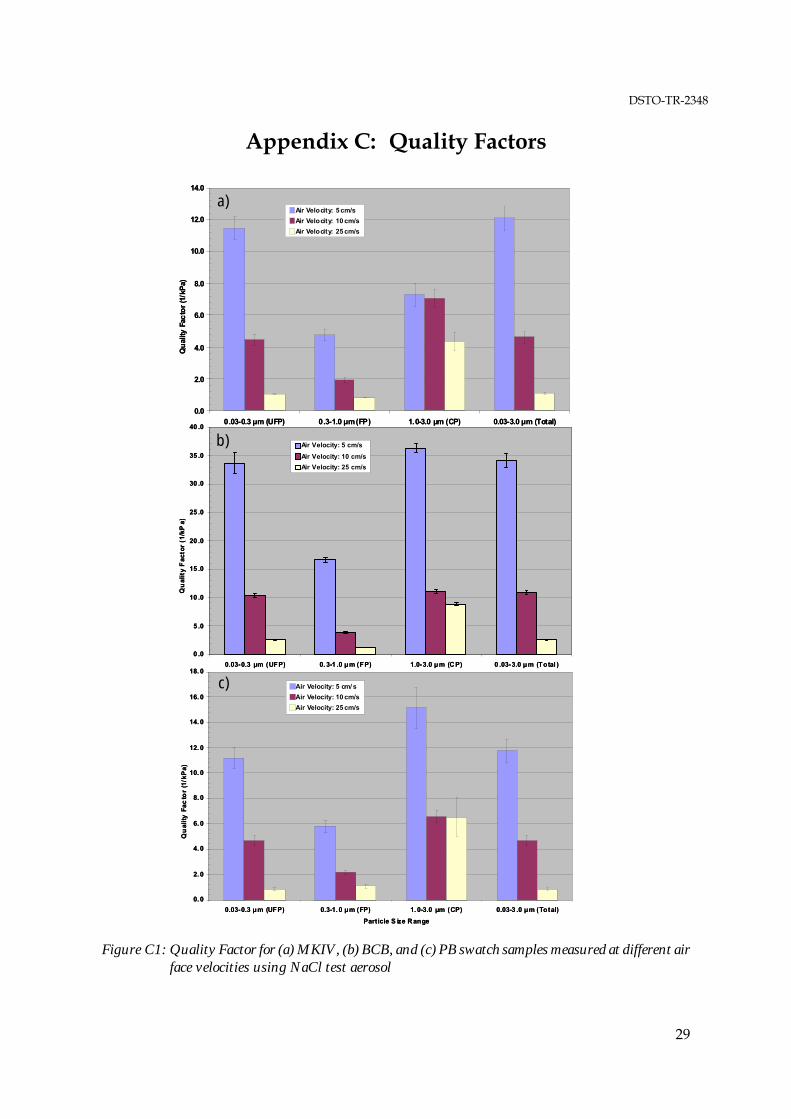
Quality factors were calculated according to Equation 3 using penetration of aerosol of different size classes (UFP; FP and CP) presented in the previous section as the P values. The QF results in tabulated and graphical forms are presented in Appendix B and Appendix C, respectively. 3.4.1 Quality Factor for NaCl Aerosol
Quality factors were size dependent with the measured values varying between 1 and 36 (1/kPa). The lowest QF for each fabric was observed for fine particles (QF(FP)) due to the high penetration of particles in the MPPS range. Quality factors observed for UFP and CP were higher than for FP and showed similar results within fabric type. QF(Total) for particles in the 0.03–3 m size range, followed similar trends as observed for QF(UFP). The effect reflects the dominance of UFP on the NaCl aerosol size distribution. For all fabrics the quality factor values were inversely dependent on air face velocity; QF decreased as the air face velocity increased. The effect is associated with the higher pressure drop observed at higher air face velocities. In quantitative terms, BCB fabrics showed the highest QF values for all size classes. QFs for MKIV and PB fabrics were similar, and lower than for BCB. This was due to higher air permeability and lower pressure drop observed for BCB fabrics. In general, the ranking of fabrics performance based on QF could be expressed as: QF(BCB)>QF(MKIV) ~ QF(PB).
17
DSTO-TR-2348
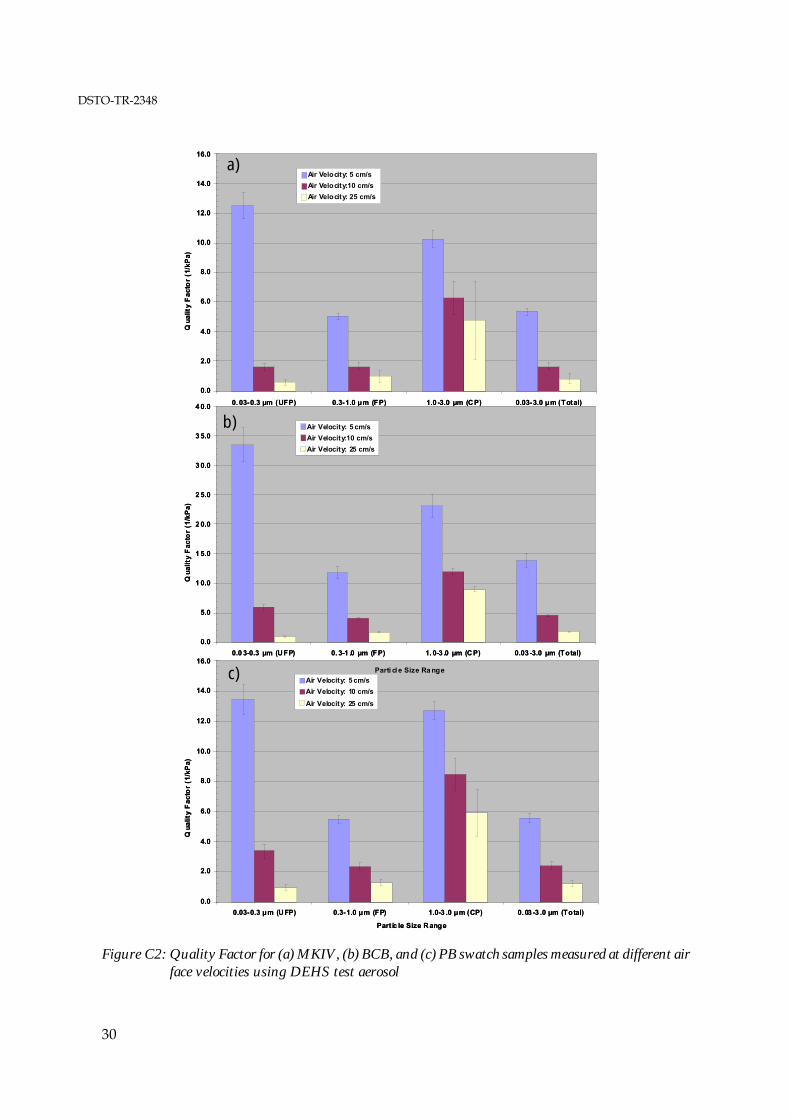
3.4.2 Quality Factor for DEHS Aerosol
The QF values varied between 1 and 33 (1/kPa) (see Figure C2 in Appendix C). Similar to the results observed for NaCl testing, the QFs measured by DEHS aerosol were size dependent. An inverse relationship was observed between QF and air face velocity (QF(5cm/s)>QF(10cm/s)>QF(25cm/s). For an air face velocity of 5 cm/s, QF was the highest for UF particles; while for 10 and 25 cm/s the highest values of QF were observed for coarse particles. In quantitative terms the BCB showed the highest QF values, up to three times the values measured for MKIV and PB fabrics. QF for particles in the 0.03–3 m size range (QF(Total)) showed similar values as observed for FPs, which dominated the DEHS aerosol size distribution. Comparison of the QFs results from NaCl and DEHS showed similar trends and dependencies. In terms of absolute values, QF(NaCl) are comparable with QF(DEHS) for all fabrics, except for BCB where QF(NaCl)>QF(DEHS) for 5 cm/s and all size classes (i.e., UFP, FP and CP) and for an air face velocity of 10 cm/s the QF(NaCl)>QF(DEHS) for UFP particles. While penetration of aerosol of different size classes provides more accurate information about fabric performance as compared to the total penetration results, in some instances even better size resolution is required; for example, development and validation of filtration models for IPE performance evaluation and new IPE materials development. The following section provides this information complementing the results presented in section 3.4. 3.5 Size Dependent Aerosol Penetration
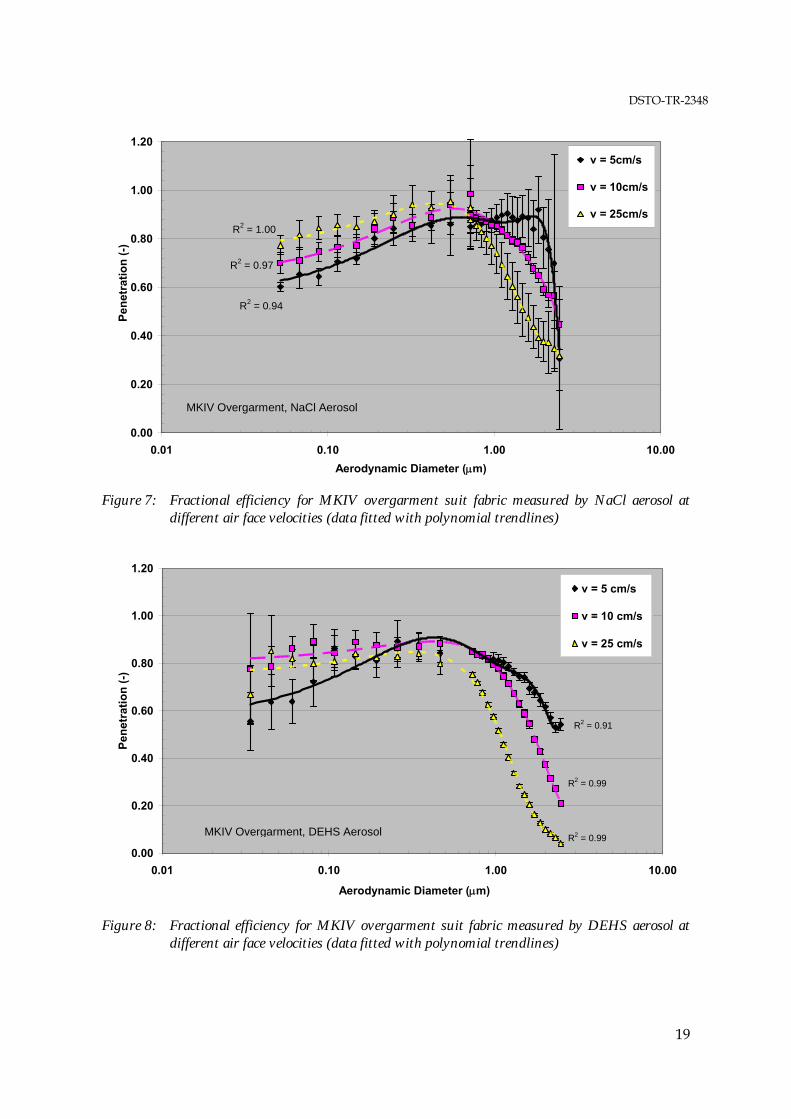
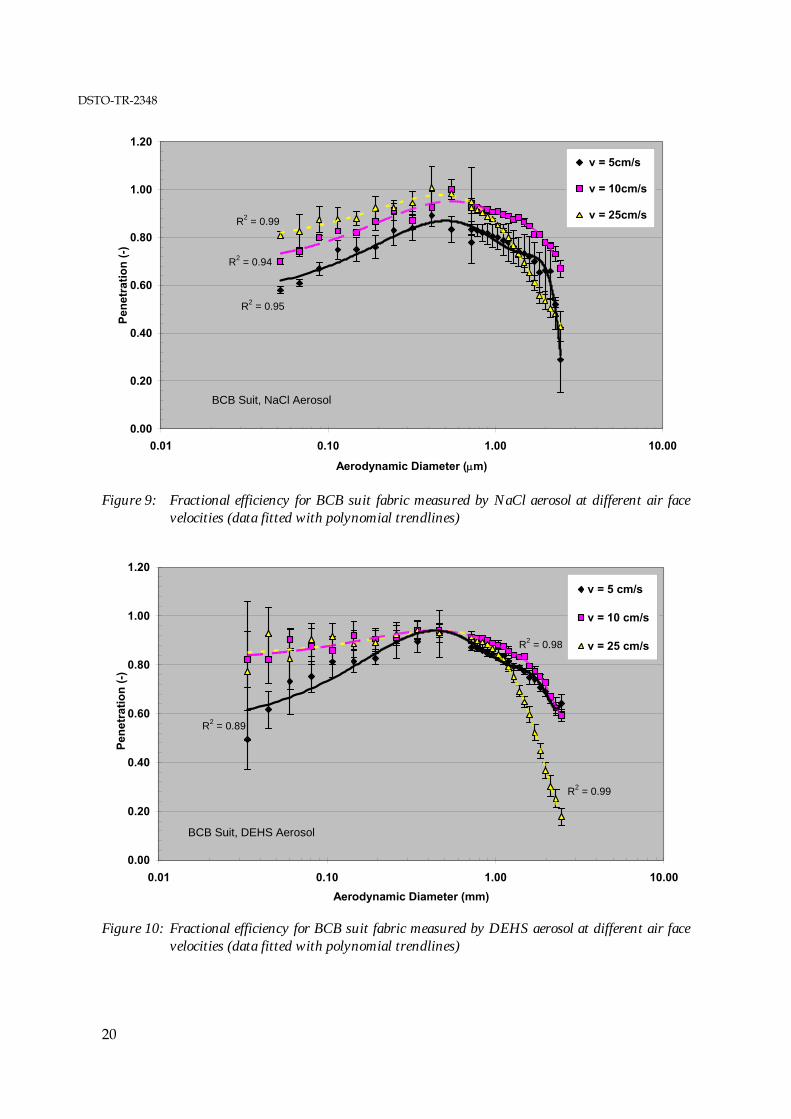
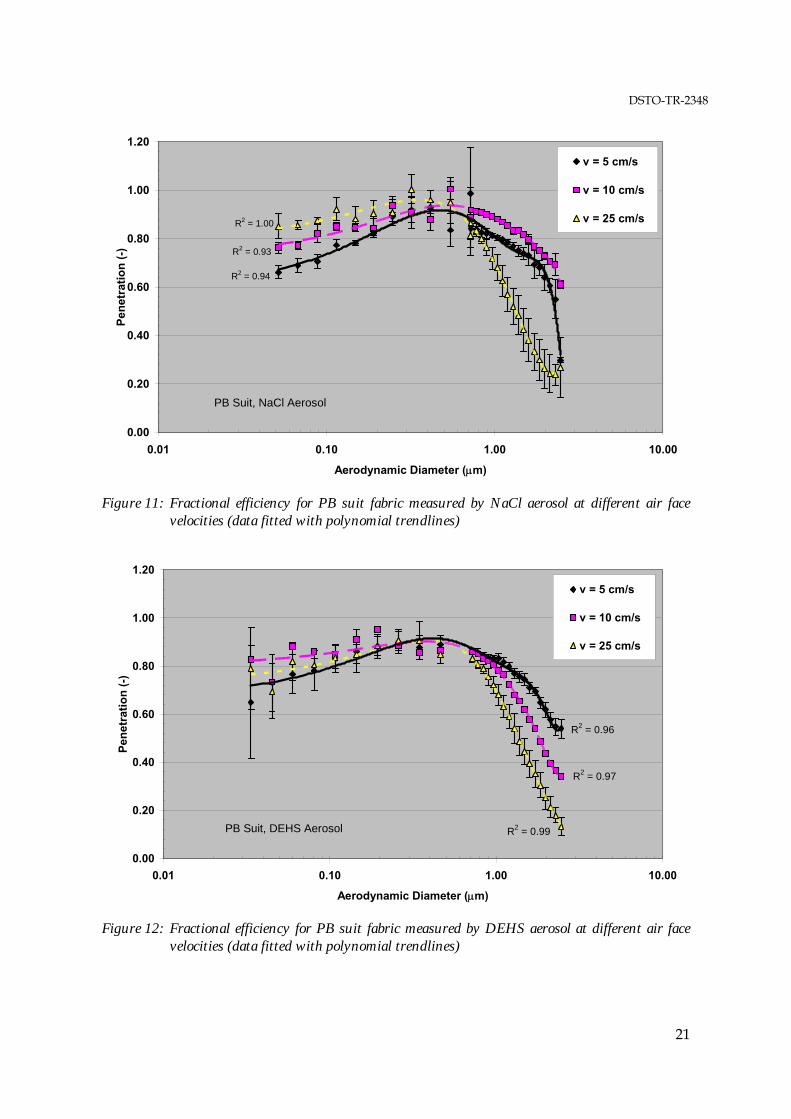
Size dependent (fractional) penetration of NaCl and DEHS particles through tested swatch samples is presented in Figures 7–12. The results are presented with size resolution of 8 size bins (channels) per decade in aerosol size (e.g., size range 0.1–1 m contains 8 size channels). Fractional penetration for different fabrics is presented as a function of air face velocity for each swatch test and challenge material. The penetration is plotted against particle aerodynamic diameter [1]. The data were obtained by merging SMPS and APS data. 3.5.1 Fractional Penetration Measured by NaCl Aerosol
The fractional penetration was size dependent. In general, penetration increased with particles size from 0.03 m to 0.5 m, where it reached maximum. The size corresponds to MPPS for which none of the aerosol capture mechanisms is highly effective. For particles larger than MPPS the penetration values continuously decreased with the lowest values observed at 3 m. This is associated with the increasing effect of impaction mechanisms affecting capture of larger particles. The results are in good agreement with filtration theory [1].
18
DSTO-TR-2348
R2 = 1.00
R2 = 0.97
R2 = 0.94
0.00
0.20
0.40
0.60
0.80
1.00
1.20
0.01 0.10 1.00 10.00
Aerodynamic Diameter (m)
Pen
etra
tio
n (
-)
v = 5cm/s
v = 10cm/s
v = 25cm/s
MKIV Overgarment, NaCl Aerosol
Figure 7: Fractional efficiency for MKIV overgarment suit fabric measured by NaCl aerosol at
different air face velocities (data fitted with polynomial trendlines)
R2 = 0.99
R2 = 0.99
R2 = 0.91
0.00
0.20
0.40
0.60
0.80
1.00
1.20
0.01 0.10 1.00 10.00
Aerodynamic Diameter (m)
Pen
etr
atio
n (
-)
v = 5 cm/s
v = 10 cm/s
v = 25 cm/s
MKIV Overgarment, DEHS Aerosol
Figure 8: Fractional efficiency for MKIV overgarment suit fabric measured by DEHS aerosol at
different air face velocities (data fitted with polynomial trendlines)
19
DSTO-TR-2348
BCB Suit, NaCl Aerosol
R2 = 0.99
R2 = 0.94
R2 = 0.95
0.00
0.20
0.40
0.60
0.80
1.00
1.20
0.01 0.10 1.00 10.00
Aerodynamic Diameter (m)
Pen
etra
tio
n (
-)
v = 5cm/s
v = 10cm/s
v = 25cm/s
Figure 9: Fractional efficiency for BCB suit fabric measured by NaCl aerosol at different air face
velocities (data fitted with polynomial trendlines)
BCB Suit, DEHS Aerosol
R2 = 0.99
R2 = 0.98
R2 = 0.89
0.00
0.20
0.40
0.60
0.80
1.00
1.20
0.01 0.10 1.00 10.00
Aerodynamic Diameter (mm)
Pen
etra
tio
n (
-)
v = 5 cm/s
v = 10 cm/s
v = 25 cm/s
Figure 10: Fractional efficiency for BCB suit fabric measured by DEHS aerosol at different air face
velocities (data fitted with polynomial trendlines)
20
DSTO-TR-2348
R2 = 0.93
R2 = 0.94
R2 = 1.00
0.00
0.20
0.40
0.60
0.80
1.00
1.20
0.01 0.10 1.00 10.00
Aerodynamic Diameter (m)
Pen
etra
tio
n (
-)
v = 5 cm/s
v = 10 cm/s
v = 25 cm/s
PB Suit, NaCl Aerosol
Figure 11: Fractional efficiency for PB suit fabric measured by NaCl aerosol at different air face
velocities (data fitted with polynomial trendlines)
R2 = 0.99
R2 = 0.97
R2 = 0.96
0.00
0.20
0.40
0.60
0.80
1.00
1.20
0.01 0.10 1.00 10.00
Aerodynamic Diameter (m)
Pen
etra
tio
n (
-)
v = 5 cm/s
v = 10 cm/s
v = 25 cm/s
PB Suit, DEHS Aerosol
Figure 12: Fractional efficiency for PB suit fabric measured by DEHS aerosol at different air face
velocities (data fitted with polynomial trendlines)
21
DSTO-TR-2348
Fractional penetration was affected by air face velocity. Penetration increased with air face velocity for UFP and an opposite trend (decrease in penetration) was observed for CP. The trends are associated with the diminished effect of the diffusion, affecting UFP, and enhanced effect of impaction, governing the collection of CP. The effect was observed for all fabrics and for testing using both, NaCl and DEHS aerosol challenges. Air face velocity also affected the MPPS, where an increased velocity shifted the MPPS towards a smaller particle size. This was due to the reduction in collection of UFP due to reduced diffusion collection, and an increase in larger particle (CP) collection due to impaction. The effect was observed for all tested fabrics. The relatively large uncertainty in presented data for some values was associated with time fluctuation in aerosol challenges and variation of swatch sample results. The presented results could be used for assessment of penetration of CBRN agents of specific size. The results could be extrapolated below 0.03 m and above 3 m, since the fractional penetration in those extrapolated size regions is monotonic. 3.5.2 Fractional Penetration Measured by DEHS Aerosol
The results obtained with DEHS aerosol showed similar trends and dependencies as observed for NaCl challenge. Fractional penetration for UFP and FP smaller than 0.8 m increased with increasing air face velocity. For CP and FP above 0.8 m diameter, penetration decreased with increasing velocity. In general, penetration values for CP measured by DEHS were lower compared to NaCl results. For example, penetration of 2 m particles through MKIV measured at an air face velocity of 25 cm/s by DEHS was about 10% (Figure 8), while based on the NaCl data, the penetration was about 35% (Figure 7). The cause of the effect was not investigated, but could be associated with the aerosol shape factor, phase (solid NaCl vs. liquid DEHS droplets) and challenge levels. The effect of air face velocity on aerosol penetration when using DEHS aerosol was more pronounced than for NaCl aerosol. For example, penetration of 2 m DEHS particles through MKIV at an air face velocity of 25 cm/s was 10% (Figure 8), compared to 60% observed at air face velocity 5 cm/s, while NaCl results for the same test conditions (Figure 7) were 35% (25 cm/s) and 80% (5 cm/s).
22
DSTO-TR-2348
4. Conclusions
The aerosol penetration of three different fabrics (MKIV, BCB and PB) against two types of aerosol simulants (NaCl and DEHS) was assessed using a particle counting technique. Fabric performance was characterised as a function of aerosol challenge size characteristics and air face velocity. The main findings can be summarised as follows:
Penetration of aerosol through protective fabrics is dependent on the particle size of the challenge material
Assessment of fabric filtration performance based on the overall penetration of particles across a broad size range could significantly over- or under-estimate protection provided by IPE fabrics against specific threats
Evaluation of fabric performance should be done for particles of different size classes and over a broad size range which cover the size characteristics of the anticipated CBRN airborne agents
Penetration of aerosol is dependent on air face velocity, and therefore fabric performance should be evaluated under the test conditions simulating real-world operational scenarios
The MPPS for tested fabrics is about 0.5 m and measurements at this particle size provide a worst case scenario for aerosol penetration
Quality factor is a useful parameter allowing comparison of performance for fabrics with different air permeability
Shedding of aerosol collected by fabrics may contribute to penetration, and the effect of aerosol loading and environmental conditions may need to be evaluated in future studies
DEHS aerosol may be a more suitable material for fabric penetration testing due to larger aerosol size and higher challenge concentration.
Observed dependencies between aerosol penetration, air face velocity and aerosol size characteristics were in good agreement with air filtration theory.
23
DSTO-TR-2348
24
5. References
1. Hinds, W.C., Aerosol Technology: properties, behaviour, and measurements of airborne particles. 2nd ed. 1999, New York: John Willey & Sons.
2. Davies, C.N., Aerosol Science. 1966, London: Academic Press Inc.
3. Spurny, R.K., Advances in Aerosol Technology. 1998, Boston: Lewis Publishers.
4. Brown, R.C., Air filtration. 1993, New York: Pergamon Press.
5. Burge, H.A., Bioaerosols. Indoor air research, ed. M. Eisenberg. 1995, Washington, DC: Lewis Publishers.
6. Carrera, M., et al., Difference between the spore sizes of Bacillus anthracis and other Bacillus species. Journal of Applied Microbiology, 2007. 102(2): p. 303–312.
7. ASHRAE, ANSI/ASHRAE Standard 52.2–1999. Method of testing general ventilation air-cleaning devices for removal efficiency by particle size, in ASHRAE. 1999: Atlanta GA.
8. W. Kirchstetter, T., et al., On-road measurement of fine particle and nitrogen oxide emissions from light- and heavy-duty motor vehicles. Atmospheric Environment, 1999. 33(18): p. 2955–2968.
9. Willeke, K. and P.A. Baron, Aerosol measurements: Principles, techniques and applications. 1993, New York: John Willey & Sons.
10. Gustavsson, J., EN 779:2002 – New European test method for air filters. Filtration & Separation, 2003. 3: p.22–26
11. Hanley, J., Test conditions for measurements of aerosol penetration through swatch sample and protective ensembles, personal communication 2008. Melbourne.
12. McCallum, R., et al., Test and evaluation of four second generation prototype fabrics for use in a chemical biological flame retardant suit (CBFRS), DSTO-TN 0900. 2008.
13. Moore, R., et al., Test and evaluation of commercially available chemical, biological and radiological coveralls for the Police Tactical Group (U) AR-014-019, DSTO TR-20049. 2007.
14. Roberts, M., et al., Study on aerosol penetration through clothing and IPE, DSTO TR -2283. 2009.
DSTO-TR-2348
Appendix A: Aerosol Test Rig
Figure A1: Technical drawing of the aerosol test rig (ASTER)
25
DSTO-TR-2348
26
This page intentionally blank
DSTO-TR-2348
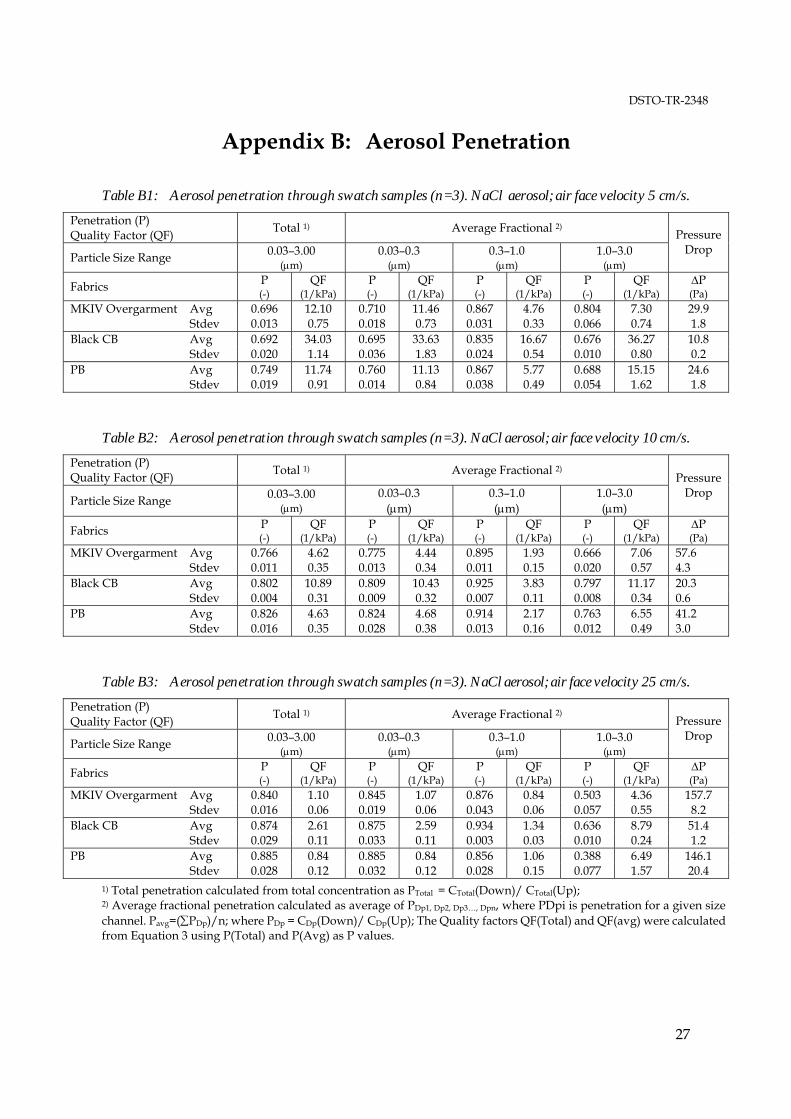
Appendix B: Aerosol Penetration
Table B1: Aerosol penetration through swatch samples (n=3). NaCl aerosol; air face velocity 5 cm/s.
1) Total penetration calculated from total concentration as PTotal = CTotal(Down)/ CTotal(Up); 2) Average fractional penetration calculated as average of PDp1, Dp2, Dp3…, Dpn, where PDpi is penetration for a given size channel. Pavg=(PDp)/n; where PDp = CDp(Down)/ CDp(Up); The Quality factors QF(Total) and QF(avg) were calculated from Equation 3 using P(Total) and P(Avg) as P values.
27
DSTO-TR-2348
Table B4: Aerosol penetration through swatch samples (n=3). DEHS aerosol; air face velocity 5 cm/s.
1) Total penetration calculated from total concentration as PTotal = CTotal(Down)/ CTotal(Up); 2) Average fractional penetration calculated as average of PDp1, Dp2, Dp3…, Dpn, where PDpi is penetration for a given size channel. Pavg=(PDp)/n; where PDp = CDp(Down)/ CDp(Up); The Quality factors QF(Total) and QF(avg) were calculated from Equation 3 using P(Total) and P(Avg) as P values.
Figure C2: Quality Factor for (a) MKIV, (b) BCB, and (c) PB swatch samples measured at different air
face velocities using DEHS test aerosol
Page classification: UNCLASSIFIED
DEFENCE SCIENCE AND TECHNOLOGY ORGANISATION
DOCUMENT CONTROL DATA 1. PRIVACY MARKING/CAVEAT (OF DOCUMENT)
2. TITLE Aerosol Penetration Through Protective Fabrics
3. SECURITY CLASSIFICATION (FOR UNCLASSIFIED REPORTS THAT ARE LIMITED RELEASE USE (L) NEXT TO DOCUMENT CLASSIFICATION) Document (U) Title (U) Abstract (U)
4. AUTHOR(S) Milan Jamriska
5. CORPORATE AUTHOR DSTO Defence Science and Technology Organisation 506 Lorimer St Fishermans Bend Victoria 3207 Australia
6a. DSTO NUMBER DSTO-TR-2348
6b. AR NUMBER AR-014-634
6c. TYPE OF REPORT Technical Report
7. DOCUMENT DATE September 2009
8. FILE NUMBER 2009/1067983
9. TASK NUMBER ARM 07/270
10. TASK SPONSOR CBRN Directorate
11. NO. OF PAGES 30
12. NO. OF REFERENCES 14
13. URL OF ELECTRONIC VERSION http://dsto.defence.gov.au/corporate/reports/DSTO-TR-2348.pdf
14. RELEASE AUTHORITY Chief, Human Protection and Performance Division
15. SECONDARY RELEASE STATEMENT OF THIS DOCUMENT
Approved for public release OVERSEAS ENQUIRIES OUTSIDE STATED LIMITATIONS SHOULD BE REFERRED THROUGH DOCUMENT EXCHANGE, PO BOX 1500, EDINBURGH, SA 5111 16. DELIBERATE ANNOUNCEMENT No Limitations 17. CITATION IN OTHER DOCUMENTS Yes 18. DSTO RESEARCH LIBRARY THESAURUS http://web-vic.dsto.defence.gov.au/workareas/library/resources/dsto_thesaurus.shtml Aerosol, penetration, fabrics, IPE, filtration 19. ABSTRACT The aerosol penetration efficiency and quality factor for three Chemical Biological Radiological protective fabrics were evaluated using a particle counting technique. Both parameters characterise aerosol penetration through tested material; the latter accounts for the effect of fabrics air permeability. The overall and size dependent penetrations of 0.03-3 µm sized Sodium Chloride (NaCl) and Di-Ethyl-Hexyl-Sebacate (DEHS) aerosols were measured through fabrics at three different constant air face velocities (5, 10 and 25 cm/s). Penetration was size dependent with the most penetrating particle size (MPPS) at about 0.5 µm. Increasing the air face velocity increased the penetration of ultrafine particles (smaller than 0.3 µm), decreased penetration of the supermicrometer particles (larger than 1 µm) and shifted the MPPS towards smaller diameters. The quality factors were governed by air permeability. The fabrics with higher permeability showed higher quality factor values, thus indicating better protection for a given air pressure drop. The observed dependencies were generally in good agreement with air filtration theory.