100 CHAPTER 4 DATA ANALYSIS AND INTERPRETATION PERCENTAGE ANALYSIS Table 4.1 Table showing age –wise classification of the respondents S. No. Age-Group No. of Respondents Percentage of Respondents 1 18-25 303 60.6 2 26-35 136 27.2 3 36-45 41 8.2 4 46-55 10 2 5 Above 55 10 2 Total 500 100.0 Source: Primary Data Figure 4.1 Figure showing age –wise classification of the respondents Reference: Table 4.1 Interpretation The above Table 4.1 and Figure 4.1 shows that the age-wise classification of the respondents and Figure 4.1 depicts 60.6 % of respondents belong to 18-25 years of age category, 27.2 % belong to 26-35 and the remaining 13% comprises of the other age groups. It is found from the analysis that nearly 87% of population falls between 18 and 35. 60.6 27.2 8.2 22 Age Group of the Respondents 18-25 26-35 36-45 46-55 Above 55
Transcript
100
CHAPTER 4
DATA ANALYSIS AND INTERPRETATION
PERCENTAGE ANALYSIS
Table 4.1 Table showing age –wise classification of the respondentsS. No. Age-Group No. of Respondents Percentage of Respondents
Figure 4.3 Figure showing organizational hierarchy of the respondents Reference: Table 4.3.
Interpretation
The above Table 4.3 and Figurer 4.3 shows that 52.2 percentages of respondents are from staff cadre and 43.6 percentages comprises of managerial cadre and 4.2 percentages of respondents belong to top management. It can be inferred from the above table that more work force has been involved for data collection so that better suggestions can be provided to the top management to eliminate its drawbacks and to introduce new ideas.
4.2
43.652.2
0102030405060
Top Level Middle Level Shop Floor Level
Percentage
Organizational Hierarchy
Organizational Hierarchy
103
Table 4.4 Table showing educational qualification of the Respondents
S. No. Educational Qualification
No. of Respondents
Percentage
1 Up to High School 54 10.82 Bachelors Degree 194 38.83 Masters Degree 71 14.24 Diploma Holders 181 36.2
Total 500 100.0Source: Primary Data
Figure 4.4 Figure Depicting educational qualification of the Respondents Reference: Table 4.4
Interpretation
From the above Table 4.4 and Figure 4.4 it has been inferred that majority of respondents are Diploma holders and Bachelor degree holders and 14.2 percentages hold masters degree and only a marginal portion constitute to school level. From the analysis it is inferred that the companies employ more of diploma holders and bachelor degree holders so that they can have better employee retention and master degree holders are employed for managerial positions. The companies provide training to these employees and make them settle in their company for a longer period.
10.8 38.8 14.2 36.20
204060
Up to High School
Bachelors Degree
Masters Degree
Diploma Holders
Percentages
Educational Qualification
Educational Qualification
Educational Qualification
104
Table 4.5 Table showing gender –wise classification of the respondents
S. No. Gender No. of Respondents Percentage
1 Male 431 86.22 Female 69 13.8
Total 500 100.0Source: Primary Data
Figure 4.5 Figure depicting gender-wise classification of the respondents Reference: Table 4.5
Interpretation
From the above Table 4.5 and from Figure 4.5 it is inferred that majority of respondents are male and only 13.8 percentages are female. The company has employed more male members since it is a manufacturing industry and the work may involve heavy machine operations. It can be inferred that female employees may quit the job for varied reasons and so the companies have advocated employing male members to have better employment retention.
84.2
13.8
Male Female
0
20
40
60
80
100
Gender
Percentage
Gender wise Classification
Gender
105
Table 4.6 Table showing superior subordinate relationship based on
gender
FactorsMale Female TotalMean Mean Mean
Approachability of superior by the subordinates 5.90 4.80 5.74Recognition of employee for achievement by superiors 8.24 7.88 8.19Teamwork and coordination 7.34 6.41 7.21Respecting coworkers, subordinates by superiors 7.79 9.02 7.96Clarity in explaining the task to be accomplished by the superior 7.85 7.70 7.83Superiors follow an autocratic approach towards subordinates 8.51 8.15 8.46Superiors act like a coach 6.81 8.41 7.04Superior is a good counselor 7.73 7.15 7.65Superior helps in completing the work assigned to subordinates 8.23 9.05 8.35Superior is impartial with subordinates and co-workers 7.80 7.44 7.75Superior is a good task master 8.42 8.59 8.44Superior makes working environment pleasant 8.41 7.48 8.28Superior considers suggestions and opinions of workers 8.85 9.41 8.93Superior maintains friendly relationship 9.26 9.00 9.22Superior cares for workers personal welfare 8.62 9.12 8.69
Source: Primary Data
Interpretation
In the above Table 4.6 it has been inferred that most of the
employees ranked Approachability of superior as the highest so that they are
able to execute the task easily. Team work and coordination and superior acts
like a coach are mostly influenced factors for superior subordinate
relationship. Superior maintains friendly relationship is given least rank by
considering their suggestions, caring for personal welfare. So that we can infer
from the analysis that employee’s feel that their superiors are good at getting
work done but do not have any personal touch. So the organization should
consider this point and should try to provide a cordial relationship so that it
106
will increase the morale of employees which will increase employee retention.
The pictorial representation of the above interpretation is depicted in
Figure 4.6.
Figure 4.6 Figure showing superior subordinate relationship based on genderReference: Table 4.6
0 2 4 6 8 10
Approachability of superior by the …
Recognition of employee for …
Teamwork and coordination
Respecting coworkers, subordinates by …
Clarity in explaining the task to be …
Superiors follow an autocratic approach …
Superiors act like a coach
Superior is a good counselor
Superior helps in completing the work …
Superior is impartial with subordinates …
Superior is a good task master
Superior makes working environment …
Superior considers suggestions and …
Superior maintains friendly relationship …
Superior cares for workers personal …
Mean
A
tt
r
i
b
u
t
e
s
Figure showing superior subordinate relationship based on gender
Female Mean Male Mean
107
Table 4.7 Table showing Superior Subordinate Relationship based on
age-wise classification
Factors18-25 26-35 36-45 46-55 Above 55 TotalMean Mean Mean Mean Mean Mean
Approachability of superior by the subordinates 5.94 5.12 6.00 8.20 3.80 5.74Recognition of employee for achievement by superiors 8.04 8.38 8.35 9.70 8.20 8.19
Teamwork and coordination 7.76 5.87 7.68 5.00 7.70 7.21Respecting coworkers, subordinates by superiors 8.38 7.16 7.00 9.70 7.50 7.96Clarity in explaining the task to be accomplished by the superior 7.82 7.88 8.03 7.80 6.70 7.83
Superiors follow an autocratic approach towards subordinates 8.58 8.37 7.78 7.20 9.90 8.46
Superiors acts like a coach 7.24 6.39 7.27 6.90 8.30 7.04Superior is a good counselor 7.63 8.02 6.81 8.30 6.50 7.65Superior helps in completing the work assigned to subordinates 8.13 8.83 8.89 6.40 9.10 8.35
Superior is impartial with subordinates and co-workers 7.55 8.44 6.72 9.10 7.50 7.75
Superior is a good task master 8.31 8.49 9.17 8.70 8.70 8.44Superior makes working environment pleasant 8.17 8.34 8.54 9.20 8.50 8.28Superior considers suggestions and opinions of workers 8.61 9.50 9.35 8.90 9.89 8.93
Superior maintains friendly relationship with workers 9.11 9.62 8.89 8.30 10.00 9.22
Superior cares for workers personal welfare 8.43 9.22 9.51 7.70 7.80 8.69Superior considers suggestions and opinions of workers 8.61 9.50 9.35 8.90 9.89 8.93
Superior maintains friendly relationship with workers 9.11 9.62 8.89 8.30 10.00 9.22
Superior cares for workers personal welfare 8.43 9.22 9.51 7.70 7.80 8.69Superior considers suggestions and opinions of workers
8.61 9.50 9.35 8.90 9.89 8.93
Superior maintains friendly relationship with workers
9.11 9.62 8.89 8.30 10.00 9.22
Superior cares for workers personal welfare 8.43 9.22 9.51 7.70 7.80 8.69
Source: Primary Data
108
Interpretation
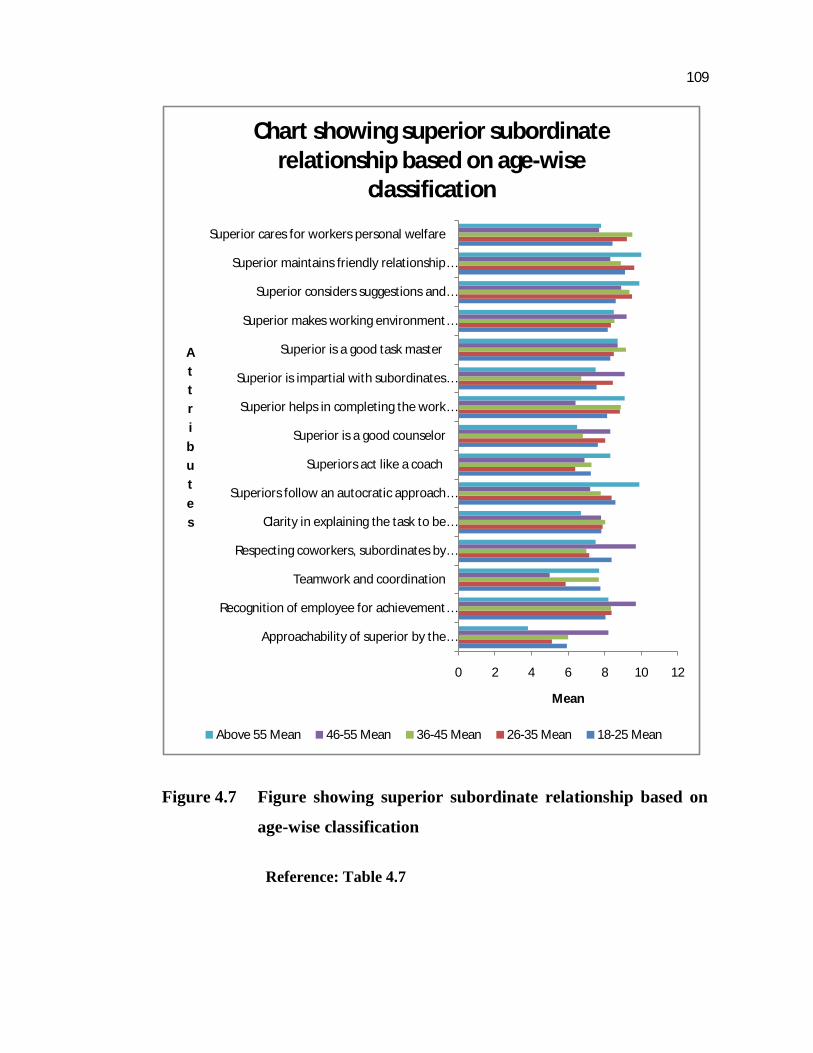
From the above Table 4.7 it is inferred that most of the employees
ranked Approachability of superior as the highest so that they are able to
execute the task easily. Team work and coordination and superior acting like a
coach are mostly influenced factors for superior subordinate relationship.
Superior maintains friendly relationship has been least ranked followed by
considering of suggestions, caring for personal welfare. It is inferred from the
analysis that irrespective of age group employee’s feel that the superiors are
treating employees with fair and equitable to get the work done and there is no
bias within the work force, and this attitude of the superior makes subordinate
feel secured while executing a job which paves the way for retaining
employees as there is no partiality in treatment. This in turn will increase
employee retention. The pictorial representation of the above interpretation is
depicted in Figure4.7. in next page
109
Figure 4.7 Figure showing superior subordinate relationship based on
age-wise classification
Reference: Table 4.7
0 2 4 6 8 10 12
Approachability of superior by the …
Recognition of employee for achievement …
Teamwork and coordination
Respecting coworkers, subordinates by …
Clarity in explaining the task to be …
Superiors follow an autocratic approach …
Superiors act like a coach
Superior is a good counselor
Superior helps in completing the work …
Superior is impartial with subordinates …
Superior is a good task master
Superior makes working environment …
Superior considers suggestions and …
Superior maintains friendly relationship …
Superior cares for workers personal welfare
Mean
A
tt
r
i
b
u
t
e
s
Chart showing superior subordinate relationship based on age-wise
classification
Above 55 Mean 46-55 Mean 36-45 Mean 26-35 Mean 18-25 Mean
110
Table 4.8 Table showing superior subordinate relationship based on
Organizational Hierarchy
FactorsTop level
Middle level
Shop floor level
Total
Mean Mean Mean Mean
Approachability of superior by the subordinates 6.05 5.47 5.93 5.74
Recognition of employee for achievement by superiors
8.81 7.98 8.30 8.19
Teamwork and coordination 8.43 6.10 8.00 7.21
Respecting coworkers, subordinates by superiors
6.71 7.34 8.58 7.96
Clarity in explaining the task to be accomplished by the superior
8.76 7.80 7.77 7.83
Superiors follow an autocratic approach towards subordinates
7.86 8.42 8.55 8.46
Superiors act like a coach 7.24 6.74 7.26 7.04
Superior is a good counselor 5.95 8.21 7.35 7.65
Superior helps in completing the work assigned to subordinates
8.57 8.68 8.07 8.35
Superior is impartial with subordinates and co-workers
7.48 8.35 7.28 7.75
Superior is a good task master 8.38 8.49 8.41 8.44
Superior makes working environment pleasant 7.90 8.35 8.24 8.28
Superior considers suggestions and opinions of workers
9.57 9.15 8.70 8.93
Superior maintains friendly relationship with workers
9.29 9.30 9.15 9.22
Superior cares for workers personal welfare 9.19 9.45 8.04 8.69
Source: Primary Data
111
Interpretation
It has been inferred from Table 4.8 that most of employees
irrespective of their position have ranked approachability of superior and team
work as highest. Least ranking were given to friendly relationship and
respecting of co-workers and subordinates. So from the analysis it can be
inferred that irrespective of organizational hierarchy friendly relationship is
lacking among work force. This indicates that the organization culture is job-
oriented and very least importance is given to employees’ opinions and
suggestions. This aspect should be changed to increase employee retention
among employees in long run.
Table 4.9 Table showing superior subordinate relationship based on
educational qualification
FactorsUp to high school level
Bachelor Degree
Master degree
Diploma level
Total
Mean Mean Mean Mean Mean
Approachability of superior by the subordinates
6.15 5.77 4.70 5.97 5.74
Recognition of employee for achievement by superiors
8.60 7.83 8.41 8.35 8.19
Teamwork and coordination 9.15 6.54 5.68 7.84 7.21
Respecting coworkers, subordinates by superiors
7.96 7.48 7.63 8.58 7.96
Clarity in explaining the task to be accomplished by the superior
8.50 7.53 8.29 7.75 7.83
Superiors follow an autocratic approach towards subordinates
7.81 8.69 8.41 8.46 8.46
Superiors act like a coach 7.35 6.99 6.63 7.14 7.04
Superior is a good counselor 7.74 7.72 8.10 7.39 7.65
112
Table No.4.9 (Continued)
Factors
Up to high school level
Bachelor Degree
Master degree
Diploma level
Total
Mean Mean Mean Mean Mean
Superior helps in completing the work assigned to subordinates
8.83 8.32 8.60 8.14 8.35
Superior is impartial with subordinates and co-workers
6.63 8.25 8.17 7.43 7.75
Superior is a good task master 8.44 8.35 8.39 8.55 8.44
Superior makes working environment pleasant
7.69 8.44 8.32 8.28 8.28
Superior considers suggestions and opinions of workers
8.17 9.00 9.75 8.80 8.93
Source: Primary Data
Interpretation
It has been inferred from Table 4.9 that workers belonging to high
school level have ranked approachability of superior as highest and then rated
that superior is impartial. Bachelor degree holders have ranked approachability
of superiors as the highest, team work co-ordination as second influencing
factor and respecting of co-workers as third. Master degree holders have rated
approachability of superiors as the highest, team work co-ordination as second
influencing factor and respecting of co-workers has been thirdly ranked.
Diploma holders have ranked approachability as the first and ranked superior
acts like a coach and as a good counselor in second and third ranks
respectively. So it can be concluded that there exists a very good superior
subordinate relationship according to the qualification, a slight variation has
taken place for diploma holders where the superior acts as a coach and a
counsellor so that they are able to develop their skills and improve the
productivity.
113
Table 4.10 Factors influencing employees to remain in the present
organization based on gender- wise classification
Attributes Male Female Total
Mean Mean Mean
Salary structure 1.91 1.95 1.92
Retirement benefits 6.79 7.27 6.86
Better Career Development 3.78 3.71 3.77
Working conditions 6.05 6.00 6.04
Supervision/Management 6.33 6.59 6.37
Fringe benefits 6.68 7.11 6.74
Recognition and rewards 6.55 6.62 6.56
Job security 3.61 3.59 3.60
Loyalty towards the company
6.92 6.35 6.84
Company Image in the society
6.41 6.27 6.39
Source: Primary Data
Interpretation
From the above Table 4.10 it has been inferred that most of the
employees ranked salary as the main reason to stay in the company. Job
Security is the second highest ranked factor for retention of employees in their
present organization. Retirement benefit is the least preferred factor by the
employees. This indicates that employees are more focused towards their
current monetary benefits and career development as the key factors. The
organization has chosen the best retention tactics to retain its employees. The
pictorial representation of the above interpretation is depicted in Figure4.10.
114
Figure 4.10 Figure depicting the factors influencing employees to remain
in the present organization
Reference Table 4.10
0 1 2 3 4 5 6 7 8
Salary
Retirement benefit
Career Development
Working conditions
Supervision/Management
Fringe benefits
Recognition and reward
Job security
Loyalty towards the company
Company Image in the society
Mean
AT
T
R
U
B
U
T
E
S
Attributes Influencing Employee to remain the organization with reference to gender
Female Male
115
Table No 4.11 Factors influencing employees to remain in organization
Recognition and rewards 6.60 6.40 6.61 7.30 6.30 6.56
Job security 3.52 3.63 3.94 3.40 4.60 3.60
Loyalty towards the company
6.99 6.67 6.50 6.00 6.60 6.84
Company Image in the society
6.41 6.25 7.06 5.60 6.00 6.39
Source: Primary Data
Interpretation
From the above Table 4.11 it has been inferred that from 18-45 of
age group salary has been ranked as first criteria which makes them to remain
the organization and from 46- 55 job security plays an important role as
employees have their own family commitments. Career development and job
security has been ranked in second position irrespective of the age group.
Retirement benefit has been given least importance between 18-45 of age
group and it has impact in the age group of 46-55. This clearly shows that the
116
company has maintained good attributes to make its employees remain in the
present organization. From this we can infer that the employee retention rate is
high. The pictorial representation of the above interpretation is depicted in
Figure4.11.
Figure No: 4.11 Figure exhibiting the factors influencing employees to
remain in organization based on age- wise classification
Reference: Table 4.11
0 2 4 6 8
Salary
Retirement benefit
Career Development
Working conditions
Supervision/Management
Fringe benefits
Recognition and reward
Job security
Loyalty towards the company
Company Image in the society
Mean
Attributes
Factors Relating employees to remain the organization based on age wise
classification
Total
above 55
46-55
36-45
26-35
18-25
117
Table No 4.12 Factors influencing employees to remain in organization
based on hierarchy
AttributesTop
LevelMiddle Level
Shop Floor Level
Total
Mean Mean Mean MeanSalary structure 2.15 2.30 1.59 1.92Retirement benefits 6.55 6.76 6.96 6.86Better Career Development 4.05 3.69 3.80 3.77Working conditions 6.00 5.69 6.34 6.04Supervision/Management 6.70 6.27 6.42 6.37Fringe benefits 6.95 7.01 6.50 6.74Recognition and rewards 7.40 6.24 6.75 6.56Job security 3.25 3.81 3.47 3.60Loyalty towards the
company 6.15 6.82 6.92 6.84
Company Image in the
society 5.70 6.47 6.39 6.39
Source: Primary Data
Interpretation
Top Level: Salary, Company image in the society and job security
has been ranked first rewards and recognition and retirement benefits has been
least ranked by the top level. Middle Level: Salary and job security ranked in
first position and company image and retirement benefit has been least ranked.
Shop Floor Level: Salary, career development and job security are ranked as
highest and least rated is rewards and recognition, supervision and
management and company image. It has been inferred that the organization
retention policy suits according to hierarchy where company image ranks
higher at top level and salary for middle level career development and job
118
security for shop floor level. Whereas results in aggregate imply salary, job
security, career development which every individual aspires has been provided
by the organizations and hence we can infer that retention is higher in
automobile industries.
Figure No: 4.12 Figure showing factors influencing to remain in the
organization
Reference: Table 4.12
0 5 10
Salary
Retirement benefit
Career Development
Working conditions
Supervision/Management
Fringe benefits
Recognition and reward
Job security
Loyalty towards the company
Company Image in the society
Mean
Attributes
Factors influencing employees to remain in organization with respect to
organizational hierarchy
Shop Floor Level
Middle Level
Top Level
119
Table No 4.13 Factors influencing employees to remain in organization
based on educational qualification
Source: primary data
Interpretation
From the Table 4.13 it is very clear that irrespective of varied educational qualification salary, career development, job security has been ranked as the most influencing factor for the employees to remain in the organization. Retirement benefit, company image are least ranking factor for retention. It can be concluded from the analysis that the company has better pay and good prospects for future growth with job security so that it is able to retain its employees for a maximum length of service.
Factors
Up to high school level
Bachelor Degree
Master degree
Diploma level
Total
Mean Mean Mean Mean Mean
Salary structure 1.59 2.19 2.17 1.64 1.92
Retirement benefits 6.83 7.05 6.86 6.65 6.86
Better Career Development
3.33 3.49 3.81 4.18 3.77
Working conditions 6.31 5.76 5.83 6.34 6.04
Supervision/Management 6.22 6.52 6.06 6.37 6.37
Fringe benefits 6.98 6.83 7.00 6.46 6.74
Recognition and rewards 6.30 6.39 6.56 6.82 6.56
Job security 3.44 3.79 3.35 3.55 3.60
Loyalty towards the company
7.39 6.91 6.67 6.66 6.84
Company Image in the Society
6.72 6.10 6.64 6.51 6.39
120
Table No 4.14 Factors influencing employees to remain in organization
based on marital status
Attributes Married Un married Total
Mean Mean Mean
Salary structure 2.09 1.83 1.92
Retirement benefits 6.97 6.79 6.86
Better Career Development 3.68 3.81 3.77
Working conditions 5.94 6.09 6.04
Supervision/Management 6.18 6.47 6.37
Fringe benefits 6.87 6.67 6.74
Recognition and rewards 6.46 6.61 6.56
Job security 3.55 3.63 3.60
Loyalty towards the company 6.64 6.95 6.84
Company Image in the society 6.54 6.31 6.39
Source Primary Data
Interpretation
From the above Table 4.14 it is clear that Salary, job security and
career development is ranked highest in married category and only a
marginal variation in unmarried where career development ranks second and
job security as third highest but in a nutshell salary, job security and career
development has been the most influencing factor for employee retention and
retirement benefit and company image supervision and management are least
rated. Hence we can infer that from the analysis key factors of retention are
well maintained by the organization so that it will have a higher retention rate.
121
Cross Tabulation
Table No 4.15 Various demographic factors with Length of service in the
present organization
H0: There is no significant relationship between gender and Length of
service in the present organization
H1: There is significant relationship between gender and Length of service
in the present organization
Gender * Length of service in present organization (in years)
Interpretation
The above Table 4.15 indicates that there is no significant
association between gender and length of service. It can be inferred that
irrespective of gender the organization policies remain the same and hence
there is no association between gender and length of service.
CountExpected Count% within GenderCountExpected Count% within GenderCountExpected Count% within Gender
Male
Female
Gender
Total
Less than 5 6-10 11-15 16-20 Above 20Length of service in pres ent organization (in years )
Total
Chi-Square Tests
5.767 a 4 .2179.121 4 .058
3.583 1 .058
500
Pearson Chi-SquareLikelihood RatioLinear-by-LinearAssociationN of Valid Cases
Value dfAsymp. Sig.
(2-sided)
122
Table No 4.16 Table showing relationship between Age Group and
Length of Service in present organisation
H0: There is no relationship between age and Length of service in the
present organization
H1: There is significant relationship between age and Length of service in
the present organization
Interpretation
There is significant association between age and length of service.
Age Group (in years) * Length of service in present organization (in years) Crossta bulation
288 13 2 0 303231.5 48.1 15.2 8.2 303.0
95.0% 4.3% .7% .0% 100.0%
68 61 3 4 136103.9 21.6 6.8 3.7 136.0
50.0% 44.9% 2.2% 2.9% 100.0%
10 2 19 9 4030.6 6.3 2.0 1.1 40.0
25.0% 5.0% 47.5% 22.5% 100.0%
366 76 24 13 479366.0 76.0 24.0 13.0 479.0
76.4% 15.9% 5.0% 2.7% 100.0%
CountExpected Count% within AgeGroup (in years)CountExpected Count% within AgeGroup (in years)CountExpected Count% within AgeGroup (in years)CountExpected Count% within AgeGroup (in years)
18-25
26-35
36-45
Age Group(in years)
Total
Less than 5 6-10 11-15 16-20Length of service in present organization (in years)
Total
Chi-Square Tests
364.272 a 6 .000245.031 6 .000
200.557 1 .000
479
Pearson Chi-SquareLikelihood RatioLinear-by-LinearAssociationN of Valid Cases
Value dfAsymp. Sig.
(2-sided)
123
Table 4.17 Table showing relationship between Organizational Hierarchy
and Length of Service in present organisation
H0: There is no association between organizational Hierarchy and Length of
service in the present organization
H1: There is significant association between organizational Hierarchy and
Length of service in the present organization
Interpretation
There is significant association between organizational
Hierarchy and Length of service in the present organization.
CountExpected Count% within OrganizationalHierarchyCountExpected Count% within OrganizationalHierarchyCountExpected Count% within OrganizationalHierarchyCountExpected Count% within OrganizationalHierarchy
Top Level
Middle Level
Shop Floor Level
OrganizationalHierarchy
Total
Less than 5 6-10 11-15 16-20 Above 20Length of s ervice in pres ent organization (in years )
Total
Chi-Square Tests
148.893 a 8 .000130.712 8 .000
109.644 1 .000
500
Pearson Chi-SquareLikelihood RatioLinear-by-LinearAssociationN of Valid Cases
Value dfAsymp. Sig.
(2-sided)
4 ll (26 7%) h t d t l th 5 Th
124
Table No 4.18 Table showing relationship between educational
background and Length of Service in present organization
H0: There is no relationship between educational background and Length of
service in the present organization
H1: There is significant relationship between educational background and
Length of service in the present organization
Interpretation
There is significant association between educational background
and Length of service in the present organization.
Table No 4.22 Table showing perception of employees to various factors based on marital status
H0: Marital status does not affect the perception on various factors under study.H1: Marital status affects the perception on various factors under study.
Interpretation
From the above Table 4.22 it has been found that the significance value is greater than 0.05 for all the factors except for Family Welfare Measures, it is concluded that marital status does not affect the perception on various factors under study except for Family Welfare Measures. Theperception of unmarried employees on family welfare measures is better than married employees.
Table 4.23 Table showing employee’s perception towards various factors with reference to age groups
H0:The perception of employees in different age groups on various factors is same.
H1:The perception of employees in different age groups on various factors is not same.
Interpretation
Table No 4.23 depicts that the significance value is greater than 0.05 for all the factors, the perception of employees in different age groups on various factors are same. However, the perception on rewards & recognition is marginally significant at 10% level for different age groups.
SalaryRetirement benefitCareer DevelopmentWorking conditionsSupervision/ManagementFringe benefitsRecognition and rewardJob securityLoyalty towards the companyCompany Image in the society
N MedianChi-
Square dfAsymp.
Sig.Chi-
Square dfAsymp.
Sig.
Yates ' ContinuityCorrection
Grouping Variable: Gendera.
135
Table 4.28 Ranking on factors influenced to remain in the organization
based on age groups
H0:The ranking of employees in different age groups on various factors
influence to remain in the organization are same.
H1:The ranking of employees in different age groups on various factors
influence to remain in the organization are not same.
Interpretation
As per Table 4.28 the sample respondents were grouped based on
age. Chi-square test was applied. Since the significance value is greater than
0.05 for all the factors except for salary, it may be inferred that ranking of
employees in different age groups on various factors which influence to
remain in the organization were same. Employees of all age group are
satisfied with the above mentioned factors and so the organization has adopted
a good retention plan. However, there is a significant difference between age
groups on ranking for the factor salary. The ranking preference for salary is
SalaryRetirement benefitCareer DevelopmentWorking conditionsSupervis ion/ManagementFringe benefitsRecognition and rewardJob securityLoyalty towards the companyCompany Image in the society
Chi-Square df Asymp. Sig.
Kruskal Wal lis Testa.
Grouping Variable: Age Group (in years)b.
136
Table 4.29 Ranking on factors influenced to remain in the organization
based on length of service
H0:The ranking of employees with different lengths of service on various
factors influence to remain in the organization are same.
H1:The ranking of employees with different lengths of service on various
factors influence to remain in the organization are not same.
Interpretation
Table 4.29 shows the various factors which influence the employees to remain in the present organization based on length of service Since the significance value is greater than 0.05 for all the factors, it may be inferred that ranking of employees with different lengths of service on various factors influence to remain in the organization were found to be same. Since length of service determines retention, it can be concluded that the organization has high retention of its employees.
SalaryRetirement benefitCareer DevelopmentWorking conditionsSupervision/ManagementFringe benefitsRecognition and rewardJob securityLoyalty towards the companyCompany Image in the society
Chi-Square df Asymp. Sig.
Kruskal Wallis Testa.
Grouping Variable: Length of service in present organization (inyears)
b.
137
Table 4.30 Ranking on factors influenced to remain in the organization
based on organizational hierarchy
H0:The ranking of employees in different organizational hierarchy on various
factors influence to remain in the organization are same.
H1:The ranking of employees in different organizational hierarchy on various
factors influence to remain in the organization are not same.
Interpretation
As per Table 4.30 the sample respondents were grouped on
organizational hierarchy basis. Chi-square test was applied. There is a
significant difference in the rankings on salary, working conditions, fringe
benefits and recognition & rewards are greater than 0.05 with respect to
organizational hierarchy .For the other factors, there is no significant
SalaryRetirement benefitCareer DevelopmentWorking condi tionsSupervis ion/ManagementFringe benefitsRecognition and rewardJob securityLoyalty towards the companyCompany Image in the society
Chi-Square df Asymp. Sig.
Kruskal Wallis Testa.
Grouping Variable: Organizational Hierarchyb.
138
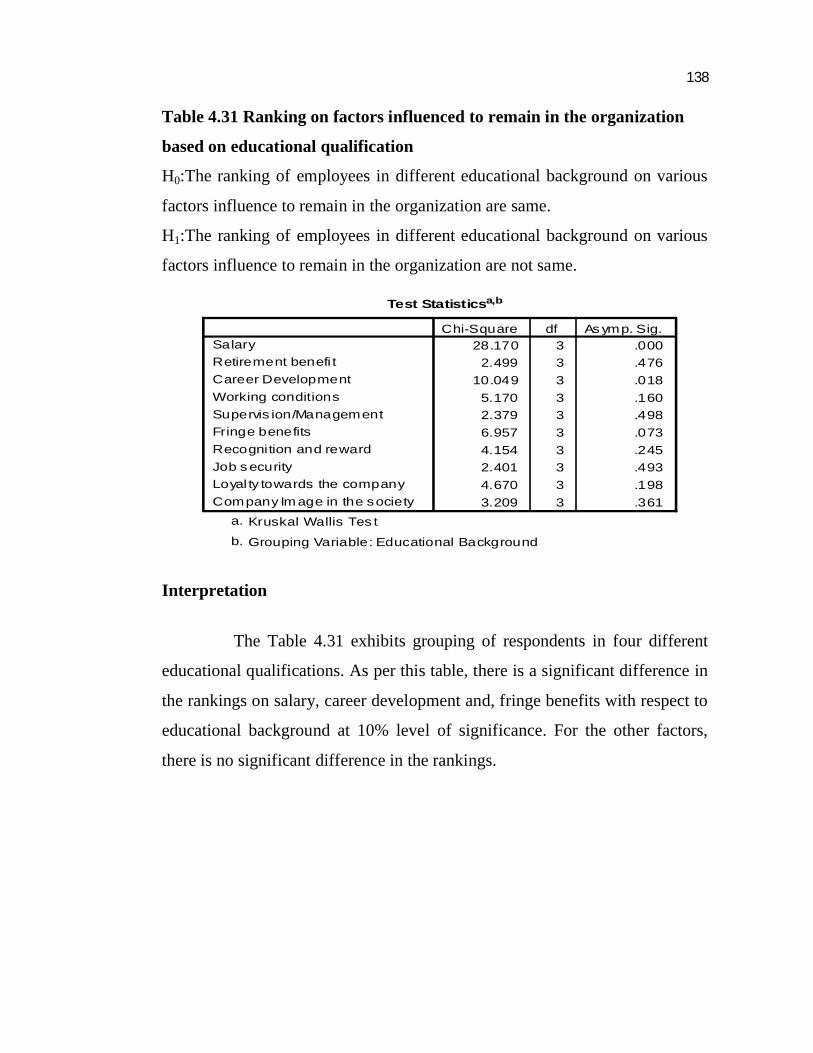
Table 4.31 Ranking on factors influenced to remain in the organization
based on educational qualification
H0:The ranking of employees in different educational background on various
factors influence to remain in the organization are same.
H1:The ranking of employees in different educational background on various
factors influence to remain in the organization are not same.
Interpretation
The Table 4.31 exhibits grouping of respondents in four different
educational qualifications. As per this table, there is a significant difference in
the rankings on salary, career development and, fringe benefits with respect to
educational background at 10% level of significance. For the other factors,
there is no significant difference in the rankings.
SalaryRetirement benefi tCareer DevelopmentWorking conditionsSupervis ion/ManagementFringe benefitsRecognition and rewardJob s ecurityLoyal ty towards the companyCompany Image in the society
Chi-Square df As ymp. Sig.
Kruskal Wallis Tes ta.
Grouping Variable: Educational Backgroundb.
139
Table 4.32 Ranking on factors influenced to remain in the organization
based on marital status
H0:The ranking of married and unmarried employees on various factors
influence to remain in the organization is same.
H1:The ranking of married and unmarried employees on various factors
influence to remain in the organization is not same.
Interpretation
As per Table 4.32 the sample respondents were grouped based on
marital status .Chi-square test was applied. The ranking of married and
unmarried employees on various factors influence to remain in the
SalaryRetirement benefitCareer DevelopmentWorking conditionsSupervision/ManagementFringe benefi tsRecognit ion and rewardJob securityLoyalty towards the companyCompany Image in the society
N MedianChi-
Square dfAsymp.
Sig.Chi-
Square dfAsymp.
Sig.
Yates ' ContinuityCorrection
Grouping Variable: Marital statusa.
140
Mann-Whitney TestTable 4.33 Table showing superior subordinate relationship with respect to genderH0 :There is a significant difference in ranking of male and female on various factors with respect to superior subordinate relationship.
H1:There is no significant difference in ranking of male and female on various factors with respect to superior subordinate relationship.
Interpretation
The Table 4.33 depicts the sample of respondents based on gender. Chi-square test has been applied to test the hypothesis. It has been found that there is no significant difference in the rankings of male and females on various factors with respect to superior subordinate relationship in the organization for the following factor like recognition of employee for achievement, teamwork and coordination, clarity in explaining the task to be accomplished, superiors follow an autocratic approach, Superior is a good counsellor ,Superior is impartial ,Superior is a task master ,Superior considers other’s suggestions and opinions ,Superior maintains friendly relationship.
Approachability of superiorRecognition of employee for achievementTeamwork and coordinationRespecting coworkers, subordinatesClarity in explaining the task to be accomplishedSuperiors follow an autocratic approachSuperiors act like a coachSuperior is a good counselorSuperior helps in completing the workSuperior is impartialSuperior is a task masterSuperior makes working environment pleasantSuperior considers others s uggestions and opinionsSuperior maintains friendly relationshipSuperior cares for workers personal welfare
Mann-Whitney
UWilcoxon
W Z
Asymp.Sig.
(2-tailed)
Grouping Variable: Gendera.
141
Superior cares for worker’s personal welfare and there is significant difference in the rankings of male and females on various factors at 10% significance level with respect to superior subordinate relationship in the organization for the following factors like
Approachability of superior where females have given better ranking than males, respecting coworkers, subordinates, superior acts like a coach, superior helps in completing the work and superior makes work environment pleasant has been ranked better by male employees rather than female employees.
Table 4.34 Table showing superior subordinate relationship with respect to age groupH0:There is a significant difference in ranking of employees on various factors with respect to superior subordinate relationship based on age groupH1:There is no significant difference in ranking of employees on various factors with respect to superior subordinate relationship based on age group
Test Statistics(a,b)
Chi-Square dfAsymp.
Sig.Approachability of superior 6.356 4 .174Recognition of employee for achievement 1.655 4 .799Teamwork and coordination 15.066 4 .005Respecting coworkers, subordinates 9.034 4 .060Clarity in explaining the task to be accomplished .752 4 .945Superiors follow an autocratic approach 3.713 4 .446Superiors act like a coach 3.881 4 .422Superior is a good counselor 3.121 4 .538Superior helps in completing the work 6.676 4 .154Superior is impartial 8.020 4 .091Superior is a task master 1.734 4 .784Superior makes working environment pleasant 1.166 4 .884Superior considers others suggestions and opinions 5.714 4 .222Superior maintains friendly relationship 2.189 4 .701Superior cares for workers personal welfare 4.684 4 .321a Kruskal Wallis Testb Grouping Variable: Age Group (in years)
142
Interpretation
The Table 4.33 depicts the sample of respondents based on age
group. Chi-square test has been applied to test the hypothesis. It has been
found that the rankings of employees in different age groups on various factors
with respect to superior subordinate relationship in the organization are same
for the following factors like approachability of superior , recognition of
employee for achievement ,clarity in explaining the task to be accomplished ,
superiors follow an autocratic approach
Superior is a good counsellor , superior helps in completing the
work, superiors act like a coach, Superior is a task master , superior makes
working environment pleasant
Superior considers others suggestions and opinions , superior
maintains friendly relationship, superior cares for worker’s personal welfare .
There is significant difference in the rankings of male on females on
various factors with respect to superior subordinate relationship in the
organization for the following factors at 10% significance level
Teamwork and coordination – Employees in age group 46-55 have
better preference for teamwork followed by employees in age group 26-35.
Respecting coworkers, subordinates – Employees in age group 36-
45 have better preference for teamwork followed by employees in age group
26-35.
Superior is impartial – Employees in age group 36-45 have better
preference for teamwork followed by employees in age group above 55.
143
Table 4.35 Table showing superior subordinate relationship with respect
to length of service
H0:There is a significant difference in ranking of employees on various factors
with respect to superior subordinate relationship based on length of service
H1:There is no significant difference in ranking of employees on various
factors with respect to superior subordinate relationship based on length of
service
Interpretation
The Table 4.35 depicts employees views on the various factors
which influence them to remain in the organization based on length o service
as basis. The results of the analysis were as follows
The rankings of employees with lengths of service with respect to
superior subordinate relationship in the organization are same for the
Approachability of superiorRecognition of employee for achievementTeamwork and coordinationRespecting coworkers, subordinatesClarity in explaining the task to be accomplishedSuperiors follow an autocratic approachSuperiors act like a coachSuperior is a good counselorSuperior helps in completing the workSuperior is impartialSuperior is a task masterSuperior makes working environment pleasantSuperior considers others suggestions and opinionsSuperior maintains friendly relationshipSuperior cares for workers personal welfare
Chi-Square df Asymp. Sig.
Kruskal Wallis Testa.
Grouping Variable: Length of service in present organization (in years)b.
144
following factors namely approachability of superior , recognition of
employee for achievement, respecting coworkers, subordinates ,clarity in
explaining the task to be accomplished ,superiors follow an autocratic
approach, superiors act like a coach, superior is a good counsellor .
Superior helps in completing the work, superior is a task master,
superior is impartial
Superior makes working environment pleasant, superior maintains
friendly relationship, superior cares for worker’s personal welfare.
There is significant difference in the rankings of employees with
different lengths of service with respect to superior subordinate relationship in
the organization for the following factors at 10% significance level for
teamwork and coordination and superior considers others suggestions and
opinions.
145
Table 4.36 Table showing superior subordinate relationship with respect
to organizational hierarchy
H1:There is significant difference in ranking of employees in different
organizational hierarchy on various factors with respect to superior
subordinate relationship.
H0:There is no significant difference in ranking of employees in different
organizational hierarchy on various factors with respect to superior
subordinate.
InterpretationThe Table 4.36 exhibits the relationship between superior and
subordinate based on organizational hierarchy. Chi-square test has been applied. The results of the analysis indicate that the rankings of employees in different organizational hierarchy with respect to superior subordinate relationship in the organization are same for the following factors namely approachability of superior, recognition of employee for achievement ,clarity in explaining the task to be accomplished ,superiors follow an autocratic approach, superiors act like a coach, superior helps in completing the work
Approachability of superiorRecognition of employee for achievementTeamwork and coordinationRespecting coworkers, subordinatesClarity in explaining the task to be accomplishedSuperiors follow an autocratic approachSuperiors act like a coachSuperior is a good counselorSuperior helps in completing the workSuperior is impartialSuperior is a task masterSuperior makes working environment pleasantSuperior considers others suggestions and opinionsSuperior maintains friendly relationshipSuperior cares for workers personal welfare
Chi-Square df Asymp. Sig.
Kruskal Wallis Testa.
Grouping Variable: Organizational Hierarchyb.
146
superior is a task master, superior makes working environment
pleasant, superior considers others suggestions and opinions and superior
maintains friendly relationship
There is significant difference in the rankings of employees in
different organizational hierarchy with respect to superior subordinate
relationship in the organization for the following factors at 10% significance
level for teamwork and coordination – middle level employees have a better
ranking for this factor. Respecting coworkers, subordinates – top level
employees have a better ranking for this factor. Superior is a good counselor –
top level employees have a better ranking for this factor. Superior is impartial
– shop floor level employees have a better ranking for this factor. Superior
cares for workers personal welfare – shop floor level employees have a better
ranking for this factor.
147
Table 4.37Table showing superior subordinate relationship based on
educational qualification
H 0: The ranking of employees in different educational background on various
factors with respect to superior subordinate relationship in the organization are
same.
H1:The ranking of employees in different educational background on various
factors with respect to superior subordinate relationship in the organization are
not same.
Test Statistics(a,b)
Chi-Square df Asymp. Sig.
Approachability of superior 6.943 3 .074
Recognition of employee for achievement 2.158 3 .540
Teamwork and coordination 21.090 3 .000
Respecting coworkers, subordinates 5.163 3 .160
Clarity in explaining the task to be accomplished 2.564 3 .464
Superiors follow an autocratic approach 1.350 3 .717
Superiors act like a coach .845 3 .839
Superior is a good counselor 1.581 3 .664
Superior helps in completing the work 1.983 3 .576
Superior is impartial 8.854 3 .031
Superior is a task master .210 3 .976
Superior makes working environment pleasant 1.609 3 .657
Superior considers others suggestions and opinions 5.187 3 .159
Superior maintains friendly relationship .768 3 .857
Superior cares for workers personal welfare 13.254 3 .004
a Kruskal Wallis Test
b Grouping Variable: Educational Background
148
Interpretation
The respondents were grouped on educational qualification basis as
per Table 4.37 The rankings of employees in different educational background
on various factors with respect to superior subordinate relationship in the
organization are same for the following factors like recognition of employee
for achievement, respecting coworkers, subordinates, clarity in explaining the
task to be accomplished, superiors follow an autocratic approach ,superiors act
like a coach, superior is a good counsellor
Superior helps in completing the work, superior is a task master,
superior makes working environment pleasant, superior considers others
suggestions and opinions and
superior maintains friendly relationship and there is significant
difference in the rankings of employees with different educational background
on various factors with respect to superior subordinate relationship in the
organization for the following factor like approachability of superior , Team
work and coordination has been ranked better by employees with master
degree .Superior is impartial and superior cares for personal welfare has been
ranked better by employees with high school qualification.
149
Table 4.38 Table showing superior subordinate relationship based on
Martial Status
H0:The ranking of male and female on various factors with respect to superior
subordinate relationship in the organization is same.
H1:The ranking of married and unmarried employees on various factors with
respect to superior subordinate relationship in the organization is not same.
Interpretation
The sample respondents were grouped based on marital status, as
per Table 4.38 the results found were that the rankings of married and
unmarried employees with respect to superior subordinate relationship in the
organization are same for the following factors like approachability of
superior, recognition of employee for achievement, teamwork and
coordination, clarity in explaining the task to be accomplished, superiors
follow an autocratic approach, superior is a good counselor Superiors act like
a coach, superior helps in completing the work, superior is impartial Superior
Approachability of superiorRecognition of employee for achievementTeamwork and coordinationRespecting coworkers, subordinatesClarity in explaining the task to be accomplishedSuperiors follow an autocratic approachSuperiors act like a coachSuperior is a good counselorSuperior helps in completing the workSuperior is impartialSuperior is a task masterSuperior makes working environment pleasantSuperior cons iders others suggestions and opinionsSuperior maintains friendly relationshipSuperior cares for workers personal welfare
Mann-Whitney U
WilcoxonW Z
Asymp.Sig.
(2-tailed)
Grouping Variable: Marital statusa.
150
is a task master, superior considers others suggestions and opinions, superior
maintains friendly relationship and superior makes working environment
pleasant.
There is significant difference in the rankings of married and
unmarried employees on various factors with respect to superior subordinate
relationship in the organization for the following factors at 10% significant
level where Respecting coworkers, subordinates married employees have
given better ranking by married employees and superior cares for workers
personal welfare has been ranked better by unmarried employees.


![vertical neck regular [VNR] - Implant System · 2017. 7. 4. · XIC10 1.9 10 4.8 4.1 0.7 4.1 4.8 XIC12 1.9 12 4.8 4.1 0.7 4.1 4.8 XIC14 1.9 14 4.8 4.1 0.7 4.1 4.8 XIC16 1.9 16 4.8](https://static.documents.pub/doc/80x56/60c62ef912a4697e3b3f34ad/vertical-neck-regular-vnr-implant-2017-7-4-xic10-19-10-48-41-07-41.jpg)


