13
AGF MANAGEMENT LIMITED EARNINGS CONFERENCE CALL SECOND QUARTER 2016 JUNE 29 TH , 2016

AGF MANAGEMENT LIMITED
EARNINGS CONFERENCE CALLSECOND QUARTER 2016
JUNE 29TH, 2016
CAUTION REGARDING FORWARD-LOOKING STATEMENTS
The forward looking information is provided as of June 29th, 2016. Certain information presented in these remarks and in this presentation that is not historical factual information may constitute forward-looking information within the meaning of securities laws. Actual results could differ materially from a conclusion, forecast or projection contained in such forward-looking information. Forward-looking information may relate to our future outlook and anticipated events or results and may include statements about AGF Management Limited ("AGF") or the investment funds it manages (the "Funds"), including business operations, strategy and expected financial performance and condition. Forward-looking statements include statements that are predictive in nature, depend upon or refer to future events or conditions, or include words such as ‘expects,’ ‘anticipates,’ ‘intends,’ ‘plans,’ ‘believes,’ or negative versions thereof and similar expressions or future or conditional verbs such as ‘may,’ ‘will,’ ‘should,’ ‘would,’ or ‘could.’ In addition, any statement that may be made concerning future financial performance (including revenues, earnings or growth rates),ongoing business strategies or prospects, and possible future action on our part, is also a forward-looking statement.
Forward-looking statements are based on certain material factors and assumptions, including expected growth, results of operations, business prospects, business performance and opportunities. While we consider these factors and assumptions to bereasonable based on information currently available, they may prove to be incorrect. Forward-looking statements are based on current expectations and projections about future events and are inherently subject to, among other things, risks, uncertainties and assumptions about our operations, economic factors and the financial services industry generally. They are not guarantees of future performance, and actual events and results could differ materially from those expressed or implied by forward-looking statements made by us due to, but not limited to, important risk factors such as level of assets under our management, volume ofsales and redemptions of our investment products, performance of our investment funds and of our investment managers and advisors, competitive fee levels for investment management products and administration, and competitive dealer compensation levels and cost efficiency in our investment management operations, as well as interest and foreign exchange rates, taxation,changes in government regulations, unexpected judicial or regulatory proceedings, and our ability to complete strategic transactions and integrate acquisitions. We caution that the foregoing list is not exhaustive. The reader is cautioned to consider these and other factors carefully and not place undue reliance on forward-looking statements. Other than specifically required by applicable laws, we are under no obligation (and expressly disclaim any such obligation) to update or alter the forward-looking statements, whether as a result of new information, future events or otherwise. For a more complete discussion of the risk factors that may impact actual results, please refer to AGF’s most recent financial statements and MD&A and, for the Funds, to each Fund’s most recent prospectus and MRFP, as applicable, all available on www.sedar.com.
2

CONFERENCE CALL PARTICIPANTS
• Blake C. Goldring, CFA
Chairman & Chief Executive Officer
• Kevin McCreadie, CFA
President & Chief Investment Officer
• Robert J. Bogart
Executive Vice-President & Chief Financial Officer
3

• Highlights of the 2nd Quarter
• Business Updates
• Retail Business
• Investment Management
• Institutional Business
• Alternatives
• Financial Results
• Capital & Liquidity
• Focus & Priorities
TODAY’S DISCUSSION
4

Q2 2016 HIGHLIGHTS
5
• Highlights:
• AUM increased by 6%; improvement across all lines of business
• AUM above median: 1 year 50%, 3 years 54%
• 31% improvement in mutual fund flows compared to Q2 2015
• Completed first close of Essential Infrastructure Fund
• Earnings per share of $0.12
• Board confirmed $0.08 dividend for Q2 2016
Continued progress toward stated objectives

RETAIL BUSINESS REVIEW
6
Continued improvement in mutual fund flows
• Mutual fund net redemptions improved by 31% despite market volatility
• Strong gross sales through strategic distribution partnerships
• Good performance in key categories coupled with new product development
will drive continued improvement
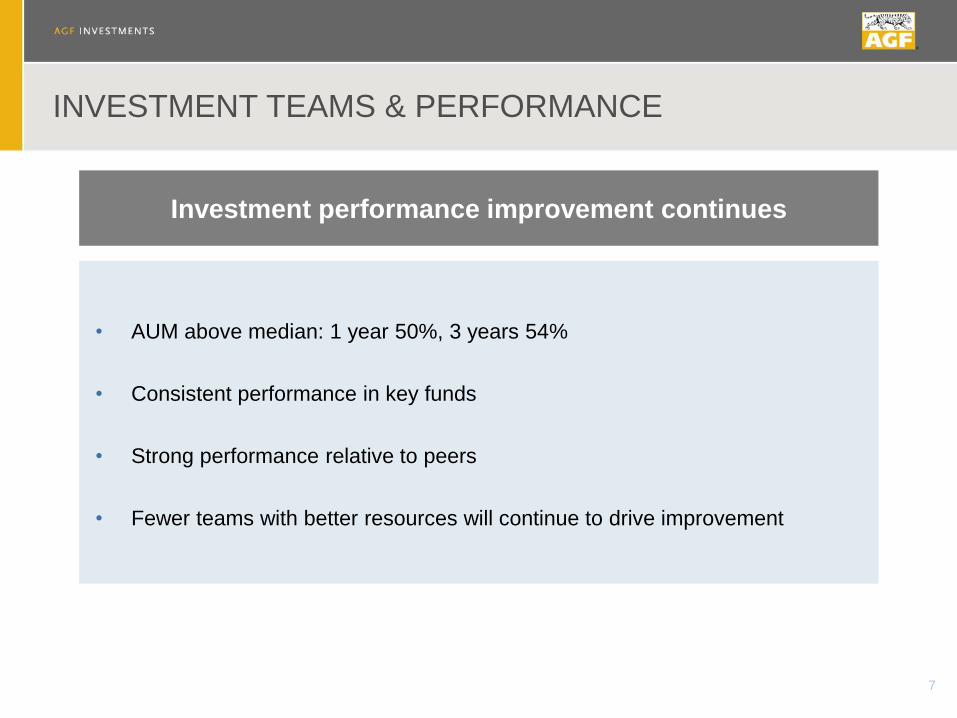
• AUM above median: 1 year 50%, 3 years 54%
• Consistent performance in key funds
• Strong performance relative to peers
• Fewer teams with better resources will continue to drive improvement
INVESTMENT TEAMS & PERFORMANCE
7
Investment performance improvement continues

INSTITUTIONAL BUSINESS REVIEW & PIPELINE
8
($ millions)
Gross Sales Commitments 480
Redemption Notifications (250)
Q1 Net Pipeline 230
Gross Sales from Q1 Pipeline 473
Redemptions from Q1 Pipeline (250)
Additional Q2 Gross Sales 165
Additional Q2 Redemptions (132)
Total Q2 Net Sales 256
Gross Sales 125
Redemption Notifications (434)
Q2 Net Pipeline (309)
Q1
Pip
eli
ne
Q2
Pip
eli
ne
Q2
Ac
tivit
y
• Essential Infrastructure Fund final close
on track for year end
• Significant Global Core win in Q2
• Global strategies performing well
• Negative pipeline a result of government
policy shift in the United Kingdom

9
SUMMARY OF FINANCIAL RESULTS
Sequential Quarter Quarter Over Quarter
($ millions, except per share amounts) Q2 '16 Q1 '16Fav /
(Unfav) Q2 '16 Q2 '15
Fav /
(Unfav)
Revenue 111.1 103.3 7.6% 111.1 117.1 (5.1%)
SG&A 54.0 45.3 (19.2%) 54.0 46.6 (15.9%)
EBITDA 26.2 27.3 (4.0%) 26.2 36.0 (27.2%)
EBITDA Margin 23.6% 26.4% (10.6%) 23.6% 30.7% (23.1%)
EBITDA (adjusted) 27.7 27.3 1.47% 27.7 36.0 (23.1%)
EBITDA Margin (adjusted) 24.9% 26.4% (5.7%) 24.9% 30.7% (18.9%)
Free Cash Flow 16.4 11.1 47.7% 16.4 16.8 (2.4%)
Net Income 9.6 10.2 (5.9%) 9.6 14.7 (34.7%)
Net Income (adjusted) 10.7 10.2 4.9% 10.7 14.7 (27.2%)
Consolidated EPS 0.12 0.13 (7.7%) 0.12 0.17 (29.4%)
Co
nti
nu
ing
Op
era
tio
ns

FINANCIAL RESULTS – BPS DETAIL
(1) Average AUM excludes Alternatives Platform.
(2) Represents management, advisory, administration fees and deferred sales charge revenue only.
(3) Includes investment advisory fees. SG&A and EBITDA adjusted to exclude one-time costs of $1.5M and $8.7M in Q2 2016 and TTM, respectively. 10
EBITDA yield decline reflects lower average AUM
(bps of average AUM) Q2-16 TTM
Average AUM ($B)1 32.3 33.1
Average Retail 17.2 17.9
Average Institutional and HNW 15.1 15.2
Revenue (bps)2 128 123
Less:
Trailer Fees (bps) 37 37
SG&A (bps)3
66 58
EBITDA (bps)3
25 28
FREE CASH FLOW
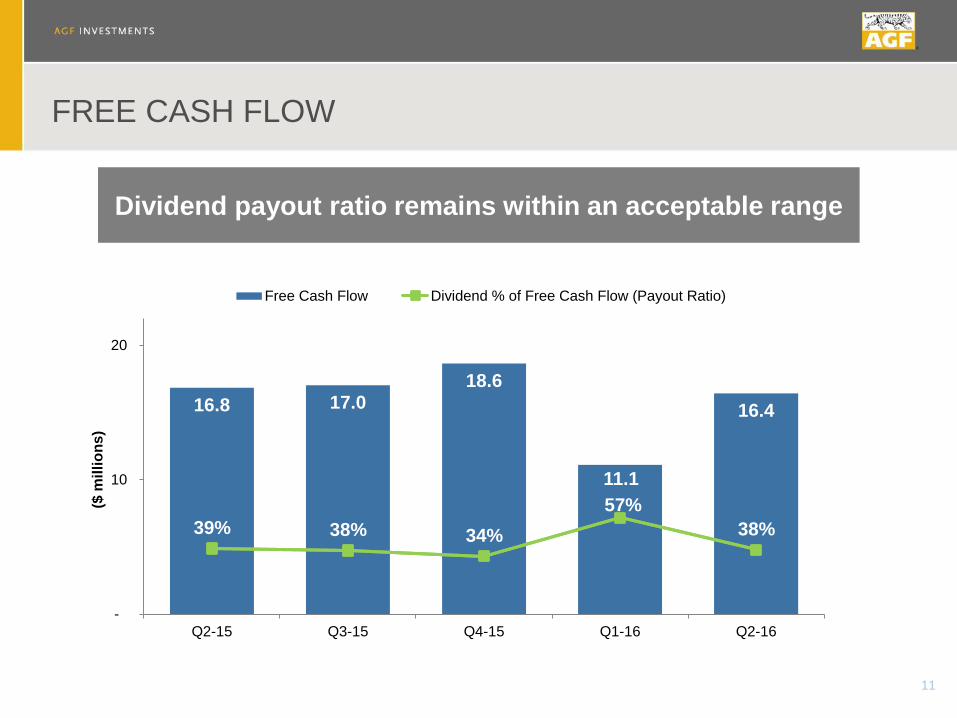
Dividend payout ratio remains within an acceptable range
11
16.8 17.0 18.6
11.1
16.4
39% 38% 34%
57%
38%
0%
20%
40%
60%
80%
100%
120%
140%
160%
-
10
20
Q2-15 Q3-15 Q4-15 Q1-16 Q2-16
($ m
illi
on
s)
Free Cash Flow Dividend % of Free Cash Flow (Payout Ratio)
2016 FOCUS & PRIORITIES
12
• Key Execution Points
• Sustain investment performance improvement
• Drive gross sales through retail product development and strategic
partnerships
• Integrate FFCM and leverage new product capability
• Continue the development of the Infrastructure Platform
Build on improved investment performance

QUESTIONS


