October 2017 – Issue 70 Agilent ICP-MS Journal Inside this Issue 2-3 The Benefits of MS/MS for Reactive Cell Gas Methods in ICP-MS 4-5 ASTM Issue ICP-MS Method for Analysis of Petroleum Distillate Products 5 Educational Spotlight: The Role of ICP-MS in Investigating Neurodegenerative Diseases 6-7 Fast Analysis of Arsenic Species in Wines using LC-ICP-QQQ 7 On-demand Webinar: Single Particle Mode or Hyphenated ICP-MS? A Discussion of Nanoparticle Analysis in Complex Matrices 8 On-Demand Webinars: Arsenic Speciation Comes of Age and New Elemental Impurities Tests for Pharmaceutical Products; Your Invite to Join Agilent at Two Winter Plasma Conferences; Conferences. Meetings. Seminars.; Agilent ICP-MS Publications
Transcript
October 2017 – Issue 70
Agilent ICP-MS Journal
Inside this Issue
2-3 The Benefits of MS/MS for Reactive Cell Gas Methods in ICP-MS
4-5 ASTM Issue ICP-MS Method for Analysis of Petroleum Distillate Products
5 Educational Spotlight: The Role of ICP-MS in Investigating Neurodegenerative Diseases 6-7 Fast Analysis of Arsenic Species in Wines using LC-ICP-QQQ
7 On-demand Webinar: Single Particle Mode or Hyphenated ICP-MS? A Discussion of Nanoparticle Analysis in Complex Matrices
8 On-Demand Webinars: Arsenic Speciation Comes of Age and New Elemental Impurities Tests for Pharmaceutical Products; Your Invite to Join Agilent at Two Winter Plasma Conferences; Conferences. Meetings. Seminars.; Agilent ICP-MS Publications
2 Agilent ICP-MS Journal July 2017 - Issue 69 agilent.com/chem/icpms
The Benefits of MS/MS for Reactive Cell Gas Methods in ICP-MSEd McCurdy Agilent Technologies, UK
IntroductionQuadrupole ICP-MS has been around for over 30 years. For most of that time, commercial instruments have used a single quadrupole mass filter to select the mass of the ions that pass to the detector. While providing simplicity and good performance, single quadrupole MS offers limited opportunities for resolving spectral overlaps.
The development of collision/reaction cells (CRCs) in 1999 heralded a new era in ICP-MS. CRCs allowed problematic interferences to be addressed using an inert cell gas (usually helium) and kinetic energy discrimination (KED), or a reactive cell gas with selective ion/molecule reaction chemistry.
He mode quickly established itself as a reliable way to measure many common analytes, but reaction chemistry has had a more troubled history. Initially promoted as a universal solution for all interferences, users soon found that many of the theoretically useful reaction chemistry approaches did not deliver reliable results in real samples. That’s because most real samples contain other analytes and matrix elements in addition to the target analyte. These other ions may also react with the cell gas, forming new product ions that can appear at the same mass as the target analyte or analyte product ion. The more reactive the cell gas, the more complex the chemistry, and the more likely the formation of overlapping product ions.
So, what to do? Clearly some way was needed to prevent the other, non-target analyte and matrix ions from entering the cell. The solution arrived in the form of the world’s first triple quadrupole ICP-MS, the Agilent 8800, in 2012. The 8800 (and newer 8900) ICP-QQQ has an additional quadrupole mass filter (Q1) positioned before the CRC. Because Q1 is a true mass filter, it can select an individual mass to pass to the cell (MS/MS); all other masses – and therefore all other elements –
are rejected. In MS/MS, only the target analyte ion and any on-mass interferences enter the cell. This extra mass-selection step means that the reaction chemistry is predictable and consistent. MS/MS mode leads to more accurate and reliable results, even when the sample composition (matrix or other analytes) is complex or variable.
So why aren’t all ICP-MS instruments triple quads? The main downside is the significantly higher cost of QQQ instruments. Obviously a QQQ requires an extra quadrupole and associated power supply and control electronics. In addition, Q1 must be housed in a low pressure vacuum chamber in order to provide true 1 u mass filter operation and high ion transmission. Without this, MS/MS is not possible. The engineering challenge is how to design the vacuum system to allow the two quadrupole vacuum chambers to be pumped to a lower pressure than the CRC chamber in between them. This was addressed in Agilent's US patent 2013/0175442 A1.
ICP-MS ConfigurationsIn addition to the traditional single quadrupole and new triple quadrupole ICP-MS systems, there are also
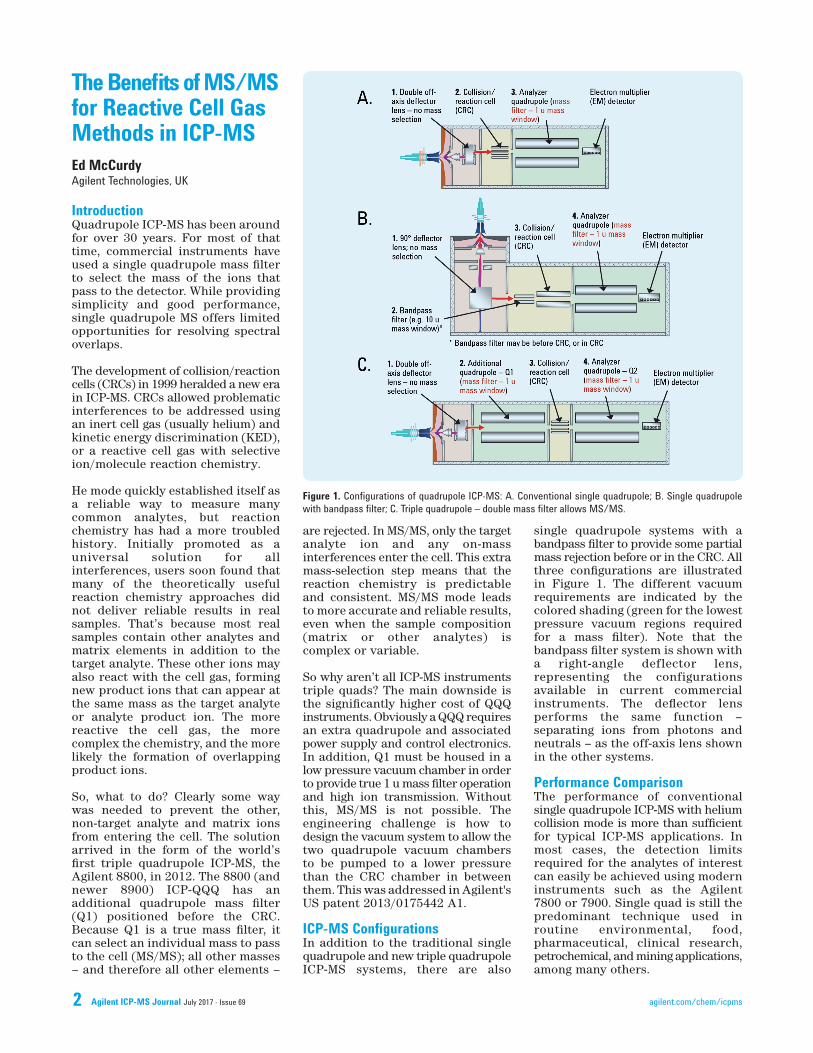
single quadrupole systems with a bandpass filter to provide some partial mass rejection before or in the CRC. All three configurations are illustrated in Figure 1. The different vacuum requirements are indicated by the colored shading (green for the lowest pressure vacuum regions required for a mass filter). Note that the bandpass filter system is shown with a right-angle deflector lens, representing the configurations available in current commercial instruments. The deflector lens performs the same function – separating ions from photons and neutrals – as the off-axis lens shown in the other systems.
Performance ComparisonThe performance of conventional single quadrupole ICP-MS with helium collision mode is more than sufficient for typical ICP-MS applications. In most cases, the detection limits required for the analytes of interest can easily be achieved using modern instruments such as the Agilent 7800 or 7900. Single quad is still the predominant technique used in routine environmental, food, pharmaceutical, clinical research, petrochemical, and mining applications, among many others.
Figure 1. Configurations of quadrupole ICP-MS: A. Conventional single quadrupole; B. Single quadrupole with bandpass filter; C. Triple quadrupole – double mass filter allows MS/MS.
3Agilent ICP-MS Journal October 2017 - Issue 70agilent.com/chem/icpms
For some sample types and applications, however, better performance – beyond the capability of He mode – is required. This may be due to industry demands for lower detection limits, for example in semiconductor process chemicals and high-performance materials. Or there may be a requirement to analyze “difficult” elements such as S, P, or Si. There may also be cases where a specific sample gives rise to problematic interferences that He mode cannot resolve, such as doubly-charged or isobaric overlaps. In these cases, a reaction chemistry method may provide the solution. But a single quad or bandpass system can give highly variable results when a reactive cell gas is used. Without control of the ions that enter the cell, the reaction processes are unpredictable, and the product ions generated will vary depending on the composition of the sample.
The extra quadrupole mass filter of the triple quad configuration enables MS/MS operation, providing the control needed for reliable reaction chemistry. By preventing non-target precursor ions from entering the cell, MS/MS controls the reaction chemistry processes and prevents potentially overlapping product ions from being formed from non-target analytes or matrix elements.
Example ApplicationsThere are numerous applications where only MS/MS (1 u mass filter before the CRC) provides the control required for successful analysis. Some examples are outlined in Table 1. Even when using a reaction gas with relatively simple chemistry – H2, O2, etc. – problems of unwanted reaction product ions can occur. Examples include the formation of hydride product ion overlaps, and inter-isotope overlaps formed from the minor oxygen isotopes.
However, the benefit of MS/MS is most apparent when a highly reactive
cell gas – such as NH3, CH4, CH3F – is used, as the potential for creating overlapping product ions increases with the reactivity of the cell gas. For example, when Ti-48 is measu-red in NH3 reaction mode, a typical target product ion is 48TiNH(NH3)3
+
at m/z 114. MS/MS can remove the Cd-114 from the mass spectrum to allow the Ti product ion to be measured free from Cd-114 overlap. A 10 u bandpass filter can also remove the Cd-114, since its mass is a long way from the Ti-48 precursor ion.
However, a bandpass filter cannot reject other ions that are near to the target precursor ion mass. In this example, all ions between m/z 43 and 53 will also enter the cell, reac-ting with NH3 to form product ions that may also appear at m/z 114. Some examples are shown in Figure 2.The product ions formed – and therefore the result reported for Ti – will vary with the sample composition. In contrast, with MS/MS, only the Ti-48 (and the on-mass interferences) can enter the cell, so the reaction chemistry and product ions are
consistent. Figure 2 illustrates the difference between bandpass and MS/MS for control of reaction chemistry with NH3 cell gas.
ConclusionsReactive cell gases are typically only needed for ICP-MS applications that cannot be achieved successfully using helium mode. These reaction mode applications are demanding and require the highest data integrity. To provide reliable and consistent data, MS/MS is essential to control the ions that can enter the CRC. MS/MS requires two fully functioning mass filters, each with 1 u resolution, to ensure accurate and reliable results with reactive cell gases. To achieve 1 u mass resolution in Q1 requires a true mass filter and a specialized vacuum system with two low-pressure analyzer chambers; one either side of the higher-pressure CRC chamber.
Recommended ReadingL. Balcaen, E. Bolea-Fernandez, M. Resano and F. Vanhaecke, Anal Chim Acta, 894, 2015, 7–19
Figure 2. Comparison of bandpass (A) and MS/MS (B) for Ti analysis in NH3 reaction mode. Bandpass filter does not provide adequate control of ions entering the cell, so non-target product ions can form and overlap the analyte product ion of interest.
Table 1. Examples of reaction modes used for interference control in ICP-MS. A bandpass filter before the cell provides some limited control of reaction chemistry, but is not able to resolve product ion overlaps from nearby non-target ions, or inter-isotope overlaps.
* Cannot be resolved if there is insufficient mass difference between target analyte precursor (parent) ion and product ion (e.g. hydride product ions) ** On bandpass systems, distant ions can be rejected, but nearby ions (within 10 u window) will enter the cell and react
Target analyte Mass resolution possible?
Type of interference Cell gas Ion/product ion Mass Interfering ion(s) Bandpass MS/MSExisting ions at analyte product ion mass* O2 75As16O+ 91 91Zr+ Yes YesOverlaps from distant** non-target ions NH3 52Cr+ 52 40Ar12C+ Yes YesOverlaps from nearby** non-target ions NH3 48TiNH(NH3)3+ 114 45ScNH4(NH3)3+ No YesOverlaps from adjacent non-target ions H2 39K+ 39 38ArH+ No YesInter-isotope product ion overlaps O2 34S16O+ 50 32S18O+ No Yes
ASTM Issue ICP-MS Method for Analysis of Petroleum Distillate Products Jenny Nelson and Ed McCurdyAgilent Technologies, USA and UK
IntroductionASTM International develops and publishes voluntary consensus standard test methods to improve product quality and safety for consumers [1].
In July 2017, ASTM issued their first test method for ICP-MS: ASTM D8110 - 17 Standard Test Method for Elemental Analysis of Distillate Products by ICP-MS. This test method describes the procedure for the determination of trace elements in light and middle distillate petroleum products using ICP-MS.
The method is expected to be well received by the industry as many laboratories are already using ICP-MS for much of their trace analysis workload. ICP-MS provides significantly lower detection limits than other elemental techniques such as ICP-OES, so trace elements can be detected at lower levels in petroleum products.
Trace element analysis is important in the petroleum industry, as some elements impact the performance and value of the final product. Other elements have a detrimental effect on petroleum refining processes, as in the case of elements which can deactivate or poison catalysts.
Recognizing demand from industry and advances in instrumentation, ASTM is also expected to publish an ICP-MS method for elemental analysis of petroleum crude oils.
In this article, we outline an ICP-MS method for the determination of multiple elements in different types of crude oil samples following simple dilution in an organic solvent, o-xylene.
The aim of the study was to develop a method that is suitable for routine use in the petroleum refining industry, particularly in high sample volume facilities, where turnaround time is critical.
Ni, V, As, and Se at concentrations up to 1 mg/kg (ppm) for Ni and V, and 0.1 mg/kg for As and Se. Detection limits in the range of 0.01 to 0.1 g/kg (ppb) were obtained for all four elements.
Figure 1. Calibration curves of Ni, V, As, and Se.
Recovery of certified reference elements V and NiNIST 1634c has certified values for Ni and V, which are important elements in the assay of crude oils as they are usually present in the highest concentrations. Also, V compounds can cause refractory damage in furnaces [1]. As a performance check for the ability of the 7900 ICP-MS to provide consistent, accurate determination of these important elements, Ni and V were measured a total of 18 times in the diluted NIST 1634c standard, with measurements spread over 6 separate days.
The results in Table 2 show excellent recoveries within 10% of the certified values for both elements. It is also apparent that there was good agreement between the Ni results calculated independently using the different isotopes, 60Ni and 62Ni. This illustrates one of the key advantages of helium cell mode on the Agilent 7900, where a single set of cell conditions can address all common
ExperimentalAn Agilent 7900 ICP-MS with an Agilent ASX-520 autosampler was used. Operating conditions are given in Table 1.
Table 1. 7900 ICP-MS operating conditions.
Interference removalThe 7900 ICP-MS features a fourth-generation collision/reaction cell, the ORS4, which includes a standard He cell gas line for removal of common polyatomic interferences on most elements. The optional H2 cell gas line was used for this application, as H2 mode gives superior removal of the intense plasma- or matrix-based polyatomic overlaps on certain elements, notably Mg (m/z 24 – C2 interference), Si (m/z 28 – CO/N2), Ca (m/z 40 – Ar), Fe (m/z 56 – ArO) and Se (m/z 78 & 80 – Ar2).
Standard reference materialSRM NIST 1634c Trace Elements in Fuel Oil (Gaithersburg, MD, USA) was used to validate the method for the certified elements Ni and V and the reference elements As and Se. NIST 1634c was diluted approximately 1:60 in o-xylene prior to analysis.
SamplesA total of 18 petroleum crude oil samples were measured in the study [2]. Since Ca, Fe, Ni and V, are the most abundant metals in crude oil, and are the most commonly studied elements within the industry, they were the focus of this study.
Results and DiscussionCalibrationLinear calibrations were obtained, with calibration coefficients >0.998 for all elements. Figure 1 shows representative calibration curves for
polyatomic interferences, giving access to secondary or qualifier isotopes which can be used to confirm the result measured using the primary isotope.
Quantitative results18 crude oil samples were measured using the Agilent 7900 ICP-MS. Samples S1 to S9 are all light crude oils with low levels of metals, while the remaining samples cover a range of crude oil types. Quantitative results for Ca, Fe, Ni and V in all samples are shown in Table 3. The results show large variations in concentration for these critical elements between the different samples, with the greatest variation being observed for V, ranging from 0.07 to 301 mg/kg.
ConclusionsThe Agilent 7900 ICP-MS with ORS4
cell was used for the direct multi-elemental analysis of crude oil samples following dilution in o-xylene. The efficient, frequency-matching RF generator of the Agilent 7900 provides a robust and stable plasma, facilitating reliable, accurate analysis of organic samples over an extended analytical period.
Interferences on all analytes were reduced using He or H2 gas mode. Fast gas switching in the ORS4 allows the use of multiple gases in a single acquisition, without significant impact on acquisition time.
The high sensitivity of the Agilent 7900 ICP-MS, combined with its low background and simple spectra in organic matrices, ensured that significantly lower detection limits were achieved for a wider range of elements compared to traditional techniques, such as ICP-OES.
The 7900 ICP-MS delivered excellent accuracy for certified and reference elements in NIST 1634c Trace Elements in Fuel Oil, with measurements
taken on separate days over an extended period.
Table 3. Quantitative results for Ca, Fe, Ni and V in 18 crude oil samples measured using ICP-MS (all data mg/kg). Samples S1 to S9 are light crude oils with low metals content; the remaining samples cover a range of crude oil types.
Limit of Quantitation (LOQ) was calculated from 10 measurements of a blank solution (diluent containing a matrix modifier and internal standard).
References1. ASTM International, www.astm.org2. J. Nelson, E. McCurdy, Multi- Element Analysis of Petroleum Crude Oils using an Agilent 7900 ICP-MS, Agilent application note, 2017, 5991-7826EN.
The Role of ICP-MS in Investigating Neurodegenerative DiseasesThe Florey Institute of Neuroscience and Mental Health is one of the world's top 10 brain research centers. Located in Melbourne, Australia, the organization is committed to improving quality of life through brain research. The Neuro-proteomics and Metalloproteomics Clinical Research Laboratory group, which is led by Dr Blaine Roberts, uses proteomics to conduct clinical research on neurodegenerative diseases.
Dr Roberts’ lab is well equipped with a range of high-performance liquid chromatographs (HPLC) and mass spectrometers – including an Agilent 7700 ICP-MS and an 8800 ICP-QQQ. The range of instrumentation allows the group to do metal analysis and protein analysis in the same lab, enhancing the study of the role of metals in proteins.
The 8800 ICP-QQQ is usually used with a laser ablation (LA) system for elemental bioimaging, while the 7700 ICP-MS is coupled to HPLC. Proteins are fractionated under native conditions using a variety of chromatographic phases and the outflow is directly monitored for Cu, Fe, and Zn by ICP-MS. This approach has been used to study motor neuron disease, which can be caused by a mutation to an abundant Cu/Zn containing protein. By studying the metal status of that protein, Dr Roberts has been able to describe the role of the protein in the disease. Noting that the protein wasn’t getting its full complement of essential metals, the group developed a way to deliver and restore the full complement of Cu and Zn. With treatment, the test animals had more of the mutant protein, but they lived longer because the protein had its full complement of metals. The treatment is now in clinical trials, by a local biotech company.
The group is also using proteomics to support clinical research activities related to Alzheimer’s and Parkinson’s disease.
Find Out More
For Research Use Only. Not for use in diagnostic procedures.
Table 2. Recoveries of V, Ni, As and Se in NIST SRM 1634c.
aCalculated from 18 separate measurements taken on 6 separate daysbCalculated from 147 separate measurements taken over 12 months
5agilent.com/chem/icpms Agilent ICP-MS Journal October 2017 - Issue 70
Development of a fast methodThe focus of the method development was to reduce the analysis time per sample. We followed Jackson’s use of a small injection volume, short ion-exchange column, oxygen cell gas, and a high mobile phase linear velocity [5].
Figure 1 shows overlaid chromatograms for a representative calibration set of 0.5, 1.0, 5.0, and 20 μg/kg standards. All As species are clearly separated in less than two minutes. Simply by oxidizing As(III) to As(V) and analyzing all iAs in the form of As(V), the analysis time was reduced significantly compared to the current FDA regulatory method [8].
Results and DiscussionQuantitative resultsAll 10 wines were analyzed using the new HPLC-ICP-QQQ method. Table 5 lists the measured concentrations for DMA and iAs. All MMA values
Fast Analysis of Arsenic Species in Wines using LC-ICP-QQQCourtney Tanabe1-2, Susan E.Ebeler1-2, Jenny Nelson1-3 1Food Safety and Measurement Facility and 2Department of Viticulture and Enology, University of California, Davis, USA3Agilent Technologies, Inc., USA
IntroductionArsenic exists in multiple forms in foods and beverages and not all forms have the same toxicity. The inorganic forms of As (iAs), comprising As(III) (arsenite) and As(V) (arsenate), are the most toxic, and are categorized as class 1 carcinogens. In contrast, arsenobetaine (AB), the most abundant form of As in fresh seafood, is essentially non-toxic to humans. Due to the high variability in the toxicity of the different species of As, and the potential health threat of iAs, it is important to determine the levels of the individual species in foodstuffs – and not just the total As concentration.
The US Food and Drug Administration (FDA) has established an action limit for iAs in apple juice of 10 μg/kg (ppb) [1] but there are currently no regulations in the US controlling the As content of wine. Canada (Vintners Quality Alliance, VQA, Ontario) and Europe (International Organisation of Vine and Wine, OIV) have set maximum acceptable limits for total As in wine of 100 and 200 μg/L (ppb), respectively [2, 3].
HPLC is commonly used to separate the As species, which are then quantified by ICP-MS [4]. The methodology described here is based on a previous As speciation method developed by Jackson, who coupled HPLC to a triple quadrupole ICP-MS (ICP-QQQ) [5]. HPLC-ICP-QQQ was also used in this study. However, instead of analyzing the iAs species separately, As(III) was intentionally oxidized to As(V) with hydrogen peroxide before analysis [6, 7]. By converting As(III) and analyzing all inorganic species as As(V), this method was able to separate monomethylarsonic acid (MMA) and dimethylarsinic acid (DMA) from iAs (as As(V)) in less than 2 minutes. The analysis time is 10 times faster
than the current FDA methods used for the speciation of As [8].
ExperimentalSamplesFive different California wines were used for the validation (V) study. Each wine represented one of the five main styles of wine: red, white, rosé, sparkling, and dessert. Five additional California wines were analyzed for a commercial market basket (MB) study.
Sample preparationH2O2 was added to all samples at a 1:1 ratio to oxidize As(III) to As(V). Each sample was further diluted with de-ionized water to give a total dilution factor of 5 or 6. Each sample was then passed through a 0.45 μm syringe filter to remove any particulates.
InstrumentationAn Agilent 1260 HPLC fitted with a Hamilton PRP-X100 5 μm 50 x 2.1 mm column was coupled to an Agilent 8800 ICP-QQQ. The mobile phase was 40 mM ammonium carbonate ((NH4)2CO3, trace metal grade 99.999% from Sigma Aldrich) with 3% v/v methanol (Optima LC/MS grade, Fisher Chemical) adjusted to a pH of 9.0 with ammonium hydroxide (Optima Grade, Fisher Scientific). The ICP-QQQ was equipped with a standard sample introduction system comprising a quartz torch with 2.5 mm i.d. injector, a quartz spray chamber, glass concentric nebulizer, and nickel-tipped interface cones. Peak integration was carried out according to FDA EAM §4.10 and 4.11.15 [8]. The instrument operating conditions are summarized in Table 1.
Agilent ICP-MS Journal October 2017 - Issue 70
Figure 1. Overlay of the 0.5, 1.0, 5.0 and 20.0 μg/kg calibration standards. An AB internal standard (flow injection marker; fourth peak) was added post column via an external switching valve.
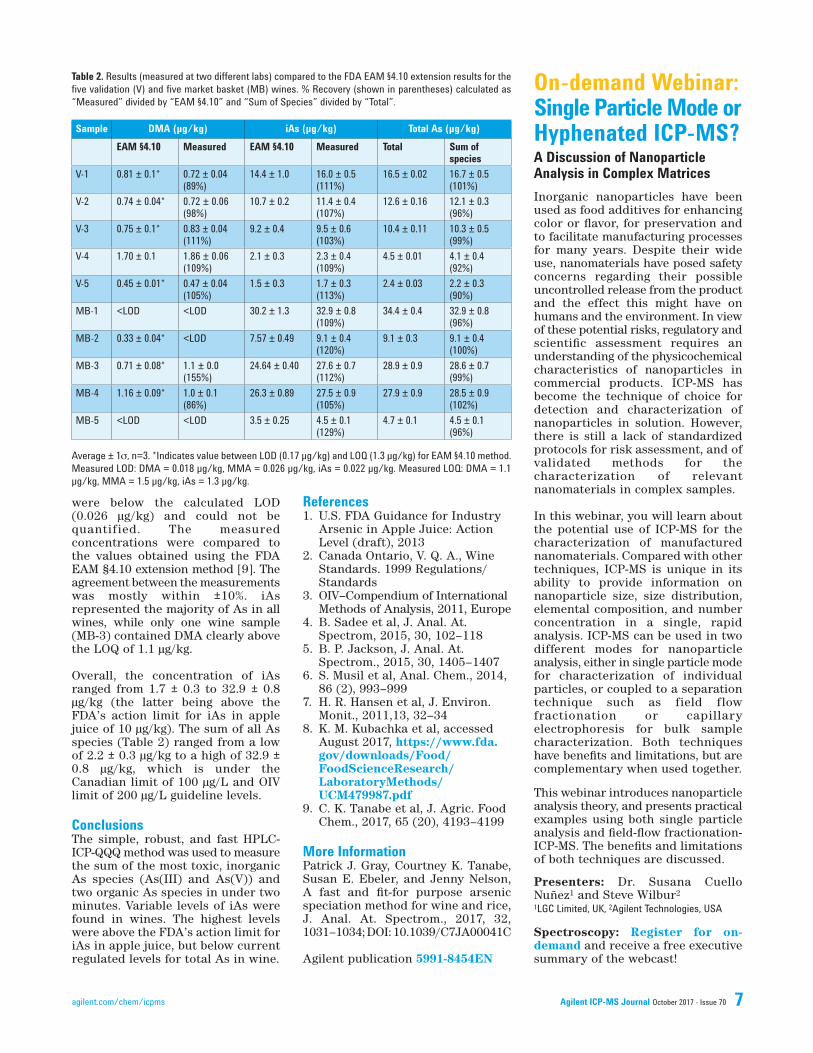
were below the calculated LOD (0.026 μg/kg) and could not be quantified. The measured concentrations were compared to the values obtained using the FDA EAM §4.10 extension method [9]. The agreement between the measurements was mostly within ±10%. iAs represented the majority of As in all wines, while only one wine sample (MB-3) contained DMA clearly above the LOQ of 1.1 μg/kg.
Overall, the concentration of iAs ranged from 1.7 ± 0.3 to 32.9 ± 0.8 μg/kg (the latter being above the FDA’s action limit for iAs in apple juice of 10 μg/kg). The sum of all As species (Table 2) ranged from a low of 2.2 ± 0.3 μg/kg to a high of 32.9 ± 0.8 μg/kg, which is under the Canadian limit of 100 μg/L and OIV limit of 200 μg/L guideline levels.
ConclusionsThe simple, robust, and fast HPLC-ICP-QQQ method was used to measure the sum of the most toxic, inorganic As species (As(III) and As(V)) and two organic As species in under two minutes. Variable levels of iAs were found in wines. The highest levels were above the FDA’s action limit for iAs in apple juice, but below current regulated levels for total As in wine.
References1. U.S. FDA Guidance for Industry Arsenic in Apple Juice: Action Level (draft), 20132. Canada Ontario, V. Q. A., Wine Standards. 1999 Regulations/ Standards3. OIV–Compendium of International Methods of Analysis, 2011, Europe4. B. Sadee et al, J. Anal. At. Spectrom, 2015, 30, 102–1185. B. P. Jackson, J. Anal. At. Spectrom., 2015, 30, 1405–14076. S. Musil et al, Anal. Chem., 2014, 86 (2), 993–9997. H. R. Hansen et al, J. Environ. Monit., 2011,13, 32–348. K. M. Kubachka et al, accessed August 2017, https://www.fda. gov/downloads/Food/ FoodScienceResearch/ LaboratoryMethods/ UCM479987.pdf9. C. K. Tanabe et al, J. Agric. Food Chem., 2017, 65 (20), 4193–4199
More InformationPatrick J. Gray, Courtney K. Tanabe, Susan E. Ebeler, and Jenny Nelson, A fast and fit-for purpose arsenic speciation method for wine and rice, J. Anal. At. Spectrom., 2017, 32, 1031–1034; DOI: 10.1039/C7JA00041C
Agilent publication 5991-8454EN
Table 2. Results (measured at two different labs) compared to the FDA EAM §4.10 extension results for the five validation (V) and five market basket (MB) wines. % Recovery (shown in parentheses) calculated as “Measured” divided by “EAM §4.10” and “Sum of Species” divided by “Total”.
Average ± 1 , n=3. *Indicates value between LOD (0.17 μg/kg) and LOQ (1.3 μg/kg) for EAM §4.10 method. Measured LOD: DMA = 0.018 μg/kg, MMA = 0.026 μg/kg, iAs = 0.022 μg/kg. Measured LOQ: DMA = 1.1 μg/kg, MMA = 1.5 μg/kg, iAs = 1.3 μg/kg.
Agilent ICP-MS Journal October 2017 - Issue 70
On-demand Webinar:Single Particle Mode or Hyphenated ICP-MS?A Discussion of Nanoparticle Analysis in Complex Matrices
Inorganic nanoparticles have been used as food additives for enhancing color or flavor, for preservation and to facilitate manufacturing processes for many years. Despite their wide use, nanomaterials have posed safety concerns regarding their possible uncontrolled release from the product and the effect this might have on humans and the environment. In view of these potential risks, regulatory and scientific assessment requires an understanding of the physicochemical characteristics of nanoparticles in commercial products. ICP-MS has become the technique of choice for detection and characterization of nanoparticles in solution. However, there is still a lack of standardized protocols for risk assessment, and of validated methods for the characterization of relevant nanomaterials in complex samples.
In this webinar, you will learn about the potential use of ICP-MS for the characterization of manufactured nanomaterials. Compared with other techniques, ICP-MS is unique in its ability to provide information on nanoparticle size, size distribution, elemental composition, and number concentration in a single, rapid analysis. ICP-MS can be used in two different modes for nanoparticle analysis, either in single particle mode for characterization of individual particles, or coupled to a separation technique such as field flow fractionation or capillary electrophoresis for bulk sample characterization. Both techniques have benefits and limitations, but are complementary when used together.
This webinar introduces nanoparticle analysis theory, and presents practical examples using both single particle analysis and field-flow fractionation-ICP-MS. The benefits and limitations of both techniques are discussed.
Presenters: Dr. Susana Cuello Nuñez1 and Steve Wilbur2
1LGC Limited, UK, 2Agilent Technologies, USA
Spectroscopy: Register for on-demand and receive a free executive summary of the webcast!
Sample DMA (µg/kg) iAs (µg/kg) Total As (µg/kg)
EAM §4.10 Measured EAM §4.10 Measured Total Sum of species
Celebrate Over 30 Years of Agilent ICP-MS at the APWC 2017 and WCPS 2018Join Agilent at the 7th Asia-Pacific Winter Conference on Plasma Spectrochemistry (APWC) in Matsue, Japan, November 12–17, 2017. Customers from all parts of the world are invited to visit the Agilent booth and to join a midweek lunchtime event.
Meet the Agilent team at the Winter Conference on Plasma Spectrochemistry (WCPS) in Amelia Island, Florida, USA, January 8–13, 2018. The 20th WCPS marks a special anniversary for Agilent’s role in ICP-MS. Join us to celebrate 30+ years of technological innovation and development in the field of ICP-MS, with scientific seminars, social events and other surprises! Visit the Agilent booth to meet our team of atomic spectroscopy experts and complete your Agilent Tour. Other events include:•Sunday:AgilentShortCourse•Monday:AgilentWorkshop•Tuesday:AgilentWorkshop•Wednesday:AgilentSocialEvent•Thursday:AgilentWorkshop
Conferences. Meetings. Seminars. 7th Asia-Pacific Winter Conference on Plasma Spectrochemistry, November 12–17, 2017, Matsue, Japan, http://www.apwc2017.org/
2018 Winter Conference on Plasma Spectrochemistry, January 8–13, 2018, Amelia Island, Florida, USA, http://icpinformation.org/Winter_Conference.html
Agilent ICP-MS PublicationsTo view and download the latest ICP-MS literature, go to www.agilent.com/chem/icpms•Application note: Accurate Determination of TiO2 Nanoparticles in Complex Matrices using the Agilent 8900 ICP-QQQ, 5991-8358EN•Applicationnote:Rapid Analysis of Radium-226 in Water Samples by ICP-QQQ, 5991-8324EN •Applicationnote:Fast Analysis of Arsenic Species in Wines using LC-ICP-QQQ, 5991-8454EN•Applicationnote:Validating performance of an Agilent 7800 ICP MS for USP <232>/<233> and ICH Q3D/Q2(R1): Elemental Impurity Analysis in Pharmaceuticals, 5991-8335EN
Updated semiconductor-related application notes:•Trace Elemental Analysis of Trichlorosilane by Agilent 7700s/7900 ICP-MS, 5990-8175EN•Direct Measurement of Metallic Impurities in 20% Ammonium Hydroxide by Agilent 7700s/7900 ICP-MS, 5990-7914EN•Direct Analysis of Trace Metallic Impurities in High Purity Hydrochloric Acid by Agilent 7700s/7900 ICP-MS, 5990-7354EN
On-Demand Webinars Arsenic Speciation Comes of Age:Validating Robust and High-Throughput Methods for Various Food Matrices
Update on the most recent developments in arsenic speciation methodology, with a focus on robust, validated methods for accurate and reliable determination of As species in food safety applications.
Presenters: Susan Ebeler1, Courtney Tanabe1, and Jenny Nelson1,2
1University of California, Davis, USA, 2Agilent Technologies, USA
Spectroscopy Solutions: Register for on-demand
New Elemental Impurities Tests for Pharmaceutical Products. Are You Ready?
Manufacturers of pharmaceutical drug products must comply with USP <232>/<233> and ICH Q3D by January 2018. Learn how to optimize your workflow operation from sample decomposition to data analysis and reporting.