23

18 California Agricultural Resource Directory 2007
Agricultural Statistical Review
0
0.5
1
1.5
2
2.5
3
3.5
20061997 1998 1999 2000 2001 2002 2003 2004 2005
3.34
3.032.88
2.43
2.692.83
2.67
2.33
2.772.56
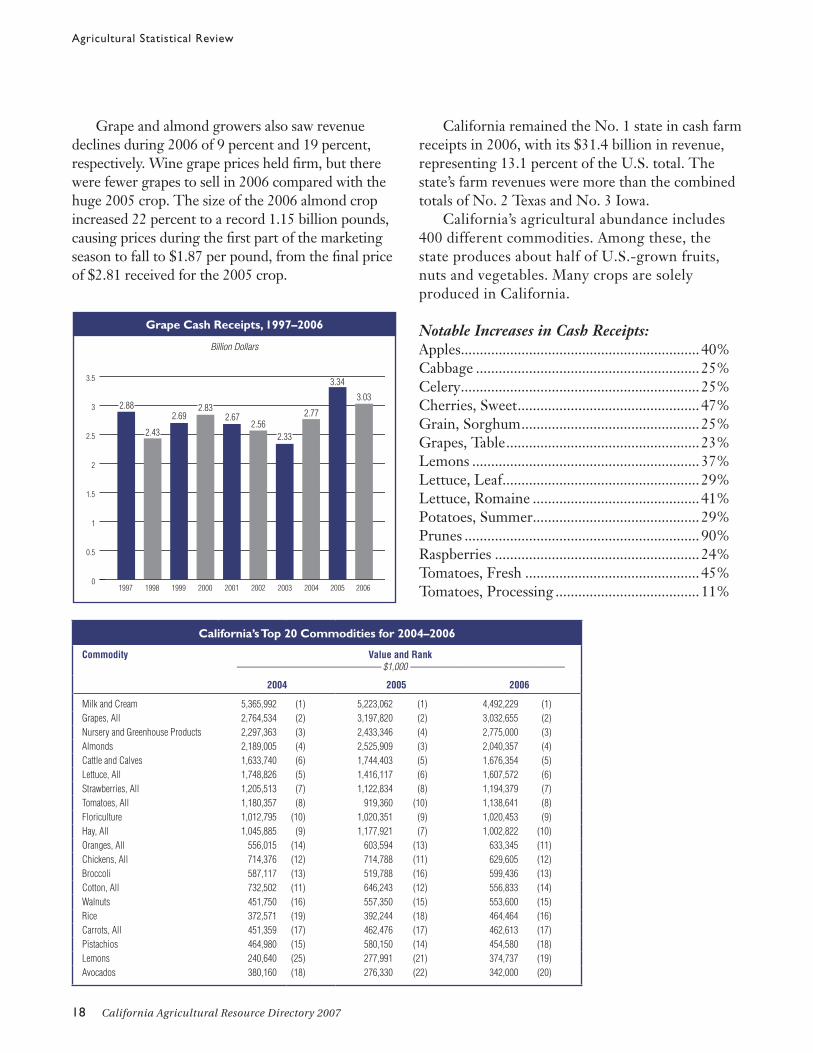
Grape Cash Receipts, 1997–2006
Billion Dollars
California’s Top 20 Commodities for 2004–2006
Commodity Value and Rank––––––––––––––––––––––––––––– $1,000 –––––––––––––––––––––––––––––––
2004 2005 2006
Milk and Cream 5,365,992 (1) 5,223,062 (1) 4,492,229 (1)Grapes, All 2,764,534 (2) 3,197,820 (2) 3,032,655 (2)Nursery and Greenhouse Products 2,297,363 (3) 2,433,346 (4) 2,775,000 (3)Almonds 2,189,005 (4) 2,525,909 (3) 2,040,357 (4)Cattle and Calves 1,633,740 (6) 1,744,403 (5) 1,676,354 (5)Lettuce, All 1,748,826 (5) 1,416,117 (6) 1,607,572 (6)Strawberries, All 1,205,513 (7) 1,122,834 (8) 1,194,379 (7)Tomatoes, All 1,180,357 (8) 919,360 (10) 1,138,641 (8)Floriculture 1,012,795 (10) 1,020,351 (9) 1,020,453 (9)Hay, All 1,045,885 (9) 1,177,921 (7) 1,002,822 (10)Oranges, All 556,015 (14) 603,594 (13) 633,345 (11)Chickens, All 714,376 (12) 714,788 (11) 629,605 (12)Broccoli 587,117 (13) 519,788 (16) 599,436 (13)Cotton, All 732,502 (11) 646,243 (12) 556,833 (14)Walnuts 451,750 (16) 557,350 (15) 553,600 (15)Rice 372,571 (19) 392,244 (18) 464,464 (16)Carrots, All 451,359 (17) 462,476 (17) 462,613 (17)Pistachios 464,980 (15) 580,150 (14) 454,580 (18)Lemons 240,640 (25) 277,991 (21) 374,737 (19)Avocados 380,160 (18) 276,330 (22) 342,000 (20)
Grape and almond growers also saw revenue declines during 2006 of 9 percent and 19 percent, respectively. Wine grape prices held firm, but there were fewer grapes to sell in 2006 compared with the huge 2005 crop. The size of the 2006 almond crop increased 22 percent to a record 1.15 billion pounds, causing prices during the first part of the marketing season to fall to $1.87 per pound, from the final price of $2.81 received for the 2005 crop.
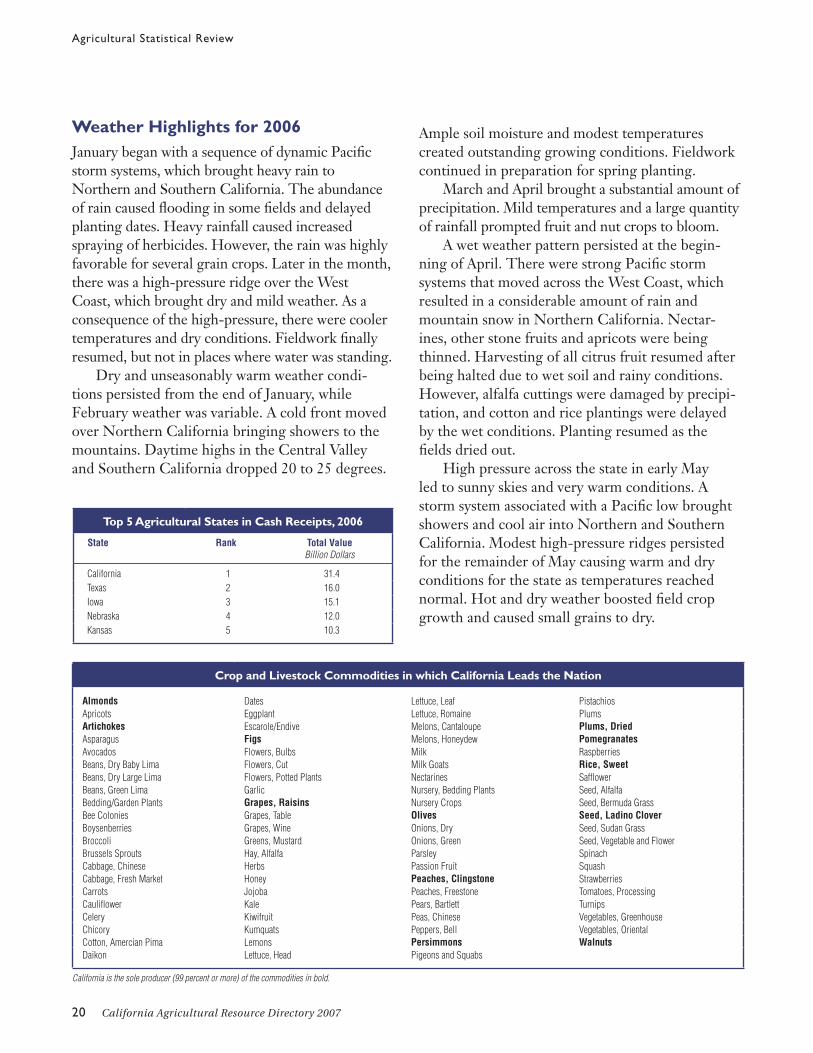
California remained the No. 1 state in cash farm receipts in 2006, with its $31.4 billion in revenue, representing 13.1 percent of the U.S. total. The state’s farm revenues were more than the combined totals of No. 2 Texas and No. 3 Iowa. California’s agricultural abundance includes 400 different commodities. Among these, the state produces about half of U.S.-grown fruits, nuts and vegetables. Many crops are solely produced in California.
Notable Increases in Cash Receipts:Apples............................................................... 40%Cabbage ........................................................... 25%Celery ............................................................... 25%Cherries, Sweet ................................................ 47%Grain, Sorghum ............................................... 25%Grapes, Table ................................................... 23%Lemons ............................................................ 37%Lettuce, Leaf .................................................... 29%Lettuce, Romaine ............................................ 41%Potatoes, Summer............................................ 29%Prunes .............................................................. 90%Raspberries ...................................................... 24%Tomatoes, Fresh .............................................. 45%Tomatoes, Processing ...................................... 11%

California Agricultural Resource Directory 2007 19
Agricultural Statistical Review
California’s Top 10 Agricultural Counties
County Total Value and Rank–––––––––––––– $1,000 ––––––––––––––
Leading Commodities
2005 2006
Fresno 4,640,166 (1) 4,843,392 (1) Grapes, Almonds, Tomatoes, Poultry, Cattle and CalvesTulare 4,360,854 (2) 3,870,843 (2) Milk, All Oranges, Cattle and Calves, Grapes, Alfalfa Hay and SilageMonterey 3,346,955 (4) 3,489,923 (3) Leaf Lettuce, Head Lettuce, Strawberries, Nursery, BroccoliKern 3,550,713 (3) 3,476,801 (4) Almonds and Byproducts, All Grapes, Milk, All Carrots, All CitrusMerced 2,388,058 (5) 2,284,457 (5) Milk, All Chickens, Almonds, Cattle and Calves, All TomatoesStanislaus 1,977,596 (6) 2,148,152 (6) Milk, Almonds, Cattle and Calves, All Chickens, WalnutsSan Joaquin 1,735,528 (7) 1,684,871 (7) Milk, All Grapes, All Tomatoes, Almonds, WalnutsVentura 1,253,048 (11) 1,505,588 (8) Fresh Market Strawberries, Lemons, Celery, Woody Ornamentals, TomatoesSan Diego 1,531,307 (8) 1,461,476 (9) Flower and Foliage Plants, Trees and Shrubs, Bedding Plants, Avocados, TomatoesImperial 1,286,066 (10) 1,307,615 (10) Cattle, Alfalfa Hay, Carrots, Leaf Lettuce, Head Lettuce
Notable Decreases in Cash Receipts:Apricots ............................................................ 32%Cottonseed ....................................................... 37%Oats .................................................................. 58%Olives ............................................................... 77%Onions, Spring................................................. 35%Oranges, Navel ................................................ 36%Oranges, Valencia ............................................ 38%
California Farm FactsThe number of farms operated in California during 2006 was 76,000, less than 4 percent of the national total. The state was home to 10 percent of U.S. farms with sales of $500,000 or more during the year. The average California farm or ranch opera-tion produced $413,000 in commodity sales during the year, more than 3 times higher than the U.S. average of $114,000 per farm. In 2006, California’s land devoted to farming and ranching totaled 26.1 million acres, down less than 0.5 percent from the previous year. The average farm size was 346 acres, compared with the U.S. average of 446 acres.
California’s Top Commodities California’s top 20 crop and livestock commodities accounted for more than $25 billion in value for 2006. Ten commodities exceeded $1 billion in value. Avocados joined the top 20 list for 2006. Milk remained the No. 1 commodity in 2006, followed by grapes, and nursery and greenhouse products.
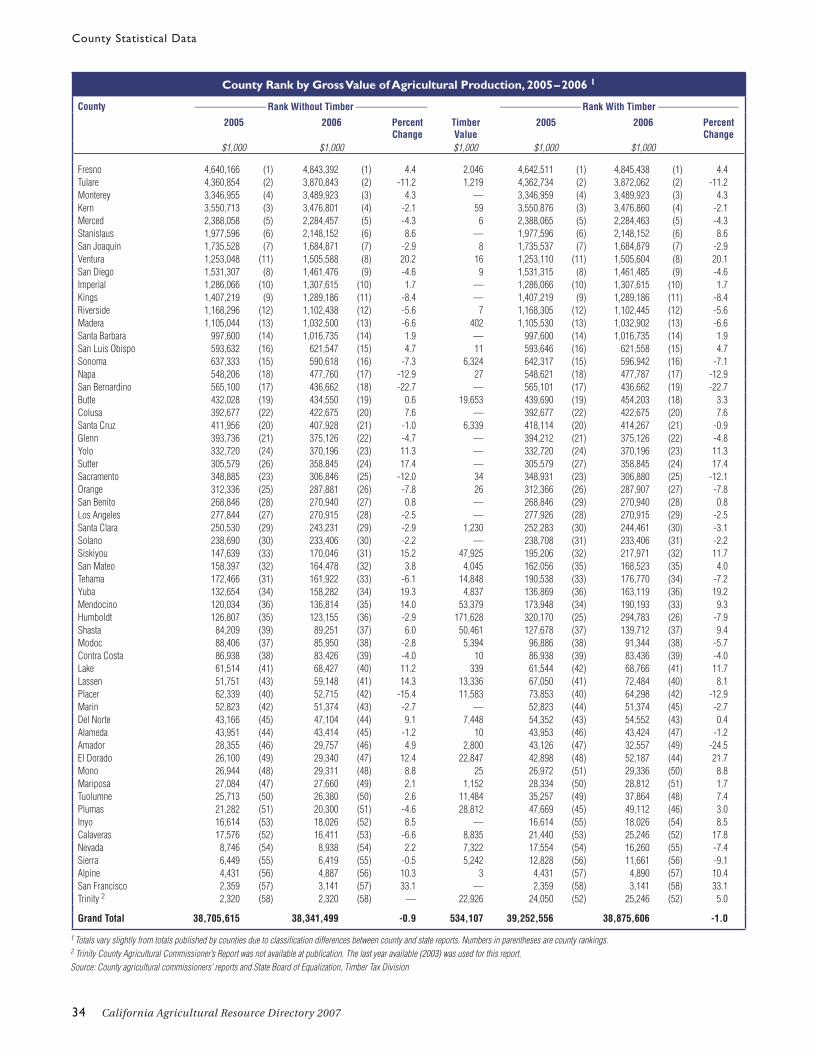
Leading CountiesCalifornia has some of the most agriculturally productive counties in the nation. According to the 2002 Census of Agriculture’s ranking of market value of agricultural products sold, nine of the nation’s top 10, and 12 of the top 20, producing counties are in California. California’s county agricultural commissioner reports showed a slight decrease of 0.9 percent in the value of their agricultural production for 2006. Fourteen counties reported a value of production in excess of $1.01 billion. Fresno continued as the leading county with an agricultural production value of $4.84 billion, an increase of 4.4 percent from the 2005 value. Tulare County was second in value of production with $3.87 billion, 11.2 percent below 2005. Monterey had an increase of 4.3 percent in production with $3.49 billion, moving the county to third in value. Kern’s decrease of 2.1 percent to $3.48 billion in agricultural production dropped the county to fourth in value.
20 California Agricultural Resource Directory 2007
Agricultural Statistical Review
Top 5 Agricultural States in Cash Receipts, 2006
State Rank Total ValueBillion Dollars
California 1 31.4 Texas 2 16.0 Iowa 3 15.1 Nebraska 4 12.0 Kansas 5 10.3
Crop and Livestock Commodities in which California Leads the Nation
Almonds Dates Lettuce, Leaf PistachiosApricots Eggplant Lettuce, Romaine PlumsArtichokes Escarole/Endive Melons, Cantaloupe Plums, DriedAsparagus Figs Melons, Honeydew PomegranatesAvocados Flowers, Bulbs Milk RaspberriesBeans, Dry Baby Lima Flowers, Cut Milk Goats Rice, SweetBeans, Dry Large Lima Flowers, Potted Plants Nectarines SafflowerBeans, Green Lima Garlic Nursery, Bedding Plants Seed, AlfalfaBedding/Garden Plants Grapes, Raisins Nursery Crops Seed, Bermuda GrassBee Colonies Grapes, Table Olives Seed, Ladino CloverBoysenberries Grapes, Wine Onions, Dry Seed, Sudan GrassBroccoli Greens, Mustard Onions, Green Seed, Vegetable and FlowerBrussels Sprouts Hay, Alfalfa Parsley SpinachCabbage, Chinese Herbs Passion Fruit SquashCabbage, Fresh Market Honey Peaches, Clingstone StrawberriesCarrots Jojoba Peaches, Freestone Tomatoes, ProcessingCauliflower Kale Pears, Bartlett TurnipsCelery Kiwifruit Peas, Chinese Vegetables, GreenhouseChicory Kumquats Peppers, Bell Vegetables, OrientalCotton, Amercian Pima Lemons Persimmons WalnutsDaikon Lettuce, Head Pigeons and Squabs
California is the sole producer (99 percent or more) of the commodities in bold.
Weather Highlights for 2006January began with a sequence of dynamic Pacific storm systems, which brought heavy rain to Northern and Southern California. The abundance of rain caused flooding in some fields and delayed planting dates. Heavy rainfall caused increased spraying of herbicides. However, the rain was highly favorable for several grain crops. Later in the month, there was a high-pressure ridge over the West Coast, which brought dry and mild weather. As a consequence of the high-pressure, there were cooler temperatures and dry conditions. Fieldwork finally resumed, but not in places where water was standing. Dry and unseasonably warm weather condi-tions persisted from the end of January, while February weather was variable. A cold front moved over Northern California bringing showers to the mountains. Daytime highs in the Central Valley and Southern California dropped 20 to 25 degrees.
Ample soil moisture and modest temperatures created outstanding growing conditions. Fieldwork continued in preparation for spring planting. March and April brought a substantial amount of precipitation. Mild temperatures and a large quantity of rainfall prompted fruit and nut crops to bloom. A wet weather pattern persisted at the begin-ning of April. There were strong Pacific storm systems that moved across the West Coast, which resulted in a considerable amount of rain and mountain snow in Northern California. Nectar-ines, other stone fruits and apricots were being thinned. Harvesting of all citrus fruit resumed after being halted due to wet soil and rainy conditions. However, alfalfa cuttings were damaged by precipi-tation, and cotton and rice plantings were delayed by the wet conditions. Planting resumed as the fields dried out. High pressure across the state in early May led to sunny skies and very warm conditions. A storm system associated with a Pacific low brought showers and cool air into Northern and Southern California. Modest high-pressure ridges persisted for the remainder of May causing warm and dry conditions for the state as temperatures reached normal. Hot and dry weather boosted field crop growth and caused small grains to dry.

California Agricultural Resource Directory 2007 21
Agricultural Statistical Review
Temperatures in June were unstable with influ-ence from both high- and low-pressure systems. Patterns of low pressure brought cooler tempera-tures and minimal precipitation. The need for irrigation increased as a high-pressure system brought hot weather. Hay drying conditions were improved with warm temperatures. July began with cooler than normal tempera-tures due to a low-pressure trough. Later, heat waves swept across California. Record-setting temperatures damaged crops and caused the deaths of substantial numbers of livestock and poultry. Subtropical moisture circulated around the high-pressure system and increased humidity, with unusually warm overnight temperatures. High-pressure systems continued through the first couple weeks of August. Moisture began circulating due to a low-pressure system that caused thunderstorm activity. A low-pressure system generated heavy showers and temperatures became cooler than normal. Livestock were moved to irrigated pastures and dry foothill pastures. Some livestock received protein and other supple-ments as hot weather decreased forage quantities. Cotton, corn and beans progressed well with the moderate temperatures. September was mainly dry. A fall-like pattern set up over California with an upper-level high- pressure ridge. Very dry air and dry grasses signaled high fire dangers across much of the state that led to red flag warnings in some areas.
Weather in October displayed typical dry and mild fall patterns. An upper-level, high-pressure system was centered over the four-corner region that caused some light rain in the northern and central coast. For interior portions of Southern California, including the Imperial Valley, temperatures were below normal. A series of cold fronts passed through the state, but the only effect was cooler temperatures with no significant precipitation. The first active storm system began in November and shifted southward from the Pacific Northwest, bringing the first significant snow of the season. There was steady precipitation in the northern Central Valley and also in the mountains of Northern California. A series of weak Pacific frontal systems passed through the Pacific North-west and brought occasional showers and cooler temperatures to California. December began with a cold front that caused wet weather across California. A series of Pacific weather systems brought showers and cool temper-atures with widespread freezing across the interior valleys of Northern California and the Central Valley. At the end of December, another Pacific storm system approached Northern California spreading showers and cooler temperatures across the northern coast, while Southern California remained dry and warm. Ranges and pastures were in better condition as result of the rain.
Phot
o by
Ed
Will
iams /
Sac
ram
ento
Cou
nty

22 California Agricultural Resource Directory 2007
Agricultural Statistical Review
California’s Top 10 Agricultural Export Markets, 2006
Rank Country Export Value
Leading Exports
Million Dollars
1 European Union-25 2,071 Almonds, Wine, Pistachios2 Canada 1,879 Lettuce, Strawberries, Processed Tomatoes3 Japan 964 Rice, Almonds, Hay 4 China/Hong Kong 611 Cotton, Almonds, Table Grapes5 Mexico 562 Dairy and Products, Table Grapes, Processed
Tomatoes6 South Korea 312 Fresh and Juice Oranges, Grapefruit, Walnuts7 Taiwan 241 Cotton, Beef and Products, Peaches and
Nectarines8 India 203 Almonds, Cotton, Table Grapes9 Australia 99 Walnuts, Table Grapes, Fresh and Juice Oranges
10 United Arab Emirates
94 Almonds, Table Grapes, Walnuts
1 See page 126 for complete table and footnotes.
Global MarketplaceCalifornia’s agricultural exports reached another new record with nearly $9.8 billion in 2006. This represents a 5 percent increase from 2005. In 2006, 24 percent of California’s agricultural production was shipped to overseas markets. California exports agricultural products to more than 150 countries. The top 10 export desti-nations account for 85 percent of the 2006 export value of the 48 commodities for which there is accurate export destination data. The top three destinations — European Union (EU-25), Canada and Japan — account for nearly 60 percent of the 48-commodity total. The top 55 export commodities account for $8.3 billion or 85 percent of total exports while the remaining 15 percent were associated with other products and mixtures. Wine export values increased 28 percent from 2005 to an all-time high of nearly $736 million. The export price of wine increased 21 percent from 2005 and accounted for the majority of the increase in export value. From these impressive export gains, it is easy to see that California agriculture is enjoyed around the world.
California’s Top 20 Agricultural Exports, 2005 – 2006 1
Commodity Rank 2005Export Value
2006Export Value
PercentChange
$1,000 $1,000
Almonds 1 1,840,912 1,898,839 3Wine 2 575,343 735,835 28Dairy and Products 3 563,362 603,799 7Cotton 4 699,695 553,825 -21Table Grapes 5 540,156 499,363 -8Walnuts 6 318,451 365,453 15Oranges, Fresh and Juice 7 365,472 359,230 -2Pistachios 8 299,496 287,072 -4Tomatoes, Processed 9 263,499 286,276 9Strawberries 10 233,532 273,441 17Rice 11 319,796 268,872 -16Lettuce 12 236,995 243,687 3Raisins 13 209,130 206,110 -1Beef and Products 14 99,681 152,179 53Dried Plums 15 107,735 132,918 23Peaches and Nectarines 16 126,999 125,191 -1Hay 17 112,232 117,072 4Broccoli 18 104,156 111,670 7Lemons 19 86,972 101,830 17Grapefruit 20 50,268 88,522 76

California Agricultural Resource Directory 2007 23
Agricultural Statistical Review
Cash Income by Commodity Groups, 2004 – 2006 1
Source of Income –––––––––––––––– $1,000 ––––––––––––––––2004 2005 2006
Source of Income –––––––––––––––– $1,000 ––––––––––––––––2004 2005 2006
1 Totals may not add due to rounding.2 Includes value of home consumption, value of inventory adjustments, machine hire and custom work, forest products sold, rental value of farm dwelling, government payments, and other miscellaneous farm income.Source: USDA Economic Research Service
FIELD CROPSAlfalfa Seed 18,673 21,910 20,600Barley 11,230 8,058 9,310Beans, Dry 40,250 50,535 57,666Corn for Grain 53,015 41,568 39,982Cotton Lint 477,780 696,907 557,827Cottonseed 86,614 73,109 46,230Grain, Sorghum 2,450 2,413 3,006Hay, All 608,808 703,783 619,857Oats 2,270 520 221Oil Crops 23,142 18,673 20,892Potatoes (Excl. Sweet) 228,969 189,771 186,572Potatoes, Sweet 80,500 84,376 76,641Rice 334,411 367,060 371,665Sugar Beets 78,005 68,385 68,385Wheat 147,405 82,610 88,861Other Seed Crops 146,113 117,790 138,210Other Field Crops 430,491 531,451 473,195TOTAL 2,770,126 3,058,919 2,779,120Percent of Gross Cash Income 8.1 8.7 8.2
FRUIT AND NUT CROPSAlmonds 2,189,005 2,525,909 2,040,357Apples 73,084 54,699 76,383Apricots 28,575 33,930 23,128Avocados 374,761 279,745 334,325Berries, Bushberries 209,007 257,984 300,983Berries, Strawberries 1,040,900 1,122,834 1,194,379Cherries 123,156 84,751 124,391Dates 23,086 24,101 27,949Figs 20,214 25,919 24,881Grapefruit 53,706 101,087 86,811Grapes 2,765,776 3,343,324 3,032,178Kiwifruit 19,977 22,461 23,148Lemons 277,019 295,913 406,874Nectarines 86,184 120,456 112,706Olives 60,643 80,097 18,119Oranges, Navel and Miscellaneous 416,003 632,446 407,952Oranges, Valencia 137,242 218,232 135,454Peaches, Clingstone 141,494 122,939 104,846Peaches, Freestone 109,760 157,048 165,562Pears 80,432 79,790 68,269Pecans 7,735 7,110 5,848Pistachios 464,980 580,150 454,580Plums 74,347 92,463 110,217Plums, Dried 121,042 81,927 155,806Tangerines 43,358 44,818 50,379Walnuts 451,750 557,350 553,600Other Fruits and Nuts 177,293 213,434 203,600TOTAL 9,570,529 11,160,916 10,242,724Percent of Gross Cash Income 28.1 31.9 30.0
CHRISTMAS TREESTOTAL 8,089 9,026 9,000Percent of Gross Cash Income — — —
NURSERY, GREENHOUSE, AND FLORICUL TURETOTAL 3,576,428 3,688,288 3,795,453Percent of Gross Cash Income 10.5 10.5 11.1
VEGETABLE CROPSArtichokes 37,208 39,453 31,918Asparagus 106,267 80,850 70,800Beans, Snap, Fresh 47,975 47,945 42,931Broccoli, All 587,117 519,788 599,436Cabbage 78,064 70,291 88,044Carrots, All 451,359 462,476 462,613Cauliflower 166,009 178,804 211,253Celery 273,576 248,816 312,197Corn, Sweet 94,497 103,918 87,344Cucumbers, Fresh 25,549 23,637 27,683Garlic 129,658 194,388 146,775Lettuce 1,334,204 1,416,117 1,607,572Melons, Cantaloupe 182,160 167,688 178,605Melons, Honeydew 69,703 66,534 57,148Melons, Watermelon 70,119 76,146 72,399Mushrooms, Agaricus 172,713 159,587 143,786Onions 172,998 194,538 207,221Peppers, Chili 31,729 40,184 38,993Peppers, Green 217,701 239,715 286,203Pumpkins 10,390 14,355 13,110Spinach, All 103,026 129,559 144,995Squash 45,973 38,756 37,929Tomatoes, Fresh 510,384 347,200 505,120Tomatoes, Processing 669,973 572,160 633,521Other Vegetable Crops 857,213 990,072 953,834TOTAL 6,445,565 6,422,976 6,961,430Percent of Gross Cash Income 18.9 18.3 20.4
LIVESTOCK, POULTRY, AND PRODUCTSAquaculture 12,612 13,385 12,891Cattle and Calves 1,633,740 1,744,403 1,676,354Chickens, All 714,602 714,788 629,605Eggs 287,392 181,655 212,889Hogs 39,855 35,736 34,930Honey 17,726 25,200 19,365Milk and Cream 5,365,992 5,223,062 4,492,229Sheep and Lambs 57,612 56,135 46,788Turkeys 169,937 170,216 196,963Wool and Mohair 2,822 2,519 2,600Other Livestock and Poultry 256,151 258,531 290,365TOTAL 8,558,441 8,425,628 7,614,979Percent of Gross Cash Income 25.1 24.1 22.3
TOTAL CASH INCOME FROM MARKETINGSTOTAL 30,929,178 32,765,753 31,402,706
FARM RELATED INCOME 2
TOTAL 3,151,054 2,258,117 2,736,390Percent of Gross Cash Income 9.3 6.5 8.0
GROSS CASH INCOME FROM FARMINGTOTAL 34,080,232 35,023,870 34,139,096

24 California Agricultural Resource Directory 2007
Agricultural Statistical Review
Farm Income Indicators, 2002 – 2006 1
Item–––––––––––––––––––––––––––––––––––– $1,000 ––––––––––––––––––––––––––––––2002 2003 2004 2005 2006
Value of Crop Production 20,473,123 21,121,832 22,823,923 24,083,227 23,726,912 Food grains 356,918 420,190 481,815 449,669 460,526 Feed crops 634,278 607,824 677,774 756,342 672,377 Cotton 598,175 914,064 564,394 770,016 604,056 Oil crops 18,906 27,799 23,142 18,673 20,892 Fruits and tree nuts 7,784,410 8,021,826 9,570,528 11,160,916 10,242,724 Vegetables 6,786,347 7,116,305 6,613,246 6,579,807 7,130,680 All other crops 4,175,363 4,283,924 4,439,837 4,604,702 4,656,472 Home consumption 9,549 6,843 5,566 6,008 19,027 Value of inventory adjustment2 109,177 (276,943) 447,621 (262,907) (79,842)
Value of Livestock Production 6,321,169 6,942,670 8,768,050 8,492,364 7,695,749 Meat animals 1,302,336 1,652,372 1,731,207 1,836,272 1,758,072 Dairy products 3,832,501 4,027,837 5,365,992 5,223,062 4,492,229 Poultry and eggs 870,483 1,025,816 1,233,697 1,139,889 1,109,517 Miscellaneous livestock 264,894 293,286 227,545 226,405 255,161 Home consumption 2,192 2,146 3,441 8,388 25,453 Value of inventory adjustment2 48,763 (58,787) 206,168 58,348 55,317
Revenues from Services and Forestry 1,697,371 1,822,292 2,488,260 2,448,279 2,716,436 Machine hire and custom work 314,588 338,896 584,518 465,008 631,292 Forest products sold 8,163 7,851 7,438 8,012 7,900 Other farm income 442,620 505,809 597,020 679,327 730,054 Gross imputed rental value of farm dwellings 932,000 969,736 1,299,284 1,295,932 1,347,190
Value of Agricultural Sector Production 28,491,663 29,886,794 34,080,232 35,023,870 34,139,096
less: Purchased Inputs 14,658,318 14,100,732 14,539,455 16,155,431 18,538,455
Farm Origin 3,971,304 3,730,416 4,346,643 4,558,473 5,207,683 Feed purchased 2,577,445 2,240,001 2,780,001 2,860,004 3,300,001 Livestock and poultry purchased 533,549 620,417 716,640 708,469 697,683 Seed purchased 860,310 869,998 850,002 990,000 1,209,999
Manufactured Inputs 3,028,028 2,910,572 2,973,002 3,656,076 4,044,920 Fertilizers and lime 760,680 800,003 830,000 1,030,000 1,169,999 Pesticides 944,037 980,003 950,000 1,159,997 1,229,999 Petroleum fuel and oils 544,295 541,215 639,511 923,161 997,908 Electricity 779,016 589,351 553,491 542,918 647,014
Other Purchased Inputs 7,658,986 7,459,744 7,219,810 7,940,882 9,285,852 Repair and maintenance of capital items 754,005 858,033 1,032,378 966,919 1,087,432 Machine hire and custom work 923,778 845,441 692,464 700,321 745,692 Marketing, storage, and transportation expenses 1,889,496 1,760,411 1,431,971 2,190,876 2,400,692 Contract labor 1,425,365 1,630,664 1,495,038 1,564,551 1,579,380 Miscellaneous expenses 2,666,342 2,365,195 2,567,959 2,518,215 3,472,656
plus Net Government Transactions 76,114 115,369 (176,417) (32,183) (296,470)
+ Direct Government payments 645,973 735,305 478,375 703,629 530,193 - Motor vehicle registration and licensing fees 29,296 59,938 64,791 55,760 66,662 - Property taxes 540,563 559,998 590,001 680,052 760,001
Gross Value Added 13,909,458 15,901,431 19,364,361 18,836,256 15,304,172
less: Capital Consumption 1,077,012 1,103,249 1,217,284 1,327,184 1,378,273
Net Value Added 12,832,447 14,798,182 18,147,077 17,509,072 13,925,899
less: Payments to Stakeholders 6,526,077 6,737,931 6,865,636 7,397,405 8,020,244 Employee compensation (total hired labor) 4,692,655 4,719,336 5,104,960 5,562,741 6,022,068 Net rent received by non-operator landlords 544,452 842,082 595,117 518,284 509,090 Real estate and non-real estate interest 1,288,970 1,176,513 1,165,559 1,316,380 1,489,086
Net Farm Income 6,306,370 8,060,251 11,281,441 10,111,667 5,905,655
1 Value of agricultural sector production is the gross value of commodities and services produced within a year. Net value-added is the sector’s contribution to the national economy and is the sum of the income from production earned by all factors-of-production, regardless of ownership. Net farm income is the farm operators’ share of income from the sector’s production activities. The concept presented is consistent with that employed by the Organization for Economic Cooperation and Development.2 A positive value of inventory change represents current-year production not sold by December 31. A negative value is an offset to production from prior years included in current-year sales.Source: USDA Economic Research Service
California Agricultural Resource Directory 2007 25
Agricultural Statistical Review
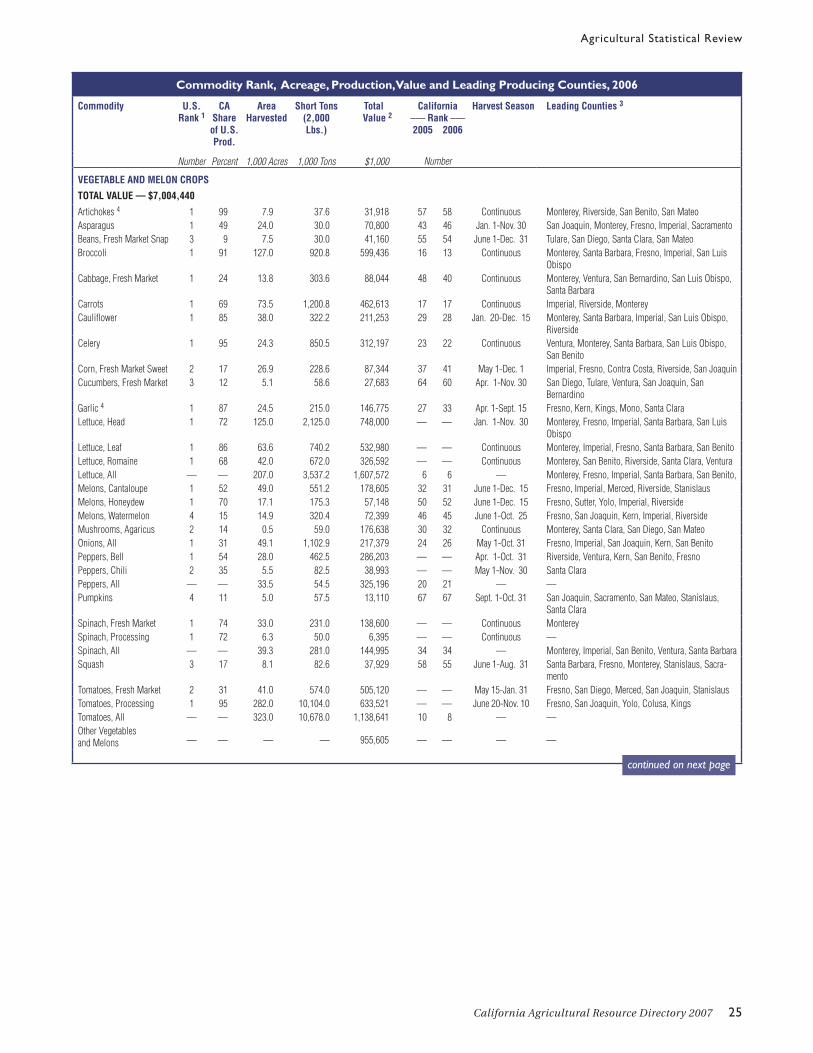
Commodity Rank, Acreage, Production, Value and Leading Producing Counties, 2006
Commodity U.S. Rank 1
CA Share of U.S. Prod.
Area Harvested
Short Tons (2,000 Lbs.)
Total Value 2
California ––– Rank ––– 2005 2006
Harvest Season Leading Counties 3
Number Percent 1,000 Acres 1,000 Tons $1,000 Number
VEGETABLE AND MELON CROPS
TOTAL VALUE — $7,004,440
Artichokes 4 1 99 7.9 37.6 31,918 57 58 Continuous Monterey, Riverside, San Benito, San MateoAsparagus 1 49 24.0 30.0 70,800 43 46 Jan. 1-Nov. 30 San Joaquin, Monterey, Fresno, Imperial, SacramentoBeans, Fresh Market Snap 3 9 7.5 30.0 41,160 55 54 June 1-Dec. 31 Tulare, San Diego, Santa Clara, San MateoBroccoli 1 91 127.0 920.8 599,436 16 13 Continuous Monterey, Santa Barbara, Fresno, Imperial, San Luis
ObispoCabbage, Fresh Market 1 24 13.8 303.6 88,044 48 40 Continuous Monterey, Ventura, San Bernardino, San Luis Obispo,
Santa BarbaraCarrots 1 69 73.5 1,200.8 462,613 17 17 Continuous Imperial, Riverside, MontereyCauliflower 1 85 38.0 322.2 211,253 29 28 Jan. 20-Dec. 15 Monterey, Santa Barbara, Imperial, San Luis Obispo,
RiversideCelery 1 95 24.3 850.5 312,197 23 22 Continuous Ventura, Monterey, Santa Barbara, San Luis Obispo,
San BenitoCorn, Fresh Market Sweet 2 17 26.9 228.6 87,344 37 41 May 1-Dec. 1 Imperial, Fresno, Contra Costa, Riverside, San JoaquinCucumbers, Fresh Market 3 12 5.1 58.6 27,683 64 60 Apr. 1-Nov. 30 San Diego, Tulare, Ventura, San Joaquin, San
BernardinoGarlic 4 1 87 24.5 215.0 146,775 27 33 Apr. 1-Sept. 15 Fresno, Kern, Kings, Mono, Santa ClaraLettuce, Head 1 72 125.0 2,125.0 748,000 — — Jan. 1-Nov. 30 Monterey, Fresno, Imperial, Santa Barbara, San Luis
ObispoLettuce, Leaf 1 86 63.6 740.2 532,980 — — Continuous Monterey, Imperial, Fresno, Santa Barbara, San BenitoLettuce, Romaine 1 68 42.0 672.0 326,592 — — Continuous Monterey, San Benito, Riverside, Santa Clara, VenturaLettuce, All — — 207.0 3,537.2 1,607,572 6 6 — Monterey, Fresno, Imperial, Santa Barbara, San Benito,Melons, Cantaloupe 1 52 49.0 551.2 178,605 32 31 June 1-Dec. 15 Fresno, Imperial, Merced, Riverside, StanislausMelons, Honeydew 1 70 17.1 175.3 57,148 50 52 June 1-Dec. 15 Fresno, Sutter, Yolo, Imperial, RiversideMelons, Watermelon 4 15 14.9 320.4 72,399 46 45 June 1-Oct. 25 Fresno, San Joaquin, Kern, Imperial, RiversideMushrooms, Agaricus 2 14 0.5 59.0 176,638 30 32 Continuous Monterey, Santa Clara, San Diego, San MateoOnions, All 1 31 49.1 1,102.9 217,379 24 26 May 1-Oct. 31 Fresno, Imperial, San Joaquin, Kern, San BenitoPeppers, Bell 1 54 28.0 462.5 286,203 — — Apr. 1-Oct. 31 Riverside, Ventura, Kern, San Benito, FresnoPeppers, Chili 2 35 5.5 82.5 38,993 — — May 1-Nov. 30 Santa ClaraPeppers, All — — 33.5 54.5 325,196 20 21 — —Pumpkins 4 11 5.0 57.5 13,110 67 67 Sept. 1-Oct. 31 San Joaquin, Sacramento, San Mateo, Stanislaus,
Santa ClaraSpinach, Fresh Market 1 74 33.0 231.0 138,600 — — Continuous MontereySpinach, Processing 1 72 6.3 50.0 6,395 — — Continuous —Spinach, All — — 39.3 281.0 144,995 34 34 — Monterey, Imperial, San Benito, Ventura, Santa BarbaraSquash 3 17 8.1 82.6 37,929 58 55 June 1-Aug. 31 Santa Barbara, Fresno, Monterey, Stanislaus, Sacra-
mentoTomatoes, Fresh Market 2 31 41.0 574.0 505,120 — — May 15-Jan. 31 Fresno, San Diego, Merced, San Joaquin, StanislausTomatoes, Processing 1 95 282.0 10,104.0 633,521 — — June 20-Nov. 10 Fresno, San Joaquin, Yolo, Colusa, KingsTomatoes, All — — 323.0 10,678.0 1,138,641 10 8 — —Other Vegetables and Melons — — — — 955,605 — — — —
continued on next page

26 California Agricultural Resource Directory 2007
Agricultural Statistical Review
Commodity Rank, Acreage, Production, Value and Leading Producing Counties, 2006
Commodity U.S. Rank 1
CA Share of U.S. Prod.
Area Harvested
Short Tons (2,000 Lbs.)
Total Value 2
California ––– Rank ––– 2005 2006
Harvest Season Leading Counties 3
Number Percent 1,000 Acres 1,000 Tons $1,000 Number
FRUIT AND NUT CROPSTOTAL VALUE — $10,405,054
Almonds (Shelled) 4 1 99 585.0 557.5 2,040,357 3 4 Aug. 1-Oct. 31 Fresno, Kern, Stanislaus, Merced, MaderaApples 6 4 23.0 177.5 85,068 47 42 July 15-Oct. 30 San Joaquin, Kern, Fresno, Santa Cruz, StanislausApricots 1 78 13.8 39.0 23,128 60 63 May 1-July 15 Stanislaus, Fresno, Merced, Kern, San JoaquinAvocados 1 96 62.1 300.0 342,000 22 20 Continuous San Diego, Ventura, Santa Barbara, Riverside, San Luis
ObispoBerries, Blueberries 7 4 2.3 5.0 32,800 56 57 — Tulare, San JoaquinBerries, Boysenberries 1 61 0.3 1.8 3,868 72 72 June 1-July 15 —Berries, Raspberries 1 63 4.3 58.0 249,615 26 25 June 1-Oct. 31 Santa Cruz, Ventura, MontereyBerries, F.M. Strawberries 1 87 — 827.1 1,071,922 — — — Monterey, Ventura, Santa Barbara, San Luis Obispo,
SacramentoBerries, Proc. Strawberries 1 94 — 231.0 122,457 — — — Ventura, Santa Barbara, Monterey, San DiegoBerries, All Strawberries 1 88 35.8 1,058.1 1,194,379 8 7 Feb. 20-Nov. 15 Monterey, Ventura, Santa Barbara, Santa Cruz, OrangeCherries, Sweet 3 14 28.0 42.1 124,391 41 35 May 20-June 25 San Joaquin, Fresno, Kern, Stanislaus, TulareDates 4 1 82 5.9 19.6 29,008 63 59 Oct. 1-Dec. 15 Riverside, ImperialFigs 4 1 99 71.5 41.8 24,881 61 61 June 10-Sept. 15 Madera, MercedGrapefruit, All 2 20 11.5 201.0 79,509 38 43 Nov. 1-July 31 Riverside, Tulare, Kern, Imperial, San DiegoGrapes, Raisin Type — — 234.0 1,861.0 526,895 — — May 15-Nov. 15 Fresno, Madera, Kern, Tulare, KingsGrapes, Table Type — — 83.0 729.0 657,472 — — May 25-Dec. 15 Kern, Tulare, Fresno, Riverside, MaderaGrapes, Wine Type — — 480.0 3,176.0 1,848,288 — — Aug. 5-Dec. 15 Napa, Sonoma, Monterey, San Joaquin, FresnoGrapes, All 1 90 797.0 5,766.0 3,032,655 2 2 — Fresno, Kern, Napa, Sonoma, TulareKiwifruit 4 1 97 4.0 26.1 23,148 65 62 Oct. 1-May 31 Tulare, Butte, Yuba, Fresno, SutterLemons 1 85 44.0 836.0 374,737 21 19 Aug. 1-July 31 Ventura, Tulare, Riverside, Kern, ImperialNectarines 1 94 35.5 218.0 112,706 35 36 June 10-Sept. 5 Fresno, Tulare, Kings, Kern, MaderaOlives 4 1 100 31.0 23.5 18,119 44 66 Sept. 25-Mar. 15 Tulare, Glenn, Tehama, Butte, FresnoOranges, Navel and Misc. — 38 135.0 1,762.5 452,375 — — Nov. 1-Aug.31 Tulare, Kern, Fresno, San Bernardino, RiversideOranges, Valencia — 16 46.0 525.0 180,970 — — Nov. 1-June 15 Tulare, Kern, Fresno, Ventura, San BernardinoOranges, All 2 30 181.0 2,287.5 633,345 13 11 — Tulare, Kern, Fresno, Ventura, San DiegoPeaches, Clingstone 1 100 27.0 359.0 104,846 — — July 15-Sept. 15 Stanislaus, Sutter, Merced, Yuba, KingsPeaches, Freestone 1 54 36.0 353.0 165,562 — — May 10-Sept. 15 Fresno, Tulare, Kings, Stanislaus, MercedPeaches, All 1 70 63.0 712.0 270,408 19 23 — Fresno, Tulare, Stanislaus, Kings, San JoaquinPears, All 2 28 16.0 239.0 68,269 45 47 Aug. 5-Oct. 5 Sacramento, Fresno, Mendocino, Lake, San JoaquinPecans 8 2 2.9 17.0 5,848 71 71 Sept. 1-Nov. 30 TularePistachios 4 1 96 110.0 119.0 454,580 14 18 Sept. 15-Dec. 10 Kern, Madera, Tulare, Fresno, KingsPlums 1 95 36.0 158.0 110,217 39 38 May 25-Aug. 20 Fresno, Tulare, Kings, Kern, MaderaPlums, Dried 4 1 99 65.0 180.0 255,684 33 24 Aug. 15-Oct. 10 Sutter, Yuba, Butte, Tehama, GlennTangerines, Mandarins, Tangelos, and Tangors 2 37 14.0 135.0 59,134 54 50 Nov. 1-May 15 Kern, Tulare, Riverside, Imperial, San DiegoWalnuts 4 1 99 216.0 346.0 553,600 15 15 Sept. 5-Nov. 10 San Joaquin, Tulare, Stanislaus, Butte, Sutter
Other Fruits and Nuts — — — — 203,600 — — — —
Commodity Rank, Acreage, Production, Value and Leading Producing Counties, 2006 continued

California Agricultural Resource Directory 2007 27
Agricultural Statistical Review
Commodity Rank, Acreage, Production, Value and Leading Producing Counties, 2006 continuedCommodity Rank, Acreage, Production, Value and Leading Producing Counties, 2006
Commodity U.S. Rank 1
CA Share of U.S. Prod.
Area Harvested
Short Tons (2,000 Lbs.)
Total Value 2
California ––– Rank ––– 2005 2006
Harvest Season Leading Counties 3
Number Percent 1,000 Acres 1,000 Tons $1,000 Number
FIELD AND SEED CROPSTOTAL VALUE — $3,338,405Barley 9 2 65.0 85.8 8,938 69 69 May 15-Oct. 1 Fresno, Siskiyou, San Luis Obispo, Monterey, MercedBeans, Dry 6 5 65.0 60.4 58,274 52 51 Aug. 20-Nov. 15 Stanislaus, Colusa, Kern, Tulare, Santa BarbaraCotton Lint, All 5 7 557.0 351.8 556,833 12 14 Oct. 1-Jan. 1 Fresno, Kings, Kern, Merced, TulareCottonseed 2 7 — 532.0 98,420 40 37 — Kings, Fresno, Kern, Merced, TulareGrain, Corn 30 — 110.0 508.2 62,618 51 49 Sept. 1-Dec. 1 San Joaquin, Tulare, Sacramento, Glenn, MercedGrain, Sorghum 14 — 10.0 29.4 3,822 15 75 — Tulare, Sutter, SacramentoHay, Alfalfa and Other 1 6 1,580.0 9,048.0 1,002,822 7 10 Mar. 1-Nov. 5 Imperial, Kern, Tulare, Fresno, MercedOats 16 2 20.0 27.5 3,440 73 13 June 15-Oct. 1 Siskiyou, Sacramento, Modoc, Sonoma, San MateoPotatoes (Excl. Sweet) 9 3 41.4 757.6 197,475 25 29 Continuous Kern, San Joaquin, Modoc, Imperial, RiversidePotatoes, Sweet 2 23 12.5 190.6 74,792 4 44 July 15-Nov. 15 Merced, StanislausRice 5,6 2 21 523.0 2,002.0 464,464 18 16 Sept. 1-Nov. 30 Colusa, Butte, Sutter, Glenn, YoloSugar Beets 5,6 5 5 43.0 1,591.0 65,041 49 48 Apr. 1-Dec. 10 Imperial, Fresno, Kern, Merced, KingsWheat, All 20 1 315.0 628.0 88,571 36 39 May 20-Sept. 1 Kern, Kings, Tulare, Imperial, FresnoOil Crops 7 — — 93.8 69.0 20,892 66 64 — —Other Field Crops — — — — 632,005 — — — —
NURSERY, GREENHOUSE AND FLORICULTURE CROPSTOTAL VALUE — $3,804,453Nursery Products 4,6,8 1 — — — 2,775,000 4 3 Continuous San Diego, Monterey, Riverside, Ventura, Orange
Flowers and Foliage 9 1 — — — 1,020,453 9 9 Continuous San Diego, Santa Barbara, Monterey, San Luis Obispo, Ventura
Christmas Trees — — — — 9,000 70 70 Nov. 1-Dec. 24 El Dorado, San Diego, Santa Clara, San Mateo, San Bernardino
1 Based on quantity produced for crops and on quantity marketed for livestock and poultry products.2 Based on value of quantity harvested for crops, value of quantity marketed for livestock, and value of quantity produced for poultry products.3 Based on values published in the county agricultural commissioners’ annual crop reports.4 Share of U.S. production based on 2002 Census of Agriculture.5 The 2006 price and value are based on the 2005 California average price.6 Extracted from county agricultural commissioners’ annual crop reports.7 Includes sunflower, safflower and canola.8 Includes trees, shrubs, vines, bulbs, turf, etc., not included in flowers and foliage category.9 Includes cut flowers, potted plants, foliage plants, bedding plants and indoor decoratives.
Unit Conversion Factors (as used in this publication)
Ton or Short Ton 2,000 pounds
Metric Ton 2,204.622 pounds
Hundredweight (Cwt.) 100 pounds
Kilogram 2.2046 pounds
Pound (Lb.) 16 ounces
Acre 0.4047 hectares or 43,560 square feet
Hectare 2.47 acres
Square Mile 640 acres or 259 hectares
Gallon 3.7853 liters
Bushel Barley = 48 pounds
Corn = 56 pounds
Oats = 32 pounds
Wheat = 60 pounds
Carton (Half-a-Box) Grapefruit = 33.5 pounds
Lemons = 38.0 pounds
Oranges = 37.5 pounds
Tangerines = 37.5 pounds
Bale Cotton = 480 pounds
Commodity Rank, Acreage, Production, Value and Leading Producing Counties, 2006 continued
28 California Agricultural Resource Directory 2007
Agricultural Statistical Review
1 Estimates for $100,000+ size groups began in 1998.
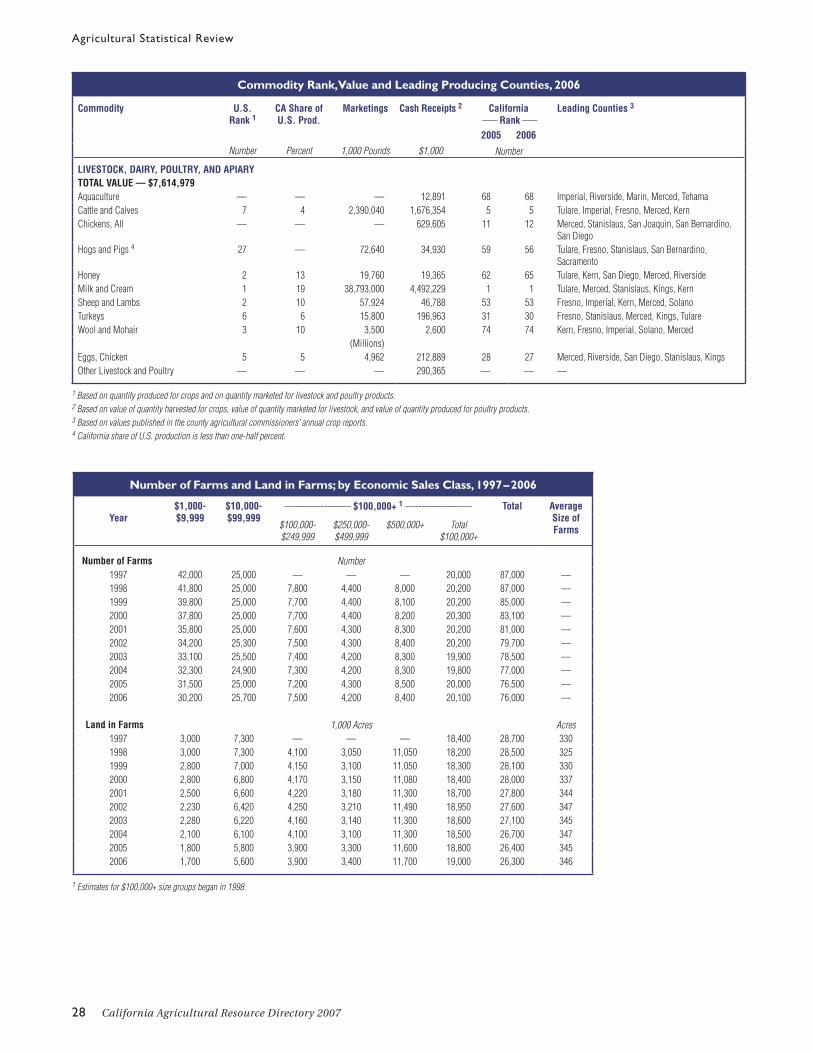
Commodity Rank, Value and Leading Producing Counties, 2006
Commodity U.S. Rank 1
CA Share of U.S. Prod.
Marketings Cash Receipts 2 California ––– Rank –––2005 2006
Leading Counties 3
Number Percent 1,000 Pounds $1,000 Number
LIVESTOCK, DAIRY, POULTRY, AND APIARYTOTAL VALUE — $7,614,979Aquaculture — — — 12,891 68 68 Imperial, Riverside, Marin, Merced, TehamaCattle and Calves 7 4 2,390,040 1,676,354 5 5 Tulare, Imperial, Fresno, Merced, KernChickens, All — — — 629,605 11 12 Merced, Stanislaus, San Joaquin, San Bernardino,
San DiegoHogs and Pigs 4 27 — 72,640 34,930 59 56 Tulare, Fresno, Stanislaus, San Bernardino,
SacramentoHoney 2 13 19,760 19,365 62 65 Tulare, Kern, San Diego, Merced, RiversideMilk and Cream 1 19 38,793,000 4,492,229 1 1 Tulare, Merced, Stanislaus, Kings, KernSheep and Lambs 2 10 57,924 46,788 53 53 Fresno, Imperial, Kern, Merced, SolanoTurkeys 6 6 15,800 196,963 31 30 Fresno, Stanislaus, Merced, Kings, TulareWool and Mohair 3 10 3,500 2,600 74 74 Kern, Fresno, Imperial, Solano, Merced
(Millions)Eggs, Chicken 5 5 4,962 212,889 28 27 Merced, Riverside, San Diego, Stanislaus, Kings Other Livestock and Poultry — — — 290,365 — — —
1 Based on quantity produced for crops and on quantity marketed for livestock and poultry products.2 Based on value of quantity harvested for crops, value of quantity marketed for livestock, and value of quantity produced for poultry products.3 Based on values published in the county agricultural commissioners’ annual crop reports.4 California share of U.S. production is less than one-half percent.
Number of Farms and Land in Farms; by Economic Sales Class, 1997 – 2006
Year$1,000-$9,999
$10,000-$99,999
––––––––--–––– $100,000+ 1 ––--–––––––––– Total Average Size of Farms$100,000-
$249,999$250,000-$499,999
$500,000+ Total $100,000+
Number of Farms Number 1997 42,000 25,000 — — — 20,000 87,000 —1998 41,800 25,000 7,800 4,400 8,000 20,200 87,000 —1999 39,800 25,000 7,700 4,400 8,100 20,200 85,000 —2000 37,800 25,000 7,700 4,400 8,200 20,300 83,100 —2001 35,800 25,000 7,600 4,300 8,300 20,200 81,000 —2002 34,200 25,300 7,500 4,300 8,400 20,200 79,700 —2003 33,100 25,500 7,400 4,200 8,300 19,900 78,500 —2004 32,300 24,900 7,300 4,200 8,300 19,800 77,000 —2005 31,500 25,000 7,200 4,300 8,500 20,000 76,500 —2006 30,200 25,700 7,500 4,200 8,400 20,100 76,000 —
Land in Farms 1,000 Acres Acres1997 3,000 7,300 — — — 18,400 28,700 3301998 3,000 7,300 4,100 3,050 11,050 18,200 28,500 3251999 2,800 7,000 4,150 3,100 11,050 18,300 28,100 3302000 2,800 6,800 4,170 3,150 11,080 18,400 28,000 3372001 2,500 6,600 4,220 3,180 11,300 18,700 27,800 3442002 2,230 6,420 4,250 3,210 11,490 18,950 27,600 3472003 2,280 6,220 4,160 3,140 11,300 18,600 27,100 3452004 2,100 6,100 4,100 3,100 11,300 18,500 26,700 3472005 1,800 5,800 3,900 3,300 11,600 18,800 26,400 3452006 1,700 5,600 3,900 3,400 11,700 19,000 26,300 346

California Agricultural Resource Directory 2007 29
Agricultural Statistical Review
County Rank, Total Value of Production and Leading Commodities, 2006 1
––– Rank –––2005 2006
County Total Value Leading Commodities
$1,000
1 1 Fresno 4,843,392 Grapes, Almonds, Tomatoes, Poultry, Cattle and Calves2 2 Tulare 3,870,843 Milk, Oranges, Cattle and Calves, Grapes, Alfalfa Hay and Silage4 3 Monterey 3,489,923 Lettuce, Strawberries, Nursery, Broccoli, Grapes3 4 Kern 3,476,801 Almonds and By-Products, Grapes, Milk, Carrots, Citrus5 5 Merced 2,284,457 Milk, Chickens, Almonds, Cattle and Calves, Tomatoes6 6 Stanislaus 2,148,152 Milk, Almonds, Cattle and Calves, Chickens, Walnuts7 7 San Joaquin 1,684,871 Milk, Grapes, Tomatoes, Almonds, Walnuts
11 8 Ventura 1,505,588 Strawberries, Lemons, Celery, Woody Ornamentals, Tomatoes8 9 San Diego 1,461,476 Flower and Foliage Plants, Trees and Shrubs, Bedding Plants, Avocados, Tomatoes
10 10 Imperial 1,307,615 Cattle, Alfalfa Hay, Carrots, Head and Leaf Lettuce, Cantaloupe9 11 Kings 1,289,186 Milk, Cotton, Cattle and Calves, Alfalfa Hay, Almonds
12 12 Riverside 1,102,438 Woody Ornamentals, Milk, Table Grapes, Bell Peppers, Chicken Eggs13 13 Madera 1,032,500 Almonds and Hulls, Milk, Pistachios, Wine and Raisin Grapes, Replacement Heifers14 14 Santa Barbara 1,016,735 Strawberries, Broccoli, Wine Grapes, Head and Leaf Lettuce, Celery16 15 San Luis Obispo 621,547 Wine Grapes, Broccoli, Cattle and Calves, Strawberries, Vegetable Transplants15 16 Sonoma 590,618 Wine Grapes, Milk, Livestock and Poultry, Cattle and Calves, Ornamental Nursery18 17 Napa 477,760 Wine Grapes, Nursery Products, Cattle and Calves, Strawberries, Livestock Products17 18 San Bernardino 436,662 Milk, Cattle and Calves, Eggs, Replacement Heifers, Trees and Shrubs19 19 Butte 434,550 Rice, Almonds, Walnuts, Dried Plums, Nursery Stock22 20 Colusa 422,675 Rice, Almonds, Processing Tomatoes, English Walnuts, Cattle and Calves20 21 Santa Cruz 407,928 Strawberries, Raspberries, Landscape Plants, Vegetable Crops, Cut Flowers21 22 Glenn 375,126 Rice, Almonds, Milk, Walnuts, Dried Plums, 24 23 Yolo 370,196 Tomatoes, Alfalfa Hay, Wine Grapes, Almonds, Seed Crops26 24 Sutter 358,845 Rice, Dried Plums, Walnuts, Peaches, Nursery Products23 25 Sacramento 306,846 Wine Grapes, Milk, Nursery Stock, Bartlett Pears, Poultry25 26 Orange 287,881 Woody Ornamentals, Strawberries, Potted Plants, Flower Propagative Materials, Cut Flowers28 27 San Benito 270,940 Iceberg, Romaine and Salad Lettuce, Nursery Stock, Bell Peppers, Vegetable and Row Crops27 28 Los Angeles 270,915 Trees and Shrubs, Bedding Plants, Root Vegetables, Orchard Fruit, Alfalfa Hay29 29 Santa Clara 243,231 Nursery Crops, Mushrooms, Bell Peppers, Wine Grapes, Steers and Heifers30 30 Solano 233,406 Nursery Stock, Cattle and Calves, Alfalfa Hay, Processing Tomatoes, Walnuts33 31 Siskiyou 170,046 Strawberry Plants, Alfalfa Hay, Fed Heifers and Steers, Irrigated Pasture, Potatoes32 32 San Mateo 164,478 Potted Plants, Nursery Products, Cut Flowers, Orchid Plants, Foliage Plants31 33 Tehama 161,922 English Walnuts, Dried Plums, Almonds, Milk, Stockers and Feeders, Range Pasture34 34 Yuba 158,282 Dried Plums, Rice, Walnuts, Clingstone Peaches, Milk36 35 Mendocino 136,814 Wine Grapes, Bartlett Pears, Cattle and Calves, Milk, Nursery35 36 Humboldt 123,155 Nursery Products, Milk, Cattle and Calves, Energy Biomass, Irrigated and Range Pasture39 37 Shasta 89,251 Stockers and Feeders, Alfalfa and Other Hay, Strawberry Plants, Wild Rice37 38 Modoc 85,950 Alfalfa, Grain and Wild Hay, Cattle and Calves, Potatoes, Vegetable Crops, Irrigated and Range Pasture38 39 Contra Costa 83,426 Cattle and Calves, Bedding Plants, Sweet Corn, Grapes, Tomatoes41 40 Lake 68,427 Wine Grapes, Bartlett Pears, Nursery Products, English Walnuts, Cattle and Calves43 41 Lassen 59,148 Alfalfa, Grain and Other Hay, Strawberry Plants, Steers, Heifers, Irrigated Pasture40 42 Placer 52,715 Nursery Products, Cattle and Calves, Milling Rice, English Walnuts, Livestock Products42 43 Marin 51,374 Milk, Cattle and Calves, Range Pasture, Fish, Poultry45 44 Del Norte 47,104 Cows, Milk, Lily Bulbs, Woody Ornamentals, Nursery Products44 45 Alameda 43,414 Woody Ornamentals, Cattle and Calves, Wine Grapes, Range Pasture, Nursery Products46 46 Amador 29,757 Wine Grapes, Calves, Range Pasture, Livestock, Fruit and Nut Crops49 47 El Dorado 29,340 Cattle and Calves, Wine Grapes, Apples, Range Pasture, Christmas Trees and Cut Greens48 48 Mono 29,311 Alfalfa and Other Hay, Stockers and Feeders, Steers, Heifers, Cows47 49 Mariposa 27,660 Cattle and Calves, Rangeland, Livestock and Poultry Products, Poultry, Fruit and Nut Crops50 50 Tuolumne 26,380 Livestock, Cattle and Calves, Irrigated and Range Pasture, Firewood, Bees51 51 Plumas 20,300 Stockers and Feeders, Alfalfa, Grain and Wild Hay, Forage, Irrigated and Range Pasture, Wild Hay53 52 Inyo 18,026 Steers, Turf, Heifers, Alfalfa and Other Hay, Cows52 53 Calaveras 16,411 Cattle and Calves, Wine Grapes, Poultry, Walnuts, Nursery Products54 54 Nevada 8,938 Fed Heifers and Steers, Wine Grapes, Irrigated and Range Pasture, Milk Cows, Nursery Products55 55 Sierra 6,419 Stockers and Feeders, Irrigated, Forage and Range Pasture, Alfalfa, Wild and Grain Hay, Beef Cows56 56 Alpine 4,887 Cattle and Calves, Range and Irrigated Pasture, Other Hay57 57 San Francisco 3,141 Vegetable Crops, Cut Flowers58 58 Trinity 2 2,320 Cattle and Calves, Range and Irrigated Pasture, Wine Grapes, Fruit and Nut Crops, Grain and Other Hay
1 Totals vary slightly from those published by counties due to classification differences between county and state reports.2 Trinity County’s “County Agricultural Commissioner’s Report” was not available at publication. The last year available (2003) was used for this report.

30 California Agricultural Resource Directory 2007
Agricultural Statistical Review
Seasonal Rainfall with Comparisons to Normal, 2006–2007
Stations –––––––––––––– 2005–2006 –––––––––––––– –––––––––––––– 2006–2007 –––––––––––––– Normal Rainfall 1
Precipitation 1 Percent of Normal Precipitation 1 Percent of NormalInches Inches Inches
North Coast Eureka 59.54 159 35.80 95 37.53 Ukiah 51.07 135 23.43 62 37.96 Santa Rosa 45.67 151 20.63 68 30.30
Central Coast San Francisco Airport 26.05 132 11.63 59 19.70 San Jose 22.91 159 9.46 66 14.42 Livermore Tele — — — — 14.21 Salinas Airport 15.34 123 8.43 68 12.44 Monterey FAA 13.91 74 7.03 38 18.72 King City 15.05 132 5.26 46 11.44 Paso Robles Airport 14.48 104 3.92 28 13.95
Sacramento Valley Redding 45.37 136 22.73 68 33.30 Red Bluff FSS 30.30 136 12.74 57 22.29 Chico AFS 31.59 120 12.86 49 26.32 Marysville 31.18 148 12.26 58 21.04 Sacramento Airport 23.46 134 10.88 62 17.52
San Joaquin Valley Stockton WSO 16.67 119 7.94 57 13.95 Fresno 14.58 146 6.03 60 10.00 Bakersfield 6.85 120 3.06 53 5.72
South Coast Santa Maria Airport 17.28 140 5.10 41 12.36 Santa Barbara 17.64 109 7.21 44 16.25 Oxnard — — 6.09 40 15.22 Los Angeles 13.19 89 3.21 22 14.77 Riverside 7.38 77 1.67 17 9.58 San Diego Airport 6.06 61 3.85 39 9.90
Southeastern Interior Bishop 7.91 147 1.51 28 5.37 Lancaster 6.47 93 1.37 20 6.92 Daggett Airport 1.34 34 0.58 15 3.93 Thermal Airport 2.35 74 0.19 6 3.16 Blythe 2.85 79 3.85 107 3.60 Imperial 1.89 69 0.27 10 2.75
Cascade-Sierra Alturas 16.48 137 7.35 61 12.01 Mt. Shasta 62.08 168 26.63 72 37.02 Blue Canyon 90.45 135 49.47 74 67.04 Yosemite Valley 46.04 124 15.39 42 37.05
1 Rainfall year is July 1 – June 30.Source: Western Regional Climate Center, Reno, Nevada

California Agricultural Resource Directory 2007 31
Agricultural Statistical Review
VegetablesArtichokes
Asparagus
Avocados
Beans, Dry
Beans, Snap
Broccoli
Brussel Sprouts
Cabbage
Carrots
Cauliflower
Celery
Corn
Cucumbers
Garlic
Lettuce
Mushrooms
Onions
Peppers, Green
Potatoes
Potatoes, Sweet
Spinach
Squash
Tomatoes
FruitsApples
Apricots
Boysenberries
Cherries
Dates
Figs
Grapefruit
Grapes
Kiwifruit
Lemons
Melon, Cantaloupe
Melon, Honeydew
Olallieberries
Oranges, Navel
Oranges, Valencia
Peaches
Pears
Plums
Plums, Dried
Strawberries
Tangerines
Tangelos
Watermelons
JanuaryFebruary
MarchApril May June
July AugustSeptember
OctoberNovember
December
Pomegranates
California’s Fruit and Vegetable Crop Seasons

32 California Agricultural Resource Directory 2007
Notable Changes in County Ranks and Percentages of the State Total, 2006
Rank Commodity Changes in County Rankings
1 Milk and Cream Tulare leads with more than 26 percent of the State total2 Grapes, All Fresno leads, followed closely by Kern and Napa3 Nursery Products San Diego continues to lead with more than 18 percent of the total4 Cattle and Calves Tulare is number one, followed by Stanislaus and Imperial5 Almonds Fresno leads with 19 percent, followed by Kern6 Lettuce Monterey still leads with 65 percent of the State total7 Strawberries Monterey and Ventura lead with more than 60 percent of the total8 Oranges Tulare leads with more than half of the total9 Alfalfa Hay Kern leads the way, followed by Tulare and Imperial
10 Chickens Merced and Stanislaus lead the State with more than 56 percent11 Flowers and Foliage San Diego has more than 51 percent of the total12 Walnuts, English San Joaquin leads, followed closely by Tulare and Stanislaus13 Tomatoes, Processing Fresno leads with nearly 39 percent, followed by San Joaquin and Yolo14 Cotton Fresno still leads with 34 percent, followed by Kings15 Rice (Excl. seed) Colusa leads with more than 28 percent, followed by Butte
County Statistical Data
California’s counties reported a slight decrease of 0.9 percent in the value of their agricultural produc-tion for 2006. Fourteen counties reported a value of production in excess of $1.01 billion. Fresno continued as the leading county with an agricultural production value of $4.84 billion, an increase of 4.4 percent from the 2005 value. Tulare County was second in value of production with $3.87 billion, 11.2 percent below 2005. Monterey had an increase of 4.3 percent in production to $3.49 billion, moving the county to third in value. Kern’s decrease of 2.1 percent to $3.48 billion in agricultural production dropped the county to fourth in value.
Notes to the County DataThe gross value of production published in this report includes all farm production, whether sold into usual marketing channels or used on the farm where produced. Values placed on pasture and range feed are included, and fresh fruit and vege-table crop values are based on the free-on-board (f.o.b.) packed price. Values are recorded for all products grown during the calendar year, regardless of when they are marketed. The county agricul-tural commissioners’ reports also provide statistics on a broader range of commodities than estimates prepared by other agencies. Because of these concepts, the state total for gross dollar values summarized in this report differs from the cash receipts to farmers estimated by USDA’s National Agricultural Statistics Service,

California Agricultural Resource Directory 2007 33
County Statistical Data
California’s Leading Timber Counties, 2006
Timber Rank County Timber Volume Total Agricultural Value (Including Timber)
Timber Value Timber Percentage of Total Agricultural Value
1,000 Bd. Ft. $1,000 $1,000 Percent
1 Humboldt 336,743 294,783 171,628 58.22 Mendocino 110,168 190,193 53,379 28.13 Shasta 189,501 139,712 50,461 36.14 Siskiyou 198,832 217,971 47,925 22.05 Plumas 118,936 49,112 28,812 58.7
California Field Office. The larger total value reported by the agricultural commissioners results from different definitions used in estimating total value of production rather than cash receipts to producers. Some counties now include timber as a part of their crop report, following the pattern set by the County Agricultural Commissioners and Sealers Association. Since it is not comparable to earlier county summaries, timber has not been made a part of the main tables of this summary. Total value reported by the counties, including timber, is 0.2 percent more than the $38.3 billion recorded in the table “County Rank by Gross Value of Agricultural Production, 2005-2006” on page 34.
California Timber IndustryCalifornia has more forestland than any state except Alaska. Nearly two billion board feet (equivalent to 132,000 homes) of commercial lumber are produced from California’s private and public timberlands each year, making the Golden State the third largest
producer of wood products in the nation. Cali-fornia’s abundant forests could provide nearly 100 percent of the state’s demand for wood.
County Agricultural Commissioners’ ReportsCopies of individual county agricultural commissioners’ reports may be requested directly from each County Agricultural Commissioner’s Office. For your convenience, a listing of offices is included in the phone directory section of this publication. Many of the counties also publish these reports on their Web sites. USDA’s National Agri-cultural Statistics Service, California Field Office publications are also available free-of-charge at www.nass.usda.gov/ca.
Photo by Ed Williams / Shasta County
34 California Agricultural Resource Directory 2007
County Statistical Data
County Rank by Gross Value of Agricultural Production, 2005 – 2006 1
County ––––––––––––––– Rank Without Timber ––––––––––––––– ––––––––––––––––– Rank With Timber –––––––––––––––––
2005 2006 Percent Change
Timber Value
2005 2006 Percent Change
$1,000 $1,000 $1,000 $1,000 $1,000
Fresno 4,640,166 (1) 4,843,392 (1) 4.4 2,046 4,642,511 (1) 4,845,438 (1) 4.4Tulare 4,360,854 (2) 3,870,843 (2) -11.2 1,219 4,362,734 (2) 3,872,062 (2) -11.2Monterey 3,346,955 (4) 3,489,923 (3) 4.3 — 3,346,959 (4) 3,489,923 (3) 4.3Kern 3,550,713 (3) 3,476,801 (4) -2.1 59 3,550,876 (3) 3,476,860 (4) -2.1Merced 2,388,058 (5) 2,284,457 (5) -4.3 6 2,388,065 (5) 2,284,463 (5) -4.3Stanislaus 1,977,596 (6) 2,148,152 (6) 8.6 — 1,977,596 (6) 2,148,152 (6) 8.6San Joaquin 1,735,528 (7) 1,684,871 (7) -2.9 8 1,735,537 (7) 1,684,879 (7) -2.9Ventura 1,253,048 (11) 1,505,588 (8) 20.2 16 1,253,110 (11) 1,505,604 (8) 20.1San Diego 1,531,307 (8) 1,461,476 (9) -4.6 9 1,531,315 (8) 1,461,485 (9) -4.6Imperial 1,286,066 (10) 1,307,615 (10) 1.7 — 1,286,066 (10) 1,307,615 (10) 1.7Kings 1,407,219 (9) 1,289,186 (11) -8.4 — 1,407,219 (9) 1,289,186 (11) -8.4Riverside 1,168,296 (12) 1,102,438 (12) -5.6 7 1,168,305 (12) 1,102,445 (12) -5.6Madera 1,105,044 (13) 1,032,500 (13) -6.6 402 1,105,530 (13) 1,032,902 (13) -6.6Santa Barbara 997,600 (14) 1,016,735 (14) 1.9 — 997,600 (14) 1,016,735 (14) 1.9San Luis Obispo 593,632 (16) 621,547 (15) 4.7 11 593,646 (16) 621,558 (15) 4.7Sonoma 637,333 (15) 590,618 (16) -7.3 6,324 642,317 (15) 596,942 (16) -7.1Napa 548,206 (18) 477,760 (17) -12.9 27 548,621 (18) 477,787 (17) -12.9San Bernardino 565,100 (17) 436,662 (18) -22.7 — 565,101 (17) 436,662 (19) -22.7Butte 432,028 (19) 434,550 (19) 0.6 19,653 439,690 (19) 454,203 (18) 3.3Colusa 392,677 (22) 422,675 (20) 7.6 — 392,677 (22) 422,675 (20) 7.6Santa Cruz 411,956 (20) 407,928 (21) -1.0 6,339 418,114 (20) 414,267 (21) -0.9Glenn 393,736 (21) 375,126 (22) -4.7 — 394,212 (21) 375,126 (22) -4.8Yolo 332,720 (24) 370,196 (23) 11.3 — 332,720 (24) 370,196 (23) 11.3Sutter 305,579 (26) 358,845 (24) 17.4 — 305,579 (27) 358,845 (24) 17.4Sacramento 348,885 (23) 306,846 (25) -12.0 34 348,931 (23) 306,880 (25) -12.1Orange 312,336 (25) 287,881 (26) -7.8 26 312,366 (26) 287,907 (27) -7.8San Benito 268,846 (28) 270,940 (27) 0.8 — 268,846 (29) 270,940 (28) 0.8Los Angeles 277,844 (27) 270,915 (28) -2.5 — 277,926 (28) 270,915 (29) -2.5Santa Clara 250,530 (29) 243,231 (29) -2.9 1,230 252,283 (30) 244,461 (30) -3.1Solano 238,690 (30) 233,406 (30) -2.2 — 238,708 (31) 233,406 (31) -2.2Siskiyou 147,639 (33) 170,046 (31) 15.2 47,925 195,206 (32) 217,971 (32) 11.7San Mateo 158,397 (32) 164,478 (32) 3.8 4,045 162,056 (35) 168,523 (35) 4.0Tehama 172,466 (31) 161,922 (33) -6.1 14,848 190,538 (33) 176,770 (34) -7.2Yuba 132,654 (34) 158,282 (34) 19.3 4,837 136,869 (36) 163,119 (36) 19.2Mendocino 120,034 (36) 136,814 (35) 14.0 53,379 173,948 (34) 190,193 (33) 9.3Humboldt 126,807 (35) 123,155 (36) -2.9 171,628 320,170 (25) 294,783 (26) -7.9Shasta 84,209 (39) 89,251 (37) 6.0 50,461 127,678 (37) 139,712 (37) 9.4Modoc 88,406 (37) 85,950 (38) -2.8 5,394 96,886 (38) 91,344 (38) -5.7Contra Costa 86,938 (38) 83,426 (39) -4.0 10 86,938 (39) 83,436 (39) -4.0Lake 61,514 (41) 68,427 (40) 11.2 339 61,544 (42) 68,766 (41) 11.7Lassen 51,751 (43) 59,148 (41) 14.3 13,336 67,050 (41) 72,484 (40) 8.1Placer 62,339 (40) 52,715 (42) -15.4 11,583 73,853 (40) 64,298 (42) -12.9Marin 52,823 (42) 51,374 (43) -2.7 — 52,823 (44) 51,374 (45) -2.7Del Norte 43,166 (45) 47,104 (44) 9.1 7,448 54,352 (43) 54,552 (43) 0.4Alameda 43,951 (44) 43,414 (45) -1.2 10 43,953 (46) 43,424 (47) -1.2Amador 28,355 (46) 29,757 (46) 4.9 2,800 43,126 (47) 32,557 (49) -24.5El Dorado 26,100 (49) 29,340 (47) 12.4 22,847 42,898 (48) 52,187 (44) 21.7Mono 26,944 (48) 29,311 (48) 8.8 25 26,972 (51) 29,336 (50) 8.8Mariposa 27,084 (47) 27,660 (49) 2.1 1,152 28,334 (50) 28,812 (51) 1.7Tuolumne 25,713 (50) 26,380 (50) 2.6 11,484 35,257 (49) 37,864 (48) 7.4Plumas 21,282 (51) 20,300 (51) -4.6 28,812 47,669 (45) 49,112 (46) 3.0Inyo 16,614 (53) 18,026 (52) 8.5 — 16,614 (55) 18,026 (54) 8.5Calaveras 17,576 (52) 16,411 (53) -6.6 8,835 21,440 (53) 25,246 (52) 17.8Nevada 8,746 (54) 8,938 (54) 2.2 7,322 17,554 (54) 16,260 (55) -7.4Sierra 6,449 (55) 6,419 (55) -0.5 5,242 12,828 (56) 11,661 (56) -9.1Alpine 4,431 (56) 4,887 (56) 10.3 3 4,431 (57) 4,890 (57) 10.4San Francisco 2,359 (57) 3,141 (57) 33.1 — 2,359 (58) 3,141 (58) 33.1Trinity 2 2,320 (58) 2,320 (58) — 22,926 24,050 (52) 25,246 (52) 5.0
Grand Total 38,705,615 38,341,499 -0.9 534,107 39,252,556 38,875,606 -1.0
1 Totals vary slightly from totals published by counties due to classification differences between county and state reports. Numbers in parentheses are county rankings.2 Trinity County Agricultural Commissioner’s Report was not available at publication. The last year available (2003) was used for this report.Source: County agricultural commissioners’ reports and State Board of Equalization, Timber Tax Division
California Agricultural Resource Directory 2007 35
County Statistical Data
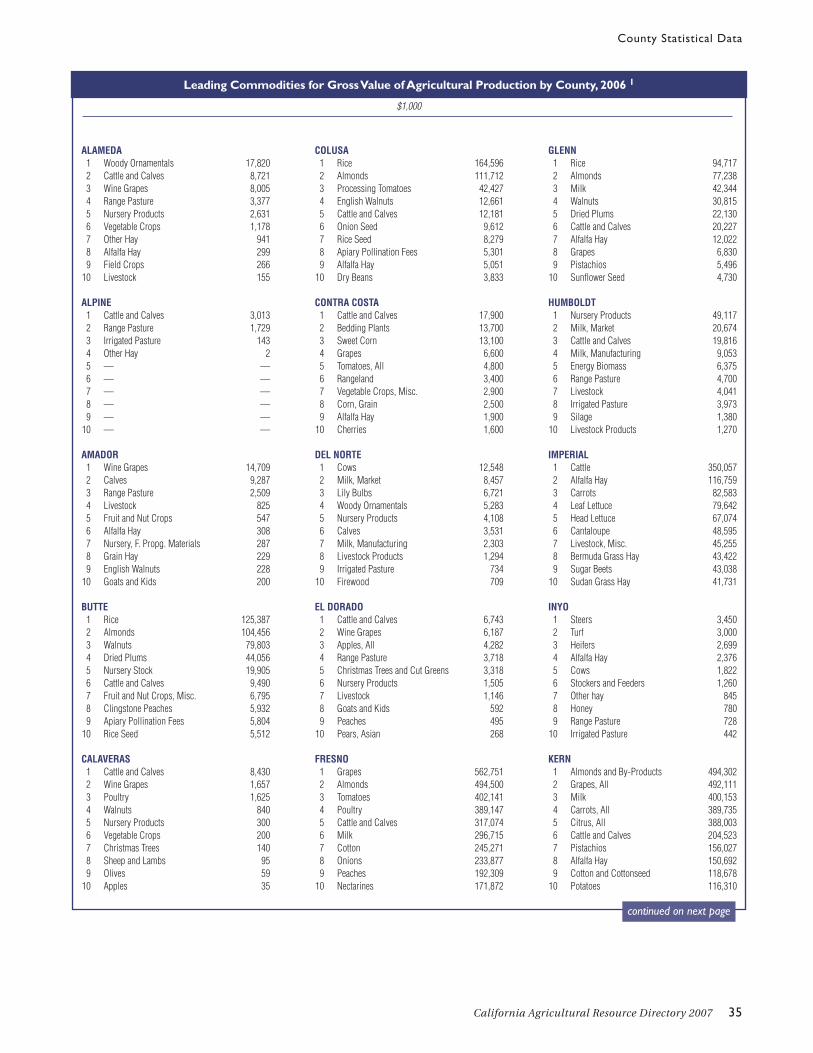
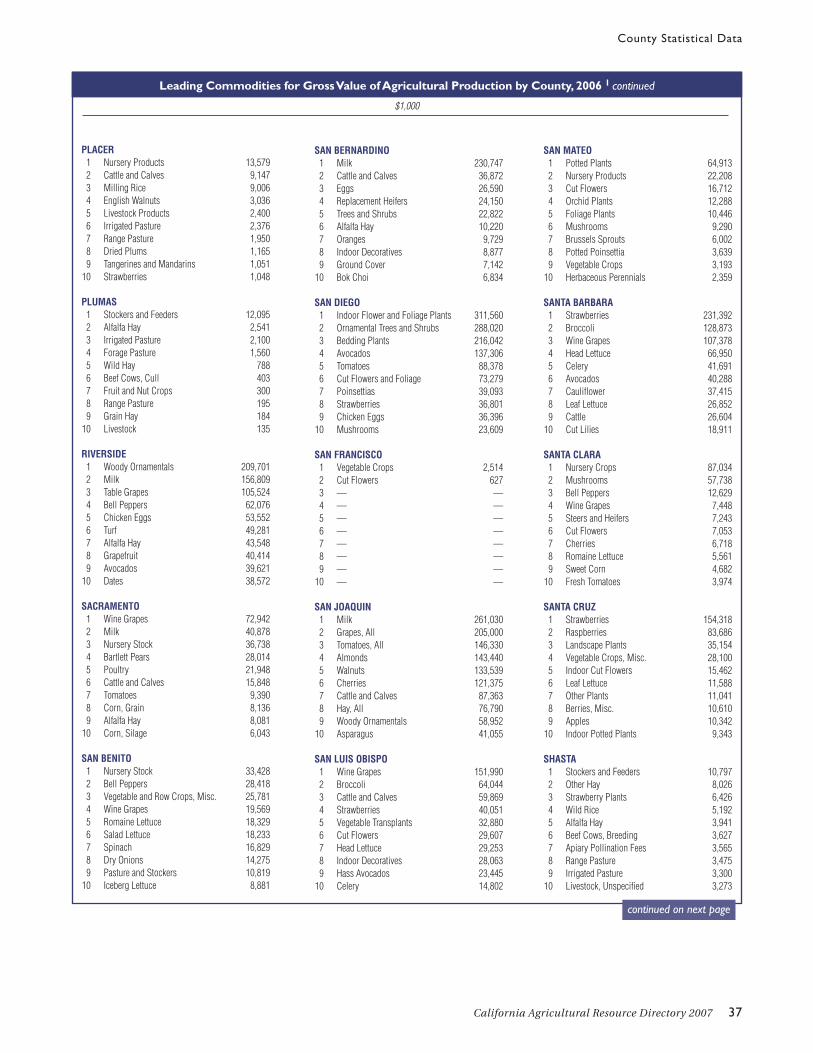
Leading Commodities for Gross Value of Agricultural Production by County, 2006 1
$1,000
ALAMEDA1 Woody Ornamentals 17,8202 Cattle and Calves 8,7213 Wine Grapes 8,0054 Range Pasture 3,3775 Nursery Products 2,6316 Vegetable Crops 1,1787 Other Hay 9418 Alfalfa Hay 2999 Field Crops 266
10 Livestock 155
ALPINE1 Cattle and Calves 3,0132 Range Pasture 1,7293 Irrigated Pasture 1434 Other Hay 25 — —6 — —7 — —8 — —9 — —
10 — —
AMADOR1 Wine Grapes 14,7092 Calves 9,2873 Range Pasture 2,5094 Livestock 8255 Fruit and Nut Crops 5476 Alfalfa Hay 3087 Nursery, F. Propg. Materials 2878 Grain Hay 2299 English Walnuts 228
10 Goats and Kids 200
BUTTE1 Rice 125,3872 Almonds 104,4563 Walnuts 79,8034 Dried Plums 44,0565 Nursery Stock 19,9056 Cattle and Calves 9,4907 Fruit and Nut Crops, Misc. 6,7958 Clingstone Peaches 5,9329 Apiary Pollination Fees 5,804
10 Rice Seed 5,512
CALAVERAS1 Cattle and Calves 8,4302 Wine Grapes 1,6573 Poultry 1,6254 Walnuts 8405 Nursery Products 3006 Vegetable Crops 2007 Christmas Trees 1408 Sheep and Lambs 959 Olives 59
10 Apples 35
COLUSA1 Rice 164,5962 Almonds 111,7123 Processing Tomatoes 42,4274 English Walnuts 12,6615 Cattle and Calves 12,1816 Onion Seed 9,6127 Rice Seed 8,2798 Apiary Pollination Fees 5,3019 Alfalfa Hay 5,051
10 Dry Beans 3,833
CONTRA COSTA1 Cattle and Calves 17,9002 Bedding Plants 13,7003 Sweet Corn 13,1004 Grapes 6,6005 Tomatoes, All 4,8006 Rangeland 3,4007 Vegetable Crops, Misc. 2,9008 Corn, Grain 2,5009 Alfalfa Hay 1,900
10 Cherries 1,600
DEL NORTE1 Cows 12,5482 Milk, Market 8,4573 Lily Bulbs 6,7214 Woody Ornamentals 5,2835 Nursery Products 4,1086 Calves 3,5317 Milk, Manufacturing 2,3038 Livestock Products 1,2949 Irrigated Pasture 734
10 Firewood 709
EL DORADO1 Cattle and Calves 6,7432 Wine Grapes 6,1873 Apples, All 4,2824 Range Pasture 3,7185 Christmas Trees and Cut Greens 3,3186 Nursery Products 1,5057 Livestock 1,1468 Goats and Kids 5929 Peaches 495
10 Pears, Asian 268
FRESNO1 Grapes 562,7512 Almonds 494,5003 Tomatoes 402,1414 Poultry 389,1475 Cattle and Calves 317,0746 Milk 296,7157 Cotton 245,2718 Onions 233,8779 Peaches 192,309
10 Nectarines 171,872
GLENN1 Rice 94,7172 Almonds 77,2383 Milk 42,3444 Walnuts 30,8155 Dried Plums 22,1306 Cattle and Calves 20,2277 Alfalfa Hay 12,0228 Grapes 6,8309 Pistachios 5,496
10 Sunflower Seed 4,730
HUMBOLDT1 Nursery Products 49,1172 Milk, Market 20,6743 Cattle and Calves 19,8164 Milk, Manufacturing 9,0535 Energy Biomass 6,3756 Range Pasture 4,7007 Livestock 4,0418 Irrigated Pasture 3,9739 Silage 1,380
10 Livestock Products 1,270
IMPERIAL1 Cattle 350,0572 Alfalfa Hay 116,7593 Carrots 82,5834 Leaf Lettuce 79,6425 Head Lettuce 67,0746 Cantaloupe 48,5957 Livestock, Misc. 45,2558 Bermuda Grass Hay 43,4229 Sugar Beets 43,038
10 Sudan Grass Hay 41,731
INYO1 Steers 3,4502 Turf 3,0003 Heifers 2,6994 Alfalfa Hay 2,3765 Cows 1,8226 Stockers and Feeders 1,2607 Other hay 8458 Honey 7809 Range Pasture 728
10 Irrigated Pasture 442
KERN1 Almonds and By-Products 494,3022 Grapes, All 492,1113 Milk 400,1534 Carrots, All 389,7355 Citrus, All 388,0036 Cattle and Calves 204,5237 Pistachios 156,0278 Alfalfa Hay 150,6929 Cotton and Cottonseed 118,678
10 Potatoes 116,310
continued on next page

36 California Agricultural Resource Directory 2007
County Statistical Data
Leading Commodities for Gross Value of Agricultural Production by County, 2004a
$1,000
Leading Commodities for Gross Value of Agricultural Production by County, 2006 1 continued
KINGS1 Milk 409,8092 Cotton, All 217,4313 Cattle and Calves 142,6324 Alfalfa Hay 60,0445 Almonds 51,3246 Peaches, All 42,5647 Corn Silage 41,7948 Pistachios 40,4459 Grapes, All 35,583
10 Processing Tomatoes 34,762
LAKE1 Wine Grapes 43,2052 Bartlett Pears 11,3153 Nursery Products 4,3184 English Walnuts 3,3535 Cattle and Calves 2,2506 Field Crops 1,2507 Asian Pears 7838 Range Pasture 6309 Pears 519
10 Vegetable Crops 242
LASSEN1 Alfalfa Hay 16,2642 Other Hay 11,3223 Strawberry Plants 9,7114 Steers 4,7435 Heifers 3,1156 Irrigated Pasture 3,0367 Milk Cows 2,2508 Grain Hay 2,1259 Calves 2,106
10 Mint 1,232
LOS ANGELES1 Ornamental Trees and Shrubs 119,1472 Bedding Plants 37,0413 Root Vegetables 29,4464 Orchard Fruit 18,4745 Alfalfa Hay 8,3506 Indoor Foliage Plants 6,3027 Dairy and Livestock 6,2288 Strawberries 4,9619 Indoor Flowering Plants 3,947
10 Ground Covers 2,539
MADERA1 Almonds and Hulls 215,9202 Milk 161,2543 Pistachios 151,2314 Wine Grapes 94,2665 Raisin Grapes 50,9446 Dairy Heifers, Replacement 50,1847 Alfalfa Hay 35,5968 Nursery Products 33,7189 Cattle and Calves 33,530
10 Table Grapes 28,083
MARIN1 Milk 27,0532 Cattle and Calves 8,8883 Range Pasture 6,1914 Fish 2,5945 Poultry 2,0946 Vegetable Crops 1,5707 Sheep and Lambs 1,0638 Silage 5579 Wine Grapes 498
10 Nursery Products 445
MARIPOSA1 Cattle and Calves 17,0252 Rangeland 6,3253 Livestock and Poultry Products 1,5144 Poultry, All 1,5025 Fruit and Nut Crops 2966 Livestock 2307 Sheep and Lambs 1728 Field Crops 1649 Wine Grapes 124
10 — —
MENDOCINO1 Wine Grapes 87,7632 Bartlett Pears 13,2623 Cattle and Calves 6,9394 Milk 3,4275 Nursery 3,2796 Pasture 3,9717 Rangeland 1,9118 Bosc Pears 1,6249 Apples 1,322
10 Irrigated Pasture 1,026
MERCED1 Milk 621,9562 Chickens, All 286,7853 Almonds 268,6264 Cattle and Calves 243,2895 Tomatoes, All 112,7306 Sweet Potatoes 111,8687 Chicken Eggs 81,2978 Alfalfa Hay 72,9129 Corn, Silage 59,197
10 Cotton Lint 54,510
MODOC1 Alfalfa Hay 25,5792 Cattle and Calves 18,8163 Potatoes 12,1384 Vegetable Crops 6,2695 Irrigated Pasture 4,0006 Wheat 3,7387 Onions 3,6758 Grain Hay 3,0909 Range Pasture 3,024
10 Wild Hay 2,800
MONO1 Alfalfa Hay 7,9202 Stockers and Feeders 5,5133 Steers 4,6204 Heifers 3,6295 Cows 2,3766 Other Hay 1,7927 Irrigated Pasture 1,4828 Sheep and Lambs 1,1349 Range Pasture 400
10 Bulls 226
MONTEREY1 Leaf Lettuce 630,3702 Head Lettuce 443,9203 Strawberries 439,7964 Nursery 339,2255 Broccoli 234,4006 Grapes 217,9837 Spring Mix 159,6198 Salad Products 121,7349 Vegetable Crops, Misc. 116,410
10 Spinach 111,280
NAPA1 Wine Grapes 469,0732 Nursery Products 3,5573 Cattle and Calves 3,0844 Strawberries, Fresh Market 5665 Livestock Products 4896 Olives 2697 Range Pasture 2618 Vegetable Crops 2569 Sheep and Lambs 75
10 Livestock 51
NEVADA1 Heifers and Steers, Fed 2,7902 Wine Grapes 1,5553 Irrigated Pasture 1,5004 Range Pasture 1,2355 Milk Cows, Cull 5596 Nursery Products 4907 Fruit and Nut Crops 3408 Sheep and Lambs 2789 Livestock 100
10 Livestock Products 90
ORANGE1 Woody Ornamentals 171,0142 Strawberries 47,8393 Potted Plants 24,9424 Nursery, F.Propg.Materials 18,9925 Cut Flowers 7486 Tomatoes, Fresh Market 1177 Valencia Oranges 1038 Sweet Corn 709 Onions 58
10 — —
California Agricultural Resource Directory 2007 37
County Statistical Data
Leading Commodities for Gross Value of Agricultural Production by County, 2004a
$1,000
Leading Commodities for Gross Value of Agricultural Production by County, 2006 1 continued
PLACER1 Nursery Products 13,5792 Cattle and Calves 9,1473 Milling Rice 9,0064 English Walnuts 3,0365 Livestock Products 2,4006 Irrigated Pasture 2,3767 Range Pasture 1,9508 Dried Plums 1,1659 Tangerines and Mandarins 1,051
10 Strawberries 1,048
PLUMAS1 Stockers and Feeders 12,0952 Alfalfa Hay 2,5413 Irrigated Pasture 2,1004 Forage Pasture 1,5605 Wild Hay 7886 Beef Cows, Cull 4037 Fruit and Nut Crops 3008 Range Pasture 1959 Grain Hay 184
10 Livestock 135
RIVERSIDE1 Woody Ornamentals 209,7012 Milk 156,8093 Table Grapes 105,5244 Bell Peppers 62,0765 Chicken Eggs 53,5526 Turf 49,2817 Alfalfa Hay 43,5488 Grapefruit 40,4149 Avocados 39,621
10 Dates 38,572
SACRAMENTO1 Wine Grapes 72,9422 Milk 40,8783 Nursery Stock 36,7384 Bartlett Pears 28,0145 Poultry 21,9486 Cattle and Calves 15,8487 Tomatoes 9,3908 Corn, Grain 8,1369 Alfalfa Hay 8,081
10 Corn, Silage 6,043
SAN BENITO1 Nursery Stock 33,4282 Bell Peppers 28,4183 Vegetable and Row Crops, Misc. 25,7814 Wine Grapes 19,5695 Romaine Lettuce 18,3296 Salad Lettuce 18,2337 Spinach 16,8298 Dry Onions 14,2759 Pasture and Stockers 10,819
10 Iceberg Lettuce 8,881
SAN BERNARDINO1 Milk 230,7472 Cattle and Calves 36,8723 Eggs 26,5904 Replacement Heifers 24,1505 Trees and Shrubs 22,8226 Alfalfa Hay 10,2207 Oranges 9,7298 Indoor Decoratives 8,8779 Ground Cover 7,142
10 Bok Choi 6,834
SAN DIEGO1 Indoor Flower and Foliage Plants 311,5602 Ornamental Trees and Shrubs 288,0203 Bedding Plants 216,0424 Avocados 137,3065 Tomatoes 88,3786 Cut Flowers and Foliage 73,2797 Poinsettias 39,0938 Strawberries 36,8019 Chicken Eggs 36,396
10 Mushrooms 23,609
SAN FRANCISCO1 Vegetable Crops 2,5142 Cut Flowers 6273 — —4 — —5 — —6 — —7 — —8 — —9 — —
10 — —
SAN JOAQUIN1 Milk 261,0302 Grapes, All 205,0003 Tomatoes, All 146,3304 Almonds 143,4405 Walnuts 133,5396 Cherries 121,3757 Cattle and Calves 87,3638 Hay, All 76,7909 Woody Ornamentals 58,952
10 Asparagus 41,055
SAN LUIS OBISPO1 Wine Grapes 151,9902 Broccoli 64,0443 Cattle and Calves 59,8694 Strawberries 40,0515 Vegetable Transplants 32,8806 Cut Flowers 29,6077 Head Lettuce 29,2538 Indoor Decoratives 28,0639 Hass Avocados 23,445
10 Celery 14,802
SAN MATEO1 Potted Plants 64,9132 Nursery Products 22,2083 Cut Flowers 16,7124 Orchid Plants 12,2885 Foliage Plants 10,4466 Mushrooms 9,2907 Brussels Sprouts 6,0028 Potted Poinsettia 3,6399 Vegetable Crops 3,193
10 Herbaceous Perennials 2,359
SANTA BARBARA1 Strawberries 231,3922 Broccoli 128,8733 Wine Grapes 107,3784 Head Lettuce 66,9505 Celery 41,6916 Avocados 40,2887 Cauliflower 37,4158 Leaf Lettuce 26,8529 Cattle 26,604
10 Cut Lilies 18,911
SANTA CLARA1 Nursery Crops 87,0342 Mushrooms 57,7383 Bell Peppers 12,6294 Wine Grapes 7,4485 Steers and Heifers 7,2436 Cut Flowers 7,0537 Cherries 6,7188 Romaine Lettuce 5,5619 Sweet Corn 4,682
10 Fresh Tomatoes 3,974
SANTA CRUZ1 Strawberries 154,3182 Raspberries 83,6863 Landscape Plants 35,1544 Vegetable Crops, Misc. 28,1005 Indoor Cut Flowers 15,4626 Leaf Lettuce 11,5887 Other Plants 11,0418 Berries, Misc. 10,6109 Apples 10,342
10 Indoor Potted Plants 9,343
SHASTA1 Stockers and Feeders 10,7972 Other Hay 8,0263 Strawberry Plants 6,4264 Wild Rice 5,1925 Alfalfa Hay 3,9416 Beef Cows, Breeding 3,6277 Apiary Pollination Fees 3,5658 Range Pasture 3,4759 Irrigated Pasture 3,300
10 Livestock, Unspecified 3,273
continued on next page

38 California Agricultural Resource Directory 2007
County Statistical Data
Leading Commodities for Gross Value of Agricultural Production by County, 2004a
$1,000
Leading Commodities for Gross Value of Agricultural Production by County, 2006 1 continued
1 The data rankings were extracted from county agricultural commissioners’ reports where published. Those not ranked by the counties were ranked by USDA’s National Agricultural Statistics Service, California Field Office. Timber was omitted in rankings. Trinity County Agricultural Commissioner’s Report was not available at publication. The last year available (2003) was used for this report.
SIERRA1 Stockers and Feeders 3,8172 Irrigated Pasture 6873 Forage Pasture 6004 Alfalfa Hay 5865 Wild Hay 3936 Beef Cows, Cull 1227 Grain Hay 878 Range Pasture 729 Fruit and Nut Crops 35
10 Livestock 20
SISKIYOU1 Strawberry Plants 48,4252 Alfalfa Hay 43,4323 Heifers and Steers, Fed 14,7494 Irrigated Pasture 9,3755 Potatoes 6,9546 Other Hay 6,1157 Nursery Products 6,0008 Cows 5,3559 Wheat 5,237
10 Field Crops 4,340
SOLANO1 Nursery Stock 47,8562 Cattle and Calves 25,1443 Alfalfa Hay 23,3194 Processing Tomatoes 20,8005 Walnuts 18,1176 Milk 10,4737 Wine Grapes 9,3018 Almonds 5,2799 Dried Plums 4,542
10 Sheep and Lambs 4,245
SONOMA1 Wine Grapes 430,4972 Milk 67,1713 Livestock and Poultry, Misc. 25,3794 Cattle and Calves 11,2945 Ornamental Nursery 9,4336 Nursery Products, Misc. 8,3797 Livestock and Poultry Products, Misc. 8,1018 Vegetable Crops 7,4179 Apples 5,238
10 Bedding Plants 4,203
STANISLAUS1 Milk 466,4952 Almonds 421,4403 Cattle and Calves 350,9814 Chickens, All 218,4965 Walnuts 87,5246 Peaches, All 62,0977 Silage, All 59,8648 Fruit and Nut Crops, Deciduous 55,0549 Turkeys 52,950
10 Alfalfa Hay 47,250
SUTTER1 Rice 115,3812 Dried Plums 67,8673 Walnuts 44,7844 Peaches 27,5115 Nursery Products 12,7376 Tomatoes 12,6837 Cattle and Calves 10,8548 Almonds 10,3309 Melons 8,351
10 Alfalfa Hay 6,638
TEHAMA1 English Walnuts 38,4342 Dried Plums 28,6323 Almonds 25,9054 Stockers and Feeders 8,6635 Range Pasture 8,3706 Milk, Manufacturing 6,6767 Milk, Market 5,8398 Heifers and Steers, Fed 3,8629 Fruit and Nut Crops 3,799
10 Livestock 3,643
TRINITY1 Cattle and Calves 9662 Range Pasture 7363 Wine Grapes 2374 Irrigated Pasture 1785 Fruit and Nut Crops 1006 Grain Hay 497 Nursery Products 288 Other Hay 259 Christmas Trees and Cut Greens 1
10 — —
TULARE1 Milk 1,179,3942 Oranges, All 566,1073 Cattle and Calves 496,3054 Grapes 350,2765 Alfalfa Hay and Silage 126,2326 Corn Grain and Silage 103,6147 Walnuts 95,2008 Almonds 88,3159 Plums 83,772
10 Pistachios 72,802
TUOLUMNE1 Livestock 14,7052 Cattle and Calves 6,3963 Range Pasture 2,8004 Firewood 1,3375 Bees 3646 Fruit and Nut Crops 2357 Sheep and Lambs 1608 Irrigated Pasture 1449 Other Hay 114
10 Livestock Products 91
VENTURA1 Strawberries, Fresh Market 318,3012 Lemons 191,5523 Celery 144,3134 Woody Ornamentals 143,7885 Tomatoes 102,4266 Avocados 87,3917 Raspberries 81,1538 Bedding Plants 68,7149 Strawberries, Processing 48,009
10 Cut Flowers 47,847
YOLO1 Tomatoes 77,0972 Alfalfa Hay 39,3683 Wine Grapes 38,0474 Almonds 28,8845 Seed Crops, All 28,7676 Rice 23,9187 Walnuts 18,5478 Organic Crops 14,4989 Cattle and Calves 11,556
10 Livestock Products 9,117
YUBA1 Dried Plums 45,0512 Rice 35,7153 Walnuts 20,6804 Clingstone Peaches 13,0715 Milk 8,0436 Cattle and Calves 6,5927 Pasture, All 4,3058 Kiwifruit 3,6639 Almonds and Almond Hulls 3,144
10 — —

California Agricultural Resource Directory 2007 39
County Statistical Data
Commodity Rank and Leading Counties by Gross Value of Agricultural Production, 2006 1
Commodity ––– State ––– –––––––––––––––––––––– Five Leading Counties by Rank and Percentage of State Total –––––––––-––––––––––––––Rank Value 1 Percent
of Value2 Percent
of Value3 Percent
of Value4 Percent
of Value5 Percent
of Value$1,000
Milk and Cream 1 4,475,793 Tulare 26.4 Merced 13.9 Stanislaus 10.4 Kings 9.1 Kern 8.9Grapes, All 2 3,706,859 Fresno 15.2 Kern 13.3 Napa 12.7 Sonoma 11.6 Tulare 9.4Nursery Products 2 3 3,095,717 San Diego 18.9 Monterey 8.7 Riverside 8.6 Ventura 8.5 Orange 6.9Cattle and Calves, All 4 2,927,786 Tulare 17.0 Stanislaus 12.0 Imperial 12.0 Fresno 10.8 Merced 8.3Almonds 5 2,522,886 Fresno 19.6 Kern 18.8 Stanislaus 16.7 Merced 10.6 Madera 8.6Lettuce 6 1,813,261 Monterey 65.6 Fresno 9.7 Imperial 9.2 Santa Barbara 5.2 San Benito 2.7Strawberries 7 1,340,101 Monterey 32.8 Ventura 27.3 Santa Barbara 17.3 Santa Cruz 11.5 Orange 3.6Oranges 8 1,055,666 Tulare 53.6 Kern 25.3 Fresno 15.2 Ventura 2.0 San Diego 1.2Hay, Alfalfa 9 1,038,935 Kern 14.5 Tulare 11.8 Imperial 11.2 Fresno 8.8 Merced 7.0Chickens 10 891,702 Merced 32.2 Stanislaus 24.5 San Joaquin 0.8 San Bernardino 0.5 San Diego 0.0Flowers and Foliage 3 11 792,807 San Diego 51.0 Santa Barbara 11.4 Monterey 8.8 San Luis Obispo 7.3 Ventura 6.6Walnuts, English 12 659,803 San Joaquin 20.2 Tulare 14.4 Stanislaus 13.3 Butte 12.1 Sutter 6.8Tomatoes, Processing 13 639,063 Fresno 38.9 San Joaquin 13.1 Yolo 12.1 Colusa 6.6 Kings 5.4Cotton Lint 14 611,344 Fresno 34.5 Kings 29.2 Kern 15.3 Merced 8.9 Tulare 6.0Rice (Excl. Seed) 15 580,505 Colusa 28.4 Butte 21.6 Sutter 18.3 Glenn 16.3 Yuba 6.2Broccoli 16 545,689 Monterey 43.0 Santa Barbara 23.6 San Luis Obispo 11.7 Fresno 7.8 Imperial 6.5Carrots 17 535,363 Imperial 15.4 Monterey 3.2 Riverside 2.0 Ventura 0.6 — —Pistachios 18 531,250 Kern 29.4 Madera 28.5 Tulare 13.7 Fresno 13.4 Kings 7.6Peaches, All 19 482,042 Fresno 39.9 Tulare 13.6 Stanislaus 12.9 Kings 8.8 Sutter 5.7Silage, All 20 474,648 Tulare 26.2 Merced 17.4 Stanislaus 12.6 Kings 11.8 Kern 10.5Tomatoes, Fresh Market 21 428,807 Fresno 35.9 San Diego 20.6 Merced 18.9 San Joaquin 14.6 Stanislaus 2.5Onions 22 363,392 Fresno 64.4 Imperial 9.4 San Joaquin 4.8 Kern 4.1 San Benito 3.9Lemons 23 356,040 Ventura 53.8 Tulare 11.0 Riverside 10.7 Kern 8.5 Imperial 4.6Avocados 24 341,492 San Diego 40.2 Ventura 25.6 Santa Barbara 11.8 Riverside 11.6 San Luis Obispo 7.1Celery 25 323,928 Ventura 44.6 Monterey 33.6 Santa Barbara 12.9 San Luis Obispo 4.6 San Benito 2.2Eggs, Chicken 26 284,685 Merced 29.2 Riverside 18.8 San Diego 12.8 San Bernardino 9.3 Stanislaus 8.7Nectarines 27 272,880 Fresno 63.0 Tulare 25.5 Kings 6.4 Kern 1.7 Madera 0.4Plums 28 265,729 Fresno 57.1 Tulare 31.5 Kings 5.2 Kern 4.0 Madera 0.8Plums, Dried 29 260,097 Sutter 26.1 Yuba 17.3 Butte 16.9 Tehama 11.0 Glenn 8.5Peppers, Bell 30 226,598 Riverside 27.4 Ventura 16.8 Kern 14.1 San Benito 12.5 Fresno 7.0Cherries 31 221,405 San Joaquin 54.8 Fresno 13.1 Kern 9.0 Stanislaus 7.4 Tulare 6.7Turkeys 32 195,193 Stanislaus 27.1 Fresno 24.5 Merced 23.2 Kings 8.9 Tulare 3.8Potatoes (Incl. Seed) 33 191,141 Kern 60.9 San Joaquin 11.9 Modoc 6.4 Imperial 5.2 Riverside 5.0Raspberries 34 188,685 Santa Cruz 44.4 Ventura 43.0 Monterey 11.8 — — — —Spinach 35 186,779 Monterey 59.6 Imperial 14.0 San Benito 9.0 Ventura 4.6 Santa Barbara 3.0Salad Greens, Misc. 36 183,871 Monterey 92.2 Imperial 6.5 — — — — — —Pasture and Range, Other 37 181,788 Stanislaus 8.3 Merced 6.8 Monterey 6.0 Tulare 5.9 San Luis Obispo 5.6Cauliflower 38 173,251 Monterey 54.9 Santa Barbara 21.6 Imperial 10.0 San Luis Obispo 6.8 Riverside 2.3Mushrooms 39 164,015 Monterey 44.1 Santa Clara 35.2 San Diego 14.4 San Mateo 5.7 — —Cantaloupe 40 162,026 Fresno 53.6 Imperial 30.0 Merced 8.3 Riverside 2.6 Stanislaus 2.6Wheat (Excl. Seed) 41 130,546 Kern 24.4 Kings 12.6 Tulare 12.3 Imperial 11.7 Fresno 9.7Garlic 42 127,247 Fresno 90.8 Kern 5.9 Kings 1.2 Mono 0.2 Santa Clara 0.2Tangerines 43 124,928 Kern 51.1 Tulare 30.7 Riverside 11.5 Imperial 2.2 San Diego 2.0Cottonseed 44 120,516 Kings 32.1 Fresno 28.3 Kern 21.1 Merced 7.6 Tulare 5.4Potatoes, Sweet 45 114,160 Merced 98.0 Stanislaus 1.8 — — — — — —Apples 46 113,933 San Joaquin 35.4 Kern 19.3 Fresno 10.3 Santa Cruz 9.1 Stanislaus 6.7Pasture, Irrigated 47 104,333 Tulare 11.6 Stanislaus 10.9 Siskiyou 9.0 Merced 8.2 Fresno 4.8Pears 48 95,305 Sacramento 29.4 Fresno 24.2 Mendocino 16.5 Lake 13.2 San Joaquin 2.2Asparagus 49 93,657 San Joaquin 43.8 Monterey 20.4 Fresno 13.8 Imperial 6.7 Sacramento 4.9Corn, Sweet 50 84,779 Imperial 38.2 Fresno 21.3 Contra Costa 15.4 Riverside 7.7 Santa Clara 5.5Artichokes 51 84,661 Monterey 83.3 Riverside 5.7 San Benito 2.4 San Mateo 0.7 — —Watermelon 52 79,563 Fresno 29.2 San Joaquin 25.0 Kern 19.3 Imperial 10.8 Riverside 7.7Cabbage 53 76,601 Monterey 36.1 Ventura 19.7 Imperial 11.3 San Luis Obispo 10.2 Santa Barbara 8.8Beans, Dry 54 75,175 Stanislaus 23.4 San Joaquin 11.5 Ventura 6.2 Colusa 5.8 Kern 5.5Grapefruit 55 66,825 Riverside 60.5 Tulare 18.1 Kern 8.4 Imperial 6.5 San Diego 5.0Sugar Beets 56 66,172 Imperial 65.0 Fresno 18.6 Kern 7.7 Merced 4.5 Kings 2.9Hay, Grain 57 65,624 Kern 17.1 Merced 15.6 Stanislaus 14.3 Yolo 5.9 Modoc 4.7Corn, For Grain 58 62,952 San Joaquin 34.5 Tulare 20.1 Sacramento 12.9 Glenn 6.5 Merced 5.6Dates 59 58,240 Riverside 66.2 Imperial 33.4 — — — — — —Sheep and Lambs 60 57,694 Fresno 18.6 Imperial 16.0 Kern 14.8 Merced 7.6 Solano 7.4Vegetable and Vinecrop Seeds 61 54,927 Colusa 39.1 Fresno 18.5 Imperial 7.7 Santa Barbara 6.6 San Joaquin 5.4Hay, Sudan 62 52,611 Imperial 79.3 Solano 7.7 Riverside 3.9 Stanislaus 3.0 Merced 2.5Hogs and Pigs 63 41,313 Tulare 61.5 Fresno 21.3 Stanislaus 9.3 San Bernardino 2.3 Sacramento 0.8Honeydew 64 38,238 Fresno 41.3 Sutter 18.5 Yolo 11.9 Imperial 11.9 Riverside 3.1Kiwifruit 65 36,729 Tulare 61.2 Butte 10.1 Yuba 10.0 Fresno 6.1 Sutter 2.6Apricots 66 34,489 Stanislaus 35.0 Fresno 28.2 Merced 7.4 Kern 6.5 San Joaquin 5.8Honey 67 32,888 Tulare 52.5 Kern 11.1 San Diego 7.2 Merced 6.3 Riverside 3.7Peas, Green 68 24,647 Monterey 95.4 San Mateo 3.1 — — — — — —Squash 69 23,897 Santa Barbara 18.1 Fresno 14.2 Monterey 8.0 Stanislaus 7.7 Sacramento 5.3Alfalfa Seed 70 22,824 Fresno 41.6 Imperial 39.1 Lassen 0.9 — — — —
1 Trinity County Agricultural Commissioner’s Report was not available at publication. The last year available (2003) was used for this report.2 Includes trees, shrubs, vines, bedding plants, bulbs and turf not included in flowers and foliage.3 Includes cut flowers, potted plants, foliage plants and indoor decoratives.


