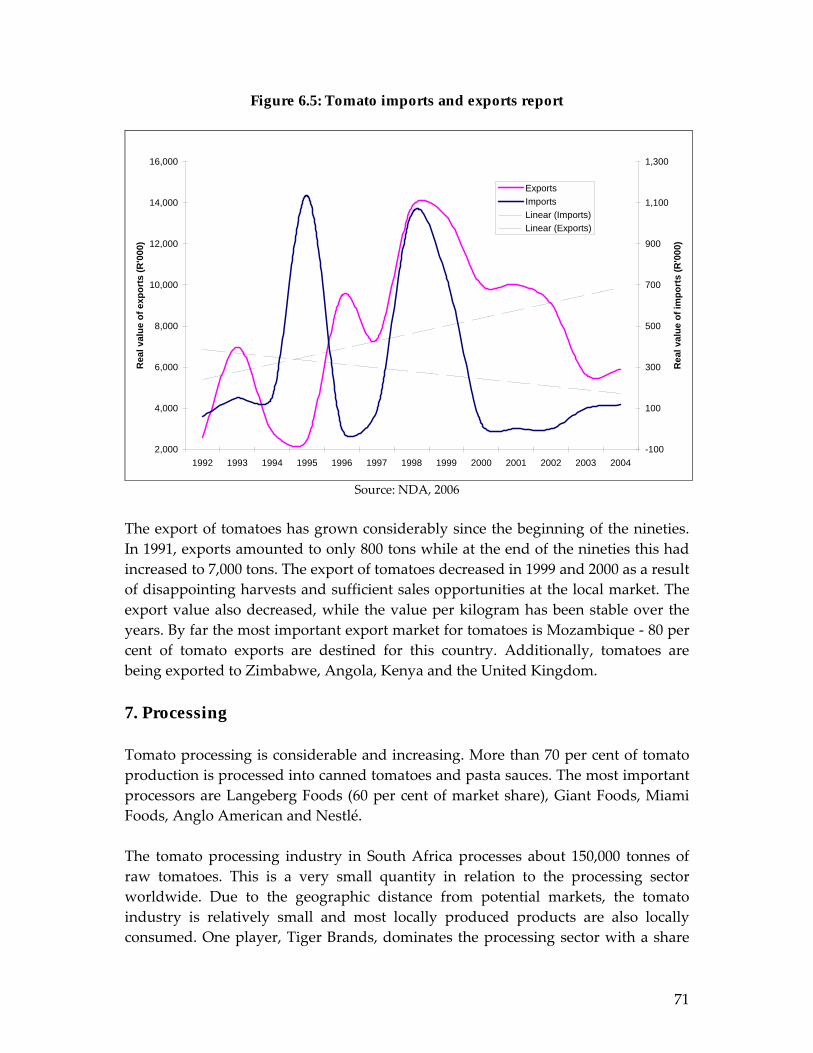
Restructuring food markets in South Africa: Dynamics within the context of the tomato subsector Andre Louw, Davison Chikazunga, Danie Jordaan and Estelle Biénabe University of Pretoria www.regoverningmarkets.org Agrifood Sector Studies Regoverning Markets Small-scale producers in modern agrifood markets
Transcript
Restructuring food markets in South Africa:Dynamics within the context of the tomato subsectorAndre Louw, Davison Chikazunga, Danie Jordaan and Estelle BiénabeUniversity of Pretoria
www.regoverningmarkets.org
Agrifood Sector Studies
Regoverning MarketsSmall-scale producers in modern agrifood markets
Restructuring food markets in South Africa: Dynamics within the context of the tomato
subsector
Andre Louw Davison Chikazunga
Danie Jordaan Estelle Biénabe
Department of Agricultural Economics, Extension and Rural
Development University of Pretoria Pretoria, South Africa
2007
Regoverning Markets
Regoverning Markets is a multi-partner collaborative research programme analysing the growing
concentration in the processing and retail sectors of national and regional agrifood systems and its
impacts on rural livelihoods and communities in middle- and low-income countries. The aim of the
programme is to provide strategic advice and guidance to the public sector, agrifood chain actors,
civil society organizations and development agencies on approaches that can anticipate and manage
the impacts of the dynamic changes in local and regional markets.
Agrifood Sector Studies
These studies look at specific agrifood sectors within a country or region. Research studies have been
carried out in China, India, Indonesia, Mexico, South Africa, Turkey, Poland and Zambia covering the
horticulture, dairy and meat sectors. The sector studies describe the observed market restructuring
along the chains, and the determinants of that restructuring.
The studies were coordinated by:
Jikun Huang, Centre for Chinese Agricultural Plicy (CCAP), China
2.1 The role of agriculture in the South African economy ___________________ 4 2.2 Important agrifood subsectors _______________________________________ 5 2.3 The objectives and key research questions of the study__________________ 7
2.3.1 Research questions______________________________________________ 7 2.3.2 Research hypotheses_____________________________________________ 8
2.4 Organization of the report___________________________________________ 9 3 Changes in the national food system___________________________ 10
3.1 Overall national food market restructuring ___________________________ 10 3.1.1 Introduction__________________________________________________ 10 3.1.2 Patterns in the dynamics of market restructuring ____________________ 12 3.1.3 Trans-nationalization __________________________________________ 19 3.1.4 Determinants of market restructuring _____________________________ 25 3.1.5 Trends in the evolution of procurement systems______________________ 33
3.2 Introduction and methodology of the local meso study ________________ 38 3.3 Demographics of the smallholder agriculture sector ___________________ 40
3.3.1 National agriculture demographics ________________________________ 40 3.3.2 Description of the study areas ____________________________________ 41
3.4 Characterization of the fresh supply chains in the provinces and their procurement strategies _______________________________________________ 42 3.5 Characterization of smallholder farmers and their participation in restructuring supply chains ___________________________________________ 48
3.5.1 Introduction__________________________________________________ 48 3.5.2 Production characteristics _______________________________________ 48 3.5.3 Marketing ___________________________________________________ 50 3.5.4 Constraints for smallholder fresh produce farmers ____________________ 52
3.6. The role of agricultural policy in enhancing smallholders� market access_ 54 3.6.1. AgriBEE ____________________________________________________ 54 3.6.2. Land reform and support programmes _____________________________ 54 3.6.3 Land Redistribution for Agricultural Development (LRAD)____________ 55 3.6.4 Micro Agricultural Finance Schemes of South Africa (MAFISA) ________ 57 3.6.5 Comprehensive Agricultural Support Programme (CASP) _____________ 59
1 Summary The agricultural sector plays an important role in the South African economy and the annual gross domestic product for South African agriculture in 2004 was R67.68 billion. While primary agriculture only accounts for 2.6 per cent of the South African GDP it has upstream or backward linkages on the supply side and downstream or forward linkages on the manufacturing side that account for a further 9 per cent contribution to GDP bringing the contribution of the South African agricultural economy to GDP to around 12 per cent. South Africa is not only self-sufficient in virtually all major agricultural products, but it is also a net food exporter. Important sectors of the South African agricultural economy include broilers, beef, maize, milk deciduous fruit, vegetables, citrus fruit, eggs, sugar cane and potatoes. South Africa�s national food market, like much in South Africa, is characterised by dualism with a very well developed, highly sophisticated food marketing system on the one hand and a well-organized informal food marketing system on the other hand. The highly sophisticated food marketing system is dominated by a small number of retail groups who distribute food through a variety of supermarket formats located in the major cities and towns of South Africa. Conversely, the informal food marketing system distributes food through general dealers, cafes, spaza shops, street vendors, hawkers and tuck shops and street corner stalls in areas like townships and former homelands where supermarket retail outlets are absent or have been until now. The restructuring of the South African food markets is observed through consolidation, trans-nationalization and the emergence and disappearance of supply chain actors. Advanced stages of consolidation are observable in most sectors of the South African food supply chain. They are evident from relatively high levels of concentration observable in food production, processing, wholesale and retailing. Despite reasonably high and rising levels of foreign direct investment in South Africa, inward trans-nationalization into the South African food sector is limited to a few small multinationals. This is, arguably, due to the countryʹs remote geographical position away from industrialised regions. Outward trans-nationalization of South African firms investing outside of South Africa is growing, with many food retailers embarking on regional expansion strategies, primarily into Africa. In terms of emerging and disappearing market agents, fresh produce markets� share in fresh fruit and vegetable wholesaling is declining and being replaced by category managers or category management functions performed by food retails. Retailers also continue to expand into non-traditional areas, which include townships and former homeland areas that have in the past been served by traditional independent stores. The continued expansion of retailers is spearheaded by growth through franchise format stores and forecourt stores. It has also been observed that the
2
encroachment of supermarkets into areas traditionally occupied by the informal markets is displacing these informal markets and the traditional vegetable shops or so-called greengrocers historically found in suburban South Africa. The determinants of this restructuring are not different from other developing countries with these drivers being mainly related to income growth, population growth and urbanization. In the South African context these include increasing disposable incomes, population growth, urbanization and changes in consumer dynamics. The restructuring brought about by these changes includes the evolution of procurement systems. The different retail ownership formats have shown different and also similar approaches to procurement. Corporate stores that are wholly owned by the retailer group are compelled to procure solely from the retailer�s regional distribution centres. The phenomenon where corporate stores only procure fresh produce through their distribution centres that in turn only procure from a few select suppliers is a well established procurement practice that has been in use for over a decade in South Africa. . Wholesalers, independent retailers trading within voluntary trading groups and franchise stores function on very much the same principles as corporate stores and their distribution centres in terms of their procurement practices and the provision of growing contracts to a few selected producers. The only difference is that the retail stores and wholesalers are independently owned and they are allowed to procure products outside the distribution centres directly from producers at their own discretion after the specific producer has been approved as a suitable supplier. The trends in the evolution of procurement systems towards large central procuring systems receiving fresh produce from a limited number of preferred suppliers are creating barriers for smaller scale producers that do not have grower�s programme contracts with retailers. The general findings are that in order for smaller scale farmers to supply supermarkets or wholesalers they need a certain size of production, high quality products, certain size and type of product and consistency in quality and supply, requirements they find difficult to meet consistently. Smaller scale farmers can only have market power if they form cooperatives, which should be established through the help of the government. Generally the restructuring of food chains in South Africa is being driven by similar determinants as in other developing countries. The impact of this restructuring is consolidation and concentration in the food supply chain where larger stakeholders across the chain are displacing the smaller ones. Smaller scale growers, independent wholesalers, corner vegetable shops and a vibrant informal market are being displaced by groups of preferred supplier producers; large regional distribution
3
centres are spread across the country to supply a rapidly growing network of corporate, franchise and voluntary trading group retailers with fresh produce.
4
2 Introduction The central issues of the research into the restructuring of food markets in South Africa are the rapid changes taking place in the structure and governance of local, national, and regional agrifood markets, the implications of these changes for small/medium producers and rural labourers of the restructuring of the food industry and the implications for policies and programs within the context of the agrifood market. The restructuring of the food industry includes consolidation, institutional, organizational and technological transformation, and multinationalisation. There was an urgent need to fill the gap in knowledge regarding the implications and opportunities for small-scale producers and small and medium enterprises of the above food industry restructuring, and how to help these actors to avail themselves of the opportunities and face the challenges of these restructuring markets. In light of this it becomes crucial to identify the best practices for connecting small-scale producers with dynamic markets. This report aims document the process of restructuring within the South African context. 2.1 The role of agriculture in the South African economy The agricultural economy, which includes all economic activities from farming inputs, farming and value adding, is an important sector of the South African economy. The annual gross domestic product for South African agriculture (agriculture, hunting, forestry and fishing) during 2004 was R67.68 billion.1 The South African agricultural sector has grown at an estimated 11.5 per cent per annum since 1965, while the country�s economy as a whole has grown by 14.4 per cent per annum over the same period. This has resulted in a decline of agriculture�s share of the GDP from 9.1 per cent in 1965 to 2.6 per cent in 2005. While primary agriculture only accounts for 2.6 per cent of the South African GDP it has upstream or backward linkages on the supply side and downstream or forward linkages on the manufacturing side that account for another 9 per cent contribution to GDP bringing the contribution of the South African agricultural economy to GDP to around 12 per cent (NDA, 2006). Purchases of goods such as fuel, fertilisers, chemicals, services (banking, insurance) and implements form backward linkages with the manufacturing sector while forward linkages are formed through the supply of raw materials to industry. About 70 per cent of agricultural output is used as intermediate products in manufacturing and related sectors (NDA, 2006).
1 At an exchange rate of R7.20/US$1 (as on 28 August 2006) this equates to US$9.4 billion for 2004.
5
Despite its small direct share of the total gross domestic product (GDP) agriculture remains an important sector in the South African economy because it is a major earner of foreign exchange and the sector creates around 10 per cent of South Africa�s employment opportunities. Agriculture is also an important economic activity in the rural areas where the productive and social activities of rural towns and service centres are centred on their support to primary agriculture and related activities such as agritourism and game farming. It is estimated that more than half of the provinces and about 40 per cent of the countryʹs total population are primarily dependent on agriculture and related industries. In 2002, there were 45,818 official farming units predominantly, but not exclusively, drawn from the white population (StatsSA, 2006). During 2005, the commercial agricultural sector exported an estimated $22.32 billion worth of products, or 7.8 per cent of South Africaʹs total exports. Commercial farms also provide livelihoods to an estimated one million employees (constituting 10 per cent of the South African workforce) and housing for an additional six million family members (NDA, 2001).
Over and above the one million employment opportunities created by the commercial agricultural sector there are also an estimated 1.1 million small farmers, mostly in the communal areas of the former homelands, who provide a livelihood for more than one million of their family members and occasional employment to other people. These farmers produce food to meet their familyʹs needs while also supplying local and regional markets where large numbers of informal traders make a living (NDA, 2006). 2.2 Important agrifood subsectors South Africa covers 1.2 million square kilometres of land with seven climatic regions, from Mediterranean to subtropical to semi-desert. This diversity, together with a long coastline and seven commercial ports, favours the cultivation of a diversity of agricultural products. Agricultural activities range from intensive crop production and mixed farming in winter rainfall and high summer rainfall areas to cattle ranching in the bushveld and sheep and goat farming in the arid regions. While 13 per cent of South Africaʹs land can be used for crop production, only 22 per cent of this is high-potential arable land. The most important limiting factor is water availability. Rainfall is distributed unevenly across the country, with some areas prone to drought (NDA, 2005). South Africa is not only self-sufficient in virtually all major agricultural products, but is also a net food exporter. In terms of value the broiler subsector is the greatest contributor to the South African agricultural economy by gross value contributing
6
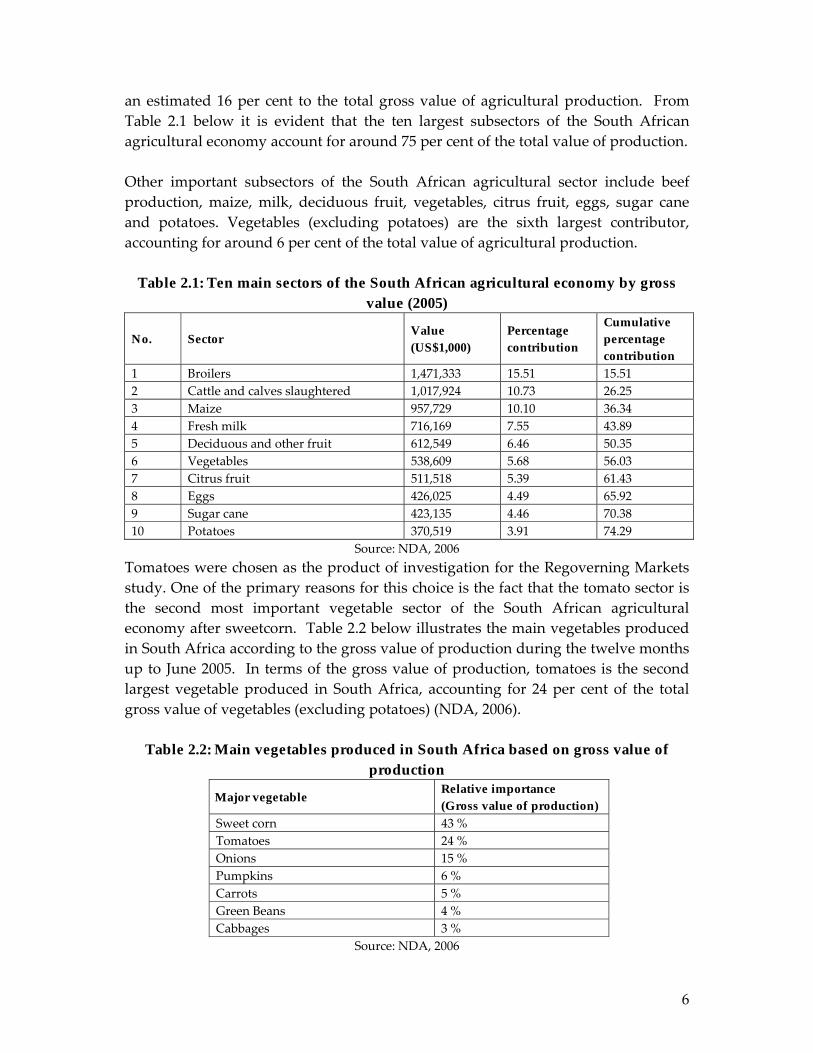
an estimated 16 per cent to the total gross value of agricultural production. From Table 2.1 below it is evident that the ten largest subsectors of the South African agricultural economy account for around 75 per cent of the total value of production.
Other important subsectors of the South African agricultural sector include beef production, maize, milk, deciduous fruit, vegetables, citrus fruit, eggs, sugar cane and potatoes. Vegetables (excluding potatoes) are the sixth largest contributor, accounting for around 6 per cent of the total value of agricultural production.
Table 2.1: Ten main sectors of the South African agricultural economy by gross value (2005)
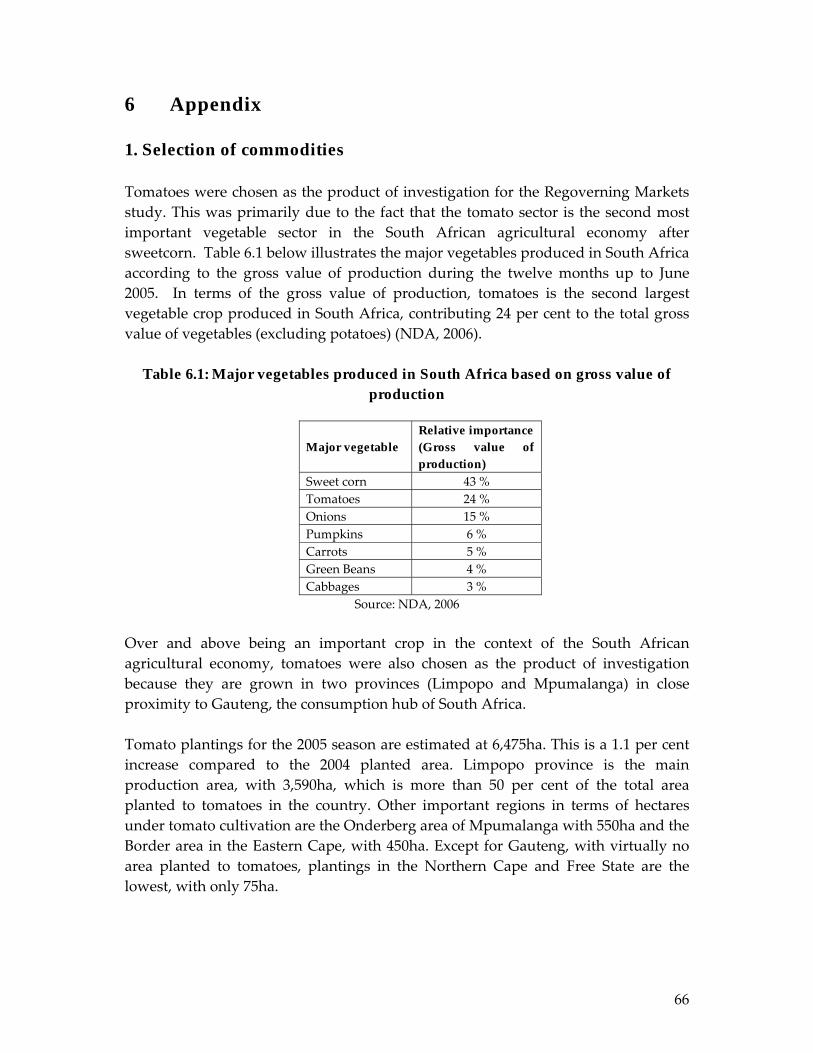
Source: NDA, 2006 Tomatoes were chosen as the product of investigation for the Regoverning Markets study. One of the primary reasons for this choice is the fact that the tomato sector is the second most important vegetable sector of the South African agricultural economy after sweetcorn. Table 2.2 below illustrates the main vegetables produced in South Africa according to the gross value of production during the twelve months up to June 2005. In terms of the gross value of production, tomatoes is the second largest vegetable produced in South Africa, accounting for 24 per cent of the total gross value of vegetables (excluding potatoes) (NDA, 2006).
Table 2.2: Main vegetables produced in South Africa based on gross value of production
Major vegetable Relative importance (Gross value of production)
Over and above being an important crop, tomatoes were also chosen as the product of investigation because they are grown in two provinces (Limpopo and Mpumalanga) in close proximity to Gauteng, the consumption hub of South Africa. 2.3 The objectives and key research questions of the study 2.3.1 Research questions The main research questions are �What drove and drives exclusion and inclusion of small farmers in South Africa?� and can inclusion/exclusion be characterised?
• How can the market restructuring process in South Africa be characterised? • What changes have occurred in supermarkets chains and processing companies
over time? • What changes have occurred in supermarkets� procurement systems? • When have these changes taken place and can different periods be identified? • How are supermarkets expanding (e.g. rise of franchise stores)? • What is the significance of public policy drivers, private strategy drivers and
other macroeconomic factors (exchange rates, etc)? • What are the main market channels and their evolution? • Which market channels have been restructuring and how? Can we properly
distinguish between restructured and traditional markets? (Markets usually considered as traditional can also be dynamic).
• What is the spill over between market channels driven by the restructuring process?
• What role does the informal sector play in market access for smallholders? • What are the different types of farmers in the tomato industry in South Africa
and how and to what extent have they been affected by market restructuring? Does market restructuring drive their exclusion/ inclusion and is it influenced by policy factors? What mix between policy and private strategy drivers actually explains exclusion and/or inclusion in different periods?
• What are the main determinants of exclusion for the different farmer types? Is there any discrimination based on equity in addition to one based on efficiency?
• What is the past, current and future role of public policies with regard to participation of smallholder farmers in restructuring agrifood markets?
• How is AgriBEE policy affecting the procurement system (especially but not only supermarket procurement)?
• Are farmers who benefited from land reform projects in a better position to access dynamic markets than other small farmers?
8
2.3.2 Research hypotheses Many small South African farmers were historically excluded from markets through restrictive Apartheid legislation. This type of exclusion included restricted access to land and markets. This form of exclusion hampered their development. With the removal of this restrictive legislation, their exclusion into restructured markets continues as a result of the restructuring of these markets and the low level of specialization that these farmers are departing from. Based upon these circumstances a number of research hypotheses have been established. These are as follows:
• Increased food quality and safety standards have triggered exclusion of small
farmers. • Evolution of supermarket procurement policies (like minimum quantities,
consistency of supply, minimum quality standards and recently preferential procurement) are increasingly excluding small farmers from these market outlets.
• The rise of a black middle-income class and rapid urbanisation have been determinant in recent restructuring and/ or organic growth of the supermarket chains in South Africa.
• Dissemination of franchise stores is triggering greater inclusion of small farmers into supermarket markets in non urban/ rural areas.
• The distance (transport cost) between small-scale farmers and possible market channels critically affects their inclusion into restructured chains.
• Privatisation of Fresh Produce Markets (and subsequent changes in their wholesale functions) is leading to exclusion of small-scale farmers.
• All the fresh produce market channels have restructured to different extents. • Both white and black smallholder farmers are subject to exclusion from
restructured markets either on efficiency or equity base or both. • Public policies have unintended effects with regard to improving smallholder
farmers participation in restructuring agrifood markets. • Changes in macro-economic conditions (e.g. exchange rates) indirectly result in
exclusion � exporters that re-enter the domestic market increase competition in the domestic market.
• In general, agriculture has a high barrier to entry in South Africa � it is both capital and management intensive. Levels of technology and standards require experience and training � this is an important exclusion issue for all entrants and specifically small farmers in South Africa.
9
2.4 Organization of the report This report is organized into two main sections. The first is the changes in the national food system, which covers the overall national food market restructuring, the patterns of this restructuring, the determinants of this restructuring and the trends in the evolution of procurements systems. The second component focuses on the changes in production and marketing systems of the South African tomato subsector.
10
3 Changes in the national food system South Africa�s national food market, like much in South Africa, is characterised by dualism with a very well developed, highly sophisticated food marketing system on the one hand and a well organized informal food marketing system on the other hand. The highly sophisticated food marketing system is dominated by a small number of retail groups who distribute food through a variety of supermarket formats. Conversely, the informal food marketing system distributes food through spaza shops, street traders and hawkers. Both systems are connected directly and indirectly to farmers as described in Figure 3.1. One of the main intermediaries between farmers and the formal and informal retail sector are the Fresh Produce Markets. These markets are wholesale markets that operate in the main cities of South Africa. As will be explained in this document, the retail groups have increasingly been bypassing the Fresh Produce Markets to deal directly with farmers through the regional and national distribution centres that they have been progressively setting up, although Fresh Produce Markets are used from time to time as a top-up mechanism. 3.1 Overall national food market restructuring This section discusses the overall restructuring of the South African food market from a national point of view. The history and development of the food market in South Africa is reviewed, the patterns of dynamic restructuring discussed and the determinants of this restructuring alluded to. 3.1.1 Introduction When the first diamonds � and later gold � were discovered in the early 1900s in the interior, the first �formal� retailers such as general dealers, hotels and brothels were opened. Importers situated at the coastal harbours were at this stage still dominant in the distribution system, owning some of the wholesalers and retailers in the interior. With the development of an infrastructure in the Johannesburg area, the importers were obliged to locate in this area since this was the growth point in Southern Africa and also the key to the rest of South Africa (Euromonitor International, 2006).
General dealers, who were the major store retailers at the turn of the twentieth century, began to expand, opening branches in different locations. This resulted in the chain-store groups, as they are known today. The supermarket concept appeared in South Africa as early as 1927 when the first steps were taken in establishing a supermarket in South Africa with the opening of the OK Bazaars
11
departmental store in central Johannesburg. The next development was the introduction of department stores. Discount stores and the first supermarkets were introduced during the late forties and at the beginning of the fifties. At this stage there was a growing trend toward urbanisation and the development of suburbs further away from the central business district. During the 1960s, 1970s and 1980s, suburban shopping centres and hypermarkets began developing in the suburbs and retail outlets began growing in size, with the small corner shop format evolving into the larger scale supermarket format. In recent times there has been a general towards diversification in the supermarket format with retailers offering a number of different store formats ranging from franchise stores, through convenience stores to hypermarkets. At present, South Africa possesses a modern infrastructure supporting an efficient distribution of goods to major urban centres throughout southern Africa and well-developed financial, legal, communications, energy and transport sectors. There are many players in the food retail industry in South Africa ranging from highly sophisticated retail chain supermarkets such as Pick n Pay, Shoprite-Checkers, Spar, Woolworths, etc; wholesale outlets such as Makro, Metro, Trade Center, Cash & Carry; independent stores such as Biforce Group, Bargain Group, Shield Wholesalers etc and convenience chain stores including forecourts (gas stations with convenience type stores) (www.euromonitor.com). The supermarket phenomenon has played an important role in food distribution in South African food since the 1980s and is a widely known and well implemented concept in South Africa. Figure 3.1 summarises the development of supermarkets in South Africa.
Figure 3.1: Historical development of supermarkets in South Africa
Source: Botha & van Schalkwyk, 2006
12
In contrast to the well developed retail chain supermarkets a very large and growing informal market, especially for fresh fruit and vegetables, also exists in South Africa in parallel with the sophisticated retail channels mentioned earlier. This informal market is generally prevalent in areas where supermarket retail outlets are absent or have been absent. These areas include many rural regions (especially former homeland areas), townships, taxi ranks, train stations and street corners. The informal market also includes traditional independent stores such as general dealers, cafes, spaza shops, street vendors, hawkers and tuck shops at one end to primitive little street corner stalls at the other end of the retail sector (United States Department of Agriculture, 2005). Under Apartheid rule in South Africa, a unique spatial distribution of the two distinct food distribution systems, as mentioned, developed over time. The highly sophisticated retail chain supermarkets were primarily concentrated in white urban areas (cities and towns) whilst the informal market generally developed in black rural areas such as the former homelands and the townships of many towns and cities where sophisticated retail chain outlets were absent. The result of this dual spatial development of the food distribution network in South Africa was that a divide developed between urban and rural food distribution. This divide will be alluded to later in this report. Seen in the light of the dual food market structure in South Africa, the changes that have been hypothesised to be taking place in the national food marketing system following South Africa�s historical development are detailed in the section below. These changes include the level and nature of consumption, retailing, wholesaling and production. 3.1.2 Patterns in the dynamics of market restructuring This module undertakes a description and analysis of the evolution of the South African food industry segments at a national level over a period of 10-15 years. The patterns observed in the restructuring of food markets in South Africa will be viewed from a supply chain perspective. a. Consolidation patterns Consolidation is defined as the act of combining into an integral whole. Generally speaking, consolidation in South Africa has already taken place in most sectors and can currently be described as �well advanced�. This can be deduced from the levels of concentration in the various tiers of the food supply chain as will be described.
13
This section investigates the various levels of concentration in the production and processing sectors of the South African economy as an indication of the levels of consolidation in the food supply chain.
Production South Africa is characterised by very prominent dualism in its agricultural production. The bulk of South Africa�s agricultural output is produced by a very well developed commercial agricultural sector with a small number of larger-scale producers. However, the rest of South Africa�s agricultural output is supplied by a very large number of producers in a subsistence and/or small-scale agricultural sector. In total, there are an estimated 1.15 million large, medium, small and subsistence farming units in South Africa. Estimates are that 28,728 farms (2.5 per cent of the total number) account for an estimated weighted average of 60 per cent of all agricultural production in South Africa while the remaining 1.12 million farms (97.5 per cent of the total) accounted for the remaining 40 per cent of agricultural production (NDA, 2006; NDA & StatsSA, 2004). The commercial agricultural sector of South Africa is defined as all enterprises that are legally bound to register for value added tax (VAT) because their turnover for a period of twelve months equals or exceeds R300,000. During a 2002 survey, 45,818 farms were identified as currently active and these formed the population of commercial agriculture (NDA & StatsSA, 2004). Over and above the formal agricultural sector, the subsistence and/or small scale sector also contributes to food production in South Africa. This subsector is defined as farming units not required to register for VAT and is primarily, but not solely, seated in the former homelands of South Africa. The Rural Survey of 1997 indicated that some 1.1 million people in the former homelands worked in subsistence or small-scale farming (StatsSA, 1999). Given the lack of regular and reliable statistics the level of consolidation for the whole of the agricultural production sector of South Africa is difficult to illustrate. Consolidation in the production sector of South Africa is especially evident in the formal agricultural sector for which statistics are collected. According to the results of the 2002 Census of Formal Agriculture there were 45,818 active commercial farming units in South Africa in that year as opposed to 57,980 in 1993. This represents a decrease of 12,162 farming units since the last Census of Agriculture in 1993. This equates to a 21 per cent decline between 1993 and 2002 (StatsSA, 2005) and a clear trend towards consolidation in production. With the advantages of scale-economies the concentration and consolidation of commercial farming units in South Africa is expected to increase ceteris paribus. This trend for consolidation is further entrenched by the procurement practices of supermarkets that have set up a policy of procuring from a relatively few, select producers who consistently supply supermarkets with produce within set quality and quantity standards. These
14
producers generally grow and gain relative market share as supermarkets continue to expand in South Africa, which clearly contributes to greater levels of consolidation in production. Further details on these preferred supplier schemes will be given later.
Processing Fedderke and Szalontai (2005) studied the concentration of the South African manufacturing sector for the period 1972 to 1996 during which a number of manufacturing censuses were conducted. They documented a high level of industry concentration in South African manufacturing and a rising trend in concentration across a wide range of industries.
Fedderke and Szalontai�s (2005) findings are summarized in Table 3.1. In terms of the food and food products sector, there is clearly a very high level of concentration with a small number of firms producing the bulk of processed food products in South Africa and in comparison to other sectors the food and food products sector is one of the most concentrated manufacturing sectors in South Africa. It is also notable that historically there has not been any significant increase in the already high level of concentration in the South African food sector since the 1980s. This implies that consolidation in the South African food sector had already taken place prior to the 1980s and the sector is currently at an advanced stage of consolidation. Fedderke and Szalontai (2005) conclude by noting that the South African manufacturing industry maintains a high level of concentration, with a small proportion of firms dominating production in almost all sectors.
Table 3.1: Contribution to output by given percentage of firms
b. Wholesaling patterns Wholesale markets and outlets play a major role in the South African food market. They are especially important for the procurement of products, especially fresh fruit and vegetables. Four forms of wholesaling dominate the South African food sector and the fresh produce sector in particular. The first is Fresh Produce Markets, the second is category managers, the third is direct sales by producers and the fourth is distribution centres.
15
Fresh Produce Markets (FPMs) are a key link in the supply chain and the local municipal authorities around South Africa own seventeen such markets. South African FPMs started out as meeting places between producers and consumers, where they could trade under the control of a government body or official. These places were centrally located and aimed at serving a town and its hinterland. Over time, economic development led to the urbanization of a large portion of the rural population which, in turn, led to the development of central markets that replaced local markets (NAMC, 2002). The value of trade conducted by South African FPMs has in recent times exceeded R5.2 billion per annum. Figure 3.2 details the market share of each of the FPMs in South Africa based on the value of turnover of the respective markets.
Figure 3.2: Share of the different Fresh Produce Markets
Fresh Produce Markets are one of the primary distribution channels for fresh produce and their price setting mechanism is used as the benchmark to price fresh produce that are marketed through other channels. Within the current dispensation all producers have access to FPMs irrespective of their size. The only entry requirement for producers is that the produce must adhere to minimum quality standards, which broadly stipulate that the produce must be safe for human consumption. During the 2004/2005 season an estimated of 18 per cent of deciduous fruit, 8 per cent of citrus fruit, 39 per cent of subtropical, 66 per cent of tropical, 48 per cent of potatoes, 57 per cent of tomatoes and 54 per cent of all other commercially produced vegetables were distributed through FPMs to a number of
16
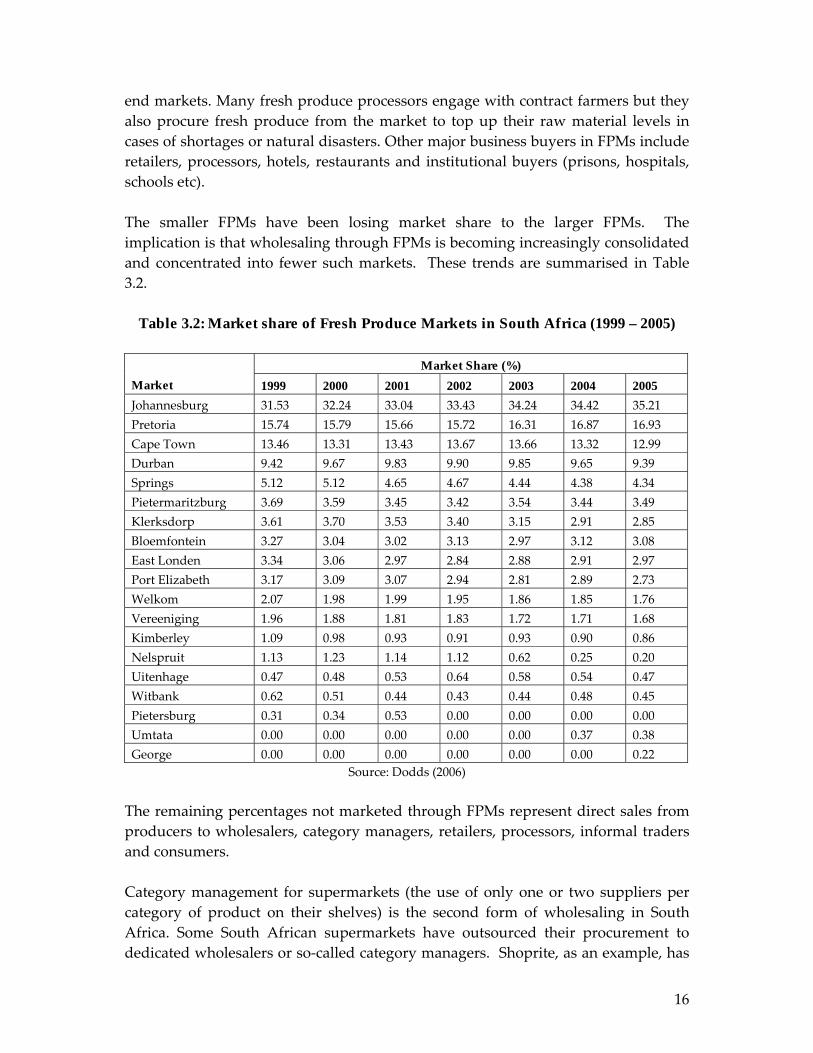
end markets. Many fresh produce processors engage with contract farmers but they also procure fresh produce from the market to top up their raw material levels in cases of shortages or natural disasters. Other major business buyers in FPMs include retailers, processors, hotels, restaurants and institutional buyers (prisons, hospitals, schools etc). The smaller FPMs have been losing market share to the larger FPMs. The implication is that wholesaling through FPMs is becoming increasingly consolidated and concentrated into fewer such markets. These trends are summarised in Table 3.2.
Table 3.2: Market share of Fresh Produce Markets in South Africa (1999 – 2005)
Source: Dodds (2006) The remaining percentages not marketed through FPMs represent direct sales from producers to wholesalers, category managers, retailers, processors, informal traders and consumers. Category management for supermarkets (the use of only one or two suppliers per category of product on their shelves) is the second form of wholesaling in South Africa. Some South African supermarkets have outsourced their procurement to dedicated wholesalers or so-called category managers. Shoprite, as an example, has
17
its own distribution wholesale network or category manager (Freshmark) dedicated to the procurement of fruits and vegetables for Shoprite. Suppliers deliver mainly to Freshmark�s wholesale or distribution centres where products from various suppliers are received, repacked into consignments for different stores and then delivered to the respective stores. Although not a food distributor, another example of category management is exhibited by leading operator Massmart who operates two major buying alliances, Shield and Furnex, alongside its wholesale network. Shield and Furnex both serve over six hundred members and retail outlets. The third wholesaling format in South Africa is that of direct sales by producers. Direct sales include sales through roadside or farm stalls near large cities, sales to hawkers and informal traders. Mollen (1967) argues that quality considerations, freshness and the availability of specialized farmers� facilities are some of the reasons for the existence of direct channels for fresh produce. However, in view of the varying qualities and varieties of the products to be marketed and the wide geographical distribution of users, direct channels can only do supply a fraction of the demand. The bulk of fresh produce moves through more complicated semi-direct and indirect channels. According to Morris (1992), informal trade plays a significant role in South Africa, largely due to a history of township living. Shebeens, spaza shops and street hawkers generate large volumes of product sales on a national scale. Research conducted by Myburgh (1997) on low-income communities on the Cape Flats revealed that consumers purchase 80 per cent to 90 per cent of all food items from widely dispersed informal traders. An avocado consumer survey conducted in 1998 showed that 58 per cent of avocados are bought from street hawkers. The level of consolidation in the informal sector has proven difficult to ascertain since very little information is available for this sector. Distribution centres are a quasi form of wholesaling and the fourth form of wholesaling identified in South Africa. Distribution centres are short-term storage centres located close to the major retail market outlets in South Africa to facilitate the rapid processing of orders and shipment of fresh fruit and vegetables to the various supermarket stores in the region. All the major food retailers in South Africa operate some sort of distribution centre to supply their retail stores with fresh produce. Freshmark, as a category manager cum wholesaler, services 480 Shoprite/Checkers stores from six distribution centre branches that have their own team of buyers. These distribution centres are distributed across South Africa and are located in Centurion, Durban, Cape Town, Port Elizabeth, Bloemfontein and Polokwane. Woolworths operates a centralised procurement system consisting of five national buying centres located in Cape Town, Durban, Port Elizabeth, Johannesburg and Nelspruit that deals with producers through contracts. Pick n Pay�s procurement system can be described as decentralised with only four distribution centres in the
18
country that have been in operation for the past ten years. They run a dedicated distribution network for fresh fruit and vegetables. Spar�s distribution and procurement system works on a similar basis to that of Pick n Pay, the only difference being that Spar�s distribution centre is technically an independent wholesaler working within a voluntary trading group. The importance of distribution centres within the context of food distribution in South Africa has grown in the past ten to fifteen years and increasing quantities of fresh fruit and vegetables consumed in South Africa are channelled through these centres. This implies that consolidation in the wholesaling sector for food products in South Africa is being concentrated within the distribution centres of supermarkets. c. Retailing patterns Retailing in South Africa and specifically the retailing of fresh produce mirrors the dual economic system of South Africa, where a sophisticated, developed economy exists alongside a developing economy. Fresh produce is marketed to a formal sector (consisting of a relatively small number of large traders) and an informal sector (consisting of a relatively large number of small traders) (NAMC, 2002). Botha and van Schalkwyk (2006) describe the formal retail sector as a wide spectrum of neighbourhood convenience stores, speciality stores, boutiques, chain supermarket stores, department stores and large wholesale and retail outlets. The formal retailing sector in South Africa and the supermarket phenomenon continue to grow both organically and through displacement of informal retail outlets. Supermarkets reportedly now account for the major share of retail turnover in South Africa, controlling more than 55 per cent of national food retail (Weatherspoon & Reardon, 2003). South Africa has a mature and developed retail market, solely occupied by domestic retailers. The domestic companies have developed broad and proficient networks within the country. Over the past decade in particular, retailers have shaped themselves into large and diverse chains by acquisitions and organic growth and the development of new formats. With this development came the sophistication of supply chain and procurement methods. Retailers improved their buying strategies and have, especially since the end of apartheid, begun to move beyond the richer, urban areas and adapted their concepts to service poorer and rural areas. The development of large, specially designed, shopping centres and �megamalls� that house a large variety of shops and services also continues along with out-of-town regional shopping centres, especially in the outskirts of large towns and cities (Food and Agriculture Organization, 2003).
19
The level of consolidation in South African retail, and specifically food retail is high. The formal food retailing industry in South Africa is currently dominated by four chain-related supermarkets: Pick �n Pay, Shoprite, SPAR and Woolworths, with a 33.06 per cent, 30.69 per cent, 13.54 per cent and 12.03 per cent share of the market, respectively. These four major players have a combined market share of 94.5 per cent. Botha and van Schalkwyk (2006) investigated the level of concentration in the food retailing sector in South Africa and concluded that the South African food retail industry can be characterized as an extremely tight oligopoly. Notwithstanding the existence of a very large number of informal retail outlets the level of consolidation in the food retailing sector is well advanced and confirms the observation that the South African retail sector is mature. 3.1.3 Trans-nationalization The occurrence of trans-nationalization in the South African food sector is generally limited. Despite the reasonably high and rising levels of foreign direct investment in South Africa, few, if any, producers or foreign retailers are currently present in the South African market. It is argued that two major reasons for this situation are the countryʹs remote geographical position away from industrialised regions and the state of consolidation and competitiveness of South Africa�s production, processing, wholesaling and retailing sectors. However, there are three instances of trans-nationalization that clearly impact on the dynamics of market restructuring in South Africa. The first is at processing level, the second at wholesaling level and the third is at retail level:
i. Processing level The first instance of trans-nationalization in the South African food chain is identified at the processing level. It is inward trans-nationalization where a number of multinational companies are conducting business in the South African food processing sector. A number of multinational companies like Nestlé, Parmalat, and Heinz currently undertake the processing of food products in South Africa. Foreign direct investment in the South African processing sector has a long history starting in 1916 when Nestlé first invested in South Africa. Since then a number of other multinational firms have entered the food processing sector.
ii. Wholesale level The second instance of trans-nationalization in the South African food chain is identified at wholesale level. It is inward trans-nationalization where multinational companies are conducting business in the South African food wholesale sector. The specific example is where large multinational companies who are primarily fruit
20
exporters are reportedly becoming increasingly involved in fruit marketing in the South African domestic market as a strategy to diversify their offerings. Fruit export companies that procure fruit for export are ideally suited to also procure fruit for the South African market and act as quasi category managers for fruit for many retailers. This suits retailers who are increasingly showing a preference for category managers to fulfill the procurement function rather than doing it in�house. The extent of this trans-nationalization, however, remains limited at this stage.
iii. Retail level The third instance of trans-nationalization in the South African food chain is identified at retail level. It is outward trans-nationalization where South African companies are conducting business in the food retailing sector beyond South African borders. All South African retailers have embarked on regional expansion strategies primarily into Africa. Weatherspoon and Reardon (2003) poignantly note that supermarket development in Africa in the past decade has taken place in the �largest and/or richest� countries � and then spread through foreign direct investment (FDI) from those countries into the smaller and/or poorer countries.
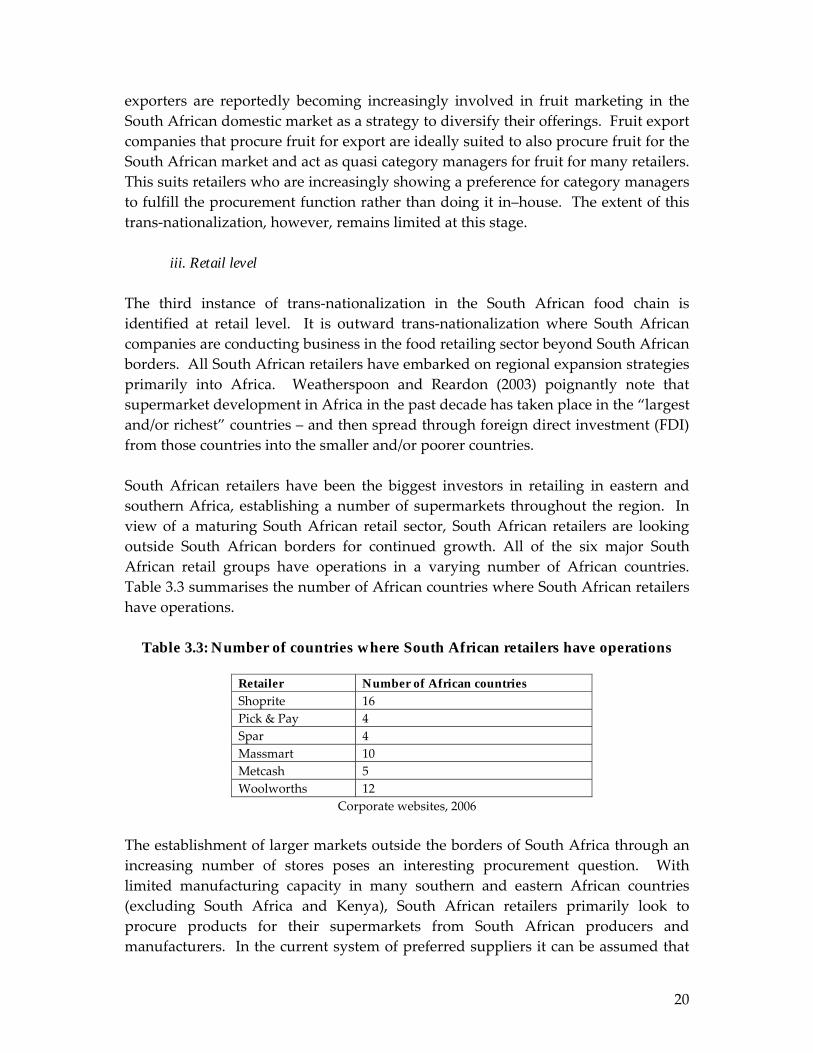
South African retailers have been the biggest investors in retailing in eastern and southern Africa, establishing a number of supermarkets throughout the region. In view of a maturing South African retail sector, South African retailers are looking outside South African borders for continued growth. All of the six major South African retail groups have operations in a varying number of African countries. Table 3.3 summarises the number of African countries where South African retailers have operations.
Table 3.3: Number of countries where South African retailers have operations
Retailer Number of African countries Shoprite 16 Pick & Pay 4 Spar 4 Massmart 10 Metcash 5 Woolworths 12
Corporate websites, 2006 The establishment of larger markets outside the borders of South Africa through an increasing number of stores poses an interesting procurement question. With limited manufacturing capacity in many southern and eastern African countries (excluding South Africa and Kenya), South African retailers primarily look to procure products for their supermarkets from South African producers and manufacturers. In the current system of preferred suppliers it can be assumed that
21
very few new suppliers are accepted but rather current suppliers grow along with the growing market. Emerging and disappearing market agents Market restructuring in the South African food supply chain is also characterised by the emergence and disappearance of market agents or supply chain role-players. In terms of the supply chain approach followed thus far, emergence and disappearance of market agents is most evident in the wholesaling and retail sectors of the South African food supply chain.
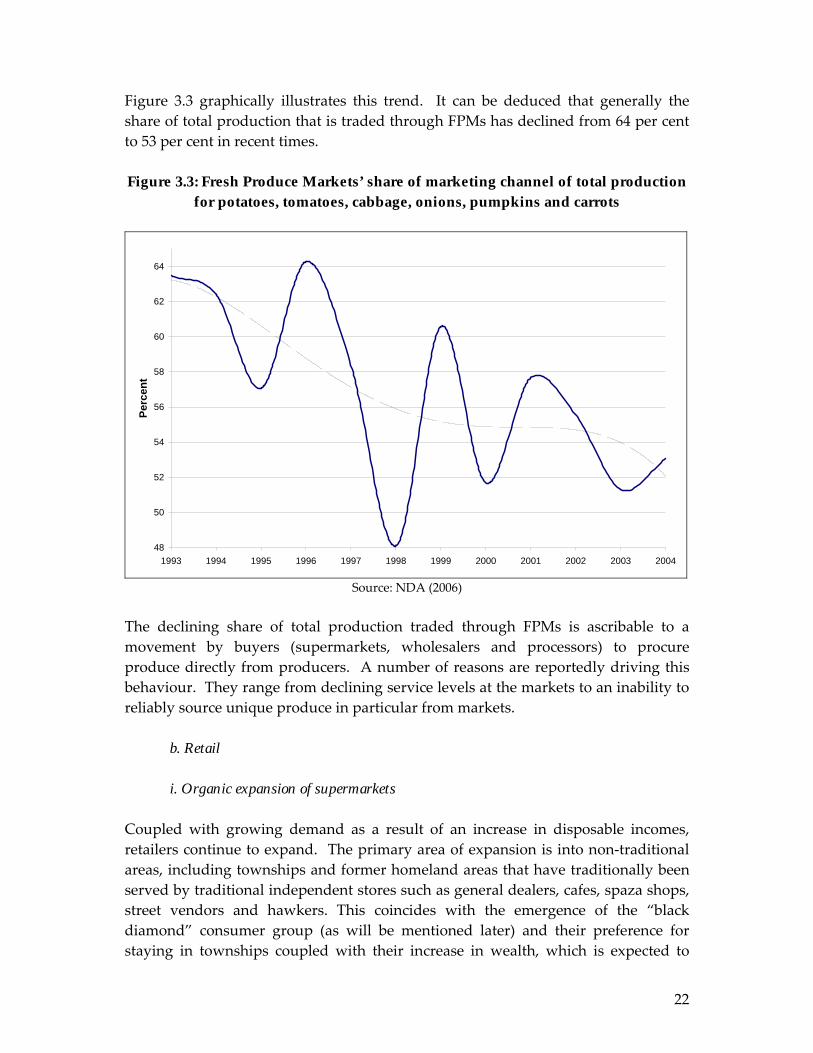
a. Wholesaling In the wholesaling sector of the South African food chain the emergence and disappearance of a number of supply chain role players is evident. Firstly, category managers started appearing in South Africa almost two decades ago and have grown in importance since then. Freshmark was the first category manager to emerge within the fresh fruit and vegetable supply chain. It fulfils the fresh fruit and vegetable procurement function for Shoprite/Checkers. Freshmark was established fifteen years ago and in that period 70 per cent of the fresh produce requirement was sourced from Fresh Produce Markets. With the development of Freshmark and its procurement systems this percentage has been significantly reduced and currently most of the procurement needs are met through preferred supplier growing contracts with only a small proportion being procured from FPMs when the need arises. In time, the other retail chains followed suit by setting up their own food distribution centres rather than outsourcing this function as Shoprite/Checkers did with Freshmark. This implies that supermarkets use only a few suppliers to procure per category of product on their shelves. This trend is placing FPMs under pressure and as will be illustrated, these markets are expected to play an increasingly small role in the retailer�s sourcing strategy, to the detriment of all small producers � both established and emerging (NAMC, 2002). Secondly, as noted, FPMs are currently losing market share. Wholesale fresh produce markets, as described earlier, have historically played a very important role in the marketing of fresh produce in South Africa. FPMs, like much of the rest of the food industry, are subject to market changes. The most obvious of these changes is the declining share of FPMs as an avenue for producers to dispose of their produce. An aggregate for the six most important vegetables (potatoes, tomatoes, cabbage, onions, pumpkins and carrots), which account for 84 per cent of fresh produce sold on the basis of volume sold on FPMs, shows a clear decline in the share of total production that is traded through these markets (NDA, 2006).
22
Figure 3.3 graphically illustrates this trend. It can be deduced that generally the share of total production that is traded through FPMs has declined from 64 per cent to 53 per cent in recent times. Figure 3.3: Fresh Produce Markets’ share of marketing channel of total production
for potatoes, tomatoes, cabbage, onions, pumpkins and carrots
The declining share of total production traded through FPMs is ascribable to a movement by buyers (supermarkets, wholesalers and processors) to procure produce directly from producers. A number of reasons are reportedly driving this behaviour. They range from declining service levels at the markets to an inability to reliably source unique produce in particular from markets.
b. Retail
i. Organic expansion of supermarkets Coupled with growing demand as a result of an increase in disposable incomes, retailers continue to expand. The primary area of expansion is into non-traditional areas, including townships and former homeland areas that have traditionally been served by traditional independent stores such as general dealers, cafes, spaza shops, street vendors and hawkers. This coincides with the emergence of the �black diamond� consumer group (as will be mentioned later) and their preference for staying in townships coupled with their increase in wealth, which is expected to
23
drive the development of infrastructure in the townships. Burgeoning urbanization (as discussed later) is also leading to the expansion of South African towns and cities, resulting in an increasing need for, amongst other things, food distribution networks to deliver convenience goods to new residential areas.
Figure 3.4 illustrates the growth in total supermarket store numbers between 1999 and 2006 and the predicted growth in supermarket store numbers from 2006 to 2011.
Figure 3.4: Number of supermarket style stores in South Africa (1999 – 2011)
2,000
2,200
2,400
2,600
2,800
3,000
3,200
3,400
3,600
3,800
1999 2001 2003 2005 2007 2009 2011
Num
ber o
f sto
res
PREDICTED
Source: Planet Retail (2006)
The growth in both store numbers and sales area for supermarkets in South Africa is marked with double and in some instances even triple digit growth. Table 3.4 details the growth in store numbers and sales area per retail group.
24
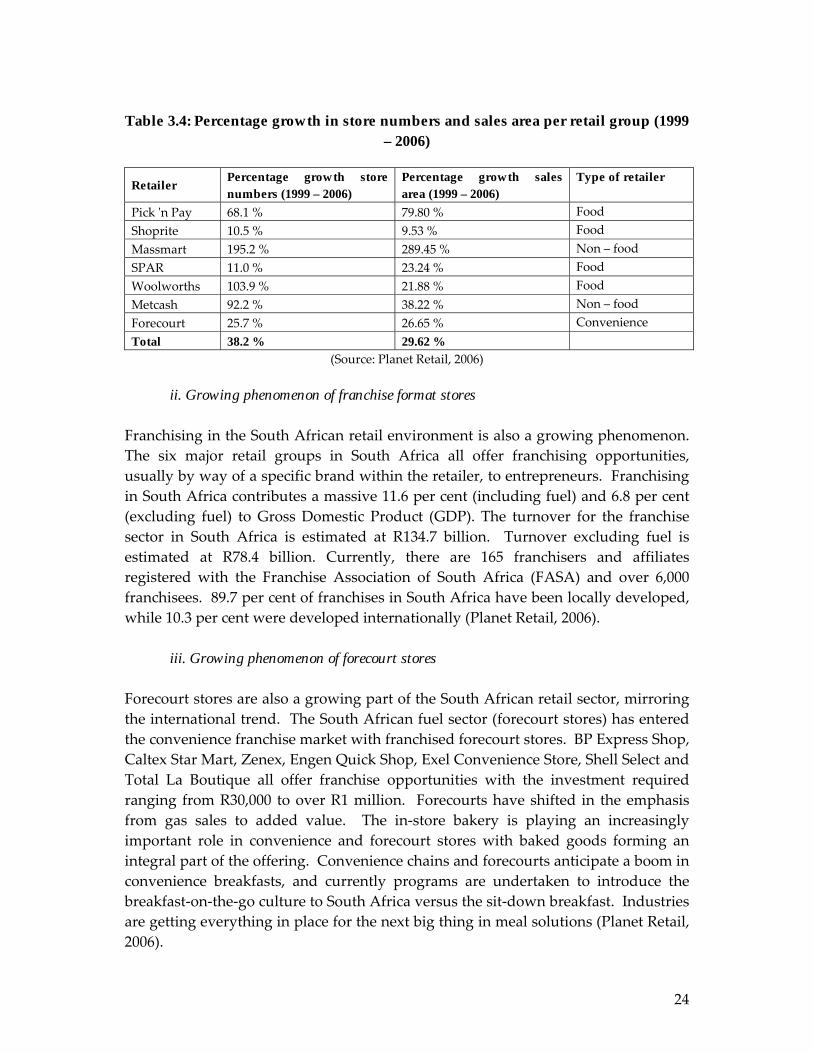
Table 3.4: Percentage growth in store numbers and sales area per retail group (1999
– 2006)
Retailer Percentage growth store numbers (1999 – 2006)
ii. Growing phenomenon of franchise format stores Franchising in the South African retail environment is also a growing phenomenon. The six major retail groups in South Africa all offer franchising opportunities, usually by way of a specific brand within the retailer, to entrepreneurs. Franchising in South Africa contributes a massive 11.6 per cent (including fuel) and 6.8 per cent (excluding fuel) to Gross Domestic Product (GDP). The turnover for the franchise sector in South Africa is estimated at R134.7 billion. Turnover excluding fuel is estimated at R78.4 billion. Currently, there are 165 franchisers and affiliates registered with the Franchise Association of South Africa (FASA) and over 6,000 franchisees. 89.7 per cent of franchises in South Africa have been locally developed, while 10.3 per cent were developed internationally (Planet Retail, 2006).
iii. Growing phenomenon of forecourt stores Forecourt stores are also a growing part of the South African retail sector, mirroring the international trend. The South African fuel sector (forecourt stores) has entered the convenience franchise market with franchised forecourt stores. BP Express Shop, Caltex Star Mart, Zenex, Engen Quick Shop, Exel Convenience Store, Shell Select and Total La Boutique all offer franchise opportunities with the investment required ranging from R30,000 to over R1 million. Forecourts have shifted in the emphasis from gas sales to added value. The in-store bakery is playing an increasingly important role in convenience and forecourt stores with baked goods forming an integral part of the offering. Convenience chains and forecourts anticipate a boom in convenience breakfasts, and currently programs are undertaken to introduce the breakfast-on-the-go culture to South Africa versus the sit-down breakfast. Industries are getting everything in place for the next big thing in meal solutions (Planet Retail, 2006).
25
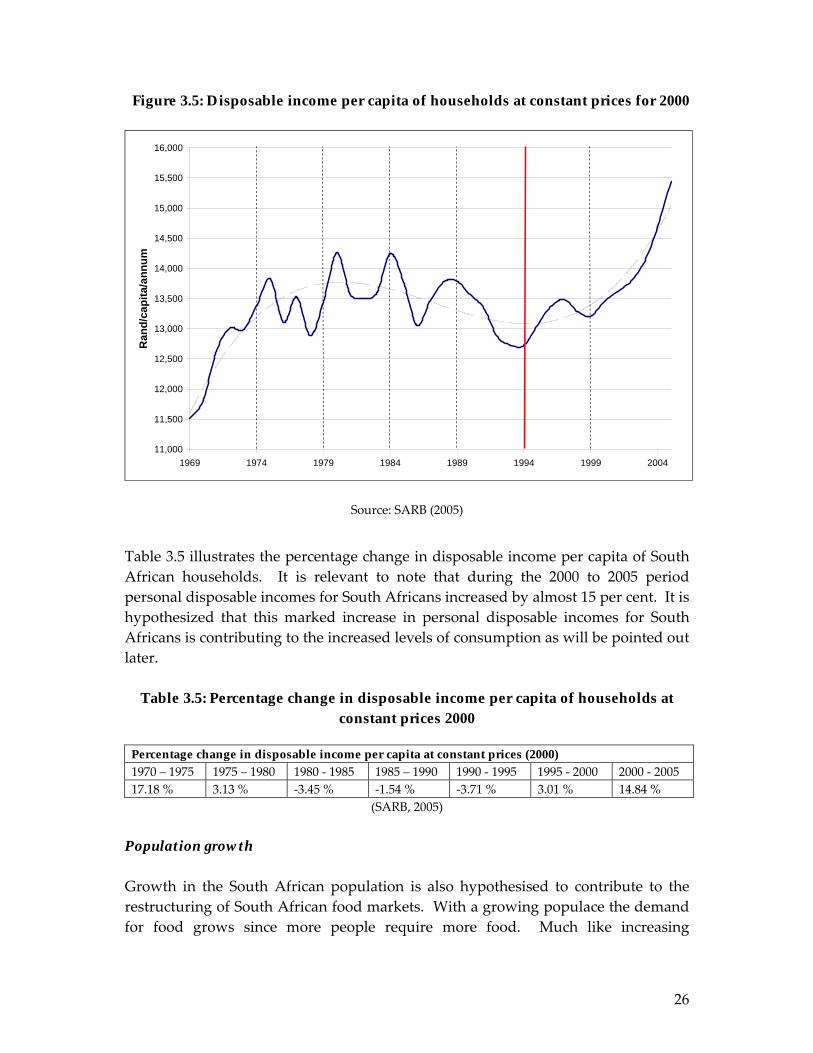
Displacement of informal retailers and speciality stores Although South Africa�s informal economy or the second economy as it is also referred to has been one of the largest employment creators in recent times it is also facing a number of challenges and threats. One of the primary threats is the encroachment of supermarkets into areas traditionally occupied by the informal market. There is, for example, strong evidence that the informal sector is losing significant market share as a result of the encroachment of supermarkets into the territories occupied by the informal sector. Reportedly between 2003 and 2005 spaza shops� turnover in some areas was reduced by as much as 22 per cent (ACHIB, 2006). Traditional vegetable shops or greengrocers are reportedly also being displaced or disappearing completely as a result of their inability to compete on cost and product ranges against large food retail groups. This trend has become more evident since supermarkets have begun paying greater attention to fresh fruit and vegetables as profitable product lines in their operations and devoting resources into research and development to offer consumers new and interesting products. 3.1.4 Determinants of market restructuring Drivers of supermarket growth in South Africa are not different from other developing countries and relate mainly to income growth, population growth and urbanization. These drivers are discussed below within the South African context. Increasing disposable incomes Increasing disposable incomes in South Africa have been identified as the one of the major trends driving restructuring in the overall South African food market. Increasing incomes are expected to fuel the demand for consumer goods, which in turn fuels the expansion of supermarkets. Figure 3.5 illustrates the per capita disposable income of households in South Africa from 1969 to 2005. Periods of growing personal disposable incomes in South Africa are from the late 1960s to the early 1980s and again from 1994 onwards. From the early 1980s to 1994 a period of declining personal disposable incomes occurred. These trends coincide with South Africa�s political history and the accompanying economic conditions, which have seen the growth in supermarkets as described.
26
Figure 3.5: Disposable income per capita of households at constant prices for 2000
11,000
11,500
12,000
12,500
13,000
13,500
14,000
14,500
15,000
15,500
16,000
1969 1974 1979 1984 1989 1994 1999 2004
Ran
d/ca
pita
/ann
um
Source: SARB (2005)
Table 3.5 illustrates the percentage change in disposable income per capita of South African households. It is relevant to note that during the 2000 to 2005 period personal disposable incomes for South Africans increased by almost 15 per cent. It is hypothesized that this marked increase in personal disposable incomes for South Africans is contributing to the increased levels of consumption as will be pointed out later.
Table 3.5: Percentage change in disposable income per capita of households at
Population growth Growth in the South African population is also hypothesised to contribute to the restructuring of South African food markets. With a growing populace the demand for food grows since more people require more food. Much like increasing
27
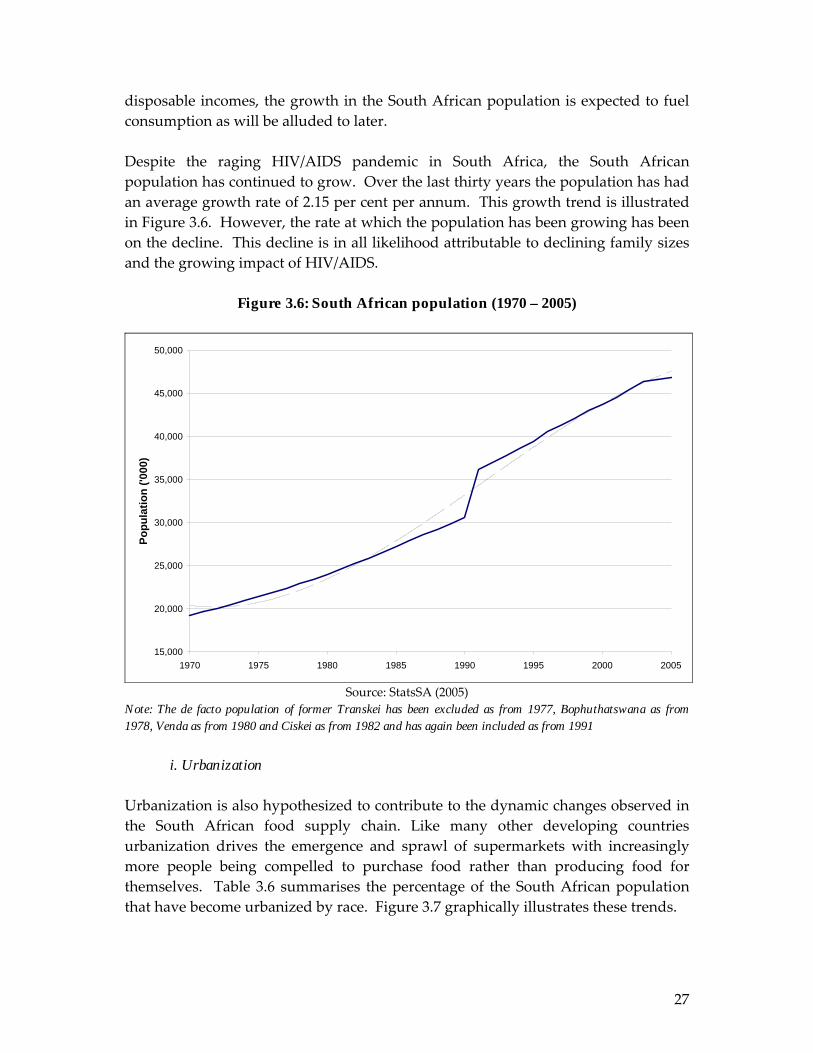
disposable incomes, the growth in the South African population is expected to fuel consumption as will be alluded to later. Despite the raging HIV/AIDS pandemic in South Africa, the South African population has continued to grow. Over the last thirty years the population has had an average growth rate of 2.15 per cent per annum. This growth trend is illustrated in Figure 3.6. However, the rate at which the population has been growing has been on the decline. This decline is in all likelihood attributable to declining family sizes and the growing impact of HIV/AIDS.
Figure 3.6: South African population (1970 – 2005)
15,000
20,000
25,000
30,000
35,000
40,000
45,000
50,000
1970 1975 1980 1985 1990 1995 2000 2005
Popu
latio
n ('0
00)
Source: StatsSA (2005)
Note: The de facto population of former Transkei has been excluded as from 1977, Bophuthatswana as from 1978, Venda as from 1980 and Ciskei as from 1982 and has again been included as from 1991
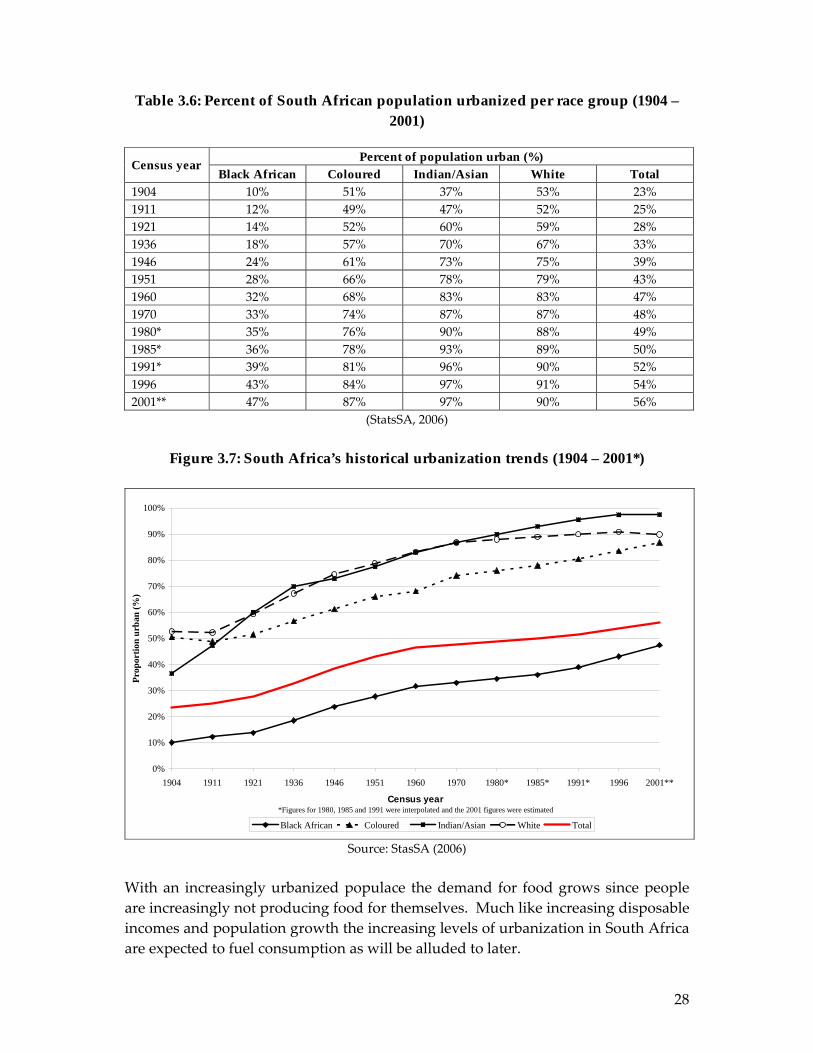
i. Urbanization Urbanization is also hypothesized to contribute to the dynamic changes observed in the South African food supply chain. Like many other developing countries urbanization drives the emergence and sprawl of supermarkets with increasingly more people being compelled to purchase food rather than producing food for themselves. Table 3.6 summarises the percentage of the South African population that have become urbanized by race. Figure 3.7 graphically illustrates these trends.
28
Table 3.6: Percent of South African population urbanized per race group (1904 – 2001)
Census year*Figures for 1980, 1985 and 1991 were interpolated and the 2001 figures were estimated
Prop
ortio
n ur
ban
(%)
Black African Coloured Indian/Asian White Total
Source: StasSA (2006) With an increasingly urbanized populace the demand for food grows since people are increasingly not producing food for themselves. Much like increasing disposable incomes and population growth the increasing levels of urbanization in South Africa are expected to fuel consumption as will be alluded to later.
29
ii. Changes in consumption
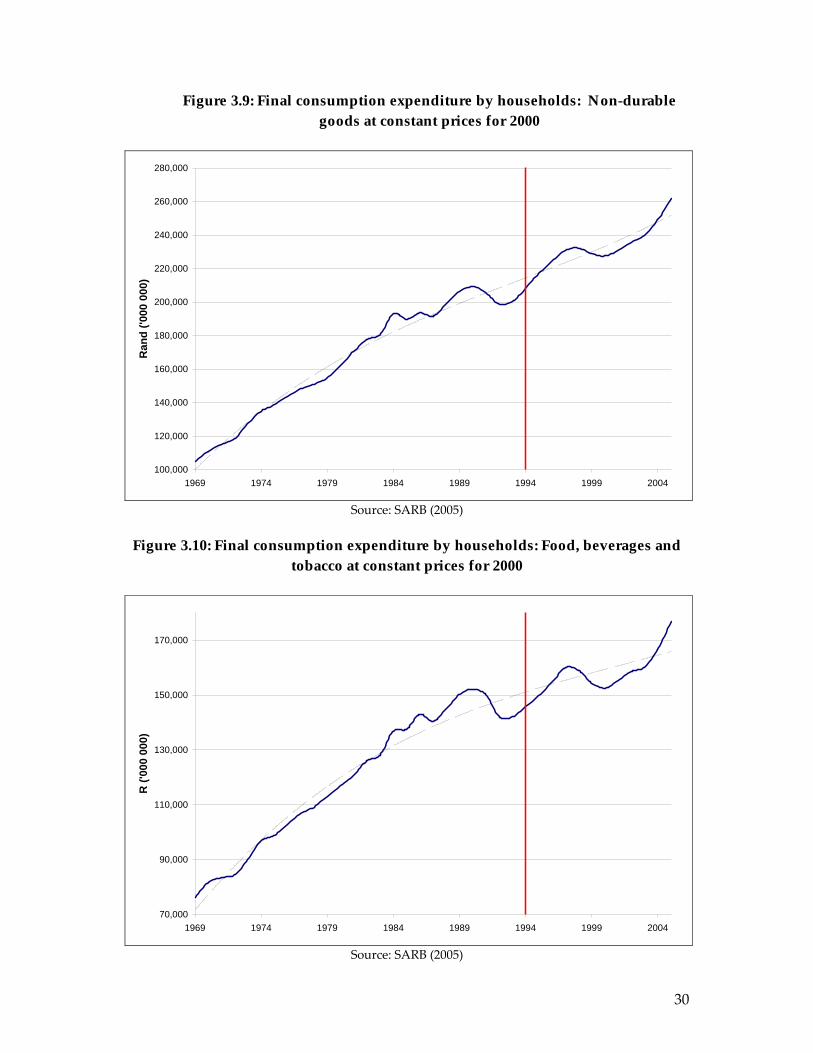
The impact of increasing disposable incomes, population growth and urbanization is that it fuels consumption. Consumption levels in South Africa for durable, non-durable and consumable goods have been growing the past twelve years since democratization. Figures 3.8, 3.9 and 3.10 graphically illustrate these trends in consumption. The consumption of durable goods has increased by 86 per cent, that of non-durable goods by 26 per cent and that of food, beverages and tobacco by 21 per cent in real terms since democratization in 1994 (SARB, 2006).
Figure 3.8: Final consumption expenditure by households: Durable goods at constant prices for 2000
20,000
30,000
40,000
50,000
60,000
70,000
80,000
1969 1974 1979 1984 1989 1994 1999 2004
Ran
d ('0
00 0
00)
Source: SARB (2005)
30
Figure 3.9: Final consumption expenditure by households: Non-durable goods at constant prices for 2000
100,000
120,000
140,000
160,000
180,000
200,000
220,000
240,000
260,000
280,000
1969 1974 1979 1984 1989 1994 1999 2004
Ran
d ('0
00 0
00)
Source: SARB (2005)
Figure 3.10: Final consumption expenditure by households: Food, beverages and
tobacco at constant prices for 2000
70,000
90,000
110,000
130,000
150,000
170,000
1969 1974 1979 1984 1989 1994 1999 2004
R ('
000
000)
Source: SARB (2005)
31
The impacts of increasing disposable incomes, population growth and urbanization on increasing levels of consumption are clear. This growth in consumption fuels the demand for consumer goods, including food, which in turn fuels the demand for food outlets like supermarkets, which in turn fuels innovations and dynamic changes surrounding supermarkets, their functioning and their procurements systems. Changes in consumption and consumer behaviour Over and above increasing levels of consumption, consumer dynamics are also hypothesized to contribute to the dynamic changes and restructuring being observed in the South African food sector that were noted earlier. The most pertinent changes in consumer dynamics observable in South Africa are the emergence of a black middle class (�black diamonds�), which is fuelling consumption, and the increasing importance of food safety and quality standards.
i. Black diamonds The emerging black middle classes in South Africa have been described as the �black diamonds�. This emerging group of consumers is developing as a result of the social and economic reforms that have been taking place in South Africa since the country�s democratization in 1994. It has been estimated that the buying power of this group is about $19bn per annum which equates to almost a quarter of South Africa�s total consumer spending power of $88bn per annum. The �black diamond� group is thought to comprise approximately two million black people, and estimates are that this group has grown by a staggering 368 per cent between 1998 and 2004. Research also shows that the black middle classes differentiate themselves from the white middle class by their culture and roots. Black people are more influenced by traditions, customs, laws and social purpose. Self-respect and dignity were also found to be of great importance to black respondents, and all these factors influence buying decisions (Mawers, 2004).
Estimates are that the total buying power of black people in South Africa as a proportion of total personal disposable income in the economy doubled between 1960 and 2003 to 46 per cent, while that of whites dropped from 69 per cent to 41 per cent. As the black market has become more affluent due to an improved social and economic climate, there has been a dramatic rise in consumer spending (BMR, 2004).
ii. Growing importance of food quality and safety standards and innovation
In many respects, the South African market reflects global trends. European market trends are leaning specifically towards organic foods, although this may not have
32
reached its peak. Ready-to-eat meals, street foods and take-aways are also growing in popularity, forcing the manufacturing and retail sector to provide food that is easily transported and quick to deliver.
As far as genetically-modified (GM) food is concerned, it has been more readily accepted in the US than in Europe. In general, however, GM food has been driven by producer-level efficiency since it is cheaper to produce. Consumers, on the other hand, have complained that they do not see any particular benefits associated with GM food products and are, therefore, still reluctant to embrace this new technology. In South Africa it is important to note that a large part of our population live around the breadline and rely on staple foods, while a certain sector is quite affluent. Lifestyle factors such as time poverty, a growing awareness of nutrition and concerns about the impact of mass-produced foods, many of which have been genetically modified, have contributed to the popularity of deli food. The growing importance of food quality and safety standards and innovation in the food sector necessitate food supply chain systems that can deliver these qualities reliably and cost effectively to consumers. Food retailers have developed and implemented systems that can guarantee these qualities in food cost effectively through countrywide networks. Traditional food outlets are, however, at a distinct disadvantage as a result of their size and are generally incapable of providing the necessary guarantees demanded by consumers. The need for supermarkets to provide food products that consumers demand therefore fuels restructuring in the food supply chain to provide innovative food of high and guaranteed quality. Other factors Other factors that have fostered the growth of supermarkets are the increasing availability of electricity and the improvement of public infrastructure (BFAP, 2006). However there is one driver that is not responsible for the growth, namely FDI. Foreign direct investment in South Africa has risen steadily since the early 1980s with a notable and significant rise in the period following the first democratic elections in 1994. Despite the reasonably high and rising levels of foreign direct investment in South Africa there is very little evidence of it in the South African food supply chain. FDI into South Africa is generally of a short term speculative nature, which is typical for a developing country. Very little interest is currently being shown in long term investment, which creates a weakness and vulnerability for South Africa. It is argued that the two main reasons for this are the countryʹs remote geographical position away from industrialised regions and the dominant position of its domestic companies.
33
3.1.5 Trends in the evolution of procurement systems A number of trends are observable in the evolution of procurements systems in the South African food supply chain. These trends will be discussed within the context of the formal market, which largely constitutes supermarkets, and the informal market, which largely constitutes spaza shops and street trading. a. Formal market In terms of procurement in the formal food market a number of trends are observable. The trends in procurement for the formal market are observable in three different formats. The first is corporate stores, the second voluntary trading groups and the third franchise stores.
i. Corporate stores / distribution centres and preferred supplier schemes Corporate stores are stores that are wholly owned by the retailer group and managed by an employee of the retailer. Corporate stores must procure all products (dry goods and fresh produce) they stock from the retailer�s regional distribution centres located across South Africa. Reportedly, no external procurement of any product is allowed. These distribution centres in turn procure the fresh fruit and vegetables and other fresh produce from a number of sources and in differing proportions. Some retailer distribution centres procure fresh fruit and vegetables from only a few preferred producers (Woolworths); others procure the bulk of fresh fruit and vegetables from a few preferred producers and supplement their supplies in the Fresh Produce Market (Pick & Pay); others use a larger number of preferred suppliers via a category manager (Shoprite through FreshMark) with the necessary supplements. The proportion generally varies between retailer groups. Interviews with Pick & Pay reveal that they procure 97 per cent of their supplies directly from preferred producers via growing programs while the remaining 3 per cent is procured from Fresh Produce Markets. Ten to twelve years ago, the proportion was 50/50. Conversely, Woolworths procures 100 per cent of its fresh produce from a few selected and preferred suppliers. The generally accepted norm for procurement through this type of channel is that 90 per cent of supplies are procured directly from preferred producers via growing programs while the remaining 10 per cent is procured from Fresh Produce Markets. This procurement practice has spread in the last ten years since the establishment of the distribution centre concept took root in South Africa; retailers generally procured around 50 per cent of their supplies directly from producers and the remaining 50 per cent from Fresh Produce Markets. Interviews with the four large food retailers, Spar, Pick & Pay, Woolworths and Shoprite Checkers revealed that all of them have some form of growing agreement or growing programme with their approved and preferred growers that supply the
34
retailers with the fresh produce that they may require. These growing programmes reportedly vary in nature according to the quality and quantity requirements imposed by the respective retailers. This procurement practice to grant growing contracts has spread in the last ten to twenty years since the establishment of the distribution centre concept in South Africa. Freshmark is working with some seven hundred farmers, four hundred of whom have a turn over between R5 million and R15 million per year and are thus categorised as small farmers by Freshmark�s managing director, because according to him they struggle to meet requirements. Freshmark�s managing director indicated that they are not looking for new suppliers but would prefer to consolidate the suppliers they are already working with. Pick �n Pay has approximately 450 suppliers nationally, including a number of large corporate suppliers. Some of the largest suppliers (e.g. Du Toit, Goedehoop, Hochland, Colors) supply all the distribution centres. Pick n Pay�s smallest preferred suppliers have a turnover between R6,000 and R20,000 per week. Pick �n Pay defines small farmers in general as farmers with a R1 million to R2 million turnover per annum. According to these guidelines around 80 per cent of suppliers to Pick �n Pay are medium sized farmers and larger farmers. Pick n Pay�s growing program started eight years ago. In the last five to six years no big changes have taken place in the supply base other than the addition of a few suppliers. Generally speaking the supplier base is very stable but consideration is given to new suppliers as the need arises. Reportedly, Pick �n Pay�s aim is to minimise their supplier base to achieve quality and uniformity. It is also generally not a policy to consider small farmers as suppliers as a result of the high transaction costs in dealing with them. Franchises stores do, however, have the flexibility to deal with small producers (usually on a cash-on-delivery basis), even though they are encouraged to work through distribution centres. Woolworths deals with about 95 fresh produce suppliers (a combination of farmers, agents and farmer groups). Two of these suppliers are groups of small farmers. 30 per cent of suppliers provide 70 per cent of fresh produce. Woolworths also generally procures fresh produce through �contract agreements� with producers. Woolworths does not consider them as contracts, but rather as verbal agreements. Interaction with producers is based on two documents: the growing programme and the Memorandum of Agreement (MOA), which together specify the terms and conditions of the relationship (payment, technical requirements, etc). Within their growing programs, Freshmark and Woolworths provide some technical support, either individually or collectively to farmers. Woolworths, given the specificity of its requirements for fresh produce, is the most advanced in providing
35
agronomical support. Pick �n Pay managers indicated that their staff do not have time for technical support and that they prefer mentorship from commercial farmers. Figure 3.11 illustrates the typical flow of fresh produce from growers to corporate stores. Figure 3.11: Procurement channels for fresh fruit and vegetables for independent stores trading within a voluntary trading group and possible income per capita of
households at constant prices for 2000
Source: SARB (2005)
The phenomenon where corporate stores only procure fresh produce through their distribution centres, who in turn only procure from a select few suppliers is a well established procurement practice that has been in use for over a decade in South Africa.
ii. Voluntary trading groups The Spar retail group in South Africa functions as a voluntary group that aims to unite the efforts of both independent wholesalers and retailers. Independent stores that trade within the voluntary trading group are wholly owned and managed by individuals or companies. Stores within the voluntary trading group are encouraged to procure all products (dry goods and fresh produce) they stock from the retailer�s regional distribution centres for fresh produce and dry goods. This practice stems from possible cost advantages from buying products from the distribution centre, since the distribution centre (wholesaler trading in the voluntary trading group) is a bulk buyer able to negotiate for good prices. Over and above procurement from wholesalers cum distribution centres, the independent stores trading within the voluntary trading group are also allowed to procure products outside the distribution centres directly from producers at their
Corporate store
Regional distribution centre
Preferred supplier base
Fresh Produce Market
In varying levels In varying levels
36
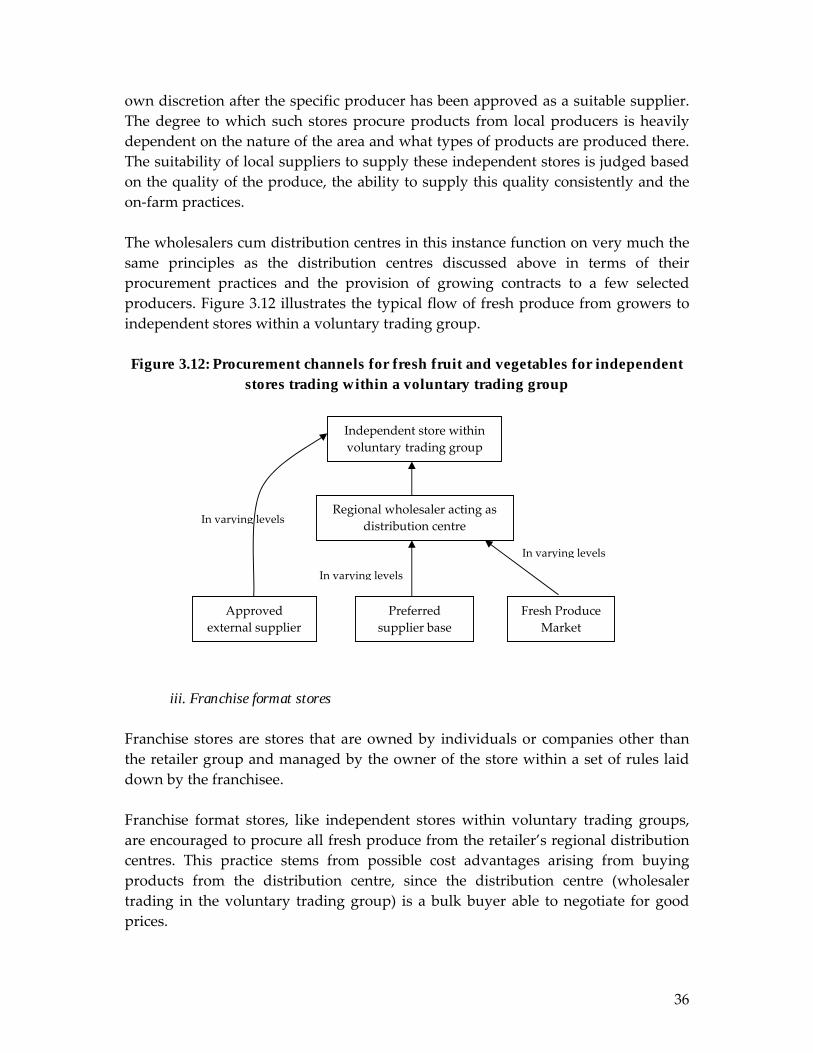
own discretion after the specific producer has been approved as a suitable supplier. The degree to which such stores procure products from local producers is heavily dependent on the nature of the area and what types of products are produced there. The suitability of local suppliers to supply these independent stores is judged based on the quality of the produce, the ability to supply this quality consistently and the on-farm practices. The wholesalers cum distribution centres in this instance function on very much the same principles as the distribution centres discussed above in terms of their procurement practices and the provision of growing contracts to a few selected producers. Figure 3.12 illustrates the typical flow of fresh produce from growers to independent stores within a voluntary trading group. Figure 3.12: Procurement channels for fresh fruit and vegetables for independent
stores trading within a voluntary trading group
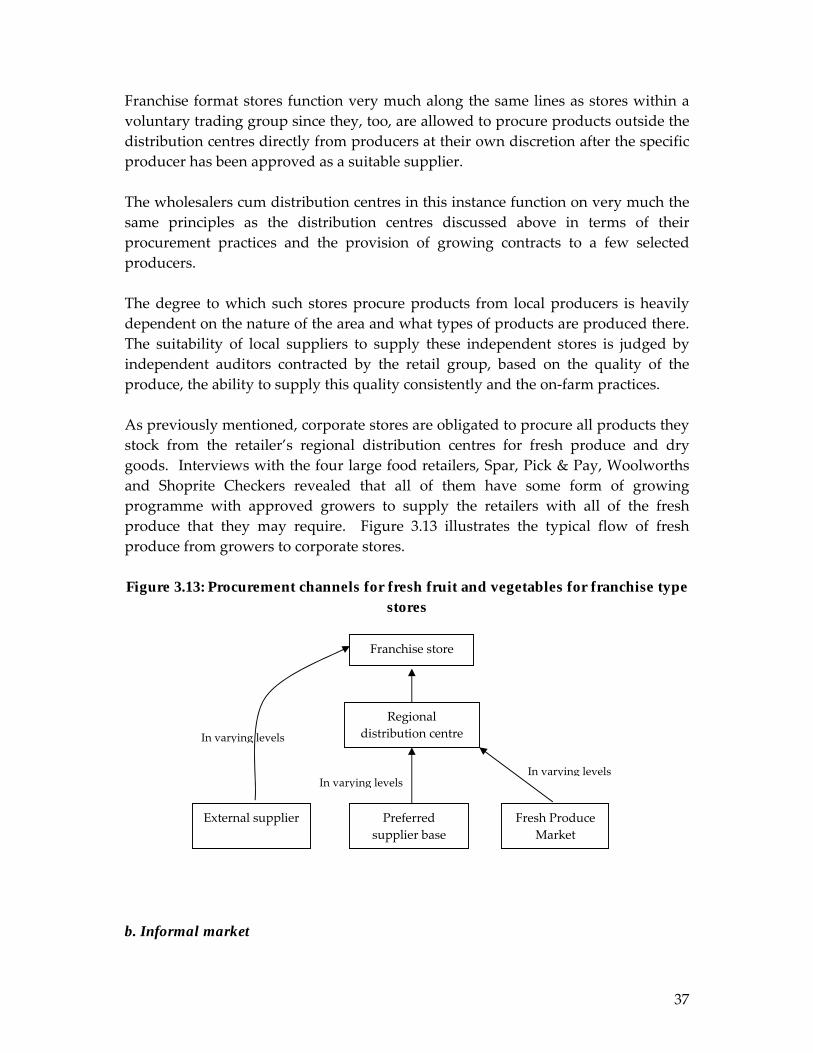
iii. Franchise format stores
Franchise stores are stores that are owned by individuals or companies other than the retailer group and managed by the owner of the store within a set of rules laid down by the franchisee. Franchise format stores, like independent stores within voluntary trading groups, are encouraged to procure all fresh produce from the retailer�s regional distribution centres. This practice stems from possible cost advantages arising from buying products from the distribution centre, since the distribution centre (wholesaler trading in the voluntary trading group) is a bulk buyer able to negotiate for good prices.
Independent store within voluntary trading group
Regional wholesaler acting as distribution centre
Preferred supplier base
Fresh Produce Market
Approved external supplier
In varying levels
In varying levels
In varying levels
37
Franchise format stores function very much along the same lines as stores within a voluntary trading group since they, too, are allowed to procure products outside the distribution centres directly from producers at their own discretion after the specific producer has been approved as a suitable supplier. The wholesalers cum distribution centres in this instance function on very much the same principles as the distribution centres discussed above in terms of their procurement practices and the provision of growing contracts to a few selected producers. The degree to which such stores procure products from local producers is heavily dependent on the nature of the area and what types of products are produced there. The suitability of local suppliers to supply these independent stores is judged by independent auditors contracted by the retail group, based on the quality of the produce, the ability to supply this quality consistently and the on-farm practices. As previously mentioned, corporate stores are obligated to procure all products they stock from the retailer�s regional distribution centres for fresh produce and dry goods. Interviews with the four large food retailers, Spar, Pick & Pay, Woolworths and Shoprite Checkers revealed that all of them have some form of growing programme with approved growers to supply the retailers with all of the fresh produce that they may require. Figure 3.13 illustrates the typical flow of fresh produce from growers to corporate stores. Figure 3.13: Procurement channels for fresh fruit and vegetables for franchise type
stores
b. Informal market
Franchise store
Regional distribution centre
Preferred supplier base
Fresh Produce Market
External supplier
In varying levels
In varying levelsIn varying levels
38
A number of trends can be observed for procurement in the informal food market. Van Deventer (2000) indicates that the informal sector has been growing since 1990 when hawkers were allowed to trade legally on pavements and street corners. The procurement strategies for the informal sector are highly varied and in this sense it does its name, as the informal sector, justice. Fresh Produce Markets have, however, become one of the primary procurement avenues for the informal market, especially the urban informal market. The growing importance of the Fresh Produce Markets as a procurement channel is evident in Table 3.7. During 1999, informal traders constituted 27 per cent of trade at the Tshwane Fresh Produce Market in Pretoria. Six years later, this figure has risen to 32 per cent of all trade at that market. This trend is echoed by the other Fresh Produce Markets where informal traders have become important customers in the past decade.
Table 3.7: Main customers of the Tshwane Fresh Produce Market (1999 & 2005)
3.2 Introduction and methodology of the local meso study
The focus of the local meso study was to evaluate the tomato supply chains in South Africa at the provincial level, focusing on the marketing opportunities and challenges faced by smallholder tomato producers. The study was carried out in the Limpopo and Mpumalanga provinces, which are characterised by:
• A large number of resident smallholder farmers (subsistence/semi-subsistence/established and emerging farmers) characterised by diversity in production and marketing of the selected sub-tropical fresh fruits and vegetables;
• Relatively high production (semi subsistence to commercial) of the selected fresh fruit and vegetables;
• Multiple marketing structures and a varying degree of integration into commercial food systems;
• Proximity to the country�s primary economic hub, the Gauteng province, which provides huge demand for agro-food products (both provinces border Gauteng and the main production areas are within a 200km � 350km range of
39
Gauteng). The Gauteng province is responsible for 50 per cent of South Africa�s GDP and has a population of 10 million (roughly a quarter of the total population)
The meso study was guided by the following questions: • What are the characteristics of the key fresh produce supply chains in the
Mpumalanga and Limpopo provinces? • Which procurement strategies do supermarkets use, and to what extent has
their procurement system restructured over the years? • What are the main drivers of smallholder farmers� participation in formal
supply chains such as supermarket chains and processing? • What are the effects of public policy (AgriBEE and land reform) in enhancing
farmers� access to agricultural markets? The study sought to understand the fresh produce supply chains at a local2 level, focusing on evaluating the extent to which smallholder farmers are participating in these chains. We used both primary and secondary data sources; the primary data was collected through personal interviews (with management from supermarket chains, fresh produce wholesalers, and officials from the national government3) and Participatory Rural Appraisal (PRA) based focus group discussions with the farmers (see annex 2 for the checklists). Secondary data was obtained from published literature and grey literature4. The results of the local meso study are presented in three sections, as follows: • Demographics of South Africa and the study areas • Characterization of the fresh produce supply chains in the provinces and their
procurement strategies • Characterization of smallholder farmers and their participation in
restructuring fresh produce supply chains
2 Province level in South Africa, Mpumalanga and Limpopo 3 Official from the Department of Agriculture 4 Reports on fresh produce initiatives by the Departments of Agriculture in the two provinces
40
3.3 Demographics of the smallholder agriculture sector 3.3.1 National agriculture demographics Defining agricultural households is fairly complex given the various ways in which households partake in agricultural activities in South Africa, be it formal or informal, as an employee or a farmer, as a main source of income or a source of food to the household, part-time or full-time, or simply as a hobby (PROVIDE Project 2005). About 35.6 per cent of South Africa�s households reside in rural areas (Rural Survey 1997). The PROVIDE project suggest that as many as 71 per cent of 2.4 million households (approximately 1.7 million) in the rural areas have access to land for farming purposes. Many rural inhabitants have links to agricultural activities in one way or another. On average, broadly defined agricultural households account for 68.8 per cent of all rural households (35.6 per cent of South Africa�s population are rural households and 24.5 per cent are broadly defined as agricultural households). Approximately 26.4 per cent of black households in South Africa are broadly defined as agricultural households, compared to 8.8 per cent of white households (PROVIDE Project 2005). Inequality is also prevalent within agriculture; the sector is dualistic by nature in terms of ownership and access to agricultural land. On the basis of the 1997 rural survey, of the 2.2 million employed people in the former homelands, 37 per cent reported that they were engaged in subsistence farming. Among employed people in the provinces, Eastern Cape had the highest proportion of subsistence farmers (60 per cent) followed by KwaZulu-Natal (56 per cent), Free State (5 per cent) and North West (4 per cent). Typically, subsistence farming is characterised by the need to engage in crop production, stock rearing and associated activities mainly for �own consumption�. These activities are usually associated with low productivity, risk and uncertainty. Based on the PROVIDE Project 2005, the overwhelming majority of households (93 per cent) were engaged in subsistence farming. Income-generating activities were insignificant; for instance, very little income was generated from the sale of a variety of crops, livestock and animal products. The PROVIDE Project study showed that the average income from livestock, chickens and maize per annum was R1,656, R235 and R203 respectively. Only a small proportion (3 per cent) relied on farming activities for their main source of income. Most households had one member or more who received other income such as salaries, wages or grants. Of the households who were generating an income by selling produce, 57 per cent were earning R201 or more in the past year. Access to land and water are the main factors affecting viability of rural households in South Africa. As many as 34 per cent of the households who sold produce were farming on of land less than a hectare in size. Of the households who were selling produce, only 6 per cent had access to ten or more
41
hectares of land. Access to water is very critical - more than one in three (35 per cent) said that they needed access to water more than any other type of assistance (PROVIDE Project 2005). 3.3.2 Description of the study areas Mpumalanga province The Gross Geographic Product (GGP) of the province was noted to be R31,000 million (about 3,444 million Euros). The economy of the Mpumalanga province is ranked as the fourth most significant of the nine other provinces. It ranks fourth highest in manufacturing and agriculture, and third in mining. More than 68 per cent of the province area is utilized by agriculture. Agriculture is one of the largest economic sectors in Mpumalanga, producing 15 per cent of total output in South Africa (South Africa Yearbook, 2001/02). The growing demand for agricultural products is an important driver for the agricultural sector. Products include sugar cane, sunflower seed, sorghum, potatoes, onions, cotton and maize. Agricultural production in Mpumalanga ranges widely from summer cereals and legumes in the highveld region to subtropical and citrus fruit and sugar in the lowveld. For the most part, dry farming land is utilised in agricultural production, but there are extensive irrigation activities in the Loskop area near Groblersdal and in the lowveld area adjacent to the Crocodile and Komati Rivers. Mozambique to the east, the Kingdom of Swaziland to the southeast, Gauteng to the west, the Free State to the southwest and Kwazulu Natal to the southeast. The southern and northern Highveld regions are the main producers of field crops while the Lowveld region produces 63.9 per cent of horticultural products from the province. Horticultural crops produced in Mpumalanga include vegetables, nuts, coffee, tea and citrus, subtropical and deciduous fruit
Limpopo province
Limpopo province covers an area of 12.46 million hectares and these account for 10.2 per cent of the total area of the Republic of South Africa. The province is endowed with abundant agricultural resources and is one of the countryʹs prime agricultural regions noted for the production of livestock, fruits and vegetables, cereals and tea. Given the fact that 89 per cent of the population of Limpopo is classified as rural, agriculture plays a major role in the economic development of rural areas in the province. In terms of employment, agriculture employs around 17.5 per cent of the economically active population (in the commercial farming subsector) and a further 25 per cent in the informal or subsistence smallholder farming subsector, thus making agriculture the most important provider of employment in Limpopo (Statistics South Africa: 2002). There are approximately 5,000 commercial farming units in Limpopo (Statistics South Africa: 2002). The smallholder farms are mostly
42
located in the former homeland areas and they cover approximately 30 per cent of the provincial land surface area. Farming under smallholder systems is characterized by a low level of production technology and small farm holding sizes (approximately 1.5 hectares per farmer), with production primarily for subsistence and little marketable surplus. It has been estimated that there were approximately 303,000 smallholder farmers in the Limpopo Province by 2000 (Statistics South Africa: 2002).
3.4 Characterization of the fresh supply chains in the provinces and
their procurement strategies This section gives a description of the dominant tomato supply chains in the Mpumalanga and Limpopo5 provinces. There are several supply chains in the fresh produce sector of the two provinces (see Figure 3.14).
Figure 3.14: The South African tomato producers supply chains Several interviews were administered to a number of actors in the fresh produce supply chains in Mpumalanga and Limpopo. These included: 5 The supply chains were mapped using information from PRAs and interviews with personnel from the Provincial Department of Agriculture.
Producers (small-scale farmers)
Retail chains (e.g. Pick & Pay,
Shoprite & SPAR)
Small formal retailers
(e.g. greengrocers, convenience stores)
Final consumers (individuals & households local & foreign)
Contract buyers
Informal traders
Wholesalers & Wholesaler-retailers (e.g.
F&V City, Marabastad
Municipal markets (Polokwane, Nelspruit
Tshwane & Johannesburg markets)
Catering (e.g. restaurants,
fast-food & institutions)
Export (trade agents, cross boarder
traders etc)
Processing companies
43
• Fruit & Veg City • SPAR • Freshmark (Shoprite & Checkers) • Pick �n Pay • Fresh Produce Markets • Tomato Processors (Giant Foods, Tiger Brands)
Fruit and Veg City6 Fruit & Veg City (FVC) presently have sixty stores, a third of which are corporately owned and the other two thirds are franchised. FVC is, without doubt, the most aggressive and extensive advertiser of produce in Southern Africa today. FVC moves approximately 1,000 tons of fresh produce to 80,000 customers each day, which has made them the biggest fresh produce housewives� destination shop in South Africa. On average the local stores in Mpumalanga and Limpopo procure 90 per cent of their fresh produce from small farmers, with 15 per cent supplied by emerging black smallholder farmers. The managers of the FVC told us that that they have two main procurement strategies: they procure directly from farmers and from the municipal or national Fresh Produce Markets. Both supply sources, have one problem in common: the fresh produce from these sources is not standardised in terms of quality and packaging and moreover they are not traceable. Therefore, FVC incurs extra cost through grading and packing of the fresh produce stock so that they can put quality products on their shelves. Most FVC franchise stores7 throughout the country prefer procuring their fresh produce from local farmers where they get it fresh and cheap. They have made it a priority to buy from local farmers so as ensure that they empower local communities economically 8 . The manager noted one weakness with smallholder farmers, i.e. that their supply of fresh produce was inconsistent in terms of quality and quantity. FVC has prescribed a uniform set of procurement standards for all the franchises in the country. Some of the standards9 include: • Production standards in terms of sterilised water - specific chemicals should be
applied and the producers must have a spraying program; • Right product quality in terms of fruit size, freshness, grade and packaging;
6 Interview with Bennie Roos (franchise owner) who has excellent knowledge of fresh produce procurement strategies, worked sixteen years for Freshmark as a buyer and has been in the business for two years as the owner of the Fruit and Veg City franchise. 7 Especially those outside Gauteng and distant from the Johannesburg Fresh Produce Market. 8 Through income generation and poverty alleviation. 9 Derived from the interview with Bennie Roos (FVC franchise owner).
44
• Standards for the pack-house and other storage and packaging infrastructure (must be enclosed and pest free);
• Adherence to international labour standards - no child labour used and minimum wage for the workers, including protective clothing for workers;
• Storage standards - vehicles should be enclosed, refrigerated and have interior cleaning programmes and must use specific refrigeration system with very particular temperature control schedules.
These standards are monitored and enforced by FVC quality experts and franchise owners through farm visits and laboratory tests. Maintenance of these quality standards is being compromised by the fact that most of the FVC franchise stores still procure their fresh produce stock from the municipal markets or Fresh Produce Markets where these requirements are difficult to attain or enforce. Pick ‘n Pay10
Pick �n Pay has a centralised procurement system for fresh produce - the Foodhold Distribution Centre (FDC) in Johannesburg - that is responsible for procuring fresh produce from preferred suppliers, usually medium to large scale farmers. The fresh produce procured from the different suppliers across the country by the FDC is stored and packaged in refrigerated warehouses before being dispatched to different stores countrywide. There are some problems with the centralised procurement and distribution system and there is generally a lack of coordination between the FDC and Pick �n Pay stores countrywide. In most cases stores do not receive the same fresh produce they ordered and in some cases the FDC fails to supply the right quantity ordered by the stores. Fresh produce managers for Pick �n Pay countrywide are not allowed to procure from local producers unless they get approval from the FDC. There are set conditions under which fresh produce managers for each store may procure locally: (1) the local prices must be significantly low; (2) the products must be out of stock at the FDC and; (3) the product should be good of quality. There are several limitations regarding the decentralised procurement system, e.g. in the absence of any food technologist in the store, the quality of fresh produce procured from local producers will be shaky. This may lead to a compromise in terms of the quality of the fresh produce stock since there is rarely any effort made by the store managers to distinguish the fresh produce products procured through the food distribution centre (FDC) and those procured from local producers. This may affect consumer trust in Pick �n Pay�s fresh produce quality because they will not be able to differentiate between the stock procured from the FDC and the stock procured locally.
10 Interviews with Pick �n Pay fresh produce managers in the Mpumalanga and Limpopo provinces.
45
SPAR SPAR uses a three-pronged approach for procuring fresh produce: central buying (Freshline brand), contract buyers (who buy on behalf of regional distribution centres) and local procurement by individual shop owners. SPAR has five distribution centres throughout the country, but there are no fresh produce warehouses providing central procurement and distribution of fresh produce products in the Mpumalanga or Limpopo provinces. Most SPAR shops procure their fresh produce stock through SPAR centralised procurement and distribution through the South Rand Distribution Centre in Johannesburg. This distribution centre is responsible for procuring and distributing the Freshline brand to all SPAR stores throughout the country. Up to 50 per cent of the Freshline brand for SPAR fresh produce stock is supplied by emerging farmers11 . The Freshline brand is usually sold in SPAR stores located in elite urban areas. SPAR stores in Mpumalanga and Limpopo procure their fresh produce through buying agents such as Mr. Veg and Pack Fresh. SPAR also has a strong local procurement strategy where individual shops12 procure fresh produce on their own. There are several cases where SPAR stores13 throughout the country support smallholder farmers by procuring their fresh produce, including provision of credit and training so as to enhance production. Freshmark14 We interviewed the Freshmark manager in Polokwane, which supplies Checkers and Shoprite stores in the Limpopo province with fresh produce products. The Centurion Freshmark Deport in Gauteng supplies the Checkers and Shoprite shops in Mpumalanga. Different Shoprite/Checkers stores have different clientele bases; Shoprite targets low-income groups, while Checkers caters for middle and upper income groups. Freshmark has a hierarchy in terms of the quality of fresh produce they supply to the stores. There are three types of shops supplied by Freshmark: type A (Checkers and Checkers Hyper stores), type B (Shoprite) and type C (OK stores). This hierarchy also applies to Freshmark fresh produce procurement system; products from emerging farmers are targeted for B and C type stores whilst those from established commercial farmers are distributed to Type A stores. Freshmark has a two-pronged procurement system; they procure both directly from the farmers and also from the Fresh Produce Market. Freshmark prefers direct procurement from farmers, but in many instances they fail to get enough stock so they turn to national Fresh Produce Markets (Johannesburg or Tshwane). According to
11 SPAR�s motto throughout the country is to promote emerging farmers so they can be integrated into the mainstream agricultural supply chains. 12 Especially franchise SPAR stores. 13 Thohoyandou, Giyani, Chakuma among many other SPAR stores in and outside the provinces. 14 Based on an interview with FreshMark Petersburg manager.
46
Freshmark management, the quality of fresh produce from the Fresh Produce Markets has deteriorated15 and no longer meets quality standards fit for Shoprite and Checkers shops. Freshmark has growing contracts with 800 fresh produce farmers in the Limpopo province and on average there are three suppliers for each product line. Most of the fresh produce stock supplied by Freshmark Limpopo is procured from within the province, except those commodities 16 not grown in Limpopo. Freshmark is planning that by next year (2007) all its fresh produce suppliers attain HACCP standards in order for them to get growing contracts from Freshmark. These standards will be a major impediment for emerging farmers, the majority of whom have neither the right resources17 nor the impetus to attain HACCP standards. Freshmark Limpopo has put a black economic empowerment program in place for supporting four black farmers so that they can upscale their production both in terms of quantity and quality. They have also initiated study groups amongst emerging fresh produce farmers in the Limpopo province; these operate as out-growers, supplying their produce to an established farmer 18 in their area. This arrangement enables emerging farmers to overcome some of the problems limiting their access to formal market channels (such as supermarkets and processors) through the following changes:
• Improved quality (due to sorting and washing in the pack-house); • Increased shelf life (due to cold room facilities); • Increased quantities (pooling of production); • Value addition (through packaging by the established farmers).
Tomato processors Giant Foods
Giant Foods are located in Makhadho, northeast of Polokwane. They process various vegetables, especially tomatoes processed into sauces and paste. They supply most of the products to their Johannesburg distribution centre, about 60-70 per cent of their products is sold as no name brands to several major retail chains, such as Shoprite/Checkers Woolworth, Pick �n Pay and SPAR. They also used the Gant brand name. The processor procures most of their tomato stock from farmers within a 300km radius. There are about 600 farmers who supply the processing plant of which 60 per cent are smallholder farmers. Two to three big commercial farmers 15 Freshmark manager said the Fresh Produce Markets had become a dumping ground for inferior quality produce. 16 Like apples and grapes. 17 Finance and knowledge. 18 The established farmer has infrastructure such as a pack-house and cool room for storing, grading, packaging and sorting the fresh produce.
47
supply the rest. In 2005, Giant Foods processed around 15,000 tons of tomatoes, 9,000 tons of which were supplied by emerging smallholder farmers. The factory rarely gives growing contracts to farmers and issuing of contract usually depends on the exchange rate to the Chinese currency; if the exchange rate favourable for South Africa19 they procure from China. This year (2006) the local supply was less than other years and they had to import tomatoes from China20. Currently, Giant Foods is working with a few farmers to whom it has granted growing contracts, but they have decided not to include input packaging in growing contracts. They have had bad experiences in the past with smallholder farmers, a number of whom have got a reputation for dishonouring their contractual obligations with the factory. In most cases they would instead sell to spot markets where they can get better prices than those offered by the processor. Giant Foods� main competitor is Tiger Brands (the biggest tomato processing factory in South Africa), the manager feels that Indemex and Miami do not pose any economic threat because they operate at much lower scale. Tiger Brands Tiger Brands is the biggest tomato processing company in South Africa. They work with small producers in the Nwanedi area in Musina, whom they supply with finance and inputs to enable effective production of tomatoes. Tiger Foods manages the cultivars planted by farmers so as to secure the flow of tomatoes to the factory. Currently, there are 121 small producers who supply the factory with approximately 25,000 tonnes of fresh tomatoes (R15 million) a year. One limitation of Tiger Brands is that its prices are not as competitive as those offered by its competitors. In 2006, Tiger Brands had a price of R622 per ton, well below the R750 per ton offered by Giant Foods. In the past few years there has been an unsteady supply to local factories because of opportunistic sales of contracted tomatoes to the fresh market. These farmers enter into growing contracts with Tiger Brands and use these contracts to access production credit for inputs other than seedlings from commercial banks. The growing contracts offered by Tiger Brands offers a number of advantages to the small producers: (1) pre-season contract with fixed prices; (2) access to finance; and (3) an anchor for cash flow and planning. Smallholder farmers in the Tiger Brand initiative have benefited in a number of ways: they have been able to improve the quality of their production and have even become competitive with established large-scale farmers.
19 Less South African rands to buy Chinese yuan 20 It costs R250 per ton to import from China compared to the R750 per ton paid to local farmers.
48
3.5 Characterization of smallholder farmers and their participation in restructuring supply chains
3.5.1 Introduction Several smallholder tomato growers were interviewed in Mpumalanga and Limpopo through personal interviews and PRA based focus group discussions21. The key focus of these interviews was to evaluate the market channel choices made by smallholder farmers and reflect on the challenges and opportunities they face in accessing mainstream supply chains such as supermarkets and processors. From these interviews and discussions it was noted that there are two categories of smallholder farmers - black and white small farmers. The former are largely known as emerging farmers22. In most circumstances due to skewed land ownership, small scale and subsistence farming is associated with black farmers whilst large scale and commercial farming is associated with white farmers. Our interviews (both individual and group) targeted smallholder farmers23 with a bias towards black farmers, whose numbers forms a significant population of small-scale farmers in the study areas. 3.5.2 Production characteristics Based on the PRA focus discussions, it was noted that there are two types of smallholder tomato growers in these provinces. On one hand there is a well-established group of smallholder farmers who grow tomatoes commercially using state of art24 production systems. On the other hand there is a group of resource constrained smallholder farmers 25 growing barely enough tomatoes to meet production costs. The summary below shows the comparison that was drawn from the discussions on the characteristics of these two groups:
• The well established group uses drip irrigation whilst the resource poor group uses flood irrigation;
• The well established group uses hybrid seeds and inorganic fertilisers including chemicals whilst the resource poor group uses traditional recycled seeds and less inorganic fertilisers and chemicals;
• The well established group owns most of the basic equipment essential for tomato production and has access to related infrastructure such pack-houses,
21 We implemented four focus group discussions, two in Limpopo and two in Mpumalanga. 22 Most black farmers only got the opportunity to start farming at the attainment of democracy in South Africa in 1994. 23 According to the Agricultural Census of 2002, any farmer who earns less than R300,000 is small scale. 24 Hydroponics, greenhouses and fertigation. 25 Using traditional methods of cultivating tomatoes e.g. flood irrigation.
49
warehouses and greenhouses whilst the resource poor group relies on hiring basic equipments, especially a tractor;
• The well established group usually enjoys tomato harvests exceeding 120 tonnes/ha/season whilst the resource poor group usually manages production levels below 20 tonnes/ha/season;
• The well established group produces throughout the year, whilst the resource poor group only produces during the tomato season;
• The well established group invests heavily in crop husbandry practices through the use of technology to control diseases and pests whilst the resource poor group uses very little chemicals in production;
• The well established group sell to multiple channels, with their first grades usually going to supermarkets (Woolworth, SPAR and Pick �n Pay, FreshMark, Shoprite & Checkers) whilst the resource poor group usually sells bulk un-graded tomatoes to hawkers;
• The well established group bargain for better prices because they has market power derived from volume and quality of produce, whilst the resource poor group are price takers, they neither have the quality nor the volume to bargain for better prices.
The average land holding reported in the discussion was 10 hectares, ranging from 6 to 75 hectares. All the farmers we talked to have tribal tenure rights26. Smallholder farmers in the Limpopo and Mpumalanga provinces grow a variety of fresh produce; tomato is one of the most grown in both provinces. They are grown in rotation with other fresh produce such as cabbages, spinach, carrots and peas. In most cases production is by hand with minimal mechanisation, such as tractors for ploughing and knapsacks for spraying chemicals. Over 60 per cent of those who participated in the group discussions indicated that they prefer using organic manure for their tomato production because they have abundant cheap animal manure in their kraals and grazing. In addition there has been an organic foods movement in food markets where organically produced foods obtain a premium price by selling to a niche organic foods market. All the farmers interviewed produce their tomatoes under irrigation; about 80 per cent use flood irrigation but there are also a significant number of farmers using state of the art drip irrigation and hydroponics. About 60 per cent of the smallholder farmers do not have access to basic production equipment and infrastructure such as irrigation equipment (pipes and water pumps), pack-house/ cold room and/or a greenhouse. As a result most farmers rely on hiring the equipment from neighbours or established commercial farmers in their community. Both table and fruit tomatoes are produced in these two provinces, but between 70 and 90 per cent of the smallholder farmers produce jam tomatoes27. On average the tomato plots are one-hectare in size, although it varies
26 In which the tribal officer authenticates one�s land ownership by granting a RTO (right to occupy). 27 The province has the highest concentration of tomato processors in the country.
50
from region to region, with those using irrigation schemes having smaller tomato plots than those outside the schemes. According to focus group discussions, farmers usually have more than two production cycles of tomatoes in a single season. Those who are more commercially oriented28 can yield up to five production cycles per season. In one case a farmer indicated that on average he gets up to 60 tons of tomatoes per hectare per harvest per cycle. 3.5.3 Marketing More than 80 per cent of the farmers who participated in the group interviews use spot markets and in most cases they sell to hawkers. There are few cases (less than 20 per cent) where smallholder farmers have growing or supply contracts with processors and supermarkets. In the Limpopo province over 40 per cent of the discussants had a growing contract with Tiger Brands. Over recent years, the number of smallholder farmers with growing contracts with tomato processors has been falling. This has been resultant of several factors, one of them being that most of the farmers were not honouring the contract commitments29. There has been an influx of cheap tomatoes from China. Importing tomatoes from China costs R250 per ton whilst the average local price for is around R750 per ton. Farmers in the Limpopo province (Nwanedi area) complained that Tiger Brand usually prefer their counterparts large (white) farmers and that Tiger Brand�s prices were very low and fixed. The farmers in the group discussions suggested that they would only want part of their production under contract so that they could also sell elsewhere, where prices more truly reflected market fluctuation. They believe that by allowing them this option, the processors could avoid non-delivery problems. Few discussants that sell tomatoes (less than 20 per cent) have supply contracts with supermarkets30. Most supermarket channels do not deal with smallholder farmers, more due to higher quality requirements than volume demands. In order to supply supermarkets, a smallholder needs a certain size of production and quality level. Most farmers who supply supermarkets have supply contracts with SPAR, with a few individual cases where farmers sell to Pick �n Pay and Woolworth. In these instances, farmers usually produce premium grade tomatoes, mostly under sophisticated production systems in greenhouse or tunnels. Most smallholders interviewed said they find it difficult to produce the quality demanded by supermarkets such as Pick �n Pay because of the strict spraying program that they demand. Farmers attending the focus group discussions indicated that they have spraying programmes but did not strictly adhere to these, especially when it comes
28 That is, with access to resources such as water, labour and irrigation equipment. 29 They renege on delivering to the processors, opting to sell to hawkers or at the local spot markets. 30 Most big supermarkets (Pick �n Pay, Shoprite, etc.) rely on central buying from a list of preferred suppliers
51
to the issues of the waiting period before they can send their goods to the market. They indicated that the major reason for abandoning the waiting period stated in their spraying program was that they did not own the spraying machines, but had to hire them in most cases. The other problem with supermarkets is that they do not make commitments in terms of contracts31, thus it is not worthwhile to adhere to strict conditions of the spraying program. Farmers said that supermarkets only procure from them when they could not get enough stock from big suppliers. They also pointed out that amidst strict quality and safety standards demanded by the supermarkets, these retailers offered low prices, fixed over the season. Therefore smallholder farmers had no incentives to supply to the supermarket due to stringent quality and safety standards. On the other hand the local market does not have strict quantity and quality demands. It was established from the focus group discussions that the main determinants of market channel choice by smallholders are demand and supply factors. If demand is high and supply is low then prices are high, under such circumstances farmers are likely to supply to Johannesburg Fresh Produce Market or tomato processors wherever they can fetch the highest prices. If the supply is high and demand is low, prices are suppressed and farmers are forced to supply local markets. The Johannesburg Fresh Produce Market is used by local market actors as a benchmark for setting prices that they offer to tomato producers in their local sub-regions. The choice of supplying to processors such as Giant Foods and Tiger Brands is usually affected by the oversupply of tomatoes from local producers. Farmers prefer supplying processors to Johannesburg FPM and even local markets because they can sell bulk, un-graded tomatoes. Forming cooperatives would be a good way to address these marketing constraints since farmers could then deliver to the market together. The discussants in both provinces indicated that the local market offered the best trade conditions, where prices were determined through supply and demand, as opposed to the supermarket supply chains where fresh produce buyers/managers bargained for the lowest price. In addition to competitive pricing, transport costs to local markets are much lower because in most instances the hawkers come to fetch the tomatoes from the farm gate. Different categories of hawkers were identified during the focus group discussions. There are three distinct classes: those who walk to the farm gate, especially neighbours who resell tomatoes at the local market; those who come with one ton bakkies32 and usually resell the tomatoes to hotels and restaurants; and those who come with 30 ton trucks and usually sell to chakalaka factories in Durban or even export the tomatoes to neighbouring countries such as Botswana, Zimbabwe or Mozambique.
31 i.e. no written contract. 32 A small pick-up truck or van.
52
3.5.4 Constraints for smallholder fresh produce farmers The main problems facing smallholder farmers who participated in the discussions include: lack of access to credit, production constraints and land tenure problems. Most farmers are unable to produce at optimal levels due to pests (white fly, bollworm, nematodes) and disease (tomato blight). They also said their production potential was limited by little commercial production experience and lack of access to equipment for efficient cultivation, including lack of access to better yielding varieties. A combination of these factors means that these resource constrained smallholder farmers do not have the capacity to produce for the mainstream markets (wholesalers, supermarkets and processors). Access to credit also came out in the discussions as one of the big challenges faced by smallholder tomato growers in the production area. None of the buyers gave credit facilities to the farmers and in fact some farmers were selling their produce to the hawkers on credit. Tomato buyers like wholesalers and supermarkets only pay at the end of the month thus farmers are faced with liquidity problems that could hinder their capacity to reinvest in the next season production requirements. Most farmers do not have collateral to access bank loans; in addition they do not have viable production plans or project proposals, which could be funded by the Landbank. In one interesting case, farmers in Nwanedi could not access agricultural credit from the government in the form of MAFISA and CASP because there was a dispute between the community and its traditional leaders and laws in terms of land ownership. The land was returned to the community by the government under the land restitution program, and this process overturned the leases that the current occupiers held when the land belonged to the state. As a result the current land occupiers cannot access government grants because one of the conditions is that they should have title deeds33 if they are to access these grants. There have been a lot of tensions between the community and the Ministries of Lands and Agriculture; farmers want the Ministry of Lands to settle the land claims so that the Ministry of Agriculture can release agricultural credit. The other challenges facing smallholder farmers includes transport for delivering their produce to the market and access to infrastructure such as cold rooms for storing, sorting and packaging their produce for the market. In order to address these constraints one of the solutions suggested during the discussions was to form cooperatives, so that production could be organised and scaled up to achieve economies of scale and competitiveness. Some farmers are organized in cooperatives, under the umbrella of Limpopo Tomato Growers Organization (LTGA). The LTGA is still very young and not yet well organized to empower farmers to bargain for better market opportunities. The organisation is
33 Lease or private tenure.
53
planning to buy a tomato canning factory in Letaba and will give its members preferential procurement status. There are plans to persuade the government to set up a local sorting/processing plant so that smallholder farmers can supply the plant, which in turn sorts and grade their produce. The better quality tomatoes are then supplied to supermarkets whilst the poor quality ones are processed. In this way farmers do not have to worry about complicated demands by the retail sector, and the retail sector does not have to deal directly with many smallholder farmers. The plant can also deal with differing supply and demand at certain times; in case of oversupply they can beneficiate their production so as to extend it shelf life. Farmers were asked during the group discussions if they could take advantage of �Countryline�, a fresh produce brand for emerging farmers currently being coordinated by the Johannesburg FPM. They said they did not favour this arrangement because they would lose out if they were made to sell their un-graded supply to Johannesburg FPM, due to low prices, penalties on quality packaging and transport costs. This arrangement would only be beneficial to Johannesburg FPM who would have a cheap source of tomatoes and get income from value added activities related to the �Countryline� brand.
54
3.6 The role of agricultural policy in enhancing smallholders’ market access
3.6.1. AgriBEE Both Giant Foods and Tiger Brands started a venture some years ago. It was initially a promising business, but the initiative failed within two years of being handed over to the local farmers, mostly due to mismanagement and a lack of (re)investment. There have been many changes in the market, but smallholders are still producing in the same way they always did. It is unclear whether this is because of lack of money or lack of support. Some farmers have heard of AgriBEE or read about it, but they do not really know what it involves and it has not brought them any benefits. So the people that are supposed to be the target group of the AgriBEE policy have not even been adequately informed about the initiative. The farmers also said a consultant had visited the area, but they had not heard anything more about that. There are several other empowerment initiatives between large-scale farmers and emerging black farmers in the fresh produce sector of Mpumalanga. An example is that in Komatipoort where Berson-Nyoni farms are working with local farmers producing horticultural crops such as tomatoes, cabbage and spinach. These partnerships empower emerging farmers by ensuring that they improve production yields and produce quality, thus enabling them to access lucrative markets that pay premiums. By combining produce from the emerging farmers with that of the established farmers, smallholder farmers are able to enjoy participation in mainstream supply chains where volume counts. 3.6.2. Land reform and support programmes Land reform is seen by many as a noble idea. They believe it is one of the most practical ways of improving livelihoods for previously disadvantaged black people. Despite this enthusiasm, the government must be cautious in implementing the land reform program. If it is implemented in the wrong way the Zimbabwean catastrophe will repeat itself in the country. In undertaking the land reform program the government must pay current owners the right amount for their farms. About 90 per cent of the land reform projects have failed due to poor planning by the government and a lack of farming experience and agribusiness knowledge by the beneficiaries. Furthermore, the government should put in place mechanisms at the local Fresh Produce Markets to ensure that food safety and quality standards are maintained in the fresh produce industry.
55
3.6.3 Land Redistribution for Agricultural Development (LRAD) What is LRAD? The land reform programme of the Department of Land Affairs (DLA) encompasses three distinct components, namely: redistribution, restitution and tenure reform. Redistribution in turn consists of three funding mechanisms: the Land Redistribution for Agricultural Development programme (LRAD); Municipal Commonage; and the Settlement/Land Acquisition Grant (SLAG). Of these, LRAD is the �flagship� redistribution product. The South African government plans to help many previously disadvantaged citizens who would like to become farmers attain their dream and thereby improve their income and living standards, but they do not have the land for this purpose. The LRAD programme can provide those who qualify with money to buy agricultural land and start farming, while giving them training and guidance to farm their land effectively. LRAD is the plan for farming areas and the programme was launched in August 2001. It seeks to: contribute to the redistribution of 30 per cent of South Africa�s agricultural land over fifteen years; improve nutrition and incomes of the rural poor who want to farm on any scale; decongest overcrowded former homeland areas; and expand opportunities for women and young people who stay in rural areas. LRAD is therefore the government�s attempt to assist previously disadvantaged people, including black, coloured and Indian people, to become effective farmers on their own land. The parameters of LRAD are deliberately broad. LRAD, to a greater extent than the SLAG-based redistribution programme, deals with diverse objectives, reflecting the complex realities of land reform in South Africa. The latter programme prevailed from 1995 to 1999 and LRAD was designed to cater to a range of needs and demands from so-called �food safety projects� to projects designed to assist blacks to get into commercial farming. The objectives of LRAD? The programme has certain very clear objectives. LRAD seeks to: • Assist previously disadvantaged people in rural areas to improve their living
standards by enabling them to run their own large or small farms effectively. Besides the money earned from the sale of their products, they will also produce more and better food for their own consumption.
• Overcome gender discrimination because under this programme women have the right to become landowners and farmers in their own right.
56
• Broaden the opportunities available to young people who live in rural areas. • Stimulate agricultural production, which will be to the benefit of the entire
country. • Promote the environmental sustainability of farming land through the
protection of the soil and such things as grazing, woodlots and water sources in order to keep on producing and to ensure that they be passed on to the next generation in good condition. (NDA, 2001).
The LRAD programme was designed to help previously disadvantaged citizens from black, coloured and Indian communities to buy land or agricultural implements specifically for agricultural purposes. Most of our people do not have sufficient money to buy land for farming purposes. This programme will make some money available to successful applicants to help supplement what they already have for purchasing agricultural land. This will be done in the form of government grants. Types of LRAD schemes The LRAD programme is designed in such a way that beneficiaries will enter the system at various levels of production, as set out below:
(a) Safety-net projects This is the level at which beneficiaries will acquire land to produce mainly for their own consumption.
(b) Equity schemes Members of a group will each contribute a certain amount towards accessing the grant. In turn, each member will own a certain percentage (share) of the project according to his or her level of contribution. This share is called equity, and it will be equal to the value of each individualʹs contribution plus the grant. These shareholders will be both co-owners and employees of the farm.
(c) Production for markets Some people will enter the programme at a much higher level than those mentioned above. These people will probably have more farming experience as well as access to additional finance through normal bank loans as well as their own assets and cash to purchase bigger farms and therefore farm on a much larger scale.
(d) Agriculture in communal areas Quite a number of people in communal areas already have secure access to agricultural land, but may not have the money to start using that land productively. Such people will be allowed to apply for assistance to start putting up productive
57
investments on the land. These kinds of projects may either be at the lower scale of production (safety-net projects) or higher up (production for markets). What challenges does the LRAD scheme face?
(a) Financial Constraints LRAD is struggling to meet the needs of the clients being served, and it has not been publicised because of the shortage of resources to meet even the demand already reaching delivery agencies.
(b) Family-Farm Type Projects In some instances it seems family-farm type projects appeal to applicants who want to diversify their economic support base as they are already so well-off to begin with that one questions whether they deserve the sort of government support they are able to extract from LRAD, and even whether they strictly needed LRAD in order to get into farming.
(c) Post-Settlement Support The critical importance of good post-settlement support to the sustainability of new farming enterprises is now recognised, and support is being provided by a range of private providers in addition to the provincial departments of agriculture.
(d) De-Densification of the Former Homelands LRAD is not an effective vehicle for dealing with congestion in the former homelands and alternatives should be identified. 3.6.4 Micro Agricultural Finance Schemes of South Africa (MAFISA) Micro-Agricultural Finance Schemes of South Africa (MAFISA) was approved in principle by the cabinet in January 2005. It is the first state-owned scheme to provide micro and retail agricultural financial services on a large, accessible, cost effective and sustainable basis in the rural areas. The intention is to provide capital to increase support to agricultural activities in the communal land areas as well as other small�scale agriculture. This will leave the Land Bank to deal with the commercial sector. MAFISA will work with the financial institutions to implement the provisions in the financial services charter relevant to the development of small and medium scale farming enterprises. There is R1 billion immediately available to start the scheme. The ten million potential beneficiaries include farm and non-farm entrepreneurs such as farm workers, tenants, household producers, landless, small landholders,
58
food garden producers and rural micro-entrepreneurs. MAFISA has four products and services for the rural working poor and enterprises: credit, savings, insurance and payment facilities. It will provide simple short and medium term loans, with a number of permutations that would be available to the poor at the rural district councils of the poorest provinces in terms of the Human Development Index as determined by Statistics South Africa. The Minister for Agriculture and Land Affairs, as the shareholder of MAFISA, will appoint a non-executive Board of Directors and Chief Executive Officer. The Board of Directors will inter alia determine the interest rate to cover the costs and risks. An initially small team of staff is planned for MAFISA central office. This team will undertake the detailed planning and further implementation. This will be based on district and local retail branches. In order to reach 80 per cent of rural people over the next ten years, some costs will be incurred. To keep these costs as low possible, MAFISA will first try to establish a presence at local branches from an existing network among other institutions. This applies especially to the Presidential Rural Development Nodal areas, where MAFISA intends to launch its initial service delivery products. To this end the Post Office has, for example, expressed its commitment to enter into firstly, a memorandum of understanding and secondly, a service level agreement with the Department of Agriculture for MAFISA to use the Post Office�s more than 2,000 branch network to provide front-end office and savings products. In the same way, a memorandum of understanding and service level agreement will be entered into with the Land Bank and its agribusiness business partners. Furthermore, partnerships will be expanded to include private sector financial institutions and member-based financial institutions. Funding of R1 billion will be made available under the terms of Section 5 of the 2001 Debt Management Act to support the administration and delivery of the scheme. Beneficiaries/End users • Communal farmers and farmers in the transitional stage from subsistence
farmers to so-called �beginner farmers� • Women and young people • Emerging farmers • Small-scale farmers • Small agribusiness • Farm workers • User-owned self help groups • Community-based organizations involved in agriculture
59
3.6.5 Comprehensive Agricultural Support Programme (CASP) What is CASP? On 18 August 2004, the Minister of Agriculture and Land Affairs launched the Comprehensive Agricultural Support Programme (CASP) in Boston, KwaZulu-Natal because it was clear that the level of success of the land reform process could not be measured only by the number of hectares of land that have been restored to the people, but more by how the restoration has improved the peopleʹs lives. The programme focuses on on-and-off farm infrastructure, information and knowledge management, financial assistance, technical and advisory services, training and capacity-building, and marketing and business development. The multiphase CASP targets previously disadvantaged individuals, specifically emerging farmers, including women, in rural areas, including those benefiting from the Land Redistribution for Agriculture Development (LRAD). CASP started in the 2004/2005 financial year. The CASP framework was developed as a recent intervention to complement LRAD and has become a core programme within the Department of Agriculture (DoA). The aim of this programme is to improve the quality of post settlement support services to the targeted beneficiaries of land reform and to other producers who have acquired land through private means as long as they are currently engaged in domestic enterprises seeking value added or export of agricultural products; as well as bridging the policy gap between land reform and agricultural development. The programme benefits the hungry, subsistence and household food producers, farmers and agricultural macro-systems within the consumer environment. The main priority areas of CASP The programme is a core focus for the department and will make interventions in six priority areas: • Information and technology management • Technical and advisory assistance and regulatory services • Marketing and business development • Training and capacity building • On/off farm infrastructure and product inputs • Financial support
The programme is based on the concept of public-private-community cooperation for service delivery. In order to implement the CASP programme, the national DoA has proposed a three-pronged strategy, i.e. to align all support services to the six
60
priority areas identified above. It seeks to phase in the basic support services related to on-and-off farm infrastructure and develop a policy for agricultural financing. At the same time, provincial Departments of Agriculture have been given a mandate to implement the farmer support services within the CASP policy framework. Furthermore, provincial departments are required to develop partnerships with the private sector in order to facilitate the implementation of the programme. A phase-in approach is envisaged and additional resources, in the form of conditional grants and through the equitable share allocation, have been made available to allow departments to gradually introduce strategic interventions as outlined under the CASP framework. It consists of six pillars. The first pillar, on- and off- farm infrastructure was prioritized as it was identified as a critical intervention for effective service delivery, through the development of infrastructures such as fences, dipping, stock handling facilities, water infrastructure and market infrastructure. The objectives of CASP The objectives and allocation criteria of the grant include: • Community involvement and ownership • Target beneficiaries should be from a previously disadvantaged group • Enhances national and household food security • One-off grant that does not commit the government to any form of direct
recurrent operational or maintenance project grants • Long-term sustainability and economic viability • Project finance support will only be provided for agricultural activities having
the required level of institutional and technical support • Projects that will generate employment opportunities should be given priority
Beneficiaries of CASP?
• The hungry • Subsistence and household food producers • Farmers • Agricultural macro-systems within the consumer environment
Expected outcomes of CASP?
• Increased creation of wealth in agriculture and rural areas • Increased sustainable employment • Increased incomes and increased foreign exchange earnings • Reduced poverty and inequalities in land and enterprise ownership
61
• Improved farming efficiency • Improved national and household food security • Stable and safe rural communities with reduced levels of crime and violence
and sustainable rural development • Improved investor confidence, leading to increased domestic and foreign
investment • Pride and dignity in agriculture as an occupation and sector
CASP Partnerships MAFISA is intended to complement the CASP and provide further assistance to emerging farmers and land-reform beneficiaries. CASP will be implemented through further partnering between: • National Department of Agriculture • Provincial Departments of Agriculture • Department of Land Affairs • National Treasury through the Intergovernmental Fiscal Review • District committee and council • The beneficiaries • The Land Bank • Sector Education and Training Authorities, and other partners
62
4 Conclusion There have been many changes in the fresh produce industry over the past forty years. There has been a rise in fresh produce imports to South Africa by multinational companies. This is largely driven by two factors; the first is cheap fresh imports from South America and Asia and the second is to maintain all year round availability of fresh produce, which is significantly affected by seasonal fluctuations. There has been a rise in supermarket participation in the fresh produce subsector and most supermarkets now have a fresh produce section in-store. The supermarkets have also improved significantly in terms of their fresh produce departments with: • Improved packaging • Improved hygiene standards • Improved standardization of goods • Increased sale of pre-cut vegetables
Most big supermarkets now have central procuring systems in place, where they procure their fresh produce from a number of preferred suppliers; in most cases these suppliers are producers with whom the retailers have a grower�s contract. Up to ten or twelve years ago all the supermarkets procured their fresh produce from municipal markets except Woolworth. Furthermore, three or four years ago there were still only a few retail shops in the region (Nelspruit) - one Pick �n Pay, one Shoprite and one Spar. Currently there are now two Pick �n Pay stores, two Shoprite stores, one Checkers and six SPAR stores around town (Nelspruit). Ten years ago the fresh produce business in Mpumalanga was still controlled by greengrocers (owned mostly by Portuguese-speaking people) but their numbers have been declining significantly in the last decade. The number of hawkers involved in selling fresh produce has increased significantly over recent years. Some have resorted to selling their goods at the entrance of established retail stores like Shoprite and SPAR. These hawkers do not pose problems to Fruit and Veg City because they offer inferior produce, for instance they sell grade 3 products compared to grade 1 produce sold inside Fruit and Veg City. The future of the fresh produce industry is not promising, especially on the producers� side, because input costs are too high and input product prices are increasing with time, while on the other hand international commodity prices are falling and prone to seasonal fluctuation. In addition to this a strong rand works against farmers who want to export their fresh produce. The general findings from the farmer interviews34 are that in order for smallholder farmers to supply supermarkets or wholesalers they need a certain size of
34 Key informants in informal, personal and PRA focus group discussions.
63
production, high quality products, a certain size and type of product and consistency in quality and supply. The best trade conditions can be ensured on the local (and traditional) market, where prices are determined by supply and demand, and not solely by the buyer. The requirements by supermarkets and processors are usually only quality requirements (size and colour). The local market, especially hawkers, does not have strict quality demands. Smallholders find it difficult to produce the required quality. There has not been much change in tomato demand in recent years, but the supply of tomatoes has risen a lot. Smallholder farmers are not in a good position to bargain for better prices and better contract terms from the mainstream market channels, because there are too many smallholder farmers as well as big players like ZZ2 in the tomato industry. Demand requirements by the local market have changed little, whereas processors and supermarkets have very strict demands. The fresh produce industry should implement traceability standards in their fresh procurement systems so as to achieve international best practices. Smallholder farmers can only gain market power if they form cooperatives, because volumes make a difference in the tomato industry, which is dominated by big players such as ZZ2. These big players have their own agents at the Fresh Produce Markets and they produce at the lowest cost hence they can dump their products on the markets. Marketing cooperatives should be established through the help of the government and these cooperatives should be run as businesses not social gatherings. Farmers should find niche tomato market products like puree and freeze drying, which have export demand. In addition these alternative markets work well in the smallholder environment where tomato wastage is very high and costly. Farmers need to get training, right information and the right seeds (currently farmers are growing low yield varieties that do not have a long shelf life) for them to be able to produce tomatoes successfully.
64
5 References African Cooperative for Hawkers and Informal Business (ACHIB). 2006. Is the second economy shedding jobs in large numbers silently? Internal memo. Johannnesburg, South Africa. Amsterdam Cape Town Group, 2002. The South African Fruit and Vegetable Supply Chain. Management Consulting Report, Cape Town, South Africa. Botha, L. and van Schalkwyk, H.D, 2006. Concentration in the South African food retailing industry. Paper submitted presented at the 44th Annual AEASA conference in Grahamstown, South Africa. 20 � 22 September 2006. Bureau for Food and Agricultural Policy (BFAP), 2006. South African Agricultural Outlook. University of South Africa, Pretoria, South Africa Bureau of Market Research (BMR), 2004. National Personal Income of South African‘s by population group, income group, life stage and life plane (1960 – 2007). University of South Africa, Pretoria, South Africa Dodds, T. 2006. Deputy Manager: System Information and Development, City of Tshwane Metropolitan Municipality. Personal communication. Euromonitor International. 2006. Retailing in South Africa. [Web:] http://www.euromonitor.com/South_Africa [Date of use: 24 August 2006]. Fedderke, J. and Szalontai, G., 2005. Industry concentration in South African Manufacturing - Trends and Consequences, 1972 – 1996. Working Paper Series No. 96, School of Economics, University of Cape Town, Cape Town, South Africa. Food and Agriculture Organisation. 2003. Rise of Supermarkets across Africa threatens small farmers. Opportunities and challenges in a changing market. [Web:] http://www.fao.org/english/newsroom/news/2003/23060-en.html [Date of use: 12 June 2006]. McGregor, R. 1992. McGregor’s Who owns whom in South Africa 1992 - Johannesburg: Who Owns Whom. Mawers S. 2004. Marketing to the South African Black Middle Class. MBA, Research Report, Gordon Institute of Business Science, Johannesburg, South Africa. Mollen, B.E. 1967. The Marketing Channel: A Conceptual Viewpoint, New York.
65
Morris, R., 1992, Marketing to Black Townships: Practical Guidelines, Cape Town. Myburgh, A.S., (undated), Informele Kleinhandel in Groente en Vrugte: Bemarkingsopsie 0f Bemarkingskakel vir die Kleinboer, Departement van Landbouekonomie, Universiteit van Stellenbosch, Stellenbosch. National Agricultural Marketing Council (NAMC). 2002. Report on the investigation into fresh produce marketing (Report 2): Fresh produce marketing in South Africa. The National Agricultural Marketing Council, Pretoria, South Africa. National Department of Agriculture. 2006. Abstract of Agricultural Statistics. Directorate: Agricultural Statistics of the National Department of Agriculture, Pretoria, South Africa. National Department of Agriculture. 2001. Trends in the agricultural sector 2001 National Department of Agriculture, Pretoria, South Africa. Statistics South Africa. (1999). Rural survey: 1997, Statistical release P0360, Pretoria, South Africa. Statistics South Africa. (2006). Migration and urbanization in South Africa. Report no. 03-04-02 (2006), Pretoria, South Africa. Statistics South Africa and National Department of Agriculture. 2006. Survey of Large Scale Agriculture in South Africa (2005). Statistics South Africa in collaboration with Department of Agriculture, Pretoria, South Africa. Statistics South Africa. 2004. Census of Commercial Agriculture 2002. Statistics South Africa in collaboration with Department of Agriculture, South Africa. Statistics South Africa. 2006. Urban/Rural population of South Africa, Unpublished Report, Statistics South Africa, Pretoria United States Department of Agriculture (USDA). 2005. Retail Food Sector Report. GAIN report Number SF 5040. US Embassy, Pretoria, South Africa. Weatherspoon D. and Reardon T., 2003, The rise of supermarkets in Africa: Implications for agrifood systems and the rural poor, Development Policy Review, vol. 21, no. 3. PROVIDE Project, 2005. Quantifying the economic divide in South African Agriculture, an income side analysis. Working paper series 3. Elsenburg Department of Agriculture.
66
6 Appendix 1. Selection of commodities Tomatoes were chosen as the product of investigation for the Regoverning Markets study. This was primarily due to the fact that the tomato sector is the second most important vegetable sector in the South African agricultural economy after sweetcorn. Table 6.1 below illustrates the major vegetables produced in South Africa according to the gross value of production during the twelve months up to June 2005. In terms of the gross value of production, tomatoes is the second largest vegetable crop produced in South Africa, contributing 24 per cent to the total gross value of vegetables (excluding potatoes) (NDA, 2006).
Table 6.1: Major vegetables produced in South Africa based on gross value of production
Major vegetable Relative importance(Gross value of production)
Source: NDA, 2006 Over and above being an important crop in the context of the South African agricultural economy, tomatoes were also chosen as the product of investigation because they are grown in two provinces (Limpopo and Mpumalanga) in close proximity to Gauteng, the consumption hub of South Africa. Tomato plantings for the 2005 season are estimated at 6,475ha. This is a 1.1 per cent increase compared to the 2004 planted area. Limpopo province is the main production area, with 3,590ha, which is more than 50 per cent of the total area planted to tomatoes in the country. Other important regions in terms of hectares under tomato cultivation are the Onderberg area of Mpumalanga with 550ha and the Border area in the Eastern Cape, with 450ha. Except for Gauteng, with virtually no area planted to tomatoes, plantings in the Northern Cape and Free State are the lowest, with only 75ha.
67
Figure 6.1: Production areas for tomatoes in South Africa
Source: Amsterdam Cape Town, 2002
Table 6.2: Tomato production in South Africa per region (2003, 2004, 2005)
Note: Processed tomatoes not included in calculations (2,500 hectares and 205,000 tonnes); Tomatoes produced in tunnels not included in calculations (150ha)
(Source: Tomato Producers Organization, 2006)
Growing of tomatoes in tunnels is still on the increase as an important crop production method in South Africa.
2. Production Production during 2005 is estimated at 393,740 tons. The northern Lowveld and far northern areas in the Limpopo province could be expected to produce 162,000 and 62,300 tons, respectively, followed by the Onderberg region in Mpumalanga with 38,500 tons, and the border area in the Eastern Cape with 36,000 tons. There was no significant increase in the production of tomatoes in Mpumalanga from 2004 to 2005. The total production area is more than 5,400 hectares. Approximately 4,500 hectares are being used for tomatoes for processing (juices, ketchup, canned tomatoes, etc). The remaining 900 hectares are used for the production of tomatoes for fresh consumption. Approximately 100 hectares of this area consists of production under protection (tunnels and greenhouses), with an annual harvest of 15,000 tons. The tomato is an important vegetable crop. Commonly grown by subsistence and resource poor farmers in South Africa, it is widely used as a fresh vegetable and in the form of an onion-tomato amaranth stew to supplement the local staple diet of maize meal. As a result, it is one of the main vegetables used for hawking by small-scale entrepreneurs in the informal sector. The crop is also grown commercially and provides a large number of employment opportunities in this country.
Figure 6.2: Production trends for tomatoes in South Africa
370
390
410
430
450
470
490
1993 1995 1997 1999 2001 2003
Prod
uctio
n ('0
00 to
ns)
Source: NDA, 2006
69
3. Sales Figure 6.3: Sales of tomatoes and the Fresh Produce Market trends for tomatoes in
South Africa
45
50
55
60
65
70
1993 1995 1997 1999 2001 2003
Perc
enta
ge
Source: NDA, 2006
4. Prices While there was a significant 37.7 per cent increase in the average price of tomatoes from 2002/03 to 2003/04, the average price decreased dramatically by 21.1 per cent, from R2,851 per ton in 2003/04 to R2,250 per ton in 2004/05. Tomatoes are subject to large seasonal price fluctuations, which also imply a high price risk.
70
Figure 6.4: Production and real prices of tomatoes and the price for tomatoes in South Africa
5. Consumption The per capita consumption of tomatoes in South Africa is 12kg per annum, compared to 32kg in Europe. This 12kg per capita consumption is only for metropolitan areas. Population growth, urbanisation, per capita income and the income elasticity of demand for tomatoes are important factors influencing the demand for tomatoes. The average household in South Africa consumes between five and ten tomatoes per week. 6. Exports While the volume of tomatoes exported increased significantly by 6 per cent in 2003 to 7,472 tons, it showed a dramatic decrease of 21.3 per cent in 2004, to 6,160 tons.
The export of tomatoes has grown considerably since the beginning of the nineties. In 1991, exports amounted to only 800 tons while at the end of the nineties this had increased to 7,000 tons. The export of tomatoes decreased in 1999 and 2000 as a result of disappointing harvests and sufficient sales opportunities at the local market. The export value also decreased, while the value per kilogram has been stable over the years. By far the most important export market for tomatoes is Mozambique - 80 per cent of tomato exports are destined for this country. Additionally, tomatoes are being exported to Zimbabwe, Angola, Kenya and the United Kingdom. 7. Processing Tomato processing is considerable and increasing. More than 70 per cent of tomato production is processed into canned tomatoes and pasta sauces. The most important processors are Langeberg Foods (60 per cent of market share), Giant Foods, Miami Foods, Anglo American and Nestlé. The tomato processing industry in South Africa processes about 150,000 tonnes of raw tomatoes. This is a very small quantity in relation to the processing sector worldwide. Due to the geographic distance from potential markets, the tomato industry is relatively small and most locally produced products are also locally consumed. One player, Tiger Brands, dominates the processing sector with a share
72
of over 75 per cent. The companies involved in the processing sector are listed below.
Table 6.3: Tomato processing in South Africa per region
Processor Province City Tonnes (t) Market share (%) Rhodes Fruit Farms Western Cape Franschoek 2,000 1.33 Miami Canners Limpopo Polokwane 15,000 10.00 Giant Foods Limpopo Makhado 10,000 6.67 Montina Limpopo Mooketsi 5,000 3.33 Indemex Limpopo Waterpoort 2,500 1.67
TOTAL 150,000 100.00 Source: Tomato Producers Organization, 2006
Though the total tomato crop for processing is relative small, farming operations are sophisticated. Virtually all processing tomatoes are contracted prior to the season. Prices are negotiated with the producers in a specific area. Typically, the processor will acquire seed and contract nurseries to grow seedlings according to a production and harvesting window that is linked to factory capacity and throughput. The seedlings are distributed to producers on credit. Production is irrigated, with drip irrigation being widespread. Harvesting is mostly carried out by hand. The average yield varies from area to area but is typically between 65 and 90 tonnes/hectare.
Potatoes Tomatoes Cauliflower Cabbage Province Planted
Tomato canning in South AfricaThe EU gives aid to its tomato canners and to the EU farmers whose tomatoes are canned. It also drastically limits the amount of South African canned tomatoes sold in the EU by imposing a 14.4% tariff on entry. EU canners are displacing South African canned tomatoes in the USA, Japan and in South Africa itself. This has already resulted in two thousand seasonal and permanent job losses in the South African canning industry. The EU does allow other Southern African countries to export canned tomatoes to the EU duty free. But, as none except South Africa has the industrial capacity to produce them efficiently and cheaply, this system continues to ensure that European tomatoes are protected from competition. http://www.actsa.org/Trade/growing_hope.htm
73
Regoverning MarketsRegoverning Markets is a multi-partner collaborative research programmeanalysing the growing concentration in the processing and retail sectors of nationaland regional agrifood systems and its impacts on rural livelihoods and communitiesin middle- and low-income countries. The aim of the programme is to providestrategic advice and guidance to the public sector, agrifood chain actors, civil societyorganizations and development agencies on approaches that can anticipate andmanage the impacts of the dynamic changes in local and regional markets. Theprogramme is funded by the UK Department for International Development (DFID),the International Development Research Centre (IDRC), ICCO, Cordaid, theCanadian International Development Agency (CIDA), and the US Agency forInternational Development (USAID).
Agrifood Sector StudiesThese studies look at specific agrifood sectors within a country or region. Research studies have been carried out in China, India, Indonesia, Mexico, SouthAfrica, Turkey, Poland and Zambia covering the horticulture, dairy and meat sectors.The sector studies describe the observed market restructuring along the chains, andthe determinants of that restructuring.
The studies were coordinated by:Jikun Huang, Centre for Chinese Agricultural Policy (CCAP), China (contact [email protected])Thomas Reardon, Michigan State University (MSU), USA (contact: [email protected])