Restructuring agrifood markets in India: The dairy sector (A) Vijay Paul Sharma, Raj Vir Singh Indian School of Management www.regoverningmarkets.org Agrifood Sector Studies Regoverning Markets Small-scale producers in modern agrifood markets
Transcript
Restructuring agrifood markets in India:The dairy sector (A)
Vijay Paul Sharma, Raj Vir Singh Indian School of Management
www.regoverningmarkets.org
Agrifood Sector Studies
Regoverning MarketsSmall-scale producers in modern agrifood markets
1
Restructuring agrifood markets in India: The dairy sector
Vijay Paul Sharma Raj Vir Singh
Indian Institute of Managementʹ Ahmedabadʹ 380 015 (India)
July 2007
2
Regoverning Markets Regoverning Markets is a multi‐partner collaborative research programme analysing the growing concentration in the processing and retail sectors of national and regional agrifood systems and its impacts on rural livelihoods and communities in middle‐ and low‐income countries. The aim of the programme is to provide strategic advice and guidance to the public sector, agrifood chain actors, civil society organizations and development agencies on approaches that can anticipate and manage the impacts of the dynamic changes in local and regional markets. Agrifood Sector Studies These studies look at specific agrifood sectors within a country or region. Research studies have been carried out in China, India, Indonesia, Mexico, South Africa, Turkey, Poland and Zambia covering the horticulture, dairy and meat sectors. Part A of the studies describe the observed market restructuring along the chains. Part B explores the determinants of small‐scale farmer inclusion in emerging modern markets. Using quantitative survey techniques, they explore the impacts on marketing choices of farmers, and implications for rural development. The studies were coordinated by: Jikun Huang, Center for Chinese Agricultural Policy (CCAP), China (contact [email protected]) Thomas Reardon, Michigan State University (MSU), USA (contact: [email protected]) Other publication series from the Regoverning Markets programme Innovative Practice This series of country case studies provides examples of specific innovation in connecting small‐scale producers with dynamic markets at local or regional level. Based on significant fieldwork activities, the studies focus on four drivers of innovation: public policy principles, private business models, collective action strategies by small‐scale farmers, and intervention strategies and methods of development agencies. The studies highlight policy lessons and working methods to guide public and private actors. Innovative Policy These are short studies addressing a specific policy innovation in the public or private sector that improves the conditions for small‐scale producers to access dynamic markets at national, regional and global level. Country Studies These provide a summary of market changes taking place at national level within key high‐value agrifood commodity chains.
3
Policy Briefs These are short policy‐focused summaries targeted at each stakeholder group. Further information and publications from the Regoverning Markets programme are available at: www.regoverningmarkets.org. Acknowledgements Several individuals and institutions have helped during this study. Acknowledging them all individually would be impossible but we would like to mention a few without whose support would have been difficult to complete this study. We would' therefore like to thank people who have helped and guided us in the study as well as those who have offered suggestions and comments on our earlier drafts. First and foremost we would like to thank International Institute for Environment and Development (IIED) and the Regoverning Markets Programme for their generous financial support through the Sustainable Development Policy Institute (SDPI) that made this study possible. Our special thanks to Prof. Bakul H Dholakia, director of the Indian Institute of Management Ahmedabad, for his administrative and unstinting moral support. We owe a lot for the support and encouragement from Dr Bill Vorley, Group Head Sustainable Markets, Dr Abid Suleri Regional Coordinator, Dr Thomas Reardon Professor Agricultural Economics Michigan State University (MSU), and Dr Jikun Hunag Director & Professor Center for Chinese Agricultural Policy, Chinese Academy of Sciences Component 1 leaders. We would like to thank Mr Animesh Banerjee President of the Indian Dairy Association for offering useful comments and suggestions on the draft report of this study. Sincere thanks to Mr Kalpesh Kumar who provided research assistance in the project. Needless to mention while we owe debt to the numerous persons with whom we interacted during the study, the responsibility of data and views in this report and any omissions or errors that remain in the text are ours alone. Vijay Paul Sharma Raj Vir Singh
4
Contents
1 Executive summary..........................................................................................................6 2 Introduction.....................................................................................................................10 2.1 The role of agriculture in the Indian economy .................................................10 2.2 Objectives and key questions of the study ........................................................13 2.3 Organization of the report ...................................................................................14
3 The restructuring of the Indian food sector: a case study of the dairy industry...16 3.1 Evolution of the national food markets .............................................................17 3.1.1 The food retail sector and supermarkets ...................................................17
3.2 Restructuring of the Indian dairy industry.......................................................21 3.2.1 Pre‐operation flood period ..........................................................................22 3.2.2 Operation flood programme (1970s and 1980s) .......................................23 3.2.3 Post‐reforms period ......................................................................................24
4 Methodology...................................................................................................................27 4.1 Selection of commodity........................................................................................27 4.2 Selection of study sites .........................................................................................27 4.3 Method of survey (national and local meso levels) .........................................28
5 Changes in production and marketing systems ........................................................29 5.1 Milk production trends ........................................................................................29 5.1.1 All India..........................................................................................................29 5.1.2 Regional shares..............................................................................................30 5.1.3 Milk production trends in the selected states ...........................................31
5.2 Production inputs and services...........................................................................31 5.2.1 Number of livestock .....................................................................................32 5.2.2 Productivity of animals................................................................................32 5.2.3 Availability of fodder ...................................................................................32 5.2.4 Availability of production and processing infrastructure ......................32 5.2.5 Availability of labour force:.........................................................................33 5.2.6 Access to institutional credit .......................................................................33
5.3 Production constraints .........................................................................................34 5.3.1 Un‐remunerative prices ...............................................................................34 5.3.2 Unavailability of an institutional loan .......................................................34 5.3.3 Uncertain prices and markets .....................................................................35 5.3.4 Availability of feeds and fodder .................................................................35 5.3.5 Unavailability of better breeds....................................................................35 5.3.6 Animal health care facilities ........................................................................35
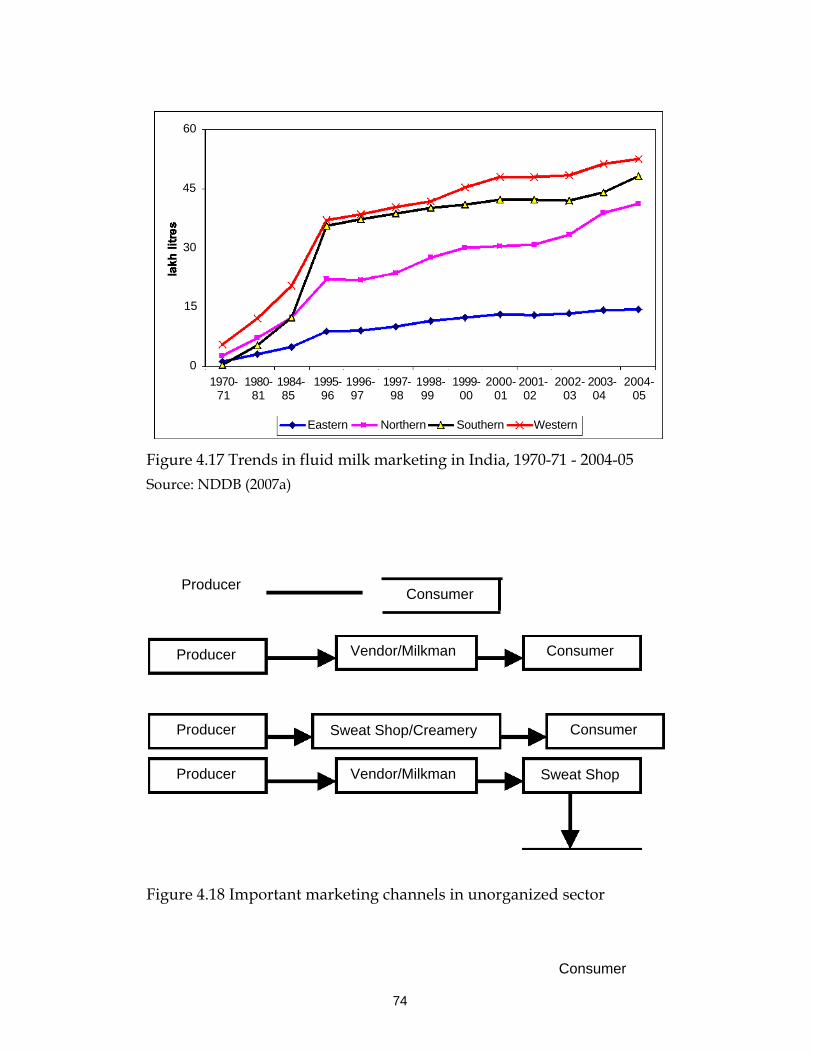
5.4 Marketing issues: institutions, infrastructure and constraints.......................36 5.4.1 Milk procurement and disposal pattern....................................................36 5.4.2 Milk procurement trends .............................................................................37 5.4.3 Seasonality in milk production and procurement ...................................38 5.4.4 Fluid milk marketing trends .......................................................................38
5
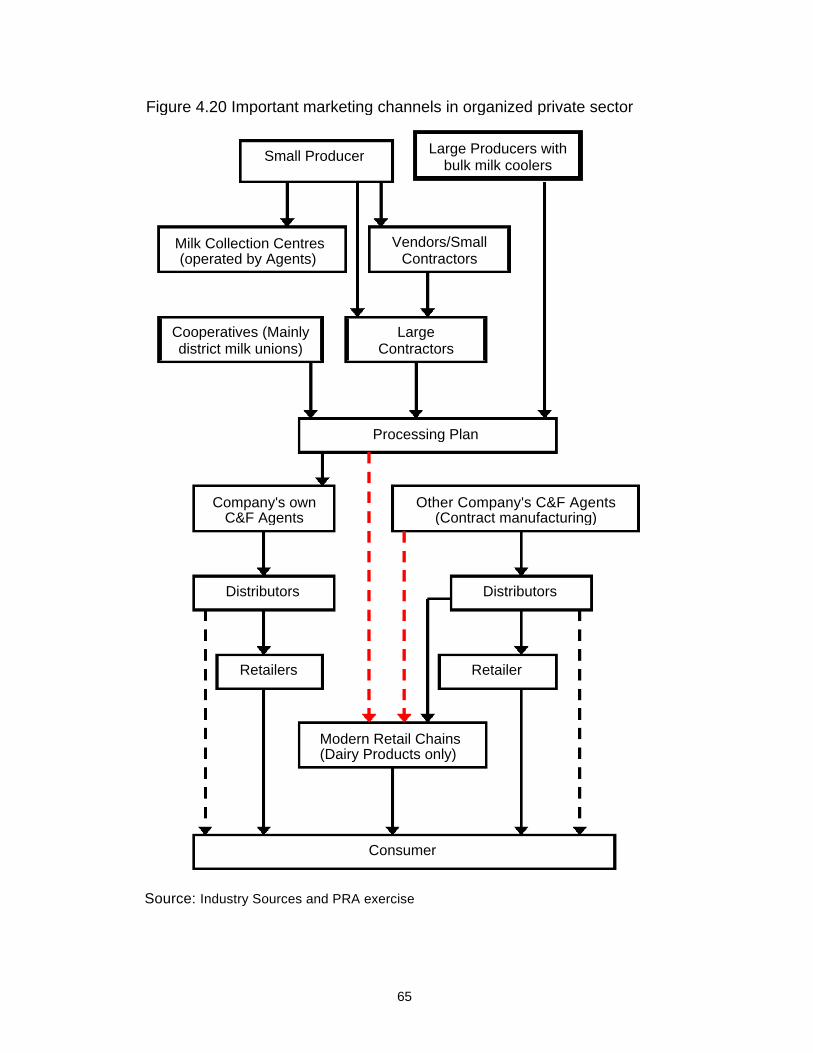
5.4.5 Marketing channels and institutions..........................................................39 5.4.6 Shift in marketing channels .........................................................................41 5.4.7 Market infrastructure and incentives.........................................................42 5.4.8 Vendor/dudhias ............................................................................................42 5.4.9 Cooperatives ..................................................................................................42 5.4.10 Private sector .................................................................................................44 5.4.11 Marketing constraints...................................................................................44
5.5 Trade related issues ..............................................................................................45 6 Concluding observations and broad policy recommendations ..............................48 6.1 Main findings.........................................................................................................48 6.2 Implications ...........................................................................................................49
1 Executive summary During the structural transformation period, agriculture has been a declining sector in India. The share of agriculture in the total Gross Domestic Product (GDP) in the early fifties was more than half, which declined to 28.4 per cent (at 1993-94 prices) in 1993-94 and further showed a declining trend, reaching a level of 19.8 per cent in 2003-04. Although contribution of agriculture and allied sectors to the national GDP has declined over the last few decades, livestock sector has been among the few high-growth sectors in rural India. Among crop and livestock products, milk group has remained number one farm commodity in terms of its contribution to the gross value of output from agriculture in the national economy. The Indian Dairy Industry underwent tremendous changes after the launch of the Operation Flood programme (OF) in 1970, which was mainly based on the milk producers voluntarily grouping themselves as members of the dairy cooperatives. With the liberalization and globalization of the Indian economy in 1990, the private players, multinational corporations (MNCs) and Indian industrialists entered the dairy sector. With the opening of the economy, after becoming a member of the World Trade Organization (WTO) in 1995 and the amendment of the Milk and Milk Products Order (MMPO) in 2002, India made the commitment to remove the restrictions on trade in the Indian dairy sector. The Indian dairy industry now has to compete domestically as well as internationally. Emphasis therefore, has to be given along with mass production to efficient and quality products, which is difficult under existing market structures since milk producers are smallholder producers. Rapid changes are taking place in the structure and governance of agrifood markets in India, which include consolidation, institutional, organizational and technological transformation, and multinational ization. These changes are occurring very quickly and are bringing rapid changes to the organizational, institutional and technological practices all the way ‘upstream’ in the agrifood systems. Socio-economic factors (income, population, tastes, and preferences) on the demand side and various supply side factors such as trade liberalization, privatization and modernization of agro-processing and retailing sector are major drivers of changes. Supermarkets in India presently account for a very small share of fresh agricultural produce retail sales but sales are growing. Small-scale dairy farming, which supports the livelihoods of the majority of rural households, is poorly prepared for these changes, which brings opportunities but also can drive domestic producers out of traditional markets, and impose high barriers (mainly in terms of food safety and hygiene, sanitary, and phytosanitary measures) into new markets both domestic and international. This report analyses major changes in Indian dairy market structures and likely impacts on small-scale producers and processors, and identifies and assesses strategies by which small-scale producers can participate in these evolving markets. The main findings of this report are:
7
• Dairying in India plays an important role in the national economy and also in the socio-economic development of millions of rural households. The OFP based on the cooperative movement has been important in dairy marketing in different parts of the country and undoubtedly has played an important role in keeping smallholders involved with this fast-growing sector. During the past three decades, milk production as well as per capita availability of milk has increased significantly.
• The Indian dairy sector has become progressively more liberalised since 1991,
with a major amendment in 2002 in the MMPO that restricted the ability of private dairies to procure milk in areas being served by the parastatal cooperative sector. The structure of dairy processing has changed considerable during the last decade. The number of private dairy processing plants has increased significantly but cooperatives have gone for capacity expansion.
• Restructuring of Indian dairy industry is taking place at a faster rate in the
processing sector while restructuring at the marketing and production side is slow. Some changes are also taking place in production and procurement segments, which are more pronounced in the Punjab and Haryana states. The share of the organised sector in milk procurement and marketing is increasing but the unorganised sector is still a dominant market player. It is expected that the scaling-up in milk production will take place with the entry of organised players in agrifood sector in order to reduce transaction costs and ensure the quality of raw materials by large players. However, the fear is that with the increasing power of private companies and large modern retail chains, smallholder producers might face significant market uncertainties if appropriate safeguards are not put in place.
• The share of smallholder dairy farmers in the total milk production is very high
(about 80 per cent) but the scaling up of milk production is taking place in some states due to the entry of the organised private sector. There have been seen some strategic alliances or partnerships in dairy processing and marketing segments which is bringing some changes in milk production.
• Smallholder milk producers face numerous production constraints and chief
among these are: non-remunerative prices, a shortage of quality feed and fodder, declining farm size, low genetic potential of dairy animals resulting in low productivity levels, unavailability of institutional finance, unreliable breeding services, poor animal health care facilities, labour shortage (mainly in the Punjab), poor extension services, poor rural infrastructure such as roads, and an assured supply of power.
• Marketing is dominated by sales of farmers to the unorganised sector, mainly
vendors in the Punjab and Haryana, while in Gujarat sales of raw milk to dairy cooperatives is a major marketing channel. The main problem in the unorganised sector is quality, which creates a serious threat to the health of consumers.
8
Unhygienic production conditions, substandard processing equipments, improper use of veterinary drugs, and improper handling, storage, and transport of milk etc. contribute to the poor quality of milk in the unorganised sector. To bring about structural changes in the unorganised sector, the Government of India has introduced a dairy venture capital fund scheme under which assistance will be provided to the rural beneficiaries for basic processing at the village level, and market pasteurised milk, upgrade of quality and traditional technology to handle the commercial scale using modern equipment and management skills through bankable projects.
• There is no penetration of new retailing institutions at the farm level but it is
expected that with the entry of companies such as Reliance, the situation might change. In the organised sector, buyers provide various inputs and services such as breeding, animal health care, feed, and fodder etc. to farmers. High transaction costs, poor marketing infrastructure, lack of information about price and market, poor knowledge, and exploitation by middlemen due to the absence of organised players were major marketing constraints faced by small farmers.
• In some cases farmers shift from one marketing channel to another, due to the
provision of services such as artificial insemination, veterinary services, feed supply, price based on the quality of milk and assurance of regular payments, bonuses, credit facilities, and technical inputs provided by the organised sector. There has been a significant increase in the market infrastructure in selected states but their performance is not up to the mark.
• Due to the increasing competition within the sector and the increasing role of the
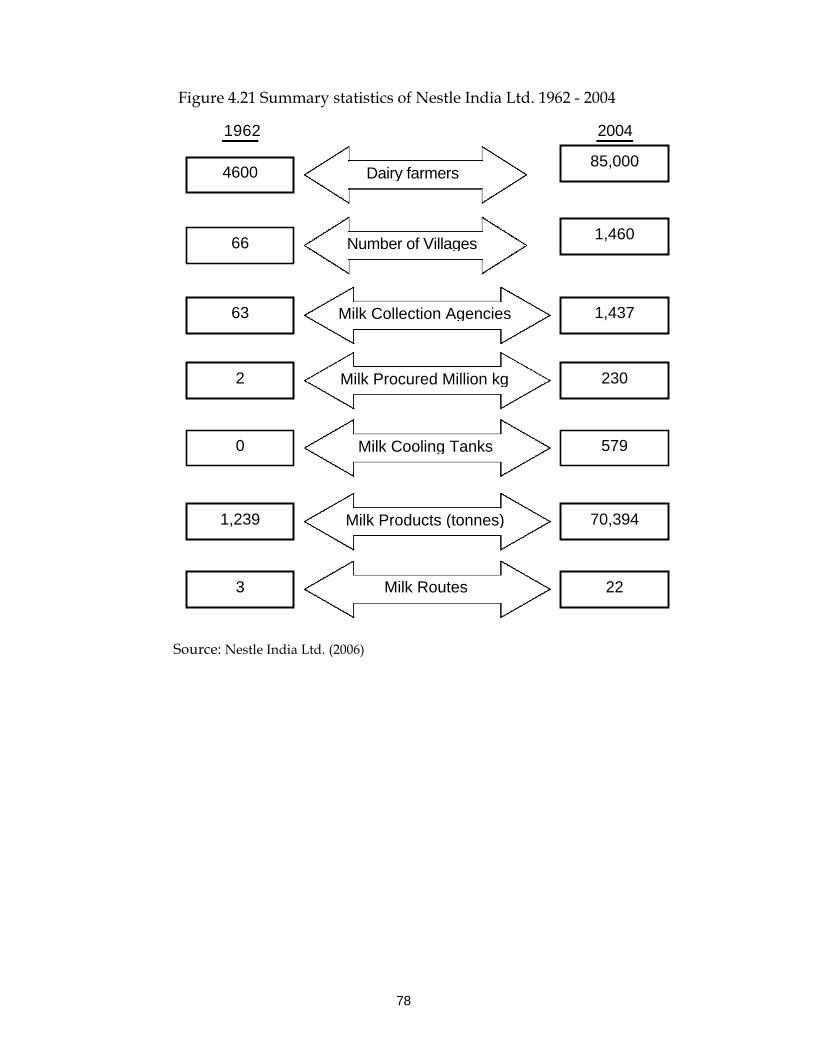
modern retail sector in the country, some larger players have initiated some steps to countervail the market power of modern retailers. For example, recently all 13 members (district milk unions) of the Gujarat Cooperative Milk Marketing Federation Ltd. (GCMMF) - one of the largest cooperative sector organizations, decided to consolidate their position under the umbrella brand name of ‘Amul’. Currently, these dairies market their produce, mainly fluid milk and other dairy products under their brand names within their districts but outside they are all marketed as ‘Amul’. This consolidation would significantly reduce marketing expenses of the district unions. A strong formidable brand will build a clear identity that the consumer can connect to. It will also enable the organization to manage the brand better, increase brand efficiency and ultimately benefit the consumer, as the price benefit ratio will increase. In the case of Nestlé , steps have been initiated to promote commercial dairy farming in the area to reduce procurement transaction costs and the assured supply of quality raw milk.
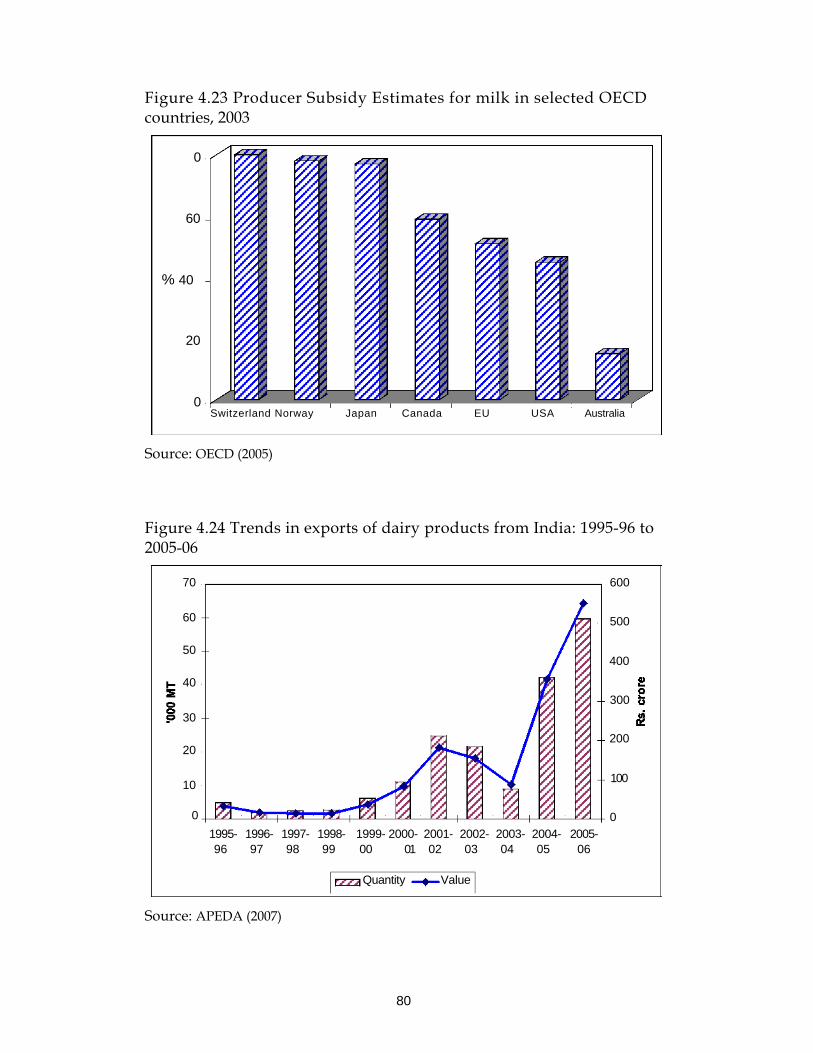
• The dairy sector remains one of the most protected agricultural sectors in the
world and the trade in dairy products is relatively small to production where few countries dominate global trade. India is the largest milk producer in the world, but a small player in global markets. Milk production in India, by and large, meets its demand, and hence exports and imports of dairy products are on a
9
small scale. However, exports of dairy products have increased significantly over the last few years, mainly due to high world prices but the government imposed a ban on the export of skimmed milk powder in February 2007 until September 2007, in response to rising milk prices in the country. However, industry leaders felt that India's credibility as the largest milk producer in the world as well as a reliable exporter in importing countries would suffer, and milk-producing farmers would be severely affected due to the ban on milk powder exports.
The major implications of this study are: • It is certain that on the demand side, producers would face more competition
with the opening of markets and the increasing importance of food safety and hygiene. There is an unprecedented growth in the modern retail sector, which is bound to increase in the future. In order to countervail the market power of large modern retailers (national as well as multinationals), it is extremely important to organise smallholder producers and processors to increase their bargaining power. In addition, cooperatives/producers' association would help in overcoming high transaction costs.
• Farmers' problems cannot be solved simply by providing government support,
as public institutions are inefficient service providers. In order to sustain growth in the agrifood sector and make smallholder producers competitive, it is important to establish and develop efficient and transparent market institutions and mechanisms.
• Public policies should focus on reducing transaction costs by making public
investment in the rural infrastructure for dairy development such as cold chain, rural roads, power supply, and also encourage private investment in post-harvest management practices, and improve intermediary organizations to reduce the transaction costs between producers and market partners. The focus of the government should shift from regulation to facilitation.
• There is a need to have an appropriate framework in place for the formulation
and implementation of trade policy measures, if India has to exploit the opportunities of international trade as well as safeguard a mechanism to protect smallholder producers against subsidised/cheap imports.
10
2 Introduction 2.1 The role of agriculture in the Indian economy India, which is one of the largest agricultural based economies, remained closed until the early 1990s. The new economic policy of 1991 stressed both external and internal sector reforms. The external reforms comprised of reforms in exchange rate, trade, and foreign investment policies. Against this, the internal sector included reforms in industrial policy, price and distribution controls, restructuring in the financial and public sector etc. The signing of the Uruguay Round Agreement on Agriculture (URAA) in 1994, made India's intentions clear to follow a liberal agriculture policy. The structural adjustment and stabilization programmes reduced controls and state interventions in agriculture including the dairy sector.
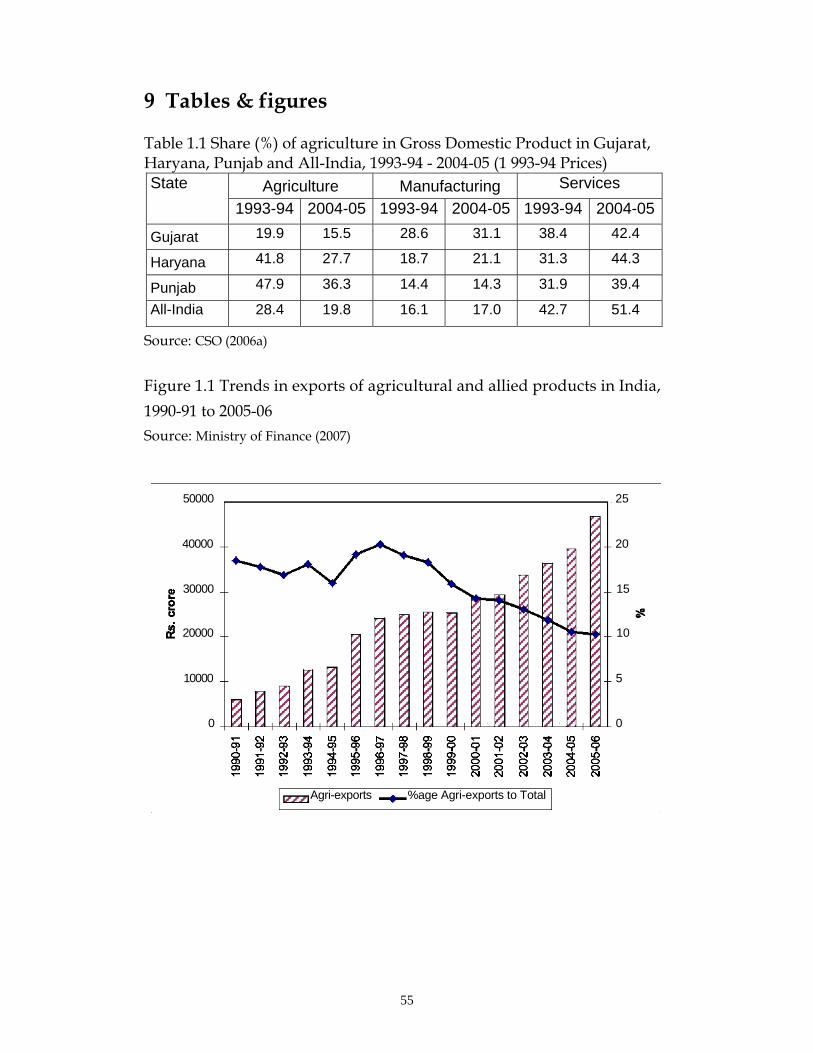
It could be rightly observed from the available data that the leading industrialised countries of the world were once predominantly agrarian economies, while developing countries still have a dominance of agriculture and the agricultural sector still contributes significantly to the national income. In India, agriculture contributed to more than half of the nation's GDP in the early fifties, but its share declined by 28.4 per cent in 1993-94 (at 1993-94 prices) and reached a level of nearly 20 per cent in 2004-05 (Table 1.1). However, the importance of the agricultural sector varies across the states. For example, in the study the Indian states’ share of agriculture in Gross State Domestic Product (GSDP) is the highest in the Punjab (36.3 per cent), followed by Haryana (27.7 per cent) and the lowest in Gujarat (15.5 per cent). The Punjab and Haryana are basically agrarian economies while Gujarat is an industrial State. However, a declining trend was observed in the share of agriculture in GSDP between 1993-94 and 2003-04 in all Indian states. The declining importance of agriculture is historically common to all countries.
The population of India has increased from 439 million in 1961 to 1020 million in 2001, registering an increase of around 134 per cent. In contrast, the country’s food grain production has increased from 82 million tonnes in 1960-61 to 204 million metric tons in 2004-05 showing an increase of about 150 per cent. This shows that the development in agriculture has taken place at a higher rate than population growth. The share of agricultural exports in total exports of the country has declined in the post-reform period but in absolute value it has increased from about IRs 6,000 crore to IRs 46,703 crore in 2005-06 (Figure 1.1).
The decline in the share of agri-exports to total exports, notwithstanding the growth in its volume, was because of a much faster growth in the volume of merchandised exports. Marine products, with a share of 15.1 per cent in 2005-06 dominate agri-exports, followed by rice (13.3 per cent), oil meals (10.4 per cent), raw cotton (6.2 per cent) and cashew kernels (5.6 per cent). In general India does not export large quantities of livestock products or dairy products in particular.
11
Agriculture employed about 80 per cent of labour in the early 1960s, which declined to about 58 per cent in the late 1990s. Agriculture development allows a shift of manpower from agriculture to non-agriculture sector. It is expected that by 2020, the share of agriculture workers to total workers would come down to about 40 per cent. Not only this, but the development of agriculture has lead to the development of a rural infrastructure like rural roads, transport, storage etc. and creating demand for industrial, commercial, and consumption products. It has also helped in reducing the inequality of income in rural and urban areas. 1.2 The important livestock and dairy sub-sector While India's entire agricultural sector has performed well in terms of growth during the last three decades, we will focus on the dairy sector because of the very rapid growth in the sector. Though contribution of agriculture to the national GDP has declined during the last few decades, the livestock sector has been among the few high-growth sectors in rural India (Figure 1.2). The livestock sector accounted for 22.87 per cent of the agricultural GDP in 1993-94, which increased to 29.27 per cent in 2002-03 (Figure 1.2). The share of livestock in the gross value of agricultural output has increased from 18.6 per cent in 1971-72 to 24.4 per cent in 1991-92 to 27.5 per cent in 2003-04 (CSO, 2005). The dairy sector contributed the largest share in agricultural GDP. Among crop and livestock products, the milk group remained the number one farm commodity in terms of its contribution to the gross value of output from agriculture. The value of the milk group was IRs 108,839 crore in 2005-06 at 1999-2000 constant prices, which was much higher than the value of output from rice (IRs 71,595 crore), the second largest contributor to the agricultural sector. The contribution of the livestock sector (at 1999-2000 constant prices) as a whole is significantly higher (IRs 161,294 crore) than the contribution of food grains (IRs 150,695) in 2005-06 (CSO, 2007). The large contribution that the livestock sector makes to the national economy is a reflection of the multiple roles that livestock plays in the farming systems in the country. The dairy and poultry are high-growth sectors and is reflected in the growing importance of the contribution of these sub-sectors in the livestock economy (Table 1.2). The output in the dairy sector increased by over four times and its share total value of output from the livestock sector has increased from about 55 per cent during 1951-52 to about 66 per cent during 2003-04. The share of the meat sector has declined from 20.8 per cent to nearly 16 per cent during the same period but the share of the poultry sector (meat and eggs) has increased from 5.8 per cent to 12.2 per cent. The growth in the dairy sector is mainly attributed to a successful implementation of the Operation Flood programme (OF) and other dairy development programmes implemented mainly by cooperatives under the
12
dynamic leadership and guidance of the National Dairy Development Board (NDDB), and the Central and State governments. The government attaches great importance to dairy development as an instrument of promoting the socio-economic development of rural people, particularly marginal and small farmers and landless agricultural labourers. Until the late 1960s, India's dairy sector was by and large traditional and stagnant. The dairy projects of that era were consumer oriented and producers' interest did not receive much attention. However, an important landmark of that period was the adoption of the Anand Pattern Cooperative Societies (APDCSs) and the establishment of the National Dairy Development Board in 1965 to replicate APDCSs throughout the country. Under this programme small farmers were organised into dairy cooperatives, linked to chilling centres/milk processing plants and finally to consumers, and shared the profit earned from the sale of milk and dairy products. Due to this innovative model, from chronic shortages of milk, India has today emerged as the largest producer of milk in the world exceeding 91 million tonnes. This success story of Indian milk production has been written primarily by millions of smallholder producers, who dot the landscape of milk production in the country. Although the yields have remained quite low compared to world standards, the sector has not only survived but also flourished. Several factors appear to have helped it flourish. The OF programme, one of the world's largest dairy development programmes, which helped to create strong network and linkages among millions of smallholder producers, processors and urban consumers, was an important instrument in achieving this success. It all happened under autarky and highly regulated domestic markets. Commercial imports and exports of almost all dairy products had been banned for most of the time and the processing activity had been controlled through licensing which favoured cooperatives over private entrepreneurs. Since the early 1990s, India embarked upon a liberal policy framework, which got reinforced with the signing of the URAA in 1994. The dairy industry was de-licensed in 1991 and the private sector, including multinational companies (MNCs), were allowed to set up milk processing and product manufacturing plants. However, in 1992, controls were brought back through the Milk and Milk Products Order (MMPO) with a view of having an 'orderly growth' within the dairy industry in India, which was amended in 2002 and all restrictions in the dairy processing sector were removed. On the market side, recently some agribusiness and food processing companies (both national and multinational) - often as part of their own restructuring - have started entering into contracts with farmers and rural households to provide basic inputs in return for guaranteed and quality supplies. This process for interlinked contracting is growing rapidly in the Indian agriculture, but some government policy interventions still restrict the free participation of private players in output and input markets in some States. The problems are made
13
even worse by the lack of public institutions, which are necessary to support market based transactions, such as those for enforcing contractual agreements. In the absence of appropriate public institutions, private contractual initiatives often from food and agribusiness companies are emerging to overcome these obstacles. Rapid changes are taking place in the structure and governance of agrifood markets in developing countries including India. The food industry changes include consolidation, institutional, organizational and technological transformation and multinational ization. These changes are occurring very quickly in many developing countries and are bringing rapid changes in organizational, institutional and technological practices all the way ‘upstream’ in the agrifood systems. Socio-economic factors (income, population, urbanization, tastes and preferences) on the demand side and various supply side factors such as trade liberalization, privatization and modernization of the agro-processing and retailing sector are major drivers of changes. Supermarkets in India presently account for a very small share of the fresh agricultural and livestock produce retail sales. However, sales are growing. Given the rapid and dynamic growth of the dairy sector in India, as well as a growing demand for milk and dairy products as well as the importance given by the government, it is necessary to understand the dairy value chain from farm to consumer. However, the opening up of the Indian dairy sector might provide opportunities for smallholder producers, but can also drive domestic producers out of the traditional markets and impose high barriers to enter into new markets. Therefore, there is an urgent need to understand the impact of the changing market structures on small-scale producers and to identify and assess strategies by which small-scale producers can participate in these evolving markets. It is also important to understand that the best practices for connecting small-scale producers with dynamic markets and bring these findings into the public and private sector policy formulation. This study responds to some of these issues through semi-structured interviews and group discussions with major stakeholders in the dairy industry, including farmers, milk processors, supermarkets, grocers, farmers'/community leaders, other players in the dairy value chain, key informants like Government, NGOs and business leaders. 2.2 Objectives and key questions of the study The key goal of Component 1 is to prepare an evidence-based policy advice related to implications and opportunities for milk producers under a growing demand for dairy products and the restructuring of upstream markets in India. Therefore, Component 1 tries to identify the determinants and consequences of the restructuring of the dairy sector in India. The study is conducted through three interlinked ‘modules’, macro/national meso level (the study of the food industry change through key informant interviews, structured with a commodity value
14
chain analysis), the meso level (study of the product and factor market change and institutional, social, and organizational context at the community level, through Participatory Rural Appraisal (PRA) to sharpen the policy advice and enhance participation of policy stakeholders), and the micro level (study of farm level practices and responses, through farm-level surveys and analysis). The present study responds to the following questions through macro and meso-level studies: 1. What is the nature of the restructuring of the Indian dairy industry in terms of national patterns in production, processing, wholesale, and retail change and dairy farmer? What are the implied changes (relative to traditional markets) in incentives and requirements facing the farmer in restructured markets derived chiefly from the product and transaction attributes/standards (such as quality, safety, volume, consistency over time of delivery, and packaging)? 2. What are the market channel choices and multi-market strategies of farmers under restructured and traditional markets? How do they undertake those strategies, collectively or individually? 3. What are technological, managerial, and organizational practices/behaviour related to the market channel choices of the farmers? What are the determinants of their behaviour? 4. What are the interactions between the market and production practice behaviour of producers and the local food industry segments on the one hand, and inputs and services on the other? 2.3 Organization of the report The entire study has been presented in 6 sections. Chapter 1 introduces the problem and highlights the role of agriculture in the Indian economy and the importance of the livestock and dairy sector and in the agrifood sector. The objectives and key questions of the study also form part of this section. In chapter 2, changes in the national food market and driving forces of these changes are discussed. It also describes the major policy changes in the Indian dairy sector and their impacts of the structure of industry in the context of dairy supply chain management. Chapter 3 discusses the methodology, as followed at the village level i.e. the producer group, procurement of commodity in the formal and informal sector and again in the formal sector within the cooperative and private sector, selection of commodity, study area and method of survey. In chapter 4, a description of the study area in general and trends in milk production, inputs, services and production constraints form the subject matter of the chapter. This section also deals in detail various marketing issues such as marketing channels, market incentives, market institutions, marketing infrastructure and the constraints faced in the marketing of milk and milk products based on local meso level study. Policy implications for policy planners, analysts and other
15
stakeholders (C-3 module) and links to module-3 (micro-level study) are presented in Chapter 5.
16
3 The restructuring of the Indian food sector: a case study of the dairy industry
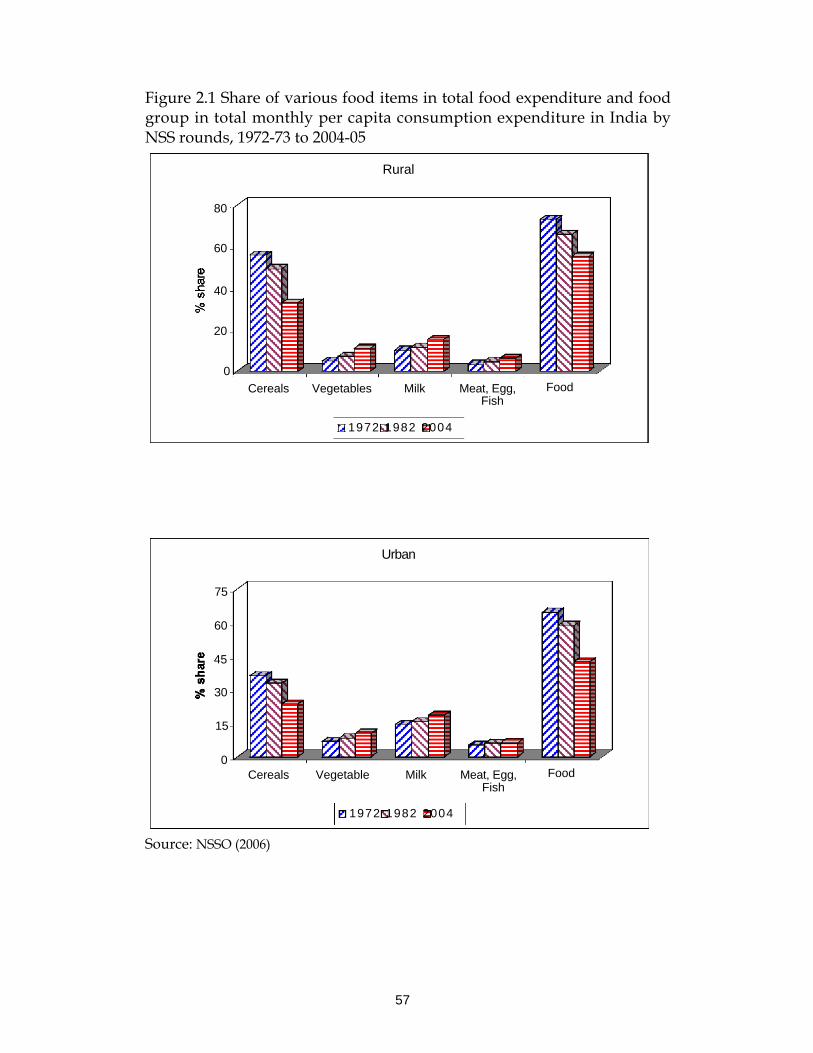
Many Asian countries including India are undergoing transformations in their economies, changes in tastes and lifestyles, urbanization, and rising income levels. All of which are likely to have significant influences on food demand. With the rapid increase in income and urbanization, food consumption in India has shown a pattern of change over the past three decades. From a diet primarily characterised by cereal staple foods; mainly rice and wheat, to one that includes a larger share of milk and dairy products, fruit, eggs, fish, meat, as well as processed foods. As expected, there has been a continuous shift of food expenditure in favour of high value foods (Sharma, 2004). Consumption pattern trends during the last three decades indicate that food continues to dominate consumption expenditure. However, the share of food expenditure has declined from 72.8 per cent in 1972-73 to nearly 55 per cent in 2004-05. The share of cereals within food expenditure has declined from 55.7 per cent in 1972-73 to 49.3 per cent in 1982 and 32.8 per cent in 2004-05 in rural areas (Figure 2.1). Milk and milk products is the second most important in food expenditure, having a share of 15.3 per cent in food expenditure in 2004-05 (up from 10 per cent in 1972-73), and shows the second largest increase in a share of over 5.8 percentage points between 1972-73 and 2004. Shares of vegetables more than doubled from about 5 per cent in the early seventies to about 11 per cent in 2004-05. The results for urban areas show almost the similar trends. Expenditure on non-food items dominated consumer expenditure with a share of 58.4 per cent in 2004. The share of food expenditure in the total expenditure declined from 64.5 per cent in 1972-73 to about 42.5 per cent in 2004-05. Expenditure on milk and milk products is the second important item with a share of about 18.6 per cent in 2004-05. The shares of vegetables, meat, eggs and fish have also increased in urban areas. The results clearly show that high-value products like milk and dairy products, meat, fish fruits, and vegetables have become more important in both rural and urban areas during last three decades. A comparison of food and non-food expenditure between rural and urban areas indicates that the consumption of food items in urban areas is nearly 45 per cent higher than rural areas. While non-food expenditure is almost two and a half times higher in urban areas. These differences presumably are due to the differences in income levels. However, with rising rural incomes and changing life styles, easy accessibility etc., demand for high-value food products and non-food items is expected to rise in future. The per capita GNP in India has increased from IRs 8,074 in 1991-92 to IRs 13,257 in 2003-04 (Figure 2.2). Given that consumers tend to spend a high proportion of their
17
income on food, and given that the income per capita has been rising for a considerable period of time, all of these will have consequences on the demand and supply of high value agricultural products. As dramatic changes has taken place on the demand side during the past two decades, great changes have also taken place in the production and downstream segments of the milk marketing chain. These changes can be summarised by changes in the number and size of processing and marketing segments and shifts in the composition of different segments of the value chain. 3.1 Evolution of the national food markets Until the late 1970s, India's economic policies focused on self-sufficiency, import-substitution and state controls on agriculture, basic infrastructure and manufacturing industries. While this approach led to a significant increase in agricultural production, a rapid expansion of India's industrial base, productivity growth in the manufacturing sector was repressed by a lack of foreign and domestic competition. During this period, the GDP growth rates were nearly 3.0-3.5 per cent. However, a consensus began to develop in the mid 1980s and was realised that India would have to liberalise its economy to reduce poverty rapidly, create adequate resources for social programmes and modernise its infrastructure and manufacturing sector. In the early 1990s India initiated a major transformation of its development strategy. India vigorously embarked upon a liberal policy framework, which was reinforced by becoming a member of the World Trade Organization (WTO) in 1995. 3.1.1 The food retail sector and supermarkets The food retail sector in the country has been predominantly disorganised, fragmented, highly regulated, and protected. However, this picture began to change in the early 1990s, when the agrifood system was liberalised as part of the economic reforms. The 1990s saw an emergence of supermarkets and the first major entry of the corporate sector into the Indian agrifood sector was in 1996. When the Indian company, RPG, with an annual turnover of IRs 11,000 crore, entered into retail food sector and launched a separate division called "Food World". The company entered into a Joint Venture (JV) with the Hong Kong based Dairy Farm International (DFI) in 1999. However, the JV was called off and RPG exited Food World with 48 stores named Spencer's Supermarkets while Dairy Farm Retained 45 stores under the Food World banner. The Dairy Farm International is now looking for another Indian partner. Thereafter, many large Indian companies have either got into the agrifood sector or have major plans to enter the sector. Pantaloon Retail (India) Ltd entered into modern retail in 1997 and launched Big Bazaar, a hypermarket chain, followed by Food Bazaar in 2001, a supermarket
18
chain. Which now has over 100 stores across 25 cities with 4 million sq ft of retail space and a plan to have 30 million sq ft of retail space by 2010. Many other companies like Godrej, ITC, Tata, Metro Cash & Carry, etc. have entered the food retail sector. Many of these companies had some prior experience in the sector. However, two new entrants, Reliance and Bharti, have no prior experience of the food retail sector. Reliance Industries Limited, the Indian corporate giant, entered the retail sector with its first store (Reliance Fresh) in Hyderabad in November 2006. It has very big plans for the future and has signed agreements with many state governments. Reliance plans to create a million additional jobs. The formats range from high-end luxury to grocery items and a pan Indian presence, over 100 million square feet of retail space. The various formats are opening in almost 1000 towns and target top line of IRs 90,000 crore by 2010 (Economic Times, December 3, 2006). Their focus is on agribusiness and the rural sector. The world's largest retailer Wall-Mart entered the Indian market through a franchisee agreement with Bharti Enterprises, India's largest telecommunications company (Economic Times, December 3, 2006). As per the agreement, Bharti will run the front-end retail operations while both Wal-Mart and Bharti will invest jointly in another company, which will engage in cash & carry, logistics, supply chain and sourcing - areas in which 100 per cent FDI is allowed. Bharti has also been in discussions with the British retailer Tesco and Carrefour of France, but negotiations with them did not fructify. Bharti has a joint venture with ELRo Holdings India, 'Field Fresh Foods' for global distribution of fresh fruit and vegetables.
19
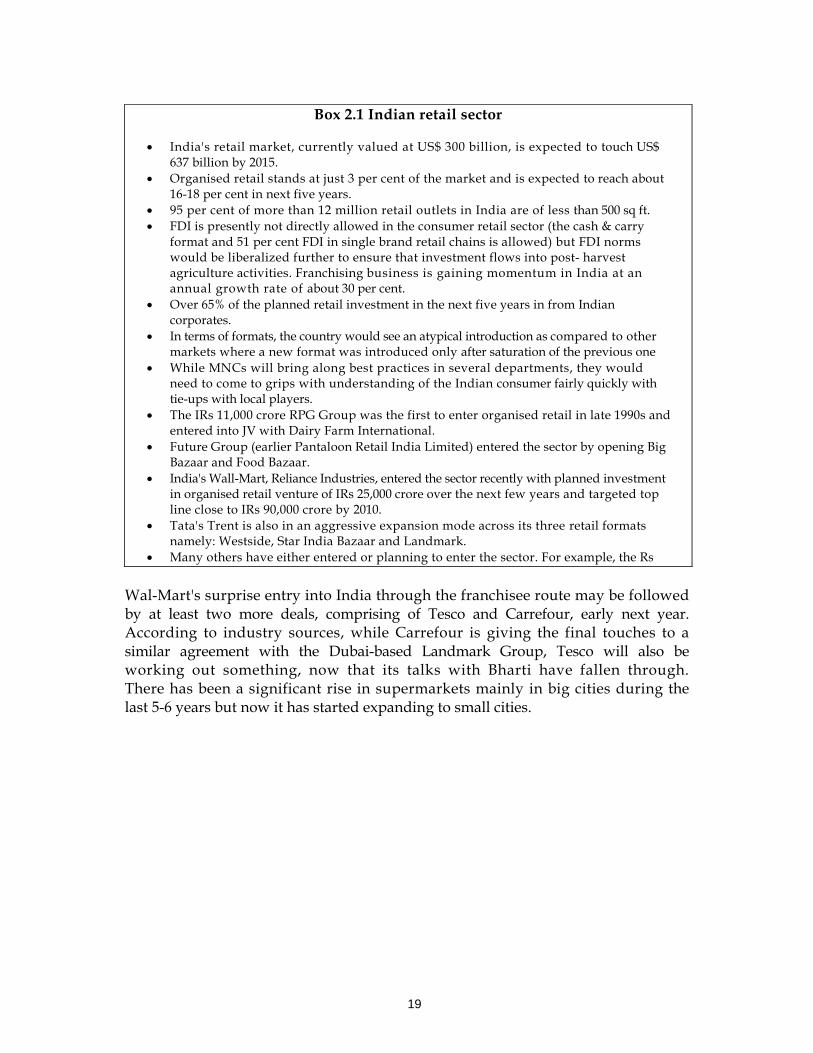
Wal-Mart's surprise entry into India through the franchisee route may be followed by at least two more deals, comprising of Tesco and Carrefour, early next year. According to industry sources, while Carrefour is giving the final touches to a similar agreement with the Dubai-based Landmark Group, Tesco will also be working out something, now that its talks with Bharti have fallen through. There has been a significant rise in supermarkets mainly in big cities during the last 5-6 years but now it has started expanding to small cities.
Box 2.1 Indian retail sector • India's retail market, currently valued at US$ 300 billion, is expected to touch US$
637 billion by 2015. • Organised retail stands at just 3 per cent of the market and is expected to reach about
16-18 per cent in next five years. • 95 per cent of more than 12 million retail outlets in India are of less than 500 sq ft. • FDI is presently not directly allowed in the consumer retail sector (the cash & carry
format and 51 per cent FDI in single brand retail chains is allowed) but FDI norms would be liberalized further to ensure that investment flows into post- harvest agriculture activities. Franchising business is gaining momentum in India at an annual growth rate of about 30 per cent.
• Over 65% of the planned retail investment in the next five years in from Indian corporates.
• In terms of formats, the country would see an atypical introduction as compared to other markets where a new format was introduced only after saturation of the previous one
• While MNCs will bring along best practices in several departments, they would need to come to grips with understanding of the Indian consumer fairly quickly with tie-ups with local players.
• The IRs 11,000 crore RPG Group was the first to enter organised retail in late 1990s and entered into JV with Dairy Farm International.
• Future Group (earlier Pantaloon Retail India Limited) entered the sector by opening Big Bazaar and Food Bazaar.
• India's Wall-Mart, Reliance Industries, entered the sector recently with planned investment in organised retail venture of IRs 25,000 crore over the next few years and targeted top line close to IRs 90,000 crore by 2010.
• Tata's Trent is also in an aggressive expansion mode across its three retail formats namely: Westside, Star India Bazaar and Landmark.
• Many others have either entered or planning to enter the sector. For example, the Rs
20
Box 2.2 Foreign retailers in India
Retailer Format Status (as at January 2007)
Auchan Hypermarket Evaluating
JC Penny Multi-Format Evaluating
Tesco Multi-Format Evaluating
AS Watson Multi-Format Evaluating
Woolworth Specialized Stores JV with Tata's Infinity Retail
Wal-Mart Hypermarket JV with Bharti
Carrefour Multi-Format Awaiting Approval
ShopRite Cash-n-Carry Wholesale
Metro Cash-n-Carry Wholesale (I Investment Mode)
Marks & Spencer Single Brand Store Franchise
Landmark Lifestyle Store NRI/OCB Route
Mango Specialized Stores Franchise
Espirit Specialized Stores Tie-up with Indian Rayon
Zara Specialized Stores Evaluating
United Colors of Benetton Specialized Stores Franchise
Next Specialized Stores Eying Partnership with Planet Retail
Source: Economic Times, 5 January 2007
Currently, the issue under debate relates to the Foreign Direct Investment (FDI) in the retail sector. Some political parties in the present government have been strongly opposing FDI in the retail sector. The main concern of the left wing political parties, trade unions and other opponents of the proposal is that it will hurt the vast number of existing small and medium retailers in the country who account for over 80 per cent of the retail trade. According to one estimate, over 40 million people are engaged in this business. On the other hand, as per a recent study, India's retail industry favours allowing FDI in the sector, in a calibrated manner to allow domestic players to prepare for competition. Most companies argued that the organised retail industry was at a nascent stage and formed only three per cent of the entire retail trade. If the sector is opened up now, the country will attract small foreign investment compared to what the country can attract in a few years time. They cited the example of China, which opened up its retail sector to FDI; only after the domestic organised retail industry was large enough to face competition from foreign players. The government allowed FDI up to 51 per cent in single brand products in 2006. However in the long term, it may not be possible to stop multi
21
national corporations (MNCs) entry into the retail business due to a commitment to liberalise trade and investment.
The sector is in an evolving stage and moving towards an industrialised system with the consolidation of activity, more extensive reliance on contract production, vertical integration, and a more open trade. Understanding the nature of industrialization in the agribusiness sector and likely impacts of these changes on smallholder producers is crucial to assessing the role of government in the restructured agrifood system. A major traditional rationale for a government role in agricultural marketing is to address problems of unequal market power, particularly the low bargaining power of smallholder farmers. In countries like India, where "industrialization" has just started, unequal bargaining power remains an important policy issue for the government. 3.2 Restructuring of the Indian dairy industry As a part of agriculture, the dairy sector in India comes under the State subject to policy concerns. The central government, however, has taken a lead in formulating policies in this sector at the national level while implementation of these policies has been largely left to the State Governments. Dairy development in India has been mainly in the cooperative sector for the last two and half decades, beginning with the OF programme in 1970-71. The OF programme was based on the cooperative movement and has been important in dairy marketing in different parts of the country and undoubtedly has played an important role in keeping smallholders involved with this fast-growing sector. During the past three decades, milk production in the country has increased from about 22 million tonnes in 1970-71 to around 97 million tonnes in 2005-06 and is expected to reach about 100 million tonnes in 2006-07 (Ministry of Agriculture, 2006b). The per capita availability of milk, which had decreased during the pre-OF programme period, not only kept pace with the growing population, but also increased from 107g in 1970 to 230g in 2005-06 and is expected to reach about 245g per day in 2006-07. Despite the importance of dairying in the Indian economy, especially for livelihoods of resource poor farmers and landless labourers, government policy for the sector has suffered from the lack of a clear, strong thrust and focus. One of the priority indicators to a sector could be judged from budget allocation under plan periods to the sector. The allocation of animal husbandry and dairying as total percentage plan outlay varied from 0.98 per cent during the Fourth Plan to about 0.18 per cent during Ninth Plan compared to the sector's contribution to the national GDP over five per cent. Although the dairy sector occupies a pivotal position and its contribution to the agricultural sector is the highest, the plan investment made so far does not appear commensurate with its contribution and future potential for growth and development. We can divide dairy sector policies in the country in the post independence period into three distinct phases:
22
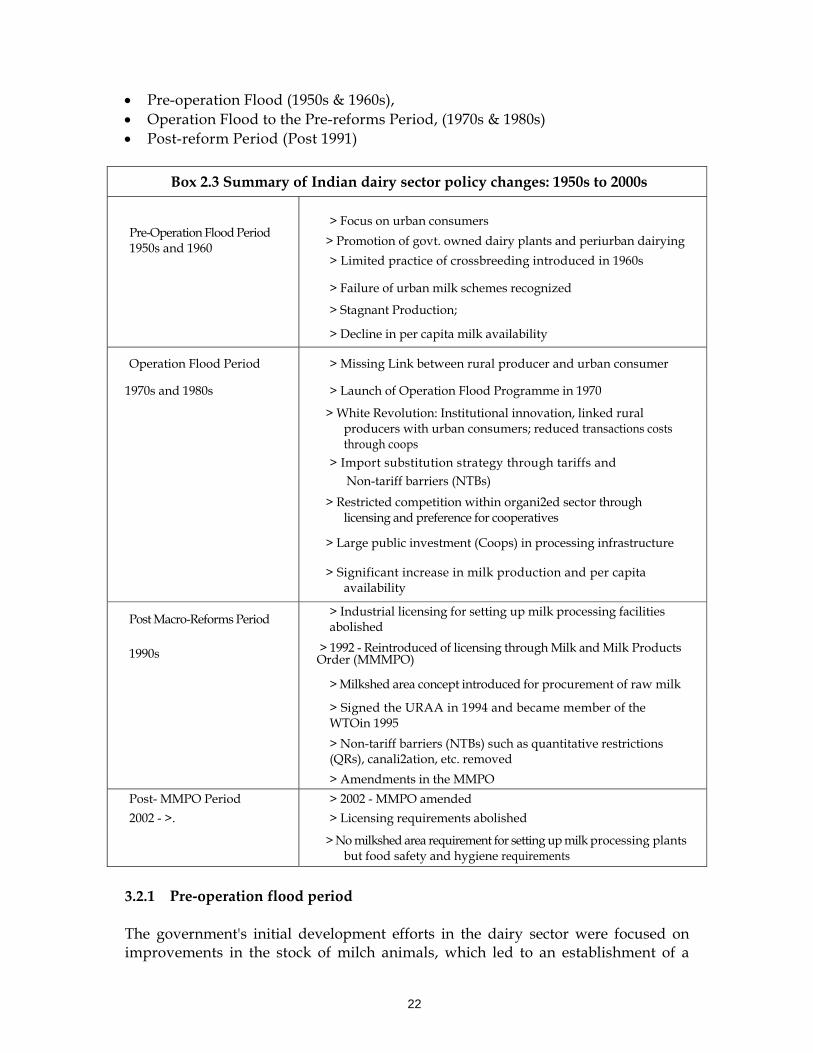
• Pre-operation Flood (1950s & 1960s), • Operation Flood to the Pre-reforms Period, (1970s & 1980s) • Post-reform Period (Post 1991)
Box 2.3 Summary of Indian dairy sector policy changes: 1950s to 2000s
Pre-Operation Flood Period 1950s and 1960
> Focus on urban consumers > Promotion of govt. owned dairy plants and periurban dairying > Limited practice of crossbreeding introduced in 1960s
> Failure of urban milk schemes recognized
> Stagnant Production;
> Decline in per capita milk availability
Operation Flood Period > Missing Link between rural producer and urban consumer
1970s and 1980s > Launch of Operation Flood Programme in 1970
> White Revolution: Institutional innovation, linked rural
producers with urban consumers; reduced transactions costs through coops
> Import substitution strategy through tariffs and Non-tariff barriers (NTBs)
> Restricted competition within organi2ed sector through licensing and preference for cooperatives
> Large public investment (Coops) in processing infrastructure
> Significant increase in milk production and per capita availability
Post Macro-Reforms Period > Industrial licensing for setting up milk processing facilities abolished
1990s > 1992 - Reintroduced of licensing through Milk and Milk Products Order (MMMPO)
> Milkshed area concept introduced for procurement of raw milk
> Signed the URAA in 1994 and became member of the WTOin 1995
> Non-tariff barriers (NTBs) such as quantitative restrictions (QRs), canali2ation, etc. removed
> Amendments in the MMPO Post- MMPO Period > 2002 - MMPO amended 2002 - >. > Licensing requirements abolished
> No milkshed area requirement for setting up milk processing plants but food safety and hygiene requirements
3.2.1 Pre‐operation flood period The government's initial development efforts in the dairy sector were focused on improvements in the stock of milch animals, which led to an establishment of a
23
network of veterinary hospitals all over the country. In the First Five Year Plan the Key Village Scheme (KVS) was launched to improve breeding, feed and fodder availability, disease control and increased milk production. To meet the requirements of milk supply to urban areas, the government promoted state-owned dairy plants, milk procurement handling, processing and marketing. In 1959, the government milk scheme; Delhi Milk Scheme (DMS) was setup in Delhi to supply milk to the urban population. This scheme adopted a method of departmental milk procurement from the milk producing areas around Delhi by setting up its own milk collection and chilling centres. Although the collection initially started from small milk vendors, it ultimately ended up creating large contractors, who purchased milk from the small vendors and supplied in bulk to the milk scheme. The Intensive Cattle Development Programme (ICDP) was launched in areas with high milk potential. The same policies and strategies continued during the 1950s and 1960s. As a result the total milk production of the country remained almost stagnant and the per capita availability of milk declined during the 1950s and 1960s. 3.2.2 Operation flood programme (1970s and 1980s) The dismal performance of the dairy sector during the 1950s and 1960s concerned the policy makers and the Government of India took one of the far-reaching policy initiatives in the sector. Dairy development through producers' cooperatives and milk production based on milk sheds in rural areas after a successful experience of dairy cooperatives in Gujarat (the three-tier model) became the cornerstone of the new dairy sector policy (Figure 2.3). This policy initiative turned around the Indian dairy sector and led to an all-round growth with several unarticulated spread effects. Once the decision to adopt the cooperative structure, as a means for dairy development, was taken, government policies were formulated to support dairy cooperatives. Large public investments were made in the milk processing and marketing infrastructure through cooperatives. The Government of India launched a massive dairy development programme popularly known as ‘Operation Flood’ from 1971 to 1996, which was implemented by the National Dairy Development Board (NDDB). The programme was initially started with the help of the World Food Programme (WFP) and later continued with the dairy commodity assistance from the European Economic Community (EEC) and a soft loan/credit from the World Bank. Under this programme, rural producers were organised into cooperatives to provide them with an assured market, remunerative prices, inputs and services for milk production enhancement. Such as better feed and fodder, breed improvement through artificial insemination, and disease control measures. The programme was unique in its approach, in as much as the gift dairy commodities received under the programme were not consumed by free distribution but were used to manufacture liquid milk and funds thus generated were reinvested in rural areas in milk production enhancement activities. This coordinated and innovative effort
24
has given milk production in the country a great fillip and ushered in an era of the "White Revolution" making India the World's largest milk producer. The programme was implemented in three phases; Operation Flood-I (1970-81), OF-II (1981-85) and OF-III (1987-96). An indicator of the success of OF is the quantum of milk procured and supplied to consumers (Table 2.1). While the average milk procurement increased from 2.56 million kg per day during Phase I by more than nearly ten times the 20 million kg per day during 2004-05. However, there are variations in the proportion of milk procured to the total milk production across the states. The striking pattern that emerges is the predominance of cooperatives in western states namely, Gujarat and Maharashtra. Between 1970 and 2004, the average liquid milk marketed through cooperatives under OF increased from 2.79 million litres per day to 15.63 million litres. In 1989, the Government of India launched a Technology Mission on Dairy Development (TMDD) to coordinate the input programmes for the dairy sector, which ended in March 1999. In order to develop the dairy sector in hilly and backward areas - which were left out during the OP - an Integrated Dairy Development Programme (IDDP) was launched as a Centrally Sponsored Plan Scheme during the Eighth Plan and was continued during Ninth Plan and is also being continued during the Tenth Plan. During this period, India adopted an import substitution strategy to promote a domestic production and the sector was protected from external markets through various restrictions. Such as quantitative restrictions on imports, exports, and canalization, on the one hand, and competition within the organised sector was regulated through licensing provisions, which prohibited new entrants into the milk processing sector. The competition from the organised private sector was controlled by utilising the provision of industrial licensing under the Industrial Development and Regulation Act of 1951 to prohibit new entrants into the milk processing sector. 3.2.3 Post‐reforms period The third phase of the Indian dairy policy started in the early nineties, when the Government of India introduced major trade policy reforms, which favoured increasing privatization and liberalization of the economy. The dairy development in India, which had been the charge of the cooperative sector for the last two and half decades, was de-licensed in 1991 with a view to encourage private sector participation and investment in the sector. However, the government introduced the MMPO (Milk and Milk Products Order) in 1992 under the Essential Commodities Act of 1955 to regulate milk and dairy products production in the country. The order required permission for units handling more than 10,000 litres of milk per day or milk solids of up to 500 tonnes per annum (TPA) from the State/Central registration authorities depending upon the plant. The order included provisions of sanitary and hygienic regulations to ensure the product.
25
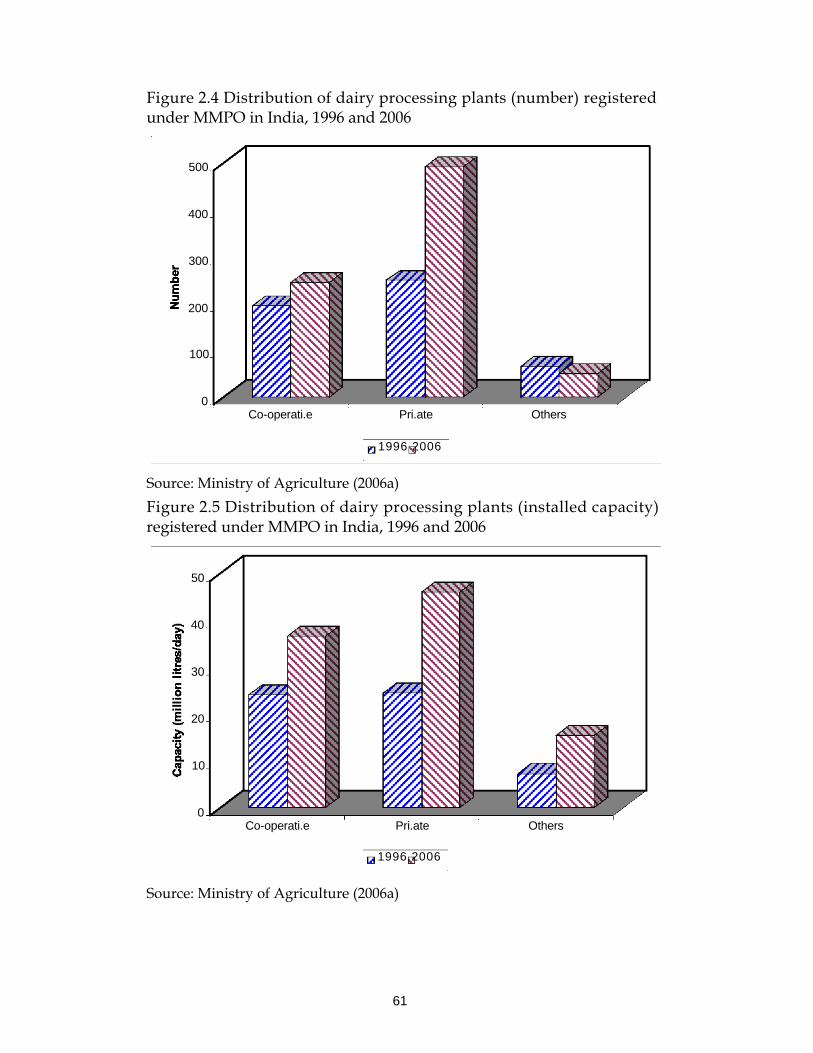
However, concerns about government controls and licensing requirements for new capacities restricting large Indian and multinational players for making significant investments in this sector were raised. The government made major amendments in MMPO in March 2002 and restrictions on private sector investment milk processing and milk product manufacturing plants were removed and the concept of the milk shed was also abolished. The second major development in the Indian dairy sector policy was the removal of restrictions on import and export of dairy products in the mid-nineties. These changes were expected to have major changes in the structure of milk production and upstream segments of the dairy value chain. The structure of the dairy processing has changed considerably during the last decade. The number of private dairy processing plants has increased significantly. The number of milk processing plants in the private sector has increased from 250 in 1996 to 493 in 2006, a 97 per cent increase. While the number of cooperative milk processing plants has increased from 194 to 246, a 27 per cent increase, during the same period. In contrast, the number of plants under other categories (government milk schemes, government owned plants and mother dairies) declined from 65 in 1996 to 50 in 2006 (Figure 2.4). The total installed capacity of the private sector has increased from 24.4 million litres per day in 1996 to 46.1 million litres per day in 2006. While in the cooperative sector, installed capacity has increased from 24.2 million litres to 36.6 million litres per day during the same period (Figure 2.5). However, cooperatives witnessed an increase in the average installed capacity per plant from 125 thousand litres per day in 1996 to 149 thousand litres in 2006 (Figure 2.6). The average installed capacity of government owned plants and mother dairies experienced a significant increase (112 thousand litres per day to 308 litres between 1996 and 2006). On the other hand, in the private sector plants a marginal decline (from 98 thousand litres to 93 thousand litres) on average capacity per plant was witnessed. The possible reason for the increase in installed capacity in cooperatives and government plants could be their long term presence in the sector and strong backward linkages with milk producers to have consistent supplies of raw milk. While in the case of the private sector plants, most of these players are new entrants in the sector and are not willing to make initial large investments are due to the lack of assured supply of raw milk. There is a general fear that private dairies and modern supply chains will push a large proportion of farmers, in particular smallholder producers out of the market as they fail to meet the quality threshold requirements. In addition the transaction costs are also high in coordinating supplies from a large number of small producers compared to a few large farms. Small farms are also financially constrained to make the necessary investments in infrastructure and post harvest activities. The restructuring of the individual dairy industry segments, mainly in production,
26
procurement, and processing, is occurring in simultaneous and interdependent ways. Albeit at different rates and in different ways across the States. The study includes all segments of the Indian dairy industry (mainly procurement, processing and marketing), as they are intimately connected. The identified challenges facing primary producers and their economic organizations in negotiating market access conditioned by liberalization and modernization include technological, organizational and financial demands placed on small-scale farmers. It is also important to analyse changes in procurement patterns for milk as a result of the recent policy changes. Also to know whether large scale producers have cost advantages and higher efficiency that will lead to the displacement of smallholders under a liberalised market. The last issue would be investigated in the micro-level study of Component 1.
27
4 Methodology The procedure adopted in the present study with respect to the selection of commodities giving relative importance in terms of production, market restructuring, selection of study sites, method of survey, and the collection of data have been detailed and presented in the following section. 4.1 Selection of commodity In India, the agriculture sector is undergoing transformation-revealing changes to the contribution of different sub sectors. High-value agriculture, which includes dairy products, fish, meat, eggs, fruit, and vegetables, is growing at a faster rate compared to the food grain sector. This is mainly due to demand-push factors. India is a world leader in milk production contributing about 15 per cent of the total world output. Milk, with the highest share in gross value of the sub-sector has emerged as the largest agricultural commodity produced in the country. A large proportion of the Indian population is vegetarian, so milk and dairy products have been an integral part of their diet. On the other hand, milk being a perishable commodity and with a lack of appropriate infrastructure, marketing is very complex. There have been a lot of changes in dairy sector policies in the country, during the last decade and a half, which has led to the restructuring of the dairy sector in the country. Moreover, milk is being handled both by the formal and informal sectors. In the formal sector, again milk is handled by the cooperative and private sectors. Bearing these facts in mind, our choice of the dairy sector for this present study under the Regoverning Markets project is a natural one. 4.2 Selection of study sites Since the main objective of the study is to examine impacts of market restructuring and commercialization of dairy production on small-scale producers, one needs a sample representing different milk-producing regions that reflect significant differences in the structure of the industry. In order to capture regional differences, the study has been conducted in three states, namely Gujarat, Punjab and Haryana. Which are well-developed, leading milk-producing states and represent different forms of organizational structure. In Gujarat, success in dairy development has been achieved largely through dairy cooperatives, and is considered to be one of the most successful models of dairy development in the world. In contrast, Punjab and Haryana represent co-existence of both the organised (private and cooperatives) and unorganised sectors. The study covers three major sectors, viz. private sector, cooperatives, and informal sector (from both regions) for the purpose of comparison. Given the central importance of market restructuring in the study, efforts were made to select a
28
representative sample covering differences in the extent of dairy development, the likely potential for further development, types of marketing channels, market participation and scale of activity, etc. Two districts from each State, namely, Moga and Ludhiana from the Punjab, Rohtak and Panipat from Haryana, Kheda and Mehsana from Gujarat have been selected for the present study. 4.3 Method of survey (national and local meso levels) National meso-level study is based on data from published sources and interviews and discussions with major stakeholders in the dairy industry including: milk processors, supermarkets, wholesalers, farmers' leaders, community leaders, other players in the dairy chain, key informants like government, and business leaders. This component of the study has been conducted by the lead researchers as it required interactions/discussions with high-level officials including policy planners, industry leaders, industry/trade associations, input and service suppliers, etc. The local meso-level study is based on semi-structured focus group meetings using the Participatory Rural Appraisal (PRA) technique. The PRA was used as a tool to identify constraints in production and marketing of milk in the study area.
29
5 Changes in production and marketing systems In this section we examine trends in milk production and marketing at the national, regional and local level. To do so we begin with macro national meso level data to demonstrate changes in dairy production, processing and marketing systems at the all India level and at state/regional level. In the second section we examine trends in production inputs and services. Based on information from our surveys and discussions with village leaders, farmer focus groups as well as other dairy supply chain actors, we try to identify the major production constraints faced by dairy farmers. We also examine the marketing pattern of farmers in terms of important marketing channels, and reasons for choosing a particular channel, shifts in marketing channels, and marketing constraints faced by milk producers in the study area. It is difficult to give a specific number/percentage as most of this work was done in groups, where we could get some direction of change but not the speed. 5.1 Milk production trends 5.1.1 All India The performance of the Indian dairy sector during the last three decades has been very impressive. Milk production increased from 22 million tonnes in 1970-71 to about 97 million tonnes in 2005-06. Therefore, from being a recipient of massive material support from the World Food Programme and the EEC in the 1960s and early 1970s, India has rapidly positioned itself as the world's largest producer of milk. The trends in milk production in India during the last five decades are shown in Figure 4.1. Production has almost tripled during the last two decades while dairy cow numbers has been declining. Over the 1982-03 period, the number of cattle declined about four per cent, from 192.45 million to 185.18 million. This decline was more pronounced in local cattle. However, the number of crossbred cattle increased from 15.21 million in 1992 to about 22 million in 2003. Growth in milk per cow and the increase in the number of crossbred cows reconciles the increasing total production with the decreasing number of cattle. From 524kg per year in 1980, the average milk production per cow has almost doubled to 976kg in 2002 in the case of cattle but still lower than the world’s average. The number of buffalo increased from 69.78 million to 97.92 million and the milk yield increased from 964kg per year in 1980 to 1455kg in 2002. Despite being the largest milk producer in the world, the per capita availability of milk in the country is one of the lowest in the world, although it is high by developing country standards. The per capita availability of milk, which declined during the 1950s and 1960s (124g per day in 1950-51 to 121g per day in 1973-74), expanded substantially during the 1980s and 1990s and reached about 230g per day in 2005-06. However, it is still below the world’s average of 285g per
30
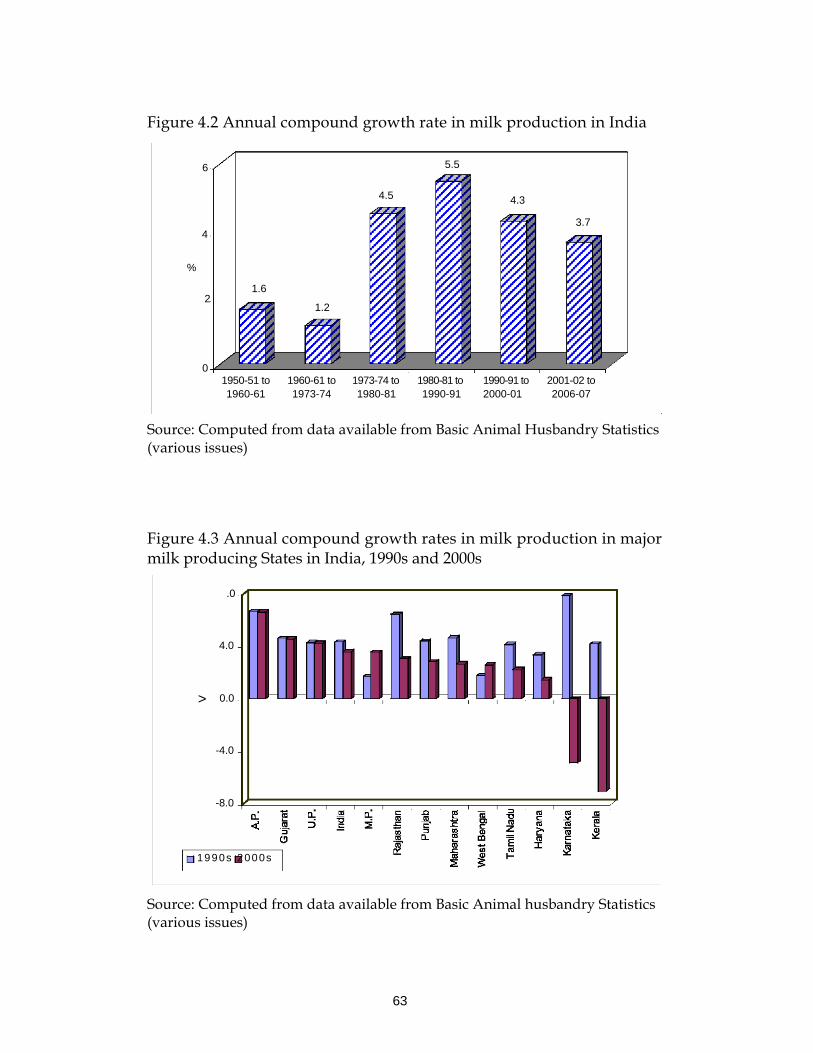
day and the minimum nutritional requirement of 280 gm per day as recommended by the Indian Council of Medical Research (ICMR). The annual compound growth rate in milk production during the first decade after independence was about 1.6 per cent. This growth rate declined to 1.2 per cent during the 1960s (Figure 4.2). The Government of India initiated major policy changes in the dairy sector during the early 1970s to achieve a self-sufficiency in milk production. The milk production grew at annual compound growth rate of about 4.5 per cent between 1973-74 and 1980-81, which increased to about 5 per cent in the 1980s (Figure 4.2). However, growth in milk production showed deceleration in the post-reforms period and grew at an annual compound growth rate of 4.3 per cent during the 1990s. This further declined to 3.7 between 2001-02 and 2006-07, which is a matter of concern. Similar trends were witnessed in all major milk producing states except Madhya Pradesh and West Bengal, which experienced a higher growth in milk production during the 2000s compared with the 1990s (Figure 4.3). Kerala and Karnataka witnessed a negative growth rate in milk production during the 2000s. The expansion of the dairy industry in India has been achieved through extensive intervention by the Indian government, as well as through increased demand driven by increased population, higher incomes and urbanization. 5.1.2 Regional shares Milk is produced in almost all the States but, as would be expected in an area as diverse as India, production is not evenly distributed across the geographical space. In triennium ending (TE) 1986-87, the top five milk producing States were Uttar Pradesh, Punjab, Rajasthan, Gujarat and Tamil Nadu (Figure 4.4). These five States produced just over 51 per cent of India's milk. In TE 2004-05, three of these States, namely, Uttar Pradesh, the Punjab and Rajasthan, were the top three producers. Andhra Pradesh replaced Tamil Nadu and became the fourth largest producer of milk, accounting for 7.8 per cent of the nation's milk. The top 10 States produced 81.5 per cent of the milk in TE 1986-87; in 2004-05, the percentage was almost the same (81 per cent). While percentages reported here might not seem very different, the underlying quantities involved the area. The top 10 States produced about 35.8 million tonnes in TE 1986-87; in 2004-05, total quantity was about 71.5 million tonnes. State wise, shares of milk production in India for the TE 1986- 87 and 2004-05 are shown in Figure 4.3. The major trend in State shares growth for Andhra Pradesh, Maharashtra and Orissa versus relatively flat or very slow-growing shares in traditional milk producing States such as Haryana, Punjab, Gujarat and Karnataka. Bihar, Kerala, Madhya Pradesh, Tamil Nadu, Uttar Pradesh and West Bengal lost their shares in the total milk production. During the last two decades, Orissa experienced the highest growth (5.8per cent) in milk production, followed by Maharashtra (5.6 per
31
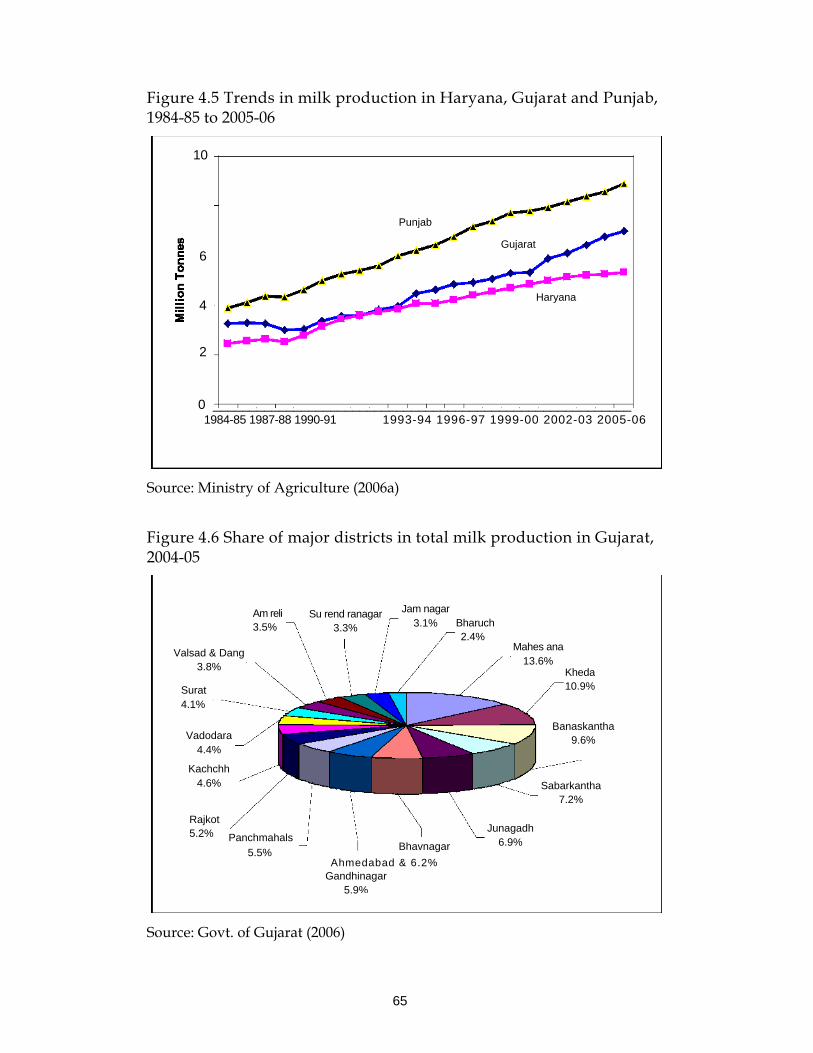
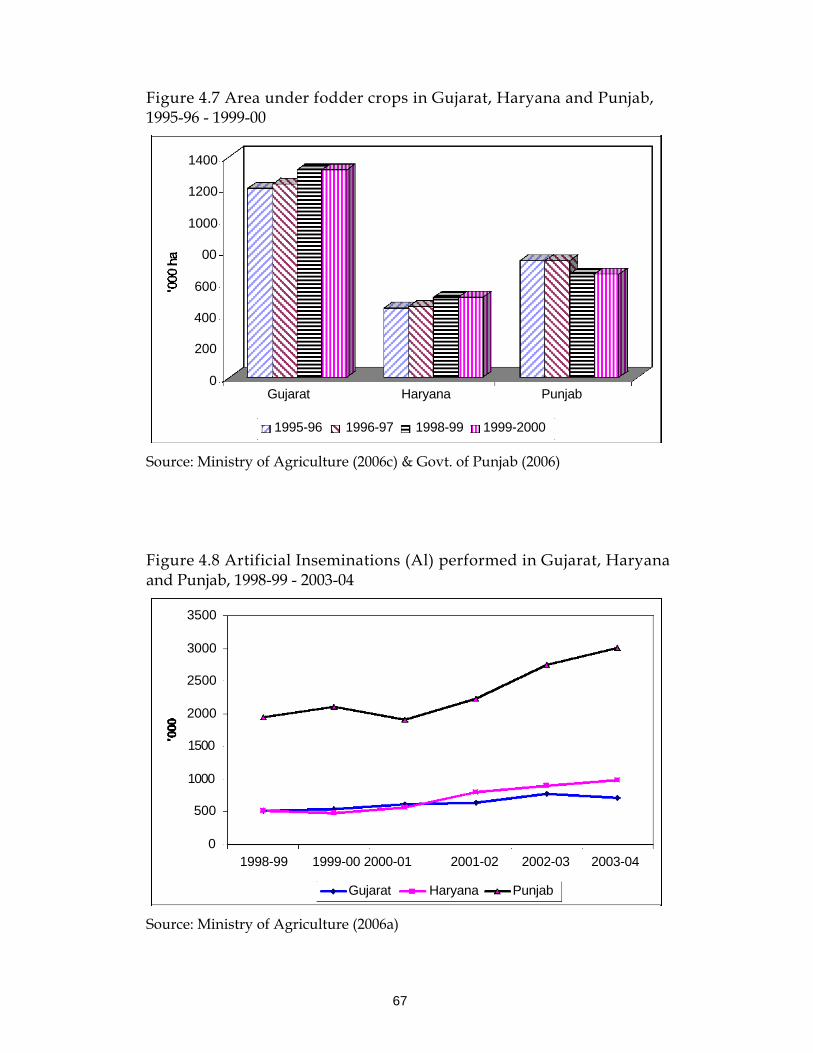
cent), Andhra Pradesh (5.5 per cent) and Karnataka (4.9 per cent) as against the national average of 4.1 per cent (Figure 4.4). Bihar registered the lowest growth (0.54 per cent) in milk production among the major milk producing States. 5.1.3 Milk production trends in the selected states Gujarat is the fifth largest producer of milk in the country and accounts for over seven per cent of India's milk production. The total milk production in the State has more than doubled from 3.24 million tonnes in 1984-85 to 6.96 million tonnes in 2005-06 (Figure 4.5). The per capita availability of milk per day in Gujarat in 2003-04 was 330g. Mehsana and Kheda districts, which have been selected for the present study, are the largest milk producers in the State and account for 13.6 per cent and 10.9 per cent of the State milk production, respectively (Figure 4.6). The Punjab is the second largest producer of milk in the country accounting for about 9.5 per cent of the country's milk production. The total milk production in the State has more than doubled from 3.87 million tonnes in 1984-85 to 8.91 million tonnes in 2005-06 (Figure 4.5). The per capita availability of milk per day in the Punjab is the highest (898g per day) in the country. Though there are no reliable estimates available of milk production in the different districts of the Punjab, however, according to rough estimates, Ludhiana district milk production is estimated to be about 233 thousand tones, while the figure for Moga district is around 113 thousand tonnes. Haryana accounts for about six per cent of India's milk production and is at number eight in milk production. The total milk production in the State has increased from 2.44 million tonnes in 1984-85 to 5.3 million tonnes in 2005-06 (Figure 4.5). The per capita availability of milk per day in the State is the second highest (643g/day) in the country. The estimated milk production in selected districts, Rohtak and Panipat, in 1999-00 has been estimated to be about 175.6 thousand tonnes and 138.56 thousand tonnes, respectively. The total milk production in the state has increased by over 40 per cent between 1991-92 and 1999-00. We would have liked to examine the trends in milk production and at the local-level (village) but reliable data was not available. However, discussions with farmer groups indicated that the growth in milk production in selected villages was higher than district and State averages, as these are leading milk-producing areas. 5.2 Production inputs and services Milk production in the area depends upon various factors such as the composition of livestock population, productivity of animals, availability of feeds and fodder, animal health services, breeding facilities, milk processing and marketing facilities, etc. which are discussed in the following section.
32
5.2.1 Number of livestock The number of livestock, according to the available data for the selected districts (Table 4.1) revealed that Ludhiana district topped in terms of the total number of bovines (755.5 thousand), followed by Mehsana (638.2 thousand) and the lowest in Panipat (331.2 thousand). The adult bovine milch animal population presented in Table 4.2 shows that the buffalo is the dominant dairy animal in Ludhiana district of the Punjab and Kheda & Mehsana districts of Gujarat. The proportion of buffalo in-milk to the total milch animals varied from 56.3 per cent in Kheda district to 65 per cent in Rohtak district of Haryana. The proportion of crossbred cows in milk is higher in the Punjab (Moga, 14.2 per cent, Ludhiana, 12.9 per cent) and the lowest in Rohtak district of Haryana due to extreme weather conditions, which are not suitable for crossbred cows. Moreover, Rohtak is known for the high yielding ‘Murrah’ breed of buffaloes. The proportion of animals in-milk to total milch animals is above 70 per cent in all districts. 5.2.2 Productivity of animals The productivity of animals is a strong indicator in which profitability and the viability of enterprise depends. The productivity of animals in the study area is presented in Table 4.3. It could be observed from the table that the productivity of animals, particularly crossbred cows is much higher in the Punjab (Ludhiana and Moga) than Haryana (Rohtak and Panipat). This could be due to the fact that commercialization of farms is taking place in Ludhiana and Moga areas and farmers are shifting from indigenous cows to crossbred cows as well as scaling-up their farm size. Due to the easy marketing of cow milk in Nestlé milk shed areas, farmers prefer crossbred cows because of the higher yield. The milk yield of buffaloes in Rohtak is slightly high because they are home tract Murrah buffaloes. 5.2.3 Availability of fodder The economics of milk production depends largely upon the availability of cheap and nutritious feeds and fodder since 67 per cent of total cost of production is on feed and fodder. The availability of fodder again depends upon the land available and the irrigation facilities. The area under fodder crops in selected States is shown in Figure 4.7. The trends indicate an increase in area under fodder crops in Gujarat and Haryana, while in the Punjab there was some decline in the area under fodder crops. 5.2.4 Availability of production and processing infrastructure There has been a significant improvement in both the production and processing infrastructure in all three States. The number of veterinary hospitals/dispensaries has increased from 189 in 1960-61 to 478 in 2002-03. Similarly, the number of artificial insemination (AI) centres has increased from 41 to 316 during the same period. In Mehsana district, there are 17 veterinary hospitals
33
and 495 AI centres, while in Kheda, the number is 12 and 888 respectively. In Haryana, the number of civil veterinary hospitals has increased from 125 in 1966-67 to 620 in 2002-03 and the number of regional AI centres has increased from 17 to 60 during the same period. In Panipat district, the number of civil veterinary hospitals was 22 and number of regional AI centres was 3 in 2002-03. In Rohtak district, the number of civil veterinary hospitals was 33 and the number of regional AI centres was 3 in 2002-03. In the Punjab, the number of veterinary hospitals has increased from 231 in 1970-71 to 1362 in 2002-03 and the number of permanent outlying dispensaries and AI centres has increased from 399 to 1478 during the same period. In Ludhiana district, the number of civil hospitals was 112 and the number of permanent outlying dispensaries and AI centres was 135 in 2002-03. In Moga district, number of civil hospitals was 52 and number of permanent outlying dispensaries and AI centres was 79 in 2002-03. In addition to the government infrastructure in Moga district, Nestlé India also provides various inputs and services to dairy farmers. Figure 4.8 shows the number of artificial inseminations done in three States. It is evident from Figure 4.8 that the number of AI done in the Punjab is significantly higher in the Punjab compared with Haryana and Gujarat. The milk-processing infrastructure is also extremely important for the proper development of the dairy sector. Tables 4.4 and 4.5 provide information about the processing infrastructure in Gujarat and Haryana. It is evident from the Tables that there has been a significant increase in the processing infrastructure in terms of dairy processing plants as well as milk chilling centres. 5.2.5 Availability of labour force Labour is another important input for milk production. Unlike agriculture, where operations are seasonal, in dairy farming it is regular work both in the morning and evening. However, a large part of dairy operations in India is carried out by family labour and women. A human labour shortage was cited as an important constraint in expanding milk production activities in the Punjab and Haryana, whereas, it was not an important constraint in Gujarat. 5.2.6 Access to institutional credit The availability of adequate finance is one of the most important pre-requisites for development of any sector and in this regard different financial institutions have been playing a pivotal role. As per the data on refinance disbursement by NABARD, about 71 per cent of investment credit refinance goes to the farm sector supporting agriculture investments and 29 per cent goes to the non-farm sector (Figure 4.9). Nearly 29 per cent of the allocation to the non-farm sector is important because 40 per cent of rural households are non-cultivator households, engaged in non-farm activities. In the farm sector, the major components are farm mechanization
34
(14.5 per cent), Self Help Groups (SHGs) (11 per cent), minor irrigation (7.5 per cent) and dairy development (8.5 per cent). The lack of access to credit is one of the major constraints facing small-scale dairy farmers. However, the data on production credit to the dairy sector is not easily available. Trends in the flow of institutional finance (investment) to the dairy sector indicates that investment credit is inadequate and meagre when compared with other components and contributions of the dairy sector to the national GDP. The refinance disbursement for dairy development by NABARD has increased significantly during the last decade but experienced a declining trend since 2003-04 (Figure 4.10). The other problem with formal institutions is that they often require collateral which many small and marginal farmers as we as landless labourers may not have. 5.3 Production constraints Despite the rapid increase in milk production in selected States, farmers have identified a number of factors that limit their production. Some common constraints limiting production are discussed below: 5.3.1 Un‐remunerative prices Most of the farmers in the study area who supply milk to both the formal and informal sectors reported an un-remunerative price, particularly for cow milk as pricing is more favourable towards high fat milk. It was also reported that during the flush season, farmers were unable to sell their milk due to large volumes and the problem is more serious in those areas where the presence of the organised sector (cooperatives/private) is limited. Farmers supplying milk to the organised sector in the Punjab also reported low prices of cow milk in the flush season i.e. January and February. The farmers dealing with the informal sector pointed out that the un-remunerative prices, along with the various malpractices in weight and quality (mainly fat content) and exploitation by the vendors, as important constraints. 5.3.2 Unavailability of an institutional loan Dairy farmers in all three States namely, Gujarat, Haryana and the Punjab complained about the unavailability of an institutional loan at nominal interest rates for the purchase of milch animals, even though they wanted to expand the business. This problem was more serious in landless dairy farmers as they were not able to give collateral to the banks, as they did not have any land. However, farmers in Nestlé's milk shed area and some villages in Gujarat did not face this constraint. In some cases, even producers dealing with vendors were able to get a loan from the vendor although they had to pay a significantly higher interest rate (ranging from 24-36 per cent per annum). Sometimes they had to sell milk at lower prices, which indicates the interlocking of credit and
35
milk markets. 5.3.3 Uncertain prices and markets Farmers were not expanding their business as they were not sure that additional milk would be sold or not. If sold, there was doubt whether they would get a remunerative price or not. So security and assurance were hindrances in the expansion of their enterprises. 5.3.4 Availability of feeds and fodder Since the size of land holding was small in general, especially in Haryana villages, they were unable to divert more land for fodder production as the existing rice-wheat cropping system provides them an assured market and price under the government procurement price policy. However, farmers in the Punjab did not face this problem, as dairy farmers were able to take land on lease. Moreover, many of farmers are diversifying their cropping pattern towards high-value crops particularly fresh fruits and vegetables due to the entry of large agribusiness companies in the State for contract farming. In a few pockets of the Punjab, some progressive farmers have gone for commercial dairy farming and diverted entire areas under fodder cultivation and sometimes taken land on lease for fodder production. In Gujarat, the lack of irrigation facilities was reported as a major constraint for fodder cultivation, particularly in Mehsana district. The availability of quality feeds, mainly concentrates was another constraint cited by farmers. However this problem was less serious in the cooperative areas as they sell quality cattle feed to its members at a reasonable price. 5.3.5 Unavailability of better breeds Farmers in the Punjab are very vocal and say that they are neither getting high yielding animals nor are they getting quality semen, even though they are prepared to spend more money. Many of the farmers dealing with Nestlé want sires semen, whose dam's had yielded more than 10,000 litres of milk in a lactation. However, the import of semen is regulated/restricted by the government. Nestlé has been trying to import semen but has not been able to get permission from the Government. 5.3.6 Animal health care facilities Some of the farmers reported incidences of animal diseases as a serious problem. Some farmers complained of high veterinary drugs costs and the poor quality of veterinary medicines available in the market. Questions were also raised about the effectiveness of government supported animal health care facilities available in all States. In the case of artificial insemination, poor conception rates, mainly in buffaloes, were another constraint faced by milk producers.
36
5.4 Marketing issues: institutions, infrastructure and constraints 5.4.1 Milk procurement and disposal pattern Processing and marketing are the two important components for the growth of smallholder dairy farming. Like other developing countries of the world, India has a co-existence of 'organised' and 'unorganised’ sectors, which are also referred to as the 'formal' and 'informal’ sectors. The informal/unorganised sector is also termed as the ‘traditional sector’ comprising of the marketing of liquid milk and traditional products such as locally manufactured ghee (butter oil), paneer (cottage cheese) and indigenous products like sweets. Historically, dairying has been an unorganised activity in India [Sharma, et al., 2003a]. The organised or formal sector is relatively new and consists of a western type dairy processing based on pasteurization. The Indian Government has adopted a laissez-faire approach to the informal sector and has allowed it to expand with the growth in demand and serve small farmers and resource poor consumers alike. The present status of dairy processing is the result of demographics, socio-economic, tastes, preferences, traditions, and infrastructure limitations. A primary characteristic of milk processing and distribution in India is a dominance of the informal/unorganised sector. There are no reliable estimates of a marketed surplus of milk in the country. As per the National Dairy Plan 2007-08 to 2021-22, in 2004-05 out of the total milk production, about 84 million tonnes in rural India and about 40 million tonnes (48 per cent of the total production) is retained in the villages itself and the remaining 44 million tones (52 per cent) is sold in the urban areas. Out of the 44 million tonnes of marketed surplus, the share of the organised sector (cooperatives and private sector) is small (30 per cent) and a large proportion (about 70 per cent) of milk continues to be marketed through the informal/unorganised sector (Figure 4.11). But the main problem in the unorganised sector is the quality, which creates a serious threat to the health of consumers. Unhygienic production conditions, substandard processing equipment, improper use of veterinary drugs, and the improper handling, storage and transport of milk etc. contribute to the poor quality of milk in the unorganised sector. To bring about structural changes in the unorganised sector, measures such as processing at the village level, marketing pasteurised milk in a cost effective manner, upgrading the quality and traditional technology to handle the commercial scale using modern equipment and management skills has been introduce by the Government of India in a dairy venture capital fund scheme under which, assistance will be provided to the rural beneficiaries through bankable projects (Ministry of Agriculture, 2007). These projects include activities such as: the establishment of dairy farms, the purchasing of milking machines/milko
37
testers/bulk milk cooling units, dairy processing equipment for manufacturing indigenous milk products, transportation facilities including cold chain, private veterinary clinics and other support services as needed for the growth of the sector. Maintaining a high standard of hygiene is one the most important milk production objectives. The hygiene level directly influences the profitability of milk production, as dairies have started enforcing this by steadily raising their quality requirements for raw milk. More importantly though, consumers are concerned about the safety of milk and dairy products and the conditions under which these are produced. It is therefore critically important to ensure that high quality raw milk is produced from healthy animals under good hygienic conditions and that control measures are applied to protect human health. Bearing in mind consumer driven requirements, it is expected that the share of the organised sector will increase to about 69 per cent by 202 1-22 while the share of unorganised/informal sector will decline to nearly 31 per cent (Figure 4.12). According to industry (guess)/estimates, approximately 44 per cent of the marketed surplus is sold as liquid milk and 56 per cent is converted into products, which are usually sold fresh. The relative amounts of milk from the informal and formal sectors that are converted into various products are shown in Figure 4.13. It is estimated that the amount of milk produced is sufficient to satisfy domestic demand but there is no public data on the production of milk products in India. The large informal sector exists partly because consumers are not willing to pay the additional costs of pasteurization and packaging, which can raise retail prices by 50-100 per cent. Moreover, consumers often consider raw milk and traditional products obtained from reliable vendors as fresh and of better quality than processed dairy products [Sharma et al., 2003]. 5.4.2 Milk procurement trends The formal sector comprising of cooperatives, government and private players procure about 16 per cent of the total milk produced, showing that the bulk of trade in milk is in the hands of the informal sector. In the organised sector, the share of cooperatives is marginally higher compared to the private sector. Trends in the procurement of milk by cooperatives show that milk procurement as a percentage of the total milk produced has increased during the last two decades from 6.64 per cent in 1995-96 to 8.07 per cent in 2004-05 (Figure 4.14). However, there are large variations in the share of cooperatives across different Sates, varying from nearly 2 per cent of the total production in States like Madhya Pradesh, Haryana, Uttar Pradesh to as high as nearly 32 per cent in Gujarat. Other States, which have a higher share in milk procurement, are Karnataka (25.15 per cent), Tamil Nadu (15.15 per cent) and Maharashtra (15 per cent) in 2004-05.
38
The share of the cooperative sector witnessed a declining trend in many States including the Punjab, Haryana, Andhra Pradesh, Maharashtra, Tamil Nadu and Uttar Pradesh after amendments in the Milk and Milk Products Order (MMPO) in 2002, when restrictions on setting up new processing facilities and the milk shed area concept was repealed. A comparison of growth in milk production vis-à-vis procurement by cooperatives in major milk producing states shows that most of the states experienced higher growth in milk procurement, compared to a growth in milk production over the last two decades (Figure 4.15). These trends indicate more coverage/spread of cooperatives in the country. Andhra Pradesh, Maharashtra, and Madhya Pradesh were the only states where growth rate in milk production was higher than milk procurement by cooperatives and the possible reason for this trend is the entry of the private sector in these States. Higher growth in milk procurement by cooperatives was observed in the eastern States such as Orissa, West Bengal and Bihar (over 13 per cent annual compound growth rate). However, similar data for the private sector is not available so it is difficult to make any comparison between cooperatives and the private sector. 5.4.3 Seasonality in milk production and procurement Seasonality in milk production is well known in the Indian dairy sector. The milk production rises in winter months (flush season) and declines in the summer months (lean season). The data on raw milk procurement shows that milk procurement has a strong seasonal cyclical pattern (Figure 4.16). This cyclical trend of milk procurement is more pronounced for buffaloes and therefore for buffalo-dominated regions of the country (Sharma, et. al. 2002). Such fluctuations in the milk supply result in the fluctuation of prices, thus subjecting the milk producers as well as consumers to large variations in milk prices during the year. In the formal sector, the procurement prices are marginally higher during the lean season compared with the flush period but in the informal sector, seasonal price differential is likely to be greater, since small traders have more flexibility in deciding procurement price and tend to transmit market supply and demand changes more quickly compared with the organised sector, which has less flexibility in the deciding price. Generally, formal and informal market prices are correlated seasonally, although with a differential rate. 5.4.4 Fluid milk marketing trends Trends in fluid milk marketed by the cooperative sector in the country are presented in Figure 4.17. The figure clearly shows that there has been a significant increase in liquid milk marketed by the organised cooperative sector. It has increased from less than one million litres in 1971-72 to about 15.7 million litres in 2004-05. However, there are regional variations. For example the quantity of fluid milk marketed in the Western region is the highest followed by the Southern, Northern with the lowest in the Eastern region. In the Northern and
39
Eastern regions, about half of this milk is marketed in the metro cities of Delhi and Kolkata. While in the Southern region, the share of the metro city, Chennai, is about 15 per cent and States like Karnataka and Andhra Pradesh have about a 55 per cent share in the liquid market, which is mainly due to a large demand for quality milk in big cities like Hyderabad and Bangalore. In the Western region, due to a high demand for quality milk in Mumbai, the share of the metro city is nearly 50 per cent and due to a strong presence of cooperatives in Gujarat, its share in the region is about 22 per cent. The above trends clearly indicate that demand for quality pasteurised milk is significantly higher in big cities such as Delhi, Mumbai, Kolkata, Chennai, Ahmedabad, Bangalore, and Hyderabad, etc. and is expected to increase in medium-sized cities in the near future. With the spread of modern retail chains in urban and semi-urban areas, the availability of quality milk and dairy products is expected to improve which in turn would provide better access for milk producers and processors to the markets. However, the required investment in an appropriate rural infrastructure (supply chain) is lacking in most parts of the country and there is a need for Public Private Partnerships (PPP) in this area. Appropriate policies and incentives need to be put in place. 5.4.5 Marketing channels and institutions Milk in India is marketed through different channels and the share of the organised sector has increased marginally during the last two decades. Based on discussions with industry leaders, farmers, and other stakeholders in the dairy value chain and PRAs, we have tried to map important marketing channels in the study area, which are presented in Figures 4.18, 4.19 and 4.20 and also discussed in the following section. Small and marginal farmers and landless labourers maintain one or two milch animals mostly on farm by products or cutting fodder from common property resources. They retain some of the quantity for self-consumption and the surplus is sold in the market. Since the quantity of milk to be sold is small, it is not economical for these farmers to go to cities/urban areas to sell milk. So farmers are left with three choices: (i) sell milk to the cooperatives society if it exists in the village, (ii) sell to a collection centre of a private plant or (iii) sell to the intermediary/milk vendor/directly to consumers in the village. Selling milk to vendor/intermediaries has advantages; since they collect milk from the producer's doorstep, have pricing flexibility and even the facility of credit for purchase of dairy animals and feeds, which is deducted from monthly payments. At the same time the vendor supplies milk on the doorstep of consumers and takes payments at the end of the month or fortnightly. Producers who have become members of the cooperative society sell their milk at a collection centre set up by cooperatives after getting it tested for fat and SNF (solid not fat). As such, they receive a remunerative price for the produce. The
40
farmers normally receive payment after about a week or ten days as is decided by the Society. The cooperatives in turn provide many inputs and services and other incentives, which will be discussed in the next section. At the end of the year, the Society, after meeting all the expenditure out of its profits gives a bonus to all the members in proportion to the milk supplied by members. The third option with producers is to supply milk to private milk plants operating in the area. Although there is no demarcation of a milk shed area of a particular plant after amendments in the MMPO in 2002, all players are free to collect milk from anywhere and compete with each other for raw milk. For example, in the Ludhiana area, there are eleven private plants having a total capacity of 691 thousand litres per day. In addition to this Ludhiana District Cooperative Milk Processing Plant (VERKA) is operating in the Ludhiana area and has a capacity of 400 thousand litres per day. In the neighbouring district of Moga, Nestlé India Ltd is operating and has the capacity to handle 750 thousand litres of milk per day. In addition to this, there are two more plants in the private sector, which have 50 thousand litre capacities. Not only this, but some of the private plants operating in other areas of the Punjab and Haryana have their own infrastructure and are collecting milk from the area. In Haryana too, in Rohtak area, there is a cooperative milk plant, in addition to the various private milk plants being run on the Rohtak Delhi Road due to close proximity of Delhi. In Panipat, there is a chilling centre belonging to one of the cooperative milk processing plants. Nestlé India Ltd has another processing unit in the Samalkha area of the district and collects milk from the neighbouring districts of Karnal and Kaithal. Some of the milk collected by the Moga plant is also diverted to Samalkha. It was observed that the unorganised sector is still an important marketing channel particularly in the Punjab and Haryana but its importance is declining due to consumers' awareness of hygiene and quality issues. The share of the organised sector is much higher in Gujarat compared with Punjab and Haryana. The producers in the Punjab have more marketing channel options due to a presence of private players and the predominant informal sector. For example, a member of the cooperative society will sell part of the milk to the society and the remaining to the vendor or consumer directly. Similarly, they sell a part of the produce to a private plant during the lean season since the price offered by the informal sector/private players is generally higher. Farmers sell a higher quantity of milk to these channels rather than restricting themselves only to cooperatives. Farmers also take advantage of the pricing policy of different organizations. For example, cooperatives pay on the basis of fat and SNF, so farmers sell buffalo milk to the cooperative society to fetch a higher price, while Nestlé India Ltd manufacture dairy products from cow’s milk and hence
41
pay a better price, consequently producers sell cow’s milk to Nestlé collection centres. In the case of Gujarat, the presence of cooperatives is very strong in most parts of the State and members of cooperatives are relatively more loyal to the organizations. The quantity of milk procured through cooperatives is the highest in the country. The number of private dairy plants is also comparatively low in the State. The share of pasteurised packaged milk in the total milk consumption in the State is high, due to the easy availability and marketing efforts of the cooperatives. There has not been a significant impact of the opening up of the dairy industry in the procurement pattern in many areas. But in the Punjab, competition between cooperatives and Nestlé has increased in some districts, which were earlier reserved for either cooperatives or private sector. Nestlé India Ltd, which had set up a milk processing plant in 1961 at Moga, Punjab has increased its activities manifold (Figure 4.21). Starting with 511kg of milk on the 15th November 1961, today Nestlé's Moga factory procures 950,000kg of milk per day in the flush season. In Gujarat, a few private players have entered the milk processing sector and as a result creating some competition to cooperatives. Cooperatives have also initiated some steps to consolidate their position in the market. For example, recently all 13 members (District Milk Unions) of the Gujarat Cooperative Milk Marketing Federation Ltd (GCMMF), one of the largest dairy cooperatives (Figure 4.22) decided to consolidate their position under the umbrella brand name ‘Amul’. Currently, these dairies market their produce, mainly fluid milk and other dairy products under their brand names within their districts but outside they are all marketed as ‘Amul’. This consolidation would significantly reduce the marketing expenses of district unions. A strong formidable brand would build a clear identity that the consumer can connect to. It will also enable the organization to manage the brand better, increase brand efficiency and ultimately benefit the consumer as the price benefit ratio would increase. 5.4.6 Shift in marketing channels It was observed during the field visits and PRAs that the milk producers have shifted from one marketing channel to another marketing option. However, few farmers remained in the same marketing system. The major shift was from the vendor/unorganised channel to the organised private sector plants as well as to the cooperative system. This shift is attributed to the provision of services like artificial insemination, veterinary services, feed supply, prices based on the quality of milk and the assurance of regular payments, bonuses, credit facilities and technical inputs provided by the organised sector. This wide range of inputs, services and the credibility of the organised sector (private as well as cooperative systems) has become a better alternative to the informal vendor
42
system. The organised sector’s marketing options have capitalised on the weaknesses of the informal vendor system and have made inroads into the organised dairy sector. On the other hand, it was interesting to note that a remarkable shift was noticed from the cooperative to the vendor system and private sector. This was mainly during the lean seasons due to the flexibility in pricing by the unorganised sector and even Nestlé. The shift from the organised private sector (Nestlé) to cooperatives was not very common. The opening of the dairy sector for private players in the early 1990s resulted in an increase of competition and business failures of the vendor systems resulting in the exit of a section of vendors. The closure of business and unsatisfactory milk procurement prices forced dairy farmers to shift from vendor to the organised sector. The farmers reported that irregularity in payments; low prices and malpractices by unorganised players were major reasons for shifting to the organised system. However, a major shift in the marketing options by dairy farmers happened immediately after the repeal of the milk shed area concept under the MMPO in 2002, which allowed all players to compete with each other without any restrictions. 5.4.7 Market infrastructure and incentives In all three systems of marketing, the agencies involved provide a market infrastructure and different kinds of incentives to farmers. This is the basic reason that farmers, although have certain complaints against these channels/systems, do not move to any other agency but stay with the same method for a long period of time. Based on discussions during field visits and PRAs, some of the incentives given by these agencies are discussed in the following section. 5.4.8 Vendor/dudhias Milk vendors provide different incentives to dairy farmers ranging from credit for animal purchases to feeds. They even provide loans to the farmers for their personal purposes to meet certain social obligations, which many formal financial institutions do not do. They charge exorbitantly high interest rates varying from 18 to 36 per cent, but farmers find it easier to get a loan from the vendors, as institutional finance is not easily available. Milk vendors also provide intangible services to farmers such as when they go to the city to sell milk; on their way back they bring goods and commodities that the farmers require from time to time. 5.4.9 Cooperatives The cooperatives provide technical inputs and services such as animal health care, artificial insemination, cattle feed, fodder seeds and vaccination against diseases to the member farmers on their door step with a view of increasing milk production and procurement. For example, Ludhiana District Milk Union procures milk through a network of five chilling centres. In addition to this, 23 Societies have been equipped
43
with Bulk Milk Coolers (BMCs), which help with improving the quality of milk. The plant procures milk from over 66,000 farmers, who are members of the dairy cooperative societies. They procure milk from non-members although they are not entitled to any bonus, services, etc. The State Federation and district milk unions have a strong breed improvement programme under the Technology Mission on Dairy Development. In order to consolidate activities, develop a strong cooperative base, increase member participation at the grassroots level (through cooperative education with the necessary managerial and advisory input), a Cooperative Development Programme has been launched in selected milk sheds in the State, with financial assistance from the NDDB. The Punjab Milkfed has two cattle feed plants with a capacity of 300 tonnes of cattle feed and five tonnes of urea molasses per day. In order to save milch animals from heat stress, animal cooling units have been provided to milk producers, which have been able to reduce the reduction in milk production during the summer months. The department has recently signed a MoU with the State Bank of Patiala under which marginal farmers and landless labourers would be given loans of up to IRs 200,000 to purchase milch cattle at concessional interest rates of 8-8.5 per cent per annum, without any security collateral to buy dairy animals. The farmers will also be provided loans for the construction of sheds, purchase of milking machines and chaff cutters. Nearly 200,000 farmers will benefit from the scheme. In the selected district of Haryana, namely Rohtak and Panipat, there are around 180 Societies collecting milk from about 12,000 member farmers. The Haryana Dairy Development Cooperative Federation has introduced an innovative scheme of a "White Card" for the member farmers who supply milk in the lean season. These cardholders can benefit from an institutional loan of up to IRs 100,000 at eight per cent interest without collateral for the purchase of milch animals. Under clean milk production, the government provides a 75 per cent grant for the purchase of bulk milk coolers and a 100 per cent grant for strengthening clean milk production at the producers and societies level. In Gujarat, cooperatives provide a large range of inputs and services to member producers. They provide 24 hour mobile veterinary services for producer members, artificial insemination services, balanced cattle feed and mineral mixture at a ‘no profit no loss’ basis, high yielding seeds of fodder crops at subsidised rates, and vaccination programmes for disease prevention. They have initiated a breed improvement programme and established disease diagnostic laboratories in the State. Under the technology upgrade programme, cooperatives provide automatic milk collection stations at a subsidised rate, bulk milk chilling units at the village level and milk-testers. They also have programmes for cattle insurance and other community development activities. To educate milk producers in scientific animal husbandry practices and to create awareness about quality milk production, cooperatives organise extension, training and educational programmes for member producers and board members.
44
5.4.10 Private sector Although the incentives provided by the private sector vary from agency to agency, some of the incentives provided by Nestlé India Ltd (who operate in the area), include competitive prices to farmers and sometimes higher than other agencies. In addition the provide an artificial insemination service at very nominal rates, good quality fodder seeds, training and exposure visits of farmers to factory, research institutes, etc. Nestlé has distributed 326 high pedigree bulls to farmers and performed about 20,000 Als through 51 Al centres. Each year about 60,000kg of good quality fodder seed is provided to farmers. In order to promote commercial dairy activities, Nestlé also provides milking machines and bulk milk coolers to large farmers (who sell more than 500 litres per day) at subsidised rates. Nestlé has provided 116 subsidized milking machines to farmers and over 21,000 tonnes of high quality balanced cattle feed was distributed to farmers. Not only this, the large farmers get additional money for milk chilling on the farm, the electricity and diesel bills are also borne by the company. This reduces transportation costs as milk is lifted once in a day and milk spoilage is also eliminated. The company provides training to the unemployed youth in the area to provide basic treatment and artificial insemination services. Even gas cylinders for preserving the semen are provided to maintain semen quality and perform Al at proper times. They also provide technical guidance and distribute literature related to clean milk production and care of animals against diseases etc. Nestlé conducts 12 field camps every year to impart knowledge on Good Dairy Practices. The company has established five large herd demonstration farms to create awareness about commercial dairy farming. The company has installed about 600 milk chillers at the village milk collection centres to ensure that milk quality is preserved. Nestlé also organises an annual milk yield competition to encourage farmers to keep the best animals and offer attractive prizes to farmers. Nestlé supports social initiatives in the areas of health, sanitation and schooling for children in the communities around the Nestlé factories. 5.4.11 Marketing constraints Dairy farmers were faced with numerous marketing constraints in those areas where formal sector presence was negligible. The chief among these were low farm gate prices offered by buyers mainly during the flush season, exploitation by middlemen, inadequate market infrastructure, poor access to markets, distant markets and poor road networks leading to milk spoilage during transportation and untimely access to the market place, a lack of market information about prices and the quality of milk required by consumers, poorly organised marketing system and poor supply chain. For example during the PRAs, farmers reported that very often, evening milk is not lifted, particularly from the interior areas and farmers
45
are forced to consume milk at home or sell to vendors at a low price. Milk vendors become choosy and exploit farmers and collect milk at the dictated terms. In areas where the organised sector in general, and cooperatives in particular are operating, farmers face little constraint in the marketing of milk. In the case of small farmers ‘scale’ was found to be an important constraint, as they did not find it profitable to spend a lot of time to sell small quantities of milk. It meant that the transaction costs of selling milk, per unit of sales was too high in the areas where organised sector has a low presence. The constraint analysis clearly reveals that high transaction costs, poor information and a lack of rural infrastructure are important constraints. It is hoped that with entry of large players in the agrifood sector, these constraints would be solved to a greater extent. 5.5 Trade related issues The dairy sector remains one of the most protected agricultural sectors in the world and trade in dairy products is small in relation to production and few countries dominate global trade. One major dairy exporter is the European Union (EU), which is also the world's leading milk producer and consumer, and most of the EU's exports are subsidised. In contrast, New Zealand and Australia, which represent only a small share of the world milk production and do not directly subsidise dairy exports, account for nearly half of the world’s exports. New Zealand and Australia, who depend on world markets, strongly support the opening market access and eliminating export subsidies, while countries such as the EU, Canada, and the US, who use world markets to dispose of surplus dairy products not consumed domestically, strongly resist restraining their ability to subsidise exports. The WTO was expected to implement some disciplines on protectionist policies but there has not been any significant impact on these distortions in the post WTO period (Sharma, 2006a). In many of the developed countries, domestic prices are supported at levels significantly above the world price. Average bound tariffs for dairy products average about 40 per cent in Asian countries, about 60 per cent in Latin America, about 100 per cent in Africa and the Middle East and about 130 per cent in Europe (Sharma, 2006). All individual tariffs are subject to high tariff peaks, with Japan at the top in the case of SMP (248 per cent), followed by Canada (202 per cent), Korea (175 per cent) and the EU (88 per cent). In the case of butter, the bound rate is as high as 523 per cent in Japan, followed by Canada (299 per cent) and the EU (127 per cent). Therefore, while supposedly opening up barriers, tariffs in fact increased protection for the EU, Japan and US markets by significant amounts. The level of support for the dairy sector in particular, is very high in many developed countries. The average domestic support in OECD countries (Amber box, green box, blue box, de minimis, and special and differential treatment)
46
amounted to nearly US$ 234 billion in the 1986-88 base period, which increased to US$ 280 billion during 2004. The domestic support is concentrated in three countries namely: the EU, US and Japan accounting for approximately 90 per cent of the total OECD domestic support. The dairy sector is again an offender and continues to receive considerable support in a number of developed countries. The OECD data shows that the dairy sector share in the total support to agricultural products amounted to nearly 15 per cent in 2004 marginally lower than 20 per cent in 1986-88 (OECD, 2005). The Producer Support Estimates for dairy was 36 per cent in 2004 compared to 30 per cent for all commodities. There are large disparities in the level of support for agricultural commodities. rice and milk are the most protected commodities (OECD, 2005). In the case of milk, Switzerland, Japan, EU, Canada and US have very high levels of protection (Figure 4.23). The export subsidy is an important policy instrument mainly in Europe and North America. Until 1985, most subsidised exports were from the EU and mainly for dairy products, cereals, beef and wine. In 1985, the US also initiated a policy of subsidising exports particularly for dairy, wheat and other cereal and cereal products. Now export subsidization has become a major policy instrument to dispose of surpluses on to the world markets. In the case of dairy products, more than two thirds of the volumes of exports in the OECD countries are subsidised. India is a small player in the world markets. Milk production in India, by and large, meets its demand, and hence exports and imports of dairy products are on a small scale. India's exports of dairy products were less than 0.5 per cent of the domestic milk production and world exports. India's major exports are milk powders to Bangladesh, UAE, Philippines and Sri Lanka, and ghee/butter to UAE, Oman, Nepal, Hong Kong, and Singapore. Although India's export is small, it has increased over the last five years from about IRs 84 crore in 2000-01 to over IRs 550 crore in 2005-06 due to rising world prices of milk powders during the last few years (Figure 4.24). India's imports of dairy products have been less than its exports in the last five years, except in 2003-04 when imports were worth about IRs 129 crore, which exceeded exports (IRs 93 crore). There has been no specific trend in imports, and has largely depended on the world and domestic prices. However, there are apprehensions in the mind of the dairy industry stakeholders that, India, despite being one of the least cost milk producer in the world might end up importing dairy products due to high production and export subsidies in developed countries. However, some people are optimistic about export opportunities in the neighbouring countries: in the Middle East, South and Southeast Asian countries. The import barriers for dairy have become less important over time as the world price of skimmed milk powder has risen relative to the price in the producing countries. Indian exports have also increased significantly during the last
47
couple of years but the government imposed a ban on the export of skimmed milk powder in February 2007 until September 2007, in response to rising milk prices in the country. However, industry leaders feel that India's credibility as the largest milk producer in the world as well as a consistent exporter will suffer, and milk-producing farmers will be severely affected due to the ban on the exports of milk powders.
48
6 Concluding observations and broad policy recommendations
6.1 Main findings The main findings of this report are: • Dairying in India plays an important role in the national economy and also in
the socio-economic development of millions of rural households. The OF programme based on the cooperative movement has been important in the dairy marketing in different parts of the country and undoubtedly has played an important role in keeping smallholders involved with this fast-growing sector. During the past three decades, milk production as well as per capita availability of milk has increased significantly.
• The Indian dairy sector has become progressively more liberalised since
1991, with a major amendment in 2002 in the Milk and Milk Products Order (MMPO) that restricted the ability of private dairies to procure milk in areas being served by the parastatal cooperative sector. The structure of dairy production and processing has changed considerable during the last decade. The number of private dairy processing plants has increased significantly but cooperatives have gone for capacity expansion.
• The restructuring of the Indian dairy industry is taking place at a faster rate in
the processing sector while restructuring at the marketing and production side is slow. Some changes are also taking place in production and procurement segments, which are more pronounced in the Punjab. The share of the organised sector in milk procurement and marketing is increasing but the unorganised sector is still a dominant market player. It is expected that scaling-up in milk production will take place with the entry of organised players in the agrifood sector in order to reduce transaction costs and ensure quality raw materials by large players. However, the fear is that with the increasing power of private companies and large modern retail chains, smallholder producers might face significant market uncertainties if appropriate safeguards are not put into place.
• The share of smallholder dairy farmers in total milk production is very high
(about 80 per cent) but the scaling up in milk production is taking place in some States due to the entry of organised private sector. There have seen some strategic alliances or partnerships in dairy processing and marketing segments, which is bringing some changes into milk production.
• Smallholder milk producers face numerous production constraints and chief
among these are non-remunerative prices, a shortage of quality feed and fodder, declining farm size, low genetic potential of dairy animals resulting in low
49
productivity levels, unavailability of institutional finance, unreliable breeding services, poor animal health care facilities, labour shortages (mainly in the Punjab), poor extension services, poor rural infrastructure such as roads and assured supplies of power,
• Marketing is dominated by the sales of farmers to the unorganised sector,
mainly vendors in the Punjab and Haryana, while in Gujarat milk sales to dairy coops is a major marketing channel. There is no penetration of new retailing institutions at the farm level but it is expected that with entry of companies like Reliance the situation might change. In the organised sector, buyers provide various inputs and services such as breeding, animal healthcare, feed and fodder etc. to farmers. High transaction costs, a poor marketing infrastructure, a lack of information about prices and markets, poor knowledge, and the exploitation by middlemen due to the absence of organised players were major marketing constraints faced by small farmers.
• In some cases farmers shift from one marketing channel to another marketing
channel due to the provision of services such as artificial insemination, veterinary services, feed supply, prices based on quality of milk and assurance of regular payment, bonus, credit facilities and technical inputs provided by the organised sector. There has been a significant increase in market infrastructure in selected States but their performance is not up to the mark.
• Due to the increasing competition within the sector and increasing role of the
modern retail sector in the country, some of the large players have initiated some steps to countervail the market power of modern retailers. For example, recently all 13 members (district milk unions) of the Gujarat Cooperative Milk Marketing Federation Ltd (GCMMF), one of the largest cooperative sector organizations, decided to consolidate their position under the umbrella brand name ‘Amul’. Currently, these dairies market their produce mainly fluid milk and other dairy products under their brand names within their districts but outside they are all marketed as ‘Amul’. This consolidation would significantly reduce marketing expenses of district unions. A strong formidable brand would build a clear identity that the consumer can connect to. It will also enable the organization to manage the brand better, increase brand efficiency and ultimately benefit the consumer, as the price benefit ratio will increase. In the case of Nestlé, steps have been initiated to promote commercial dairy farming in the area to reduce procurement/transaction costs and assured supply of quality raw milk.
6.2 Implications • It is certain that on the demand side, producers would face more
competition with the opening of markets and the increasing importance of food safety and hygiene. There is an unprecedented growth in the modern retail sector, which is bound to increase in the future. In order to countervail the
50
market power of the large modern retailers (national as well as multinationals); it is extremely important to organise smallholder producers and processors to increase their bargaining power. In addition, cooperatives/producers' association would help in overcoming high transaction costs.
• Farmers' problems cannot be solved simply by providing government support
as public institutions are inefficient service providers. In order to sustain growth in the agrifood sector and make smallholder producers competitive, it is important to establish and develop efficient and transparent market institutions and mechanisms.
• Public policies should focus on reducing transaction costs by creating public
investment in the rural infrastructure for dairy development such as cold chain, rural roads, supply of power, and to also encourage private investment in post-harvest management practices, and improve intermediary organizations to reduce transaction costs between producers and market partners. The focus of the government should shift from regulation to facilitation.
51
7 References CSO (2007), National Accounts Statistics 2007, Central Statistical Organization, Ministry of Statistics and Programme Implementation New Delhi: Government of India CSO (2005), National Accounts Statistics 2005, Central Statistical Organization, Ministry of Statistics and Programme Implementation, New Delhi: Government of India CSO (2006a), National Accounts Statistics 2006 and Back Issues, Central Statistical Organization, Ministry of Statistics and Programme Implementation New Delhi: Government of India Economic Times (2006), Economic Times, Ahmedabad Edition, 3 December 2006 Economic Times (2007), ‘ET Survey in Association with SAP’, in Economic Times, Ahmedabad, 5 January 2007 p. 9 Government of Gujarat (2006), Socio-economic Review of Gujarat State 2005-06, Directorate of Economic and Statistics, Gandhinagar: Government of Gujarat Government of Haryana (2006), Statistical Abstract of Haryana, Economic and Statistical Organization, Planning Department, Chandigarh: Government of Haryana Government of Punjab (2006), StatisticalAbstract of Punjab 2005, Economic and Statistical Organization, Chandigarh: Government of Punjab Ministry of Agriculture (MoA), (2005), 17th Livestock Census Report, Vol. I & II Department of Animal Husbandry, Dairying and Fisheries, Ministry of Agriculture, New Delhi: Govt. of India Ministry of Agriculture (MoA) (2006b), Basic Animal Husbandry Statistics 2006 Department of Animal Husbandry, Dairying and Fisheries, Ministry of Agriculture, New Delhi: Govt. of India Ministry of Agriculture (MoA) (2006c), Agricultural Statistics at a Glance 2006, Directorate of Economics and Statistics, Ministry of Agriculture, New Delhi Govt. of India Ministry of Agriculture (MoA, 2007a), "National Dairy Plan 2007-08 to 2021- 22' Department of Animal Husbandry, Dairying and Fisheries, Ministry of Agriculture, Govt. of India, New Delhi. Ministry of Finance (2007), Economic Survey 2006-07 and back issues, Economic
52
Division, Ministry of Finance, New Delhi: Govt. of India NABARD (2007), National Bank for Agriculture and Rural Development Annual Report 2006-07, National Bank for Agriculture and Rural Development, Mumbai National Dairy Development Board (NDDB, 2007a), National Dairy Development Board Annual Report 2006-07, National Dairy Development Board, Anand National Dairy Development Board (NDDB, 2007b), National Dairy Development Board website Summary of Operation Flood Achievements, Anand: National Dairy Development Board http://www.nddb.coop NSSO (2006), Level and Pattern of Consumer expenditure, 2004-05 (NSS Report No 508) and back issues, National Sample Survey Organization, Ministry of Statistics and Programme Implementation, Government of India OECD (2005), Agricultural Policies in OECD Countries: Monitoring and Evaluation, 2005, Paris: Organization for Economic Cooperation and Development, Paris PEDA (2007), Export Statistics for Agro & Food Products 2003-04 to 2005- 06, Agricultural and Processed Food Products Export Development Authority, New Delhi Sharma, Vijay Paul (2006), ‘Collapse of Global Trade Talks: Which Way Are We Headed?’ in Indian Dairyman, Vol. 58, No. 8 (Special Article), August, 2006 Sharma, Vijay Paul, Christopher L. Delgado, Steve Staal and Raj Vir Singh (2003), Policy, Technical, and Environmental Determinants and Implications of the Scaling Up of Milk Production in India Report submitted as a part of Phase-II IIMA-IFPRI study under the IFPRI-FAO project entitled ‘Livestock Industrialization, Trade and Social-Health & Environment Impacts in Developing Countries’, funded by the Department for International Development (DFID), U.K., through the Livestock, Environment and Development (LEAD) initiative at FAO Sharma, Vijay Paul, Raj Vir Singh, Steve Staal and Christopher L. Delgado (2002), Critical Issues for Poor People in the Indian Dairy Sector on the Threshold of a New Era Report submitted as a part of Phase-I IIMA-IFPRI study under the IFPRI-FAO project entitled ‘Livestock Industrialization, Trade and Social-Health-Environment Impacts in Developing Countries’, funded by the Department for International Development (DFID), U.K., through the Livestock, Environment and Development (LEAD) initiative at FAO. Sharma, Vijay Paul (2004), ‘Livestock Economy of India: Current Status, Emerging Issues and Long Term Prospects’, Keynote Address in Indian Journal of Agricultural Economics, Vol. 59, No. 3, July-September 2004, pp.512-54
53
Sharma, Vijay Paul (2006a), ‘Trade Liberalization and Indian Dairy Industry’, International Symposium on "Institutional Structures for Sustaining Livelihoods through Dairying in a Competitive Environment", National Dairy Development Board, Nov. 15, 2006
54
8 Appendix
Acronyms APDC Anand Pattern Cooperative Societies APEDA Agricultural and Processed Food Products Export Development
Authority CSO Central Statistical Organization EEC European Economic Community EU European Union FAO Food and Agriculture Organization GCMMF Gujarat Cooperative Milk Marketing Federation Ltd. GDP Gross Domestic Product GoI Government of India GSDP Gross State Domestic Product ICMR Indian Council of Medical Research Milkfed Punjab State Cooperative Milk Producers' Federation Limited MMPO Milk and Milk Products Order MNCs Multi National Corporations MoA Ministry of Agriculture NABARD National Bank for Agriculture and Rural Development NDDB National Dairy Development Board NGOs Non Governmental Organizations NTBs Non Tariff Barriers OF Operation Flood PRA Participatory Rural Appraisal SHGs Self Help Groups WFP World Food Programme WTO World Trade Organization
Currency Currency Unit: Indian Rupee (IRs) Exchange Rate: US$ 1.00 = IRs 40.75 (as at 30 June' 2007) Unit measurements Lakh 100,000 Million 10 lakh Billion 10 million Crore 10 million
55
9 Tables & figures Table 1.1 Share (%) of agriculture in Gross Domestic Product in Gujarat, Haryana, Punjab and All-India, 1993-94 - 2004-05 (1 993-94 Prices)
Agriculture Manufacturing Services State 1993-94 2004-05 1993-94 2004-05 1993-94 2004-05
Figure 1.1 Trends in exports of agricultural and allied products in India, 1990-91 to 2005-06
Source: Ministry of Finance (2007)
40000
20000
50000
30000
10000
0
Agri-exports %age Agri-exports to Total
25
20
5
0
15
10
56
Figure 1.2 Share (%) of agriculture in national GDP and livestock sector in agricultural GDP (at 1993-94 prices)
Source: CSO (2005)
Table 1.2 Value of output (Rs. crore) and share (%) of major products in total value of output from livestock sector (at 1993-94 prices) Group 1951-52 1961-62 1971-72 1981-82 1991-92 20003-041. Milk group 11,399 12,866 14,864 24,301 40,018 62,829
Figures in parentheses show percentage to total value of output from livestock sector Source: CSO (2006a, various issues)
25
20
30
15 1993- 94
29.27 28 39
22.87
1994- 95
1995- 96
1996-97
1997- 98
Agri. Livestock
1998- 99
1999- 00
2000-01
2001-02
2002- 03
2003- 04
19.81
57
Figure 2.1 Share of various food items in total food expenditure and food group in total monthly per capita consumption expenditure in India by NSS rounds, 1972-73 to 2004-05
Source: NSSO (2006)
Rural
80
60
40
20
0Food
1972 1982 2004
Cereals Vegetables Milk Meat, Egg,Fish
Urban
75
60
45
30
15
0 Food
1972 1982 2004
Cereals Vegetable Milk Meat, Egg,Fish
58
Figure 2.2 Trends in per capita Gross National Product (GNP) in India; 1991-92 to 2003-04 (at 1993-94 constant prices)
1 Figures relate for the period April 1996 to March 2002
61
Figure 2.4 Distribution of dairy processing plants (number) registered under MMPO in India, 1996 and 2006
Source: Ministry of Agriculture (2006a) Figure 2.5 Distribution of dairy processing plants (installed capacity) registered under MMPO in India, 1996 and 2006
Source: Ministry of Agriculture (2006a)
400
200
500
300
100
0 Co-operati.e Pri.ate Others
1996 2006
40
50
30
20
10
0 Co-operati.e Pri.ate Others
1996 2006
62
Figure 2.6 sector-wise average installed capacity ('000 litres per day) of
dairy processing plants registered under MMPO in India, 1996 and 2006
Source: Ministry of Agriculture (2006a)
Figure 4.1 Trends in production and per capita availability of milk in India: 1950-51 to 2004-05 Source: GO! (2006a)
250
200
350
300
150
100
50
0 Co-operati&e Pri&ate Others Total
1996 2006
105
45
90
75
60
30
15
0 1950-
51 1968-
69
Production Per Capita A&ailability
1979- 80
1982-83
1985- 86
1988-89
199 1-92
1994- 95
1997-98
2000-01
2003- 04
280
240
200
160
120
80
40
0 2006-
07
63
Figure 4.2 Annual compound growth rate in milk production in India
Source: Computed from data available from Basic Animal Husbandry Statistics (various issues)
Figure 4.3 Annual compound growth rates in milk production in major milk producing States in India, 1990s and 2000s
Source: Computed from data available from Basic Animal husbandry Statistics (various issues)
%
2
4
6
0 1950-51 to 1960-61
1.6
1960-61 to 1973-74
1.2
1973-74 to 1980-81
4.5
1980-81 to 1990-91
5.5
1990-91 to 2000-01
4.3
2001-02 to 2006-07
3.7
1990s 2000s
>
-4.0
-8.0
4.0
0.0
.0
64
Figure 4.4 Share of major states in total milk production in India: 1986-87
and 2004-05 (TE)
Source: Computed from data available from Basic Animal Husbandry Statistics (various issues)
Maharashtra 5.5%
W.B. 4.2%
Karnataka 4.6%
Tamilnadu 5.3%
Haryana 5.9%
Haryana 5.8%
W.B. 5.5%
Bihar 6.0%
Bihar 3.4%
Others 5.6%
M.P. 6.1%
) .P. 6.3%
Kerala 2.5%
Karnataka4.5%
Maharashtra7.2%
M.P. 6.6%
TE 1986-87
TE 2004-05
Others 9.0%
Kerala 2.9%
Tamil Nadu7.0%
Gujarat 7.3%
u.P. 18.0%
u.P. 18.4%
Gujarat 7.4%
) .P. 7.8%
Rajasthan 9.1%
Rajasthan 9.1%
Punjab 9.5%
Punjab 9.4%
65
Figure 4.5 Trends in milk production in Haryana, Gujarat and Punjab, 1984-85 to 2005-06
Source: Ministry of Agriculture (2006a)
Figure 4.6 Share of major districts in total milk production in Gujarat, 2004-05
Figure 4.23 Producer Subsidy Estimates for milk in selected OECD countries, 2003
Source: OECD (2005)
Figure 4.24 Trends in exports of dairy products from India: 1995-96 to 2005-06
Source: APEDA (2007)
% 40
60
20
0
0 Switzerland Norway Japan Canada EU USA Australia
70
60
50
40
30
20
10
01995- 96
1996- 97
1997- 98
1998- 99
1999- 2000-00 01
Quantity Value
2001-02
2002-03
2003-04
2004-05
2005- 06
400
200
600
500
300
0
100
Regoverning MarketsRegoverning Markets is a multi-partner collaborative research programmeanalysing the growing concentration in the processing and retail sectors of nationaland regional agrifood systems and its impacts on rural livelihoods and communitiesin middle- and low-income countries. The aim of the programme is to providestrategic advice and guidance to the public sector, agrifood chain actors, civil societyorganizations and development agencies on approaches that can anticipate andmanage the impacts of the dynamic changes in local and regional markets. Theprogramme is funded by the UK Department for International Development (DFID),the International Development Research Centre (IDRC), ICCO, Cordaid, theCanadian International Development Agency (CIDA), and the US Agency forInternational Development (USAID).
Agrifood Sector StudiesThese studies look at specific agrifood sectors within a country or region. Researchstudies have been carried out in China, India, Indonesia, Mexico, South Africa,Turkey, Poland and Zambia covering the horticulture, dairy and meat sectors. Part A describes the observed market restructuring along the chains. Part B explores the determinants of small-scale farmer inclusion in emergingmodern markets. Using quantitative survey techniques, they explore the impacts on marketing choices of farmers, and implications for rural development.
The studies were coordinated by:Jikun Huang, Centre for Chinese Agricultural Policy (CCAP), China (contact [email protected])Thomas Reardon, Michigan State University (MSU), USA (contact: [email protected])