+ All Categories
Home > Documents > AIR FORCE REPORT SAMSO TR 77-120 VOLUME I · air force report samso tr 77-120 volume i r-981 a...

AIR FORCE REPORT SAMSO TR 77-120 VOLUME I · air force report samso tr 77-120 volume i r-981 a...

Date post: 08-Jul-2018
Category:
Upload: docong
View: 212 times
Download: 0 times
Share this document with a friend
78
AIR FORCE REPORT SAMSO TR 77-120 VOLUME I R-981 A FUNCTIONAL DESCRIPTION OF THE NAVSTAR GPS RECEIVER MODEL X FINAL REPORT FOR SAMSO CONTRACT F04701-75-C-0212 VOLUME I by William M. Stonestreet 26 April 1976 Ravised February 1977 O D D C np^izrinriizi Uy NOV 22 1977 SED U IS D The Charles Stark Draper Laboratory, Inc. Cambridge. Massachusetts 02139 (: DISTRIBUTION STATEHENT-A Approved for public release, distribution unlimited m -»^•-^ - - -
Transcript

AIR FORCE REPORT SAMSO TR 77-120 VOLUME I

R-981

A FUNCTIONAL DESCRIPTION OF THE NAVSTAR GPS RECEIVER MODEL X

FINAL REPORT FOR SAMSO CONTRACT F04701-75-C-0212

VOLUME I by

William M. Stonestreet

26 April 1976 Ravised February 1977

O

D D C np^izrinriizi Uy NOV 22 1977

SED U IS D

The Charles Stark Draper Laboratory, Inc. Cambridge. Massachusetts 02139

(:

DISTRIBUTION STATEHENT-A

Approved for public release, distribution

unlimited

m

-»^••••-^ - •- • • — -•

-T , -,., ii «••in •. i»lKUI,l UK III JIIIHW

The final report was submitted by The Charles Stark Draper Laboratory, Inc. Cambridge, Massachusetts 02139, under Contract No. F04701-75-C-0212 with Space and Missile Systems Organization, Air Force Systems Command, Los Angeles Air Force Station, Los Angeles, California.

This technical report has been reviewed and is approved for publication.

— 4,^i,,„

.. ., .,_..| .1 I II

LORI. TR-7 -120-' rrj

Q rf/Jt^9BlZv&l - i

LA FUNCTIONAL DESCRIPTION OF THE NAVSTAR SPJ RECEIVER jg)DEL £. S/ o /u y> C- I"

FINAL REPgT.(FOR SAMSO CONTRACT/ F^47^1-75-C-j<212j 7

VOLUME I

A by

«tcasm tg

nil Wime StctiM \^'

toe i«« aciiN *o MMHHOIMCER Q

JUSTIflCATIDI

IT •ISTMMTMII/«MILMILITY ma

litt «MIL intf/of VECIJUL

A

William H./Stonestreet fj£ö Y William M./l

Revised 977

gfci^l c5^/?| Approved

I08«f »roject Officer Space and Missile Systems Organization

••Ifsd/uatii (^M^UY^ William G. Denhard Head Air Force Programs Department

/

The Charles Stark Draper Lab«HH«B|b, Inc. Cambridge, Massachusetts 02139

tr

</oi Sf*

D D C »fröESDDjQEI NOV 22 1977

insEiruTEl D

t

.... •• • I*-«'

^yrl".|,i^iTg- mm

ACKNOWLEDGEMENT

This report has been prepared under contract number F04701-75-C-

0212 with the NAVSTAR OPS .loint Proqram office (JPO) at the Space and Missile Systems organization of tho U.S. Air Force. The technical in-

formation presented herein has been gathered through interviews dur-

ing 1976 with members of the JPO and Aerospace and from the listed re-

ferences. The interviews were arranged and moderated by Mr. Joseph Luse,

the Project Officer on this contract at the JPO.

The material presented is considered to be an accurate represen-

tation and/or resolution of sometimes conflicting information gathered

from the cited sources. It is recognized that the design of the X-

Receiver is still in the process of evolution at Magnavox APD and that

certain parts of the description may have to be modified to reflect

the latest design decisions and/or to correct any misunderstandings

that may exist.

The author wishes to thank Dr. Duncan B. Cox, Jr., and Dr. Bernard

A. Kriegsman who participated in the interviews at the JPO, for their

assistance in formulating the technical concepts and in reviewing the text.

-•-.--. ••••?-.-•£-•• T- ri~T-~ ..-.,.:ZZ-* Sl^.-^^M^^XLl^^^^

'S i •

mtyjMiiaa SECURITY CLASSIFICATION OF THIS l>*nr cmutn »am foi.r.,/1

REPORT DOCUMENTATION PAGE i. nepoHT sonn SAMSO TR 77-120 7 2. GOVT ACCESSION NO

«• TITLE (md Submit)

A Functional Description of the NAVSTAR GPS Receiver Model X

7- AUTHORO)

William M. Stonestreet

9. PERFORMING ORGANIZATION NAME AND ADDRESS

The Charles Stark Draper Laboratory, Inc. 555 Technology Square Cambridge, Massachusetts 02119

M. CONTROLLING OFFICE NAME AND ADDRESS lj'

US Air Force Space and Missile Systems Oranizatlon SAMS0/YE0, P.O. Box 92960, Worldway Postal Center Los Angeles CA 90009

14. MONITORING AGENCY NAME i AOORESSTH dIHonnt from Controlling OHIct)

READ INSTRUCTIONS BEFORE COMPLETING FORM

1. RECIPIENT'S CATALOG NUMBER

S. TYPE OF REPORT • PERIOO COVERED

Volume I of Final Report Nov 75 - Jim 77

S. PERFOPjfl F981 N/

ING ORG. REPORT NUMBER

S CONTRACT OR GRANT NJMBERfa.)

F0A7O1-75-C-O212 tr

10. PROGRAM ELEMENT. PROJECT, TASK AREA » WORK UNIT NUMBERS

6342 IF, 632075

12. REPORT DATE

February 1977 IS. NUMBER OF PAGES

74 IS. SECURITY CLASS. (ol thl» report;

UNCLASSIFIED

ISa. DECLASSIFICATION/OOWNGRAOING SCHEDULE

IS. DISTRIBUTION STATEMENT (ol this Roporl)

Distribution Statement "A" Approved for public release, distribution unlimited.

y

17. DISTRIBUTION STATEMENT (ol the abefrael entered In Block 20, II different from Report;

IB. SUPPLEMENTARY NOTES

19. KEY WORDS (Contlnuo on rovmrme mldo II nocoaamry mnd Identity by block number)

NAVSTAR, CPS, Satellite Navigation

20. ABSTRACT fConllnua an n<tw mldm It nacaaaafy mnd Identity by block number;

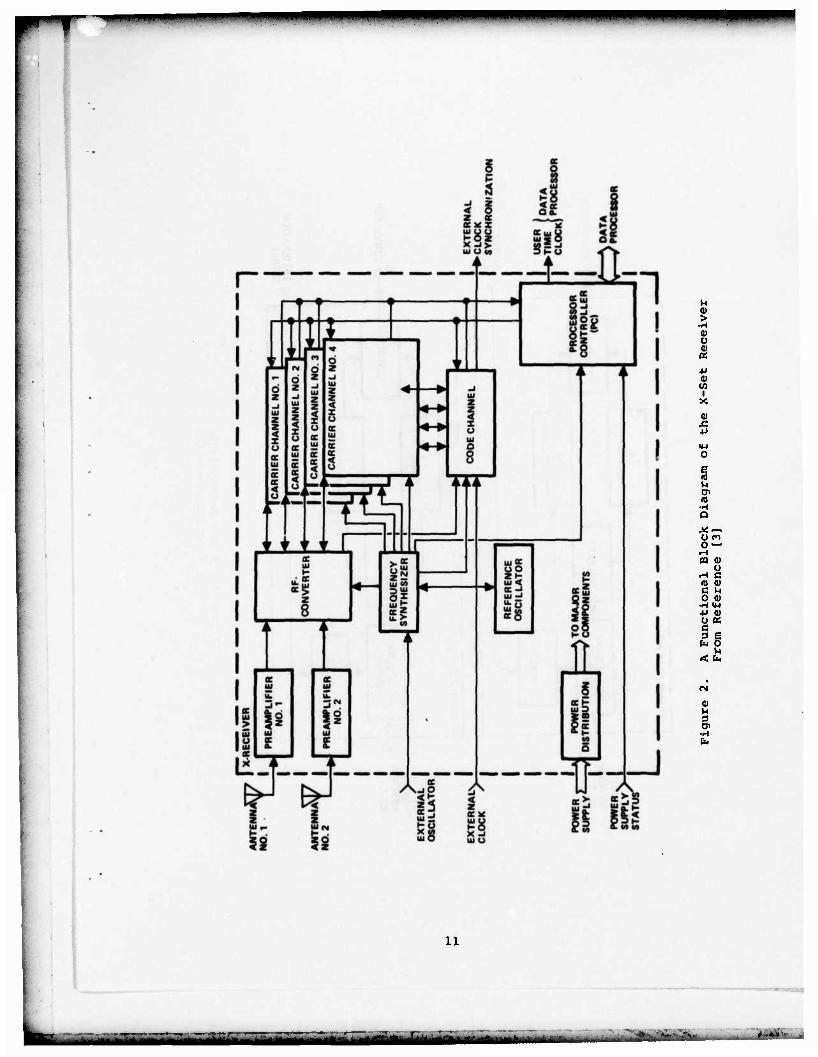
Draper Laboratory is under contract to the^Global^Positioning^System (<3PS) Joint^ProgramOffice (JP0) to develop the interface requirements between the GPS X-set beug developed by Magnavox Advanced Product Division under subcon- tract to General Dynamics and the AdvancedjnertialjteferencejSystem (AIRS). Since the X-set is still under development/a suitable description of it must be created in order to develop this Interface. With the exception of the data processor and the X-receiver calibration and automatic-fault indicator opera- tions, this report functionally describes the operations performed by the X-set.

DD | J AN*71 1473 EDITION OF 1 NOV «» IS OBSOLETE UNCLASSIFIED SECURITY CLASSIFICATION OF THIS PAGE (When Data Enlararf)

rv »I,.... ........... |, I.IUII-.I. II HI »l II . I. .IH.MJI« I». I ——^—^-^—

UNCLASSIFIED »»cumTv CLASSIFICATION or THIS gAWgfcjg on* tetjgg

20. Abstract (Con*t)

The descriptions contained herein are based upon the documentation and specifications currently available and technical discussions with the GPS JPO.

UNCLASSIFIED

SECURITY CLASSIFICATION OF THIS P*GEflTJ..n Dmlm Enfnd)

LM -

,WWWM«.IPj»..Wi.-)|-i "-'MI JUII .«IM I« •*•"» t' '• " " "'»>"-•"•

TABLE OF CONTENTS

SECTION PAGE

1. Introduction 7

2. X-Set User Equipment 8

3. X-Set Receiver 10

4. Costas Loop Implementation 32

5. Automatic-Frequency-Control/Costas Loop Implementation 38

6. Noncoherent Delay-Locked Loop Implementation 44

7. Hold-On-By-Your-Teeth (HOBYT) Operation 47

8. Initial Acquisition Procedure 48

9. C/A Code Search 51

10. Pull-in Mode 54

11. Data-Bit Synchronization 56

12. Data-Frame Synchronization 58

13. Handover Function 61

14. Data Demodulation 63

15. Reacquisition Procedure 65

16. Delta-Range and Pse\.'.': äange Measurements 68

17. Ll and L2 Measurementv .70

18. Automatic Cain Cor 71

19. References 74

ÜB «-••-•'-

mii)in„i.,..iyi,j|i; umiimmiJ.««!' " "irmmmmi^^mBiif*

LIST OF FIGURES

FIGURE

1. X-Set User Equipment

A Functional Block Diagram of the X-Set Receiver

X-Set Preamplifier

X-Set RF Converter

X-Set Carrier Channel

X-Set Carrier Rate Multiplier/Incremental Phase Modulator

X-Set Code Rate Multiplier/Incremental Phase Modulator

8. X-Set Code Generator

9. Time Sharing Sequence of X-Set Code Channel While in the Tracking Mode

10. X-Set Code Channel

11. X-Set Code Channel Programmable Digital Delay

12. X-Set Frequency Synthesizer/Reference Oscillator

13. X-Set 5.000/5.115 MHz Phase-Locked Loop

14. X-Set Costas Loop Implementation

15. Costas Loop Filter

16. X-Set Automatic Frequency Control/Costas Loop Implementation (HOBYT)

17. Automatic Frequency Control/Costas Loop Filter (HOBYT)

18. X-Set Automatic Frequency Control/Costas Loop Implementation (Acquisition)

19. Automatic Frequency Control/Costas Loop Filter (Acquisition)

20. X-Set Code Tracking Loop

21. X-Set Normal Acquisition Procedure for a Single Channel

22. X-Set Code Search Operation

23. Noncoherent Frequency-Locked Loop Used in X-Set Receiver for Frequency Pull-in

24. X-Set Data-Bit Synchronization Procedure

PAGE

9

11

12

14

17

18

20

21

23

24

26

27

28

33

35

39

40

42

43

45

49

52

55

57

— — r.. .--

LIST OF FIGURES (CON'T)

FIGURE PAGE

25. X-Set Data-Frame Synchronization 59 & 60

26. X-Set Handover From C/A to P Signal Procedure 62

27. X-Set Satellite Data Demodulation Process 64

28. X-Set Reacquisition Procedure 66

29. Acceleration Uncertainty Determination for X-Set Reacquisition Procedure 67

30. X-Set Pseudo-Range Measurement 69

31. X-Set Automatic-Gain Control Loop 72

afiszaBEssc —*— SMSfeL

T i,iM..M«.ij»i». "• •- •"••» " ii. iiHimmm^mmmmmmmmmmmmmmm mm

LIST OF TABLES

TABLE

1. X-Set Preamplifier Performance Specifications

2. X-Set RF Converter Performance Specifications

PAGE

13

16

3. X-Set Reference Oscillator Performance Specifications 29

4. X-Set Frequency Synthesizer Performance Specifications 30

5. Costas Loop Noise Bandwidths and Natural Frequencies for Different Types of Users 36

•-.-.-•^•^••I — ,-T^ ^T -~ -L^ '•-«.- • -

"•""•" mmm> IPB ——•

A Functional Description of the

NAVSTAR GPS Receiver Model >

Section 1. Introduction

Draper Laboratory is under contract to the Global Positioning

System (GPS) Joint Program Office (JPO) to develop the interface re-

quirements between the GPS X-set being developed by Magnavox Advanced

Product Division under subcontract to General Dynamics and the Advanced

Inertial Reference System (AIRS). Since the X-set is still under de-

velopment, a suitable description of it must be created in order to de-

velop this interface. With the exception of the data processor and the

X-receiver calibration and automatic fault indicator operations, this

report functionally describes the operations performed by the X-set.

The descriptions contained herein are based upon the documentation and

specifications [1,2,3,4]* currently available and technical discussions

with the GPS JPO [5,6,7,8].

Numerals in brackets refer to similarly List of References, Section 19.

numbered references in the

---'-•-—

.... _ :. . ...«,.«., i

" "•"" -)"••••• ••'—:•• i "•.um mmmmmmmm ML IIIIII •••HIIWIIW« •^—"

Section 2. X-Set User Equipment

A functional block diagram of the X-set is shown in Figure 1. The

set consists of two antennas, the X-receiver, a data processor, control

and display unit, and a source of power. Each of the two antennas re-

ceives both the Ll and L2 frequencies. The X-receiver acquires the sig-

nals, tracks the carriers and codes of either the Precision (P) or Coarse/

Acquisition (C/A) signals at either the Ll or L2 frequencies, demodulates

incoming data, and measures the pseudo-range and delta range. The data

processor selects the satellites to be tracked and performs the iviga-

tion processing.

The X-set has the capability of using an internal reference oscil-

lator or an external oscillator as a frequency source and/or an exter-

nal clock for accurate time-of-week information. The X-set is also able

to use data from an Inertial Measurement Unit (IMU) to provide better

velocity and position estimates. The IMU data is used in the navigation

filter and to provide a carrier estimate when the carrier is lost.

rVli.n« .f.- .,,. ""'fcuffai'-vi fMUMM—

r1 • • .1 I I -~M«

§1 i -JZ <o I ZK I ecx UU I

!<£ I—

So _JCO

SCO

r

CO

X

77

UJ

5"-

s\

iz ~i

BE O

QO

iz

Ha, Z Q ZH3U S5 -

> UJ o

X BE

1D>—i |D>—' I

i ill i

OS & CO

_ J A

il

•p c I" a^

•H 3 0) tr o w c

<u Q) 0) CO M-l D <U s JJ

s § w o I In

X b

n 3 D>

fa

iJHIMffiiiytfiaMiAMiiiiyMa

HIH.IH'1.« •' •"*-• .-—»—•—~T »«•^^^•••i mm

Section 3. X-Set Receiver

The main objective of the X-set Receiver is to accept as inputs

the signals from the two antennas, process them, and provide usable

pseudo-range and delta-range estimates and demodulated satellite data

as requested by the data processor. Figure 2 is a functional block

diagram of the X-set receiver. There are two preamplifiers, an RF con-

verter, reference oscillator, frequency synthesizer, four carrier chan-

nels, one code channel and a process controller. The functional opera-

tion of each of these major components and the two antennas will be dis-

cussed in this section. A detailed description of the operation and

interaction of the four carrier channels and the code channel with the

process controller will be presented in later sections.

Two antennas are used to form a quasi-omnidirectional antenna.

Both antennas receive LI (1575.42 MHz) and L2 (1227.6 MHz). Normally

one antenna is selected on the basis of its beam pattern to track satel-

lites with low elevation angles while the other tracks satellites with

higher elevation angles. (Due to its lower gain at low elevation angles

the latter antenna provides higher anti-jamming capability against ground

jammers).

There is a preamplifier located at each antenna. As an input the

preamplifier accepts either the antenna signal or a calibration signal

provided by the receiver. A block diagram of the preamplifiers is shown

in Figure 3. The direct.' mal coupler connects either the antenna or

calibration signals to the dipitxer. The diplexer isolates the Ll and

L2 signals from each other and from other interfering signals such as

phase-arrayed radar signals. The Ll and L2 signals are then amplified

and summed together for transfer to the RF converter at the receiver.

Isolation and amplification of the Ll and L2 signals in this manner pre-

vents these signals from jamming each other. Table 1 presents the pre-

amplifier performance characteristics.

The RF converter is shown in Figure 4. The inputs to the RF con-

verter are either calibration signals or the outputs of the preampli-

fiers and are chosen by the calibration mixers. As in the preamplifier,

the diplexers isolate the Ll and L2 frequencies. The isolated Ll and

L2 signals are then heterodyned in the Ll and L2 down converters to the

same JCntermediate Frequency (IF) of 184.14 MHz, which equals 36F where

F is the frequency of the reference oscillator, 5.115 MHz, and then am-

plified in the IF amplifiers. The IF amplifiers utilize a total-power

10

I

wämmJMMHIIII i' liiiiirMiittiÜBliiü m**i

»»••' •""' •" "

u > 0) u at oc *i 0) w I x <u 4J

M Oi 10

•H a *—. O fn

r-K a o>

a •H C

c u o ai

•H <H 4j a) u as c 3 E

CM O H

< b

0) M 3 tJ>

-rt b

11

- ^.r_----_. •_ . .^J^..^-

•• • 11II •

o *t <S

r -±— o

o in

v

o o

I- oc

5 ao< ii OCA

ir

< UJ K

IU X

I

I

_>

5s ec Ul

o = <- X UJ O z oc" a

-dt— 1

1 o(- • oc zo u. <Z

I

7 czo U-<Z

—1 < z"c ou — _i ui l-a. •#- X <J3 s Ul0 o=o a

_!xL_—I li_^___ J

CD r-t •H •— M-l •H V .-I o o. c e tu ro M <U <U S-l <M

a, a> m 4J 0) g

CO O I V-J

X h

ai

3 •H

12

MMiirifeUiBi "• "MfcHfifrü

' • xi.iui .ii in " "<wp~vv^MHiipannHHiiMHHPiMPMl

Table 1. X-set Preamplifier Performance Specifications from References 1 and 3.

I

Description Characteristics

No. of antenna signal inputs 1

No. of calibration signal inputs 1

No. of RF signal outputs 1

Signal waveform Lj/L2 FDM

Nominal input/output center frequencies (F ):

Ll 1575.42 MHz

L2 1227.60 MHz

L1 and L bandwidth selectivity:

At -1.0 dB ±9 MHz

At -3.0 dB ±12 min. ±17 max. MHz

At -70.0 dB ±70 MHz

Nominal input/output impedances 50 ohm

Max. input/output vswr (F ±8 MHz) 1.5:1

Max. noise figure 3.5 dB

Reference preamplifier input:

Remote located 100 ft. max.

Cable loss 4 dB max.

Input signal levels (including J/S):

Max. -50 dBW

Min. -180 dBW

Dynamic range (noise level to 1-dB 130 dB compression)

Burnout protection 0 dBW min.

Gain at FQ 30-34 dB

Phase linearity (±8.0 MHz) ±5 deg

Reverse isolation (min.) 30 dB

Decoupling for calibration signal injection 20 to 30 dB

Calibration signal input level:

Max. -120 dBW

Min. -140 dBW

Group delay variation (over ±8.0 MHz range) 10 nsec

Isolation (L. to L-) 50 dB min.

Calibration signal input 274F + 34 F-PN

Input signal level -34 dBW ± TBD

Output signal level -37 dBW ± TBD

Input/output impedance 50 ohm

Note: F = 5.115 MHz

13

''-*••- -^*-'i- *»*&•<•

r • - • * -KW»" ' ' " " -III!« mm* -«—»—•

S ui K Z

"I UI u| Qz o z O X t- o

r s>* it» stS st» s>Js

a: g 3 o z

"I in X

x

CO

3* u. O

I <

39V HUM ISU3IJI1JWV

E J_L H-HI iüÄl

CTr^ 09V HUM

SUildlldWV • Jl

o 0

TT °z

o o

Jfe

rr

X ui _> a.

I

2 Q Z

•3

2 K UI

Zfc 4! i I 3

ui X

_l a.

O Pec

$1

LZT?

X 5

O z

1

<U r-l

H J> Q)

g| O OJ

• «4-1

s «Si

ä

W

Z o P« 2x Si

=^f -1-J--J

u. a + u. I

5

ccz ui O

Ujgj

z*i

I 11" Oui •

o. -S 2 < (M O UI X ££i

14

lift iäjiBiii(^MMfcik<tMllliai^MiMM*iirih*>ir' m

W4 »

noncoherent Automatic Gain Control (AGC) circuit followed by clippers

which clip at an output level approximately 3 dB above the noise level.

The outputs of the four IF amplifiers go to a 4X5 switch which can

switch any one of the four inputs (two antennas, two frequencies each)

to any one of the five outputs (four carrier channels, one code channel).

The RF-converter performance characteristics are presented in Table 2.

The carrier channel as defined in reference [3] and shown in Fi-

gure 5 consists of a local reference generator/correlator, signal con-

ditioner, carrier rate multiplier/incremental phase modulator, code rate

multiplier/incremental phase modulator, code generator, and address

selector/data director. The functional operation of each of these units

is described in the following paragraphs.

The local reference generator/correlator heterodynes the carrier

estimate (nominally 0.25F = 1278.75 kHz) from the carrier rate multiplier/

incremental phase modulator to a nominal frequency of 29.25F * 149.61375 MHz.

The estimated code (in this case the on-time code estimate) is super-

imposed upon this signal to form the local reference for this channel.

The local reference generator/correlator also amplifies the signal from

the RF converter in a coherent AGC (controlled by the process controller)

and correlates it with the local reference for this channel. This cor-

relation generates a second IF of nominally 6.75F = 34.52625 MHz which

goes to the signal conditioner.

The signal conditioner heterodynes the output of the local refer-

ence generator/correlator to the detection frequency, nominally 0.25F

• 1278.75 kHz. It then correlates this signal with quadrature signals

of fixed frequency 0.25F and integrates the outputs for a period of time

(T). At the end of this time interval the outputs of the integrators are

sampled and reset. The samples are converted to eight-bit binary words.

Depending upon the operation the receiver is performing, T is either one

or four milliseconds. In general, if the receiver is in an acquisition

mode, T is one millisecond, otherwise T is four milliseconds. A more

detailed discussion of the local reference generator/correlator and sig-

nal conditioner is given in a subsequent section on the implementation

of the Costas loop in the X-set.

The carrier Rate Multiplier/Incremental Phase Modulator (RM/IPM)

is essentially a digital Voltage-Controlled Oscillator (VCO). Figure 6

is a block diagram of the carrier RM/IPM. Every 4 ms the process con-

15

-^

l"B"" ' ' ' ,.., n.u.,,.,.,.,,.,1-,1. „I lll.TP-l ll ...I. .1 J I II »I III

Table 2. X-set RF Converter Performance Specifications from References 1 and 3.

Description Characteristics

No. of RF inputs 2

No. of LO inputs 2

No. of IF outputs 5

Nominal RF input center frequencies (F ):

Ll 1575.42 MHz

L2 1227.60 MHz

Nominal IF output center frequency 184.14 MHz

L,/L_-bandwidth selectivity:

At -1 dB ±9 MHz

At -3 dB +11 min., ±17 max. MHz

At -70 dB ±150 MHz

Nominal input/output impedances 50 ohm

Max. input/output VSWR 1.5:1

Max. noise figure 23 dB

Input signal levels:

Max. -50 dBW

Min. -150 dBW

Dynamic range (gain compression to 1 dB) 100 dB

Pulse-clipping level (output referenced): -40 dBW

Overload recovery 100 nsec max.

Gain at F o 55 dB

Output power level at 1 dB gain compression -45 dBW

Phase linearity (±8.0 MHz) 10 deg

Output IF switching time: 2 usec max.

Isolation:

Between down-conversion channels 30 dB

Between LO inputs 20 dB

Between IF outputs 30 dB

Between LO inputs and IF outputs 30 dB

Calibration signal: 274F + 34F • PN

Output signal level -120 dBW t 5

Input signal level -50 dBW ± 5

Input/output impedance 50 ohm

Calibration command:

Signal levels TTL

Note: F = 5.115 MHz

16

Ä rrr <•?£.;. ',TT~* -*-•-•-•-•- „_ ...::afcm;.^.'.>vv 4«*ÄA^.

^f^^mmmmmtz

X K " " u

A 1 A A A

if ES

^-v-^

!._Ji A A

f1 in ii

"8

2 c -

£ 0)

MO si HH hll IBM-i ua>

PS

(0 o I n

m

0)

17

HMA •MyttMaii^itai'ii ir i • i

- »JIIUII.1H|I«...I»I.U» '• »"'I «-—

N z in

in ii

u.

s3i Ouiz DC 0C> u- u. to

s Id

0)

s M Ü

S-a

•3

•H S

+> „ rH

+J 10 « n

ID H O (U c

•H (I) u u M 0) Rj «-I U 0)

K •p

W O I U X fa

lO

4)

I

O1115O U.3I-Ü

18

MMHM WM« >T'ir-*L''-'^-

r —->l .LII......II..II • •I.IIIM.IH.P'.UI. 11,1 um .ii.i , •—mmmmmm****** "«^ippn^m

troller supplies a twelve-bit control word, FREQ, to the RM and a one-

bit control word to the IPM. The output frequency of the RM is equal to

(»/5> (US) (i)

where F = 5.115 MHz. The IPM operates in the following manner. The phase

of the output signal is advanced or delayed by dividing a reference signal

of frequency 2F by either three, four, or five. The divider is control-

led by the output of the RM and the carrier sign bit. The output of

the RM indicates whether the output phase should be changed or not and

the carrier sign bit indicates in which direction the phase should change

to drive the loop error to zero. If the phase is to remain the same,

the divider divides by four. If not, the divider divides by either

three or five depending upon whether the phase is to be advanced or

delayed. Then the IPM divides the output of the variable-modulus divi-

der by two and heterodynes the signal with the fixed frequency 1.75F

= 8.95125 MHz. It selects the sum-frequency, 2F = 10.23 MHz, output of

the heterodyner with a three-pole band-pass filter and divides this

signal by eight to produce the phase-modulated output signal of frequency

0.25F = 1278.75 kHz. A change of one least-significant bit in FREQ causes

a change of 1/64 of a cycle every 4 ms in the output of the RM/IPM.

The code RM/IPM is shown in block diagram form in Figure 7. Its

operation is similar to that of the carrier RM/IPM except that only a

five-bit word is used to control the RM and that the output of the IPM

is generated by dividing the output of the first band-pass filter by

two, heterodyning this signal with 3.5F = 17.9025 MHz, and selecting the

sum-frequency, 4F = 20.46 MHz, output of the heterodyner with a two-pole

band-pass filter. As with the carrier RM/IPM a change of one least-

significant bit in the control word causes a change of 1/64 of a chip

every 4 ms in the output of the code RM/IPM.

The code generator shown in Figure 8 generates both the C/A (Gold)

and P codes. It also generates channel interrupts at either 1- or 4-ms

periods and provides a bit clock. Four twelve-stage linear feedback

shift registers are used to generate the P code. The outputs of the

XlA and X1B registers are modulo-2 summed to form the output of the XI

register. The outputs of the X2A and X2B registers are added modulo-2

to generate the output of the X2 register. The P code is formed by

modulo-2 adding the outputs of the XI and X2 registers. Upon receiving

19

-«.•.,—. w... - •,.^afci-»:i>

• «_ JJIIIIUILLUJWHIJ ••- • IIIHIM^IIW ,.,..-,,..—

u o

3 •a i 10 IQ

<8

e a § n -a 0 0) a -H M U-l \-H H T3 01 Q •H S r-t a «• •H r-> 4J co iH •> 3 .H s — ai n « u a c

0) at M

>o 0) o <M u a»

H •u _ ai e tn o

i u

01 u 3

•H

- * O1U5O EC 00^ _l u.3hU

20

asfiu i^ -»- _4«*iL^

— • —

;

H O (ö H H — 3 C 0) 0) 0 Ö c o 0) u •d a» 0 <M O 01

05 +J a> e 10 o

1 M

0) n 3

•H CM

21

rizECsasL» •T-.T r-r ;;-»- — *- -

the proper commands from the process controller the code generator can

set the epoch of the XI register and slew the X2 register to any value

in less than 1.62 seconds. The C/A (Gold) code is generated by modulo-2

summing the outputs of two ten-stage linear feedback shift registers.

The input to the P and C/A code generators is the output of the code RM/

IPM divided by two and twenty, respectively. Both the P and C/A codes

are generated four chips early and then delayed by 3.5, 4, and 4.5 chips

for the early, on-time, and late correlations, respectively.

The address selector/data director in Figure 5 selects the data

that is intended for that channel from the data bus and directs it to

the proper device, e.g., carrier or code RM/IPMs.

Whereas there are four carrier channels (one for each satellite

signal being tracked), there is only one code channel which is time

shared between each of the signals being received. The sequence of

code channel measurements is shown in Figure 9. First the code error

for channel one is measured. For reasons that will be discussed in

later sections, this requires a time interval corresponding to two data

bits or equivalently forty milliseconds. Then the code errors for chan-

nels two through four are measured. Next the channel-one L2 measure-

ment is made. There is a ten-millisecond guard band between measure-

ments. This 250-millisecond cycle is repeated with each fifth measure-

ment being an L2 measurement for a different channel. Thus the update

rates for code-error measurements and L2 measurements are 2 50 and 1000

milliseconds, respectively.

A block diagram of the code channel is shown in Figure 10. It

consists of a local reference generator/correlator, signal conditioner,

carrier RM/IPM, programmable digital delay, user time clock, and an

address selector/data director. The operations performed by the local

reference generator/correlator, signal conditioner, address selector/

data director and carrier RM/IPM are the same as the operations performed

by the local reference generators/correlators, signal conditioners, ad-

dress selectors/data directors, and carrier RM/IPMs of the carrier chan-

nels except that in the local reference generator/correlator the incoming

signal is alternately correlated with the early and late codes instead of

the on-time code. (It should be noted that the code loop requires a se-

parate carrier RM/IPM because of the manner in which L2 measurements are

made, as described in a subsequent section. If this were not tne case,

the outputs of the carrier RM/IPMs on the carrier channels could simply

be routed to the code channel and properly switched for correlation

22

•"•*--•

r • •

o o

s N •J Uf

(M Z -J h

o w -8 «_

9 «t> 4 J ui

ml 1- < i s& -8 8

r> M

_i UJ

J Ij S Si O

O

« "•a pi UJ

-1 1? Z 0. O Ul U8

8 «- N

.J Ul z .

-1 1} 5& .8

n 3

•J Ul

d z -1

< ? O Ul 8

8 « «J UJ

Ij ia -8

o

« £ -j UJ

-J 1- Z a. O UJ -8

M -l UJ *- |5 Z o. U UJ

,- J Ul

J

5 a

8 * •J Ul

J z 12

-S * * 1 -1 UJ

J

S & -8 »_ 8

en pi Ul

Jl

s & o

C4 8 -1 UJ Z -

-1

$1 I a. U Ul o

~8 8 _ r»»

J Ul

J

Z a. U Ul o

r* ©

to r* _l Ul

2 Z Z ft; < "J z o- O UJ § ^

8 * U3

-1 Ul

-J h Z a. U Ul a

(0 O

n 3 -1 Ul

-J

Z o. U Ul -8 S

g N in

pj Ul

-1 h s& -S e

•• l «1 Ul Z -

§

i

o> •a o o •P 01

w o iS

01 c

^ * 0 u 01 Ü 01 c J: 01 4J —

|c- 0> -H W 01

a) ü

CH 01 •H c- t-l >-i s o> 18 M-l

2H! en Q) a

! 2 § e in p

EH t; h

0>

3

15 s&

23

b„ HMfcl—daaiaJüiüiMim i rT '--- •*• •' - • — - j

;—»•—.»'•»>• ;" —-"•«•>"

ss SS

ll es A

z

OC

KTO

IE

R

NEL

S K uJ z

o _i tu cc z ag «f yj

go So coc< •JSZ UJ K < O < X IIIUUU

ucc< t-< x

uh ezn

3 ü O cos / * * Q. o 00

o

r p ö ö o

25 o o

< C9

I S s

I <•

4-

K e i- <

O UJ z cc

UJ ü u. UJ K —I < ü

A X

A K O

\t \! \f

4 AA

CO < < -1

1 Q

O 19

2s X o u. o

ä2 e =

2 = *-*

32

UJ O UJ

gujO

o

T

. o o

r 1|

1 % •H 14-1 •H

I 0)1-1

u c 01

m M «0 0)

OS

(D E OT 0 I »^

n 3

•H 1%

XX -J _ UJ UJ s> x. o z ce, X o o< u. O o .

XX UJ CJ

S3 UiU

24

i, i^^iii^aHMlMfciMÜlliiiiliil •

« •'•' •• '."•'•• •'•'» "1 MBIWIWWH ' ' HU^MWW^—^

with the incominc signal).* The functional operations of the user-time

clock and the programmable digital delay are described in the following

paragraphs.

The user-time clock provides accurate four-millisecond tics for

the code generators, programmable digital delay, and signal conditioners

and timing signals of frequency 0.2F = 1023 Hz for the carrier and code

RM/IPMs.

The programmable digital delay selects the proper code and code

clock (the output of the proper code RM/IPM). The code is then fed in-

to a sixteen-bit shift register in 1/2 chip increments. The process

controller determines the bit in the shift register, and therefore the

code delay from -4 to +4 chips in 1/2 chip increments relative to the

on-time estimate, that is fed to the signal conditioner. A functional

block diagram of the programmable digital delay is shown in Figure 11.

The frequency synthesizer (shown in Figure 12) generates all of

the stable continuous wave signals used by the receiver for timing and

as local oscillators. There are five functional blocks to the frequency

synthesizer, internal reference oscillator (5.115MHz), 5 to 5.115 MHz

phase-locked loop, utility synthesizer, L-band synthesizer, and cali-

bration signal generator. If an external oscillator is present, the

synthesizer detects its presence and phase locks the 5.115 MHz reference

oscillator to the 5 MHz external oscillator. The reference oscillator

can be adjusted over a 4 Hz range. The 5 to 5.115 MHz phase-locked loop

is depicted in Figure 13. This phase-locked loop has a bandwidth of

1 Hz. Tables 3 and 4 present the performance characteristics of the

reference oscillator and frequency synthesizer, respectively.

The process controller controls the receiver and processes the

incoming signals. Specifically it performs the following tasks:

1) Calibration and initialization of the receiver as commanded by the

data processor. 2) Sequential code search and non-coherent-frequency

pull-in for signal acquisition and reacquisition. 3) Carrier-tracking

loop selection (either a Costas loop or a combined automatic frequency

control/Costas loop may be used for carrier tracking). 4) Processing of

carrier and code loop error measurements. 5) Control of the carrier and

code RM/IPMs. 6) Control of the code generators. 7) Data synchron-

ization, demodulation, error detection, and reformatting for transfer

to the data processor. 8) Control of the user-time clock. 9) Control

*The number of leads running between modules may also be a consideration.

25

^^^*j^^^^^tm^**^**m^^^^+m-nT*i*a\ih h.*, • ^..,<.

•••'• -

~-0C ai oc o OOK ZI-< LU<_J

-iOCOCLU < uj LU ec uu-Ztc

00"JUJO prJocoo

DC LU i o III oc

u. I CO

00

«3

U

^ |- -c •

* CO CM T• <* CO CM «- * * * * UJ UJ LU III _l -I -1 -1 Q Q Q Q O ü O O

FRO

M 4

C

AR

RIE

R

{

CH

AN

NE

LS \

o o o o

^ to ac ia| "-Oo

z o o

s a.

2 ec LU o o h Eg CO LU I- O. u to S:UJ l-OC

§<r* LU "~ T tO

LUZ ocz << •» I

to tr V LU

<8

01 D

10

•H

•H Q

10

u o 1-1 04

01 rH c *- c (0 0)

cj c Gl

0) (-1 TJ Q> 0 t-i U 0)

K •P 01 E (A O

I U

0) H

26

"••-"•—-«••-•- __."_: 'z I_>J_

52 .- oz -1

i° *z c* 3 .- * »_ UJ —' .

A z o (- <

A z o HO <z

—i a

IS

kl 0

o I o 1 g c V kl 1

<t-l

01

Si

N.H

•2 *J c » >1—

ü« CO <uc 3d) tu ai M*!

w o 1 ,M

01 u 3 Di •rt

:<o <o

L •MM*.

27

HA 4M •"*•'•-- > _^_ »,.«*••

' m>i ii .• m ii II« •—«

"O

ii

I

£

|- a-,

ii

NP^ fill

r

£^t:

••15» ESI

•a—*r* ®g

«< =

JE« CSllI Mui

a o o •J

•a A; o o ij I ai w (0 x: & N 33 s

• 0) in o \ c o <D o u o ai

• <w in (u

K

w o I u

2 g.

•H

28

r^r^^T^^7^r^=^^=^a^>r-,t. .I.. —II i

" • in ii in i. "' "• ••»»••^•^WPWWWWWWWWlWWIWPWWWIWir^WI

Table 3. X-set Reference Oscillator Performance Specifications from References 1 and 3.

Description Characteristics

Nominal output frequency 5.115 MHz

Frequency adjust range:

Coarse ±10 Hz min.

Fine ±1 Hz min.

Output level (rms) 0.5 V min.

Output load 50 ohm (nominal)

Temperature range:

Operation -20 to +70°C

Storage -65 to +125°C

AF y- Stability:

Total frequency deviation over entire <1 * 10-9

temperature range

Short term <1 x lO-10/sec

Aging rate <1 x 10~9/24 hr

Voltage <±1 x 10 /±5 percent

Loading <±1 x 10/10 percent

Vibration <2 x 10⁻⁹/g

Shock <2 x io"9/g

Acceleration <3 x 10⁻⁹/g

Stabilization:

From temperature: -20°C to +70°C

5 Minutes <1 x 10"7

30 Minutes <2 x io"9

Frequency pulling range 0.4 ppm

29

— '-- _.

"«^•••

Table 4. X-set Frequency Synthesizer Performance Specifications from References 1 and 3.

Description Characteristics

Receiver reference oscillator frequeno/ (F) 5.115 MHz

Synthesized frequencies 2Ff 4F, 7F 17F, 21F, 29F, 34F, 204F, 272F, 274F

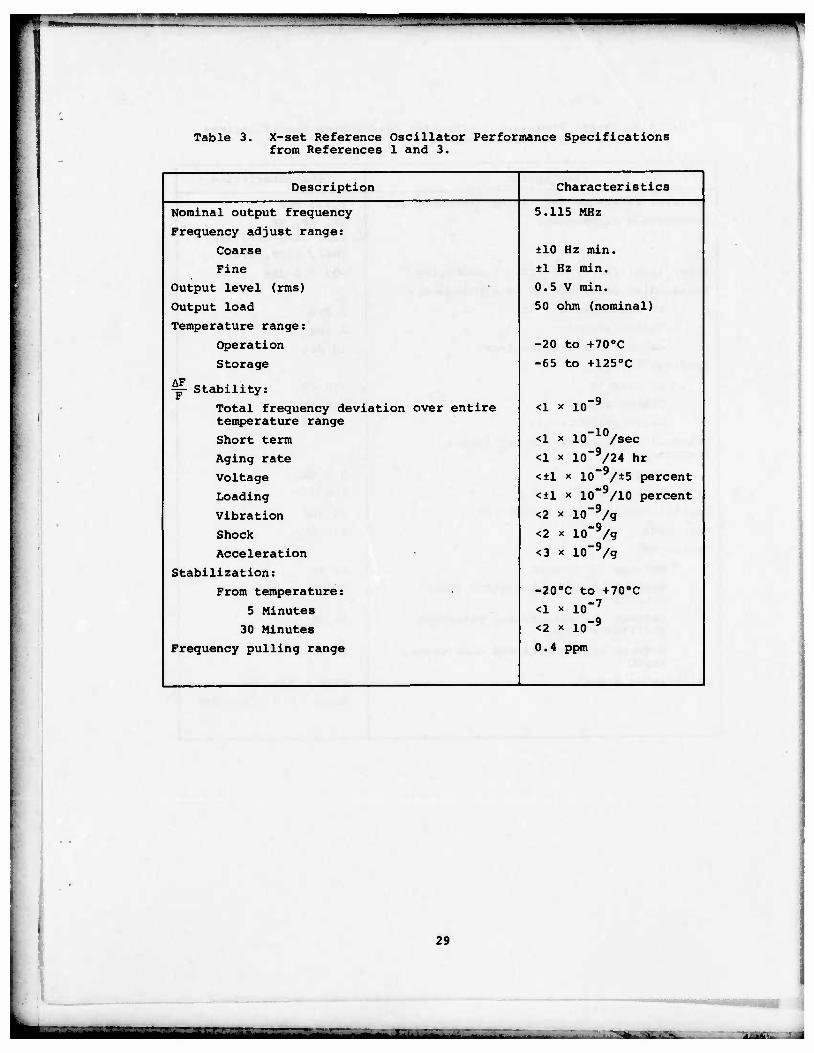
Power level for synthesized frequencies -23 * 3 dBW

Phase-noise contribution of synthesizer:

LO frequencies (rms) 2 deg

Timing signals 2 deg

Calibration signals (rms) 10 deg

Spurious level:

LO outputs -50 dB

Timing signals -40 dB

Calibration signal -30 dB

External input reference oscillator frequency:

Frequency 5.0 MHz

Signal level (rms) 1.0 V

Nominal input/output impedances 50 ohm

Max. VSWR 2:1 max.

Isolation:

Between LO outputs 50 dB

Between LO and calibration signal 50 dB outputs

Between all outputs and reference 50 dB oscillator input

Between all outputs and code signal 40 dB input

Calibration signal 274F + 34F» PN

Note: F = 5.115 MHz

30

-A'.*.-^

r?

• '

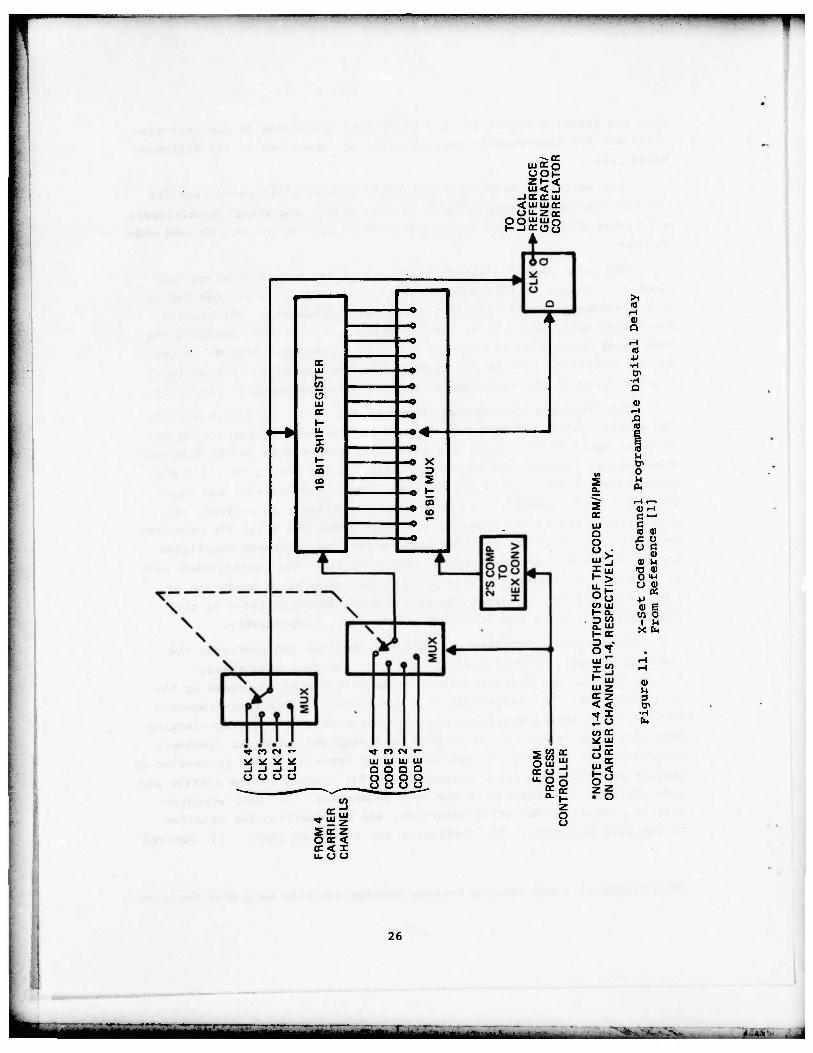
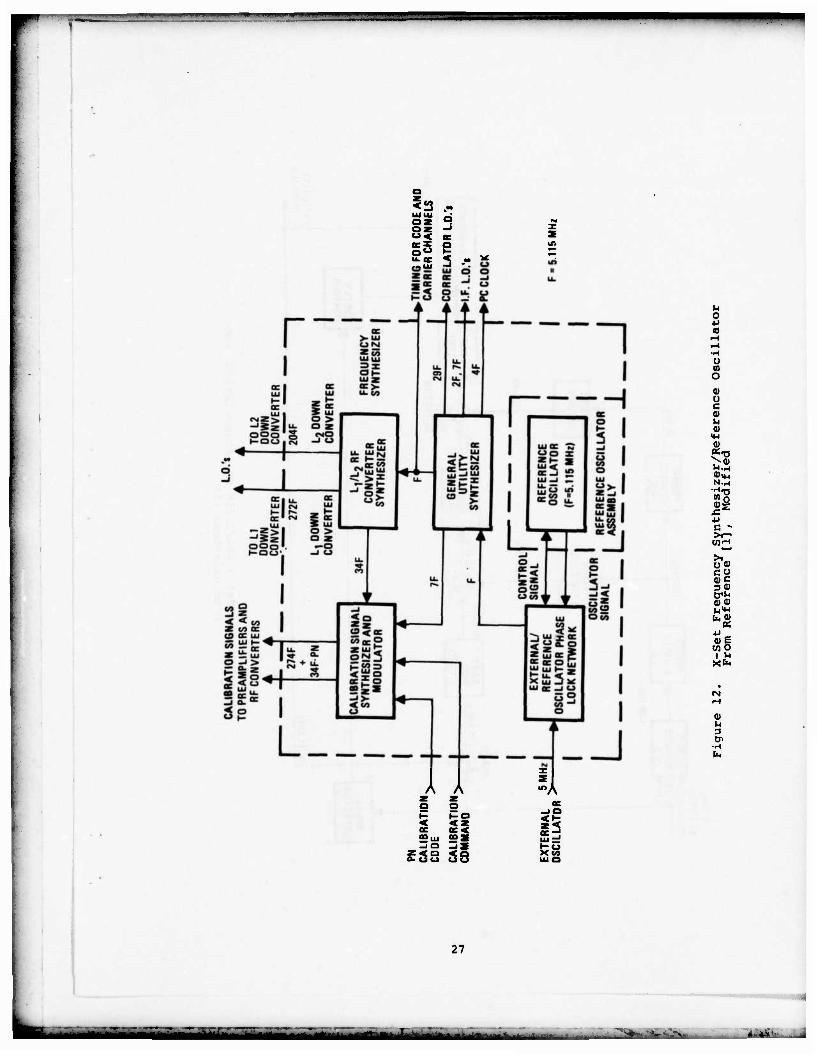
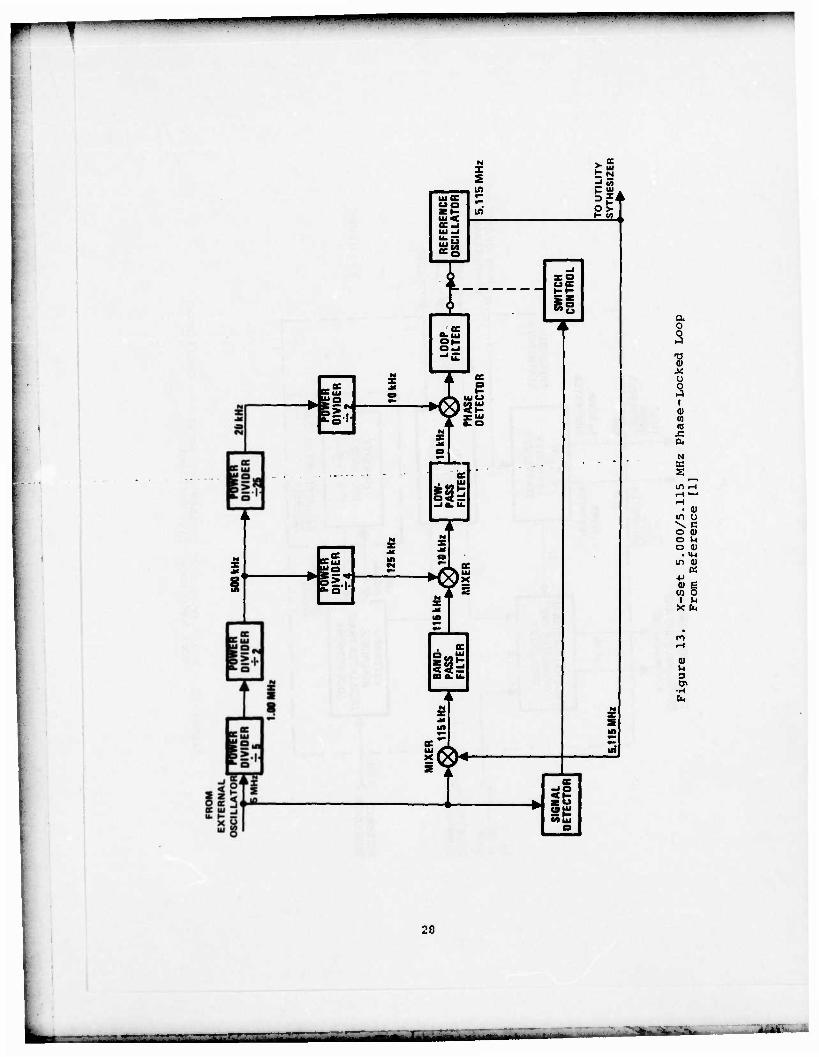
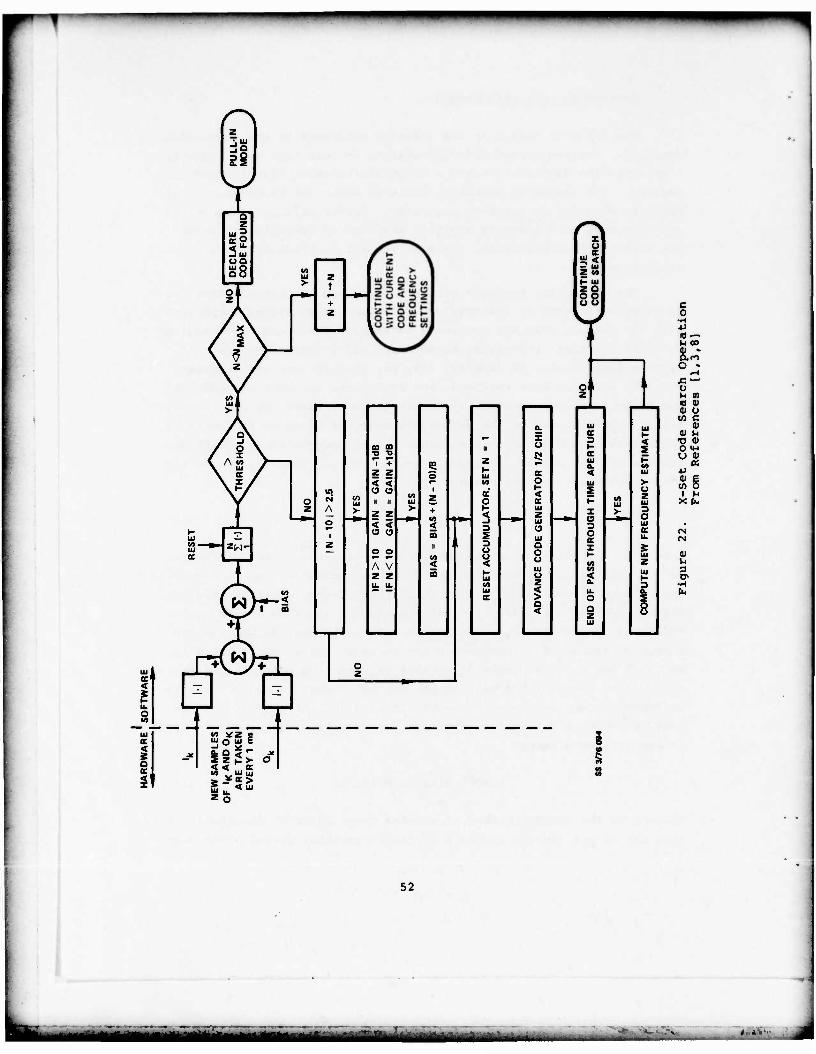
of the coherent AGC circuitry. 10) Signal quality monitoring. 11) Mea-

surement of the pseudo-range, delta-range, and L1-L2 code signals for

each satellite signal being tracked.

With the exception of the signal monitoring functions, the opera-

tions of the process controller are described in the succeeding sections.

31

L_ t^r. — ..- . - —._• -•- r .. :-_• . _.

x

„,

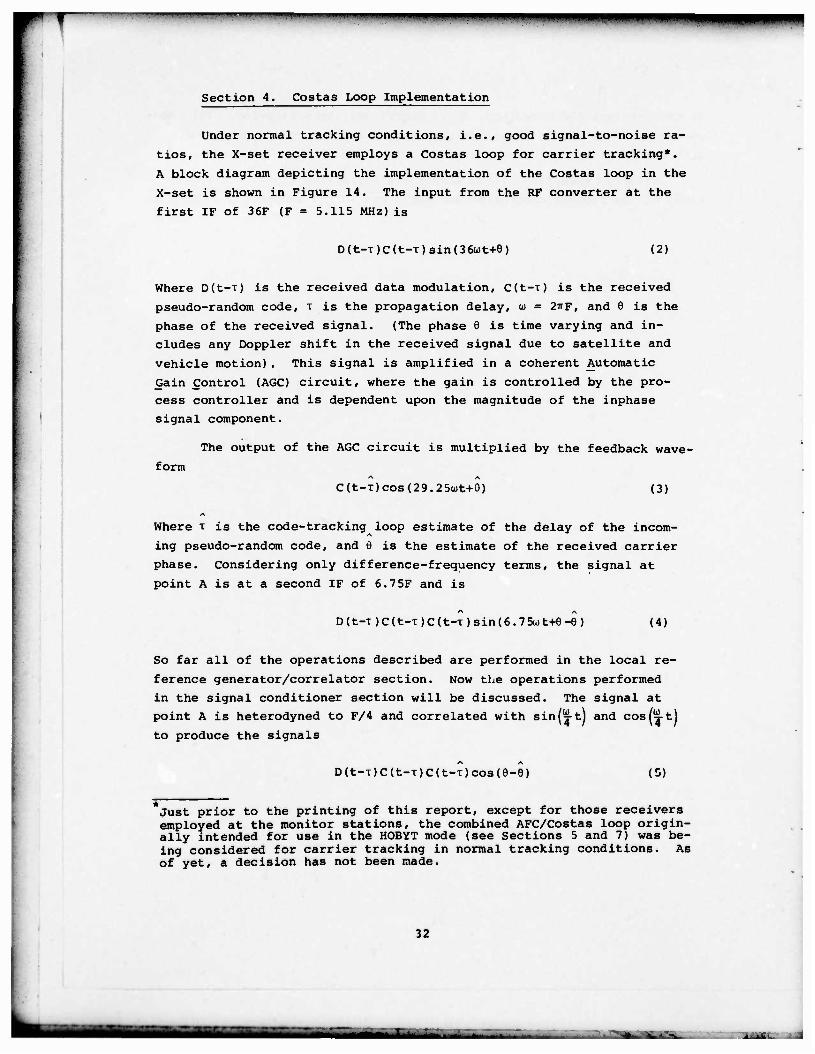
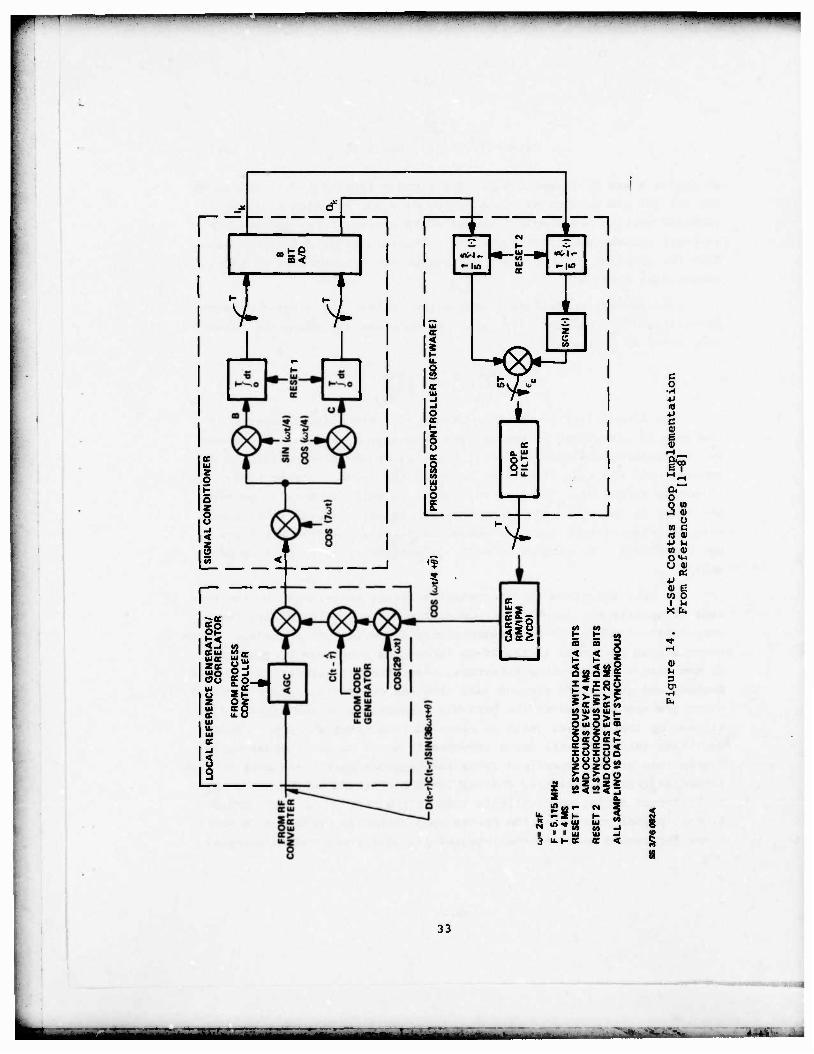
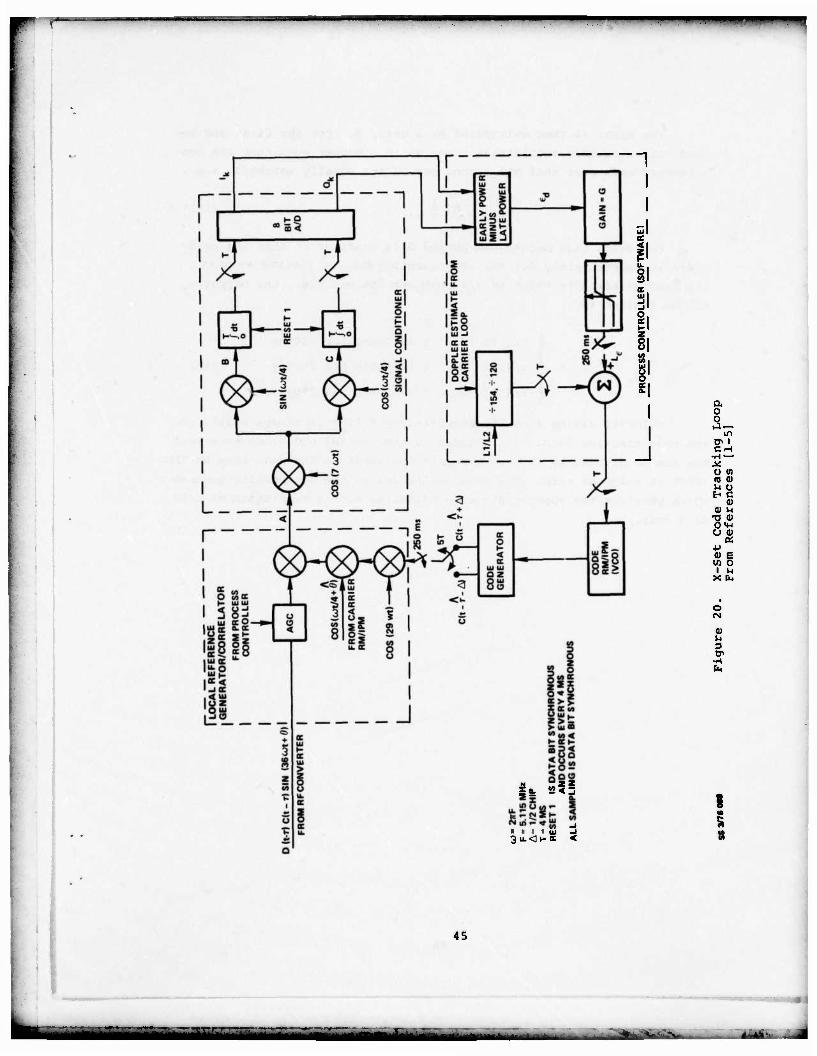
Section 4. Costas Loop Implementation

Under normal tracking conditions, i.e., good signal-to-noise ra-

tios, the X-set receiver employs a Costas loop for carrier tracking*.

A block diagram depicting the implementation of the Costas loop in the

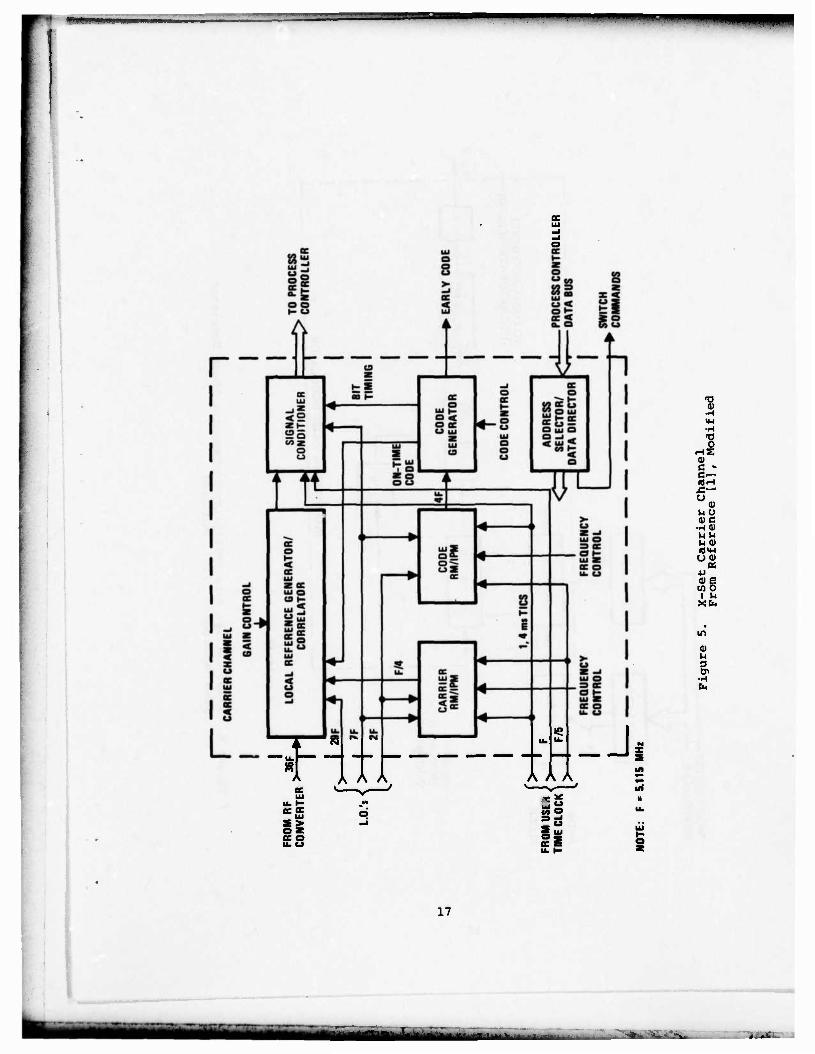
X-set is shown in Figure 14. The input from the RF converter at the

first IF of 36F (F = 5.115 MHz) is

D(t-T)C(t-x)sin(36wt+e) (2)

Where D(t-T) is the received data modulation, C(t-T) is the received

pseudo-random code, T is the propagation delay, u = 2irF, and 9 is the

phase of the received signal. (The phase 6 is time varying and in-

cludes any Doppler shift in the received signal due to satellite and

vehicle motion). This signal is amplified in a coherent Automatic

Gain Control (AGO circuit, where the gain is controlled by the pro-

cess controller and is dependent upon the magnitude of the inphase

signal component.

The output of the AGC circuit is multiplied by the feedback wave-

form

C(t-T)cos(29.25ut+0) (3)

Where T is the code-tracking loop estimate of the delay of the incom-

ing pseudo-random code, and 6 is the estimate of the received carrier

phase. Considering only difference-frequency terms, the signal at

point A is at a second IF of 6.75F and is

D(t-T)C(t-T)C(t-T)sin(6.7 5ut+6-6) (4)

So far all of the operations described are performed in the local re-

ference generator/correlator section. Now the operations performed

in the signal conditioner section will be discussed. The signal at

point A is heterodyned to F/4 and correlated with sin(jt) and cos(j tl

to produce the signals

D(t-T)C(t-T)C(t-T)cos(9-9) (5)

Just prior to the printing of this report, except for those receivers employed at the monitor stations, the combined AFC/Costas loop origin- ally intended for use in the HOBYT mode (see Sections 5 and 7) was be- ing considered for carrier tracking in normal tracking conditions. As of yet, a decision has not been made.

32

l—

r _(-0 °°5< o

~1 Fi--i •-lio

o I oc

Is oc o CO </> 111 u

I o

1

T

85

li i I

ecu S-

u<0 2-" ou Jo. Ul ZOC U 5t- z oz ui oc Q e u. o Ul s oc

is li

1° • I • II !JT_ _

i. oc

ill CD

<

3*2

*£* <fl Ul t/>

O uiO

O oc O oc sac IOI o o o zoz

N «0g»> Z c«<o> z " JO««- M

t -SH I- £ ui« ui ui N "Tu «O II I I ul Ul 3 iLhK ce

en 3 O z

it OC in

Ul CD «9 < ec t- 3« «o

I •U

5

is

•P u m w 0<w O QJ

li I fc

M 3

•H

II ID

s

33

----- IMAMM 'i'-tMM.lfaihi.r-

-

and

D(t-T)C(t-T)C(t-T)sin(9-6) (6)

at points B and C, respectively. The signals represented by Equations

(5) and (6) are integrated for a period of 4 ms, at which time the in-

tegrator outputs are sampled, converted to digital form, and held by

an 8-bit analog-to-digital converter. The integrators are then reset.

Both the sampling and the reset operations are synchronized to the in-

coming data bits.

The process controller averages the inphase and quadrature sam-

ples, I. and Q. , respectively, over one data bit and forms the Costas

loop error as follows.

5 . 5

••^•JhlSS".)! (7) k=l ' " k=l

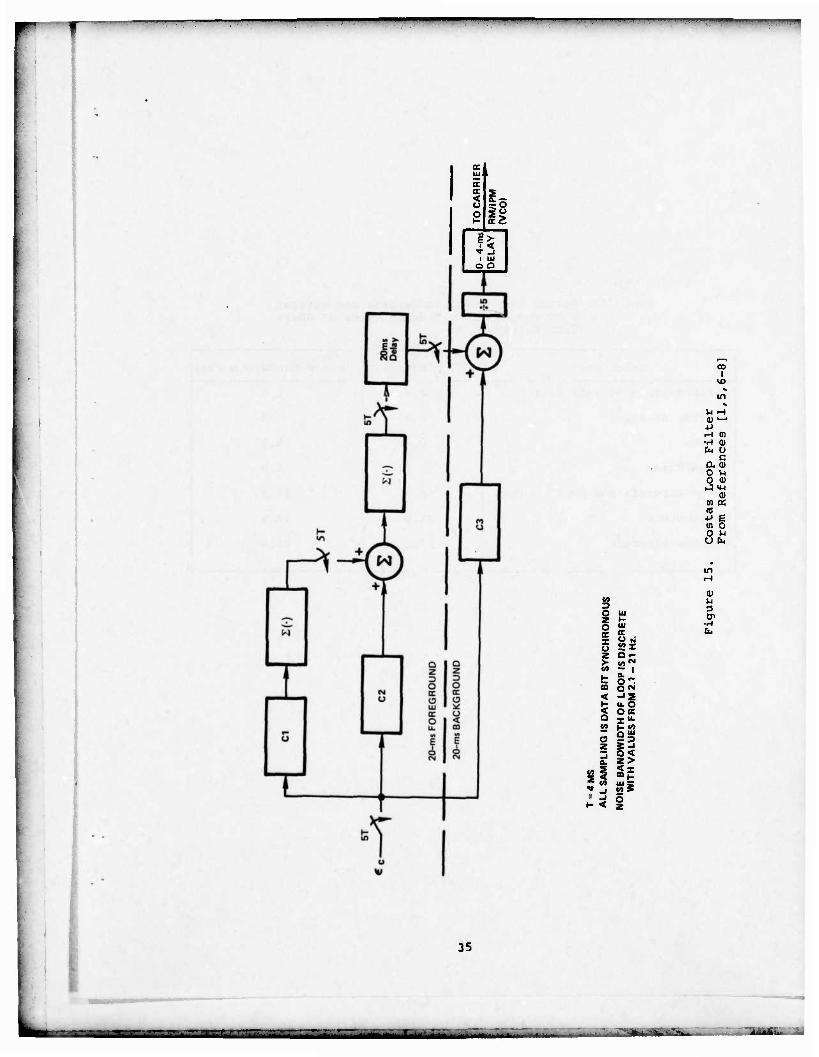
The loop filter is shown in Figure 15. The noise bandwidth of

the loop is determined by the natural frequency w and may assume se-

ven discrete values from 2.1 to 21 Hz. The choice of bandwidth is de-

pendent upon the type of vehicle in which the X-set is to be used. The

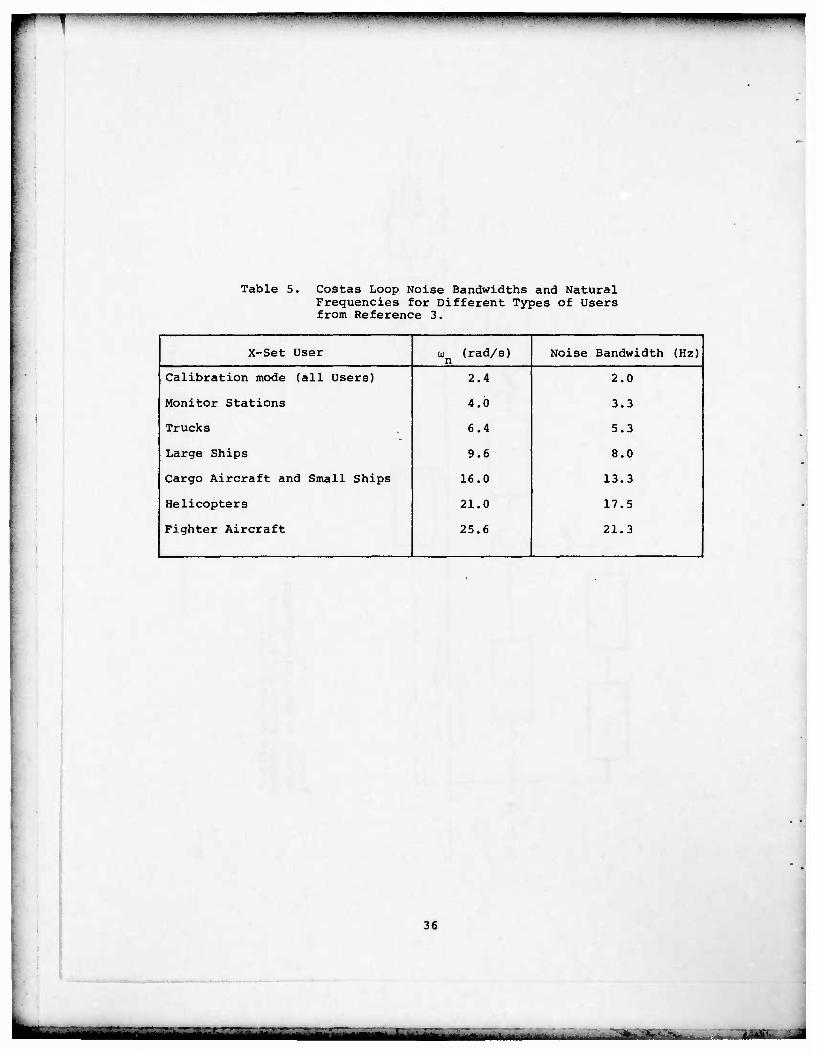
allowable values of u and the situations in which each is to be used n are shown in Table 5. The loop bandwidth is selected via four binary

bits, therefore there are nine bandwidth-selection states which are

not being used. No attempt is made to dynamically vary the loop band-

width.

To help alleviate the throughput problems experienced by the pro-

cess controller the loop filter computations are separated into two

computational modes; 20-ms foreground and 20-ms background modes. Those

computations performed in the 20-ms foreground mode must be completed

by the next 4-ms user-time interrupt. User time is asynchronous to the

inphase and quadrature samples (and £hus the Costas-loop error samples)

which are synchronized to the data-bit transitions of the signal being

tracked by that channel (this is referred to as channel time). Thus a

user time interrupt will occur anywhere from 0-4 ms after updating the

Costas loop error. Therefore 20-ms foreground computations must be per-

formed as fast as possible, whereas 20-ms background computations may

be performed during any available time in the next 20 ms. The propor-

tional (phase.) portion of the Costas loop filter is performed in the

20-ms foreground mode and the integral (velocity) and double integral

34

**i i-I---—-•--» *•>**•

—«I

a. UJ 1

cc CC < la u ~.° g oc2

E > I < * _i 1 UJ

O O

o z o (T I o z >

00 I

10

in

1-1 <-{ fl)'— *> i-H Ul -H ai b Ü

c a <u o n o <u

a> to « UJ 4J e (II o o u

ai u 3

11 »- <

UJ or a d J2I Or

OCN -'S U.O OCC

ff 25

35

L T-.- --.--• -r- —-x..r. - • • :i- • ^ *--•

Table 5. Costas Loop Noise Bandwidths and Natural Frequencies for Different Types of Users from Reference 3.

X-Set User u) (rad/s) n Noise Bandwidth (Hz)

Calibration mode (all Users) 2.4 2.0

Monitor Stations 4.0 3.3

Trucks 6.4 5.3

Large Ships 9.6 8.0

Cargo Aircraft and Small Ships 16.0 13.3

Helicopters 21.0 17.5

Fighter Aircraft 25.6 21.3

36

-•-•—~f- UlLftilMl-i

' *——•mm i «""•I

(acceleration) portions of the Costas loop filter are performed in the

20-ms background mode. The delay between the 20-ms foreground and the

20-ms background computations is constrained to be 20 ms. The output

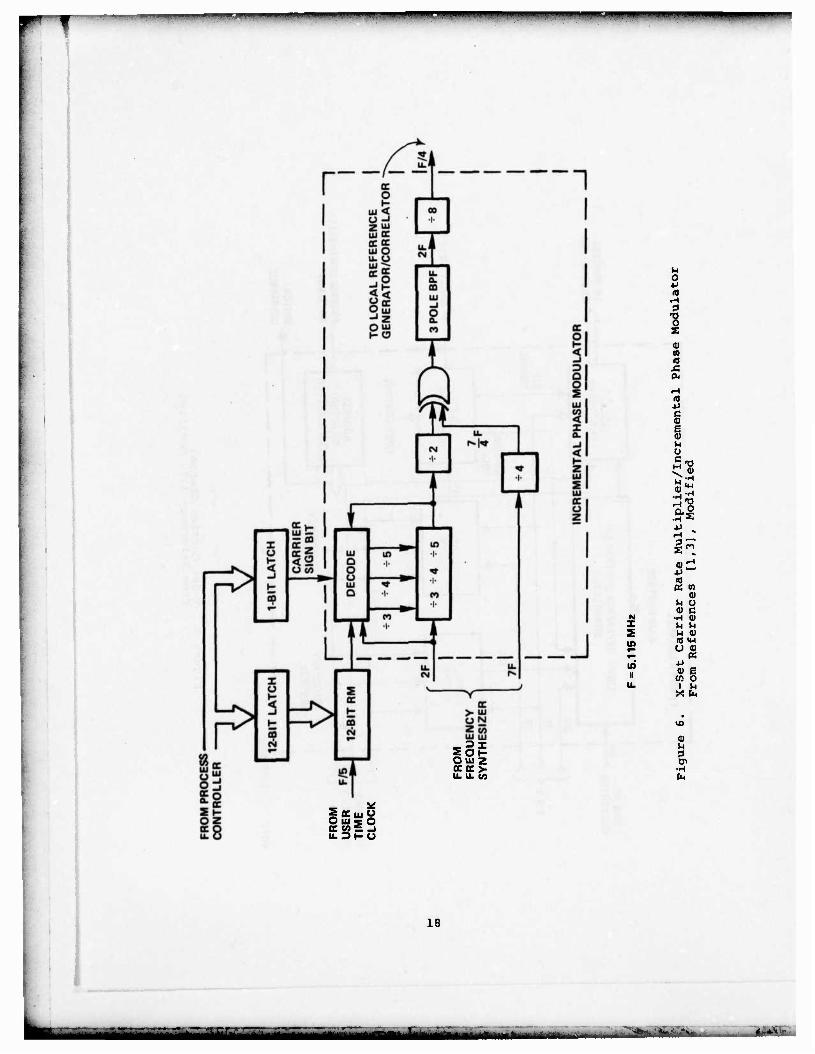
of the loop filter is divided by five and sent to the carrier Rate Mul-

tiplier/Incremental Phase Modulator (RM/IPM) at a 250 Hz rate when the

next user-time interrupt occurs. The RM/IPM is essentially a digital

Voltage-Controlled Oscillator (VCO) with a resolution of 1/64 of a cy-

cle. The output of the carrier RM/IPM is modulated by the on-time code

estimate from the code generator and a sinusoidal of frequency 29F from

the frequency synthesizer to generate the feedback signal.

Costas lock (or lack thereof) is determined by low-pass filtering

the difference between the absolute value of the inphase component 11. |

and the absolute value of the quadrature component |Qfc|. The corner

frequency is about 10 Hz when the filter indicates out-of-lock and about

1 Hz when the filter indicates lock.

37

——Mtt-U-^-"" »•.—....• • ...

11 >"«.... .»I ' i ii ii. u »HI •DIII.UIII .linn i um ».ii • i »»in i —mmmmmm^^mmmmmmm——•—|

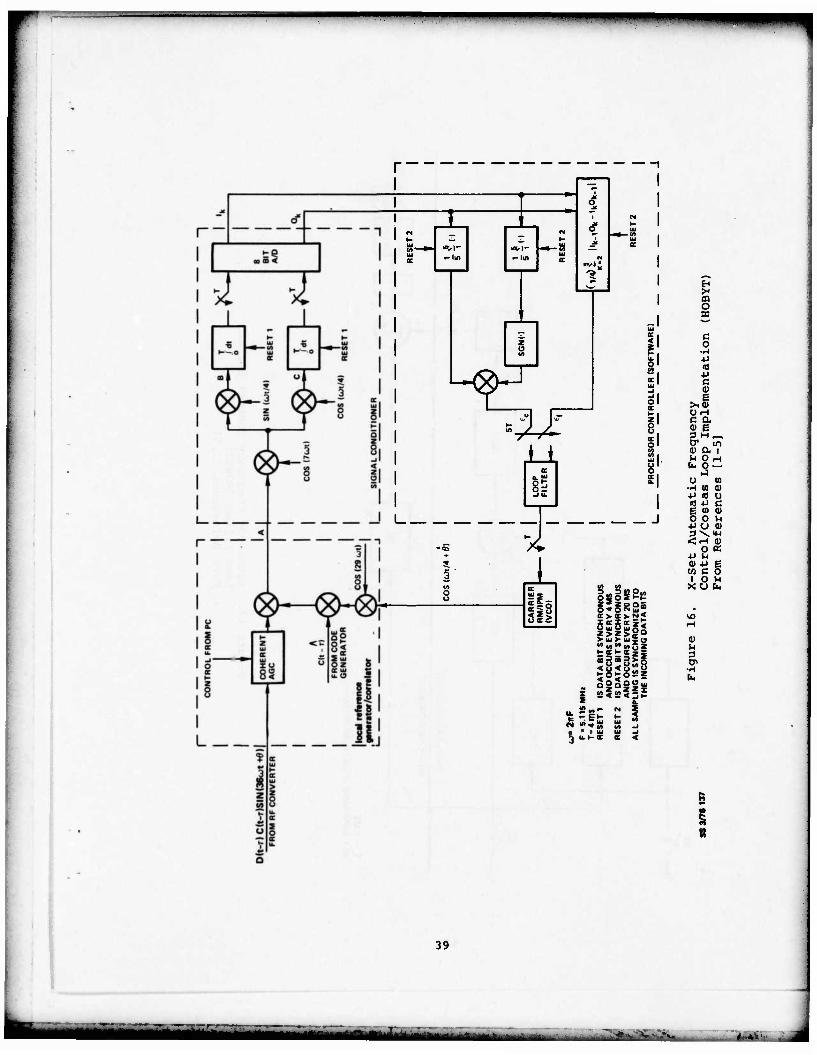
Section 5. Automatic Frequency Control/Costas Loop Implementation

In situations in which Costas lock is not possible (e.g., under

high jammer-to-signal conditions or during initial acquisition), the

X-set receiver must estimate the carrier frequency as well as possible

so that the carrier loop can provide accurate velocity aiding informa-

tion to the code loop. For these purposes Automatic Frequency Control

(AFC)/Costas loops are used. Two types of AFC/Costas loops are used. For acquisition, a first-order AFC and a second-order Costas loop are used.

In the Hold-On-By-Your-Teeth (HOBYT) mode, which is explained in a subse-

quent section, a second-order AFC and a third-order Costas loop are used*.

The operation of the hardware portions (local reference generator/

correlator and signal conditioner) of the AFC/Costas loop is the same

as the operation of the hardware portions of the Costas loop that was

previously discussed, in fact, the same hardware is used. The dif-

ferences in the two tracking modes is in the process controller (i.e.,

software). This is true for both types of AFC/Costas loops. The AFC/

Costas loop employed in the HOBYT mode will be described first. It is

shown in Figure 16. The Costas portion of the error term e is gen-

erated in the same manner as before. The AFC error term E, is developed

by taking the average of the cross products of the current sample, (1. ,

Q ), with the preceeding sample, (I^.j» ^k-1^ ' *-'e-'

«f = ik?2[Ik-iQk - rkW (8)

Note that the cross product between samples taken when data bit tran-

sitions occur are not used in forming the frequency error, e,.

At the end of each data bit the error terms, ec and ef, go to the

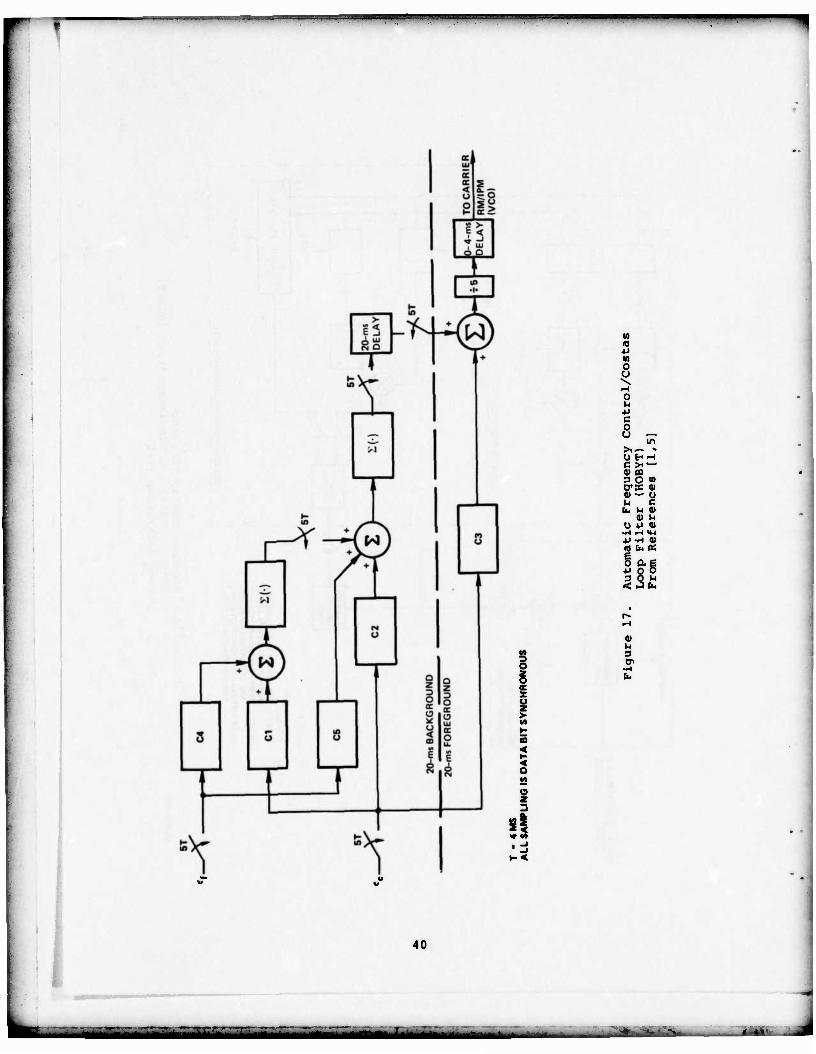
loop filter, which is shown in Figure 17. The Costas noise bandwidth

is the same as the noise bandwidth chosen in the Costas mode and the

AFC noise bandwidth is in the range from 0.1 to 4 Hz. The output of

the filter determines the correct value to be sent to the carrier RM/IPM

(VCO) at the next user-time interrupt. The generation of the feedback

signal is the same as in the Costas mode.

The dot product of successive 4-ms inphase and quadrature sam-

ples is low-pass filtered and compared with a threshold to determine

*See footnote on page 32,

38

tmtttttdätmmMtmMm*- i '"tniffi^-Tni ^fr

r ^^^w

«VI- -lio

«vij

z

V J u §5

l_.

"*

8

si Z'Zo a > cc > imi UIUUUI ?>?> > m > UJ "»«I«».» I- oct- oc

< o < o •- 5»- o

£ < 52 <

85 is 2° 51 II II

• * I Ul 5 »•-•

i" a o x

c o •p 10 •P e 3 i

ÜH c a 0> g p M _ V in <u a 1 u o ,H Pt, o —

•J 0 n

-H 0) 0) •p <o u « -P C E <n 0) OOki

•P o 3\

O •P M ai -u W C

1 o X u

a at OS

i u

01

3

5

8

39

"jyüifa^i

5 « 8 o u i 8 -

in

O H^ c >< — 0) 0 o o trx o> — h fc. U

01 O **

(fl (II u c 0)

•H 01

b.

3 o S K

> in

< a

o z

«!

•-<

0)

40

1

1

AFC lock (or the lack thereof). The corner frequency of the low-pass filter is about 10 Hz when the filter indicates out-of-lock and about 1 Hz when the filter indicates lock.

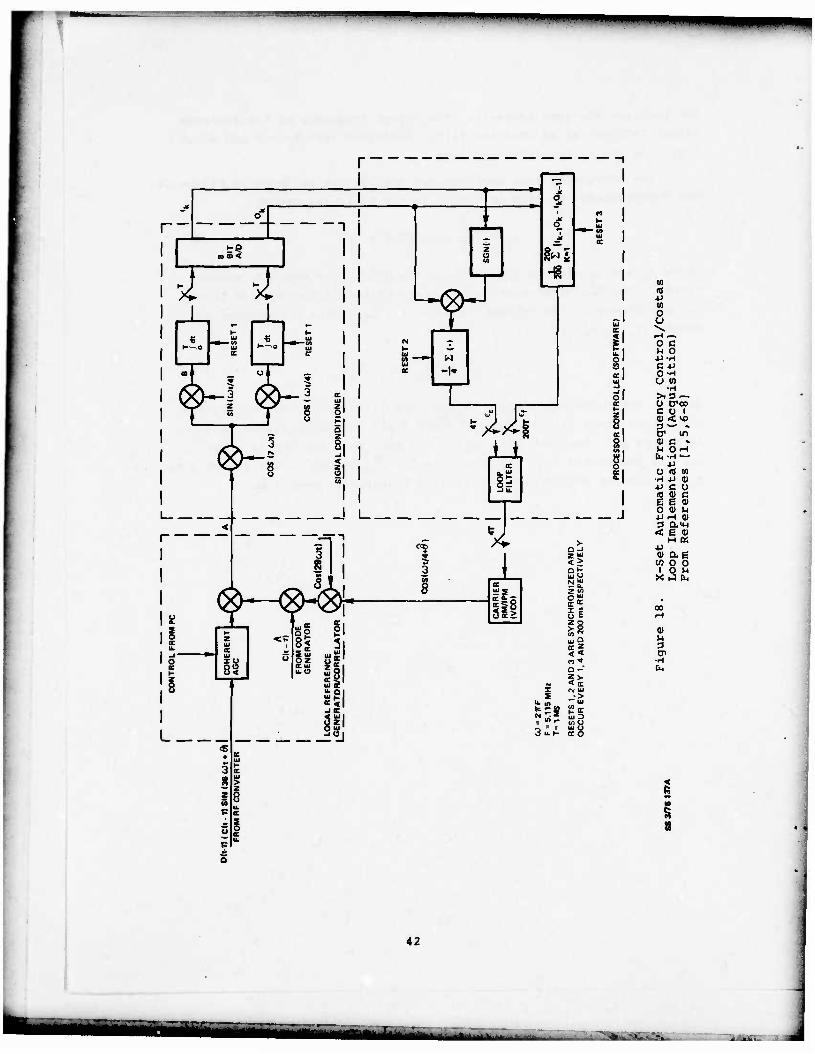
The AFC/Costas loop employed for acquisition is shown in Figure 18. The Costas error, ec term is formed in the following manner

4 £„ = xEQksgn(I. ) (9)

where I and Q. are the 1-ms inphase and quadrature samples, respec- tively. The AFC error term ef is formed by taking the average of the cross produces of the current sample, (Ik, Qk), with the preceeding

sample dk_1» Qk-1)' i,e-'

i 200 ef -ntElIfc-A " Xk°k-ll (10)

k=l

The AFC error term is sampled by the loop filter every 200 ms whereas the Costas error term is sampled every 4 ms. The loop filter is shown

in Figure 19. As previously stated, in this mode the AFC is first or- der and the Costas loop is second order. The output of the filter goes to the carrier RM/IPM at the user-time interrupts every 4 ms.

41

- ..- .:•-- - | ii—i liti i

r a a <

J~~H

Hfl | ®-5 I

3 R

®—H <2K$ z ui K ui X U 8S

L

ii S Ul oz oc UJ u. O

ecu ul cc

-IK < w O Ul

-H2H

i I

JL

HS

w

^

U is

i •r

X I

3» II

U.H

> O -l z!" <ä Qt- Ul U N£ 2 M §S z g CO "

ui 2

<< O -'

!£ fM UJ -> *~ Ui

El « O UJ u

3 cc 8

Ul > z

z o u c cc

X B o

cc • P

42

V) 10 •u (A o u

o c H 0

•M-W C -P O-H U (0

•H >i3" ü croo c u I 0) < vo 3~ » tT m Q) C » ^i O H

«i o id w •H4J«J •P c o e e O 01

•PfH

< e a> M «

•P at ae woo i o u XJui

c a> u QJ

0) u 3 t7>

«

' -'••». I nil. »i.i >•"• in "" •»'—'»

o a

i 5

«I (a •p

O O

o M — •P C c o U P —

•H 00 >. 01 I 0 -H VO C 3^ 4) tr pun tr< o) <u ~- o M C [n U <D

CD l-i Ü *J 0)

••4 iH 14-4 P-l fl) (0 h K 1 Sag

•POO son < J fc

3 IT

•H

43

«„441'

i. in. „...IM— mmmmmw «wwww»

Section 6. Noncoherent Delay-Locked Loop Implementation

The X-set receiver employs a first-order Noncoherent Delay-Locked

Loop (NDLL) for code tracking. The implementation of the NDLL in the

X-set is shown in Figure 20. The local reference generator/corrrlator

and signal conditioner operate in the same manner as the local refer-

ence generator/correlator and signal conditioner in the Costas and AFC/

Costas loops. However, the feedback signal for the NDLL is alternately

switched between

C(t-T+A)cos(29.25ut+6) (11)

and

C(t-T-A)cos(29.25ü)t+6) (12)

where A=l/2 chip. This technique is referred to as T-dithering. The

feedback signal is at either the early or late position, represented

by equations (11) or (12) respectively, for a period of 20 ms beginning

at the start of each incoming data bit. Therefore the process controller

requires a time interval corresponding two data bits (40 ms) to esti-

mate the NDLL error term e

ner

This term is formed in the following man-

ed = EP-LP (13)

where

EP

and

• (»£*); * (*&) The E and L indicate whether the feedback signal was in the early or

late position, respectively. The determination of which measurement,

early or late, is performed first is a random quantity. This prevents

biasing of the error term ed in the presence of periodically-pulsed

jammers. The error term is updated every 250 ms, according to the se-

quence shown in Figure 9.

44

t___ J±J_:

••-—-•• j- I —•»•»•—

"1

ml

1 si

§1 Si

i|

J

IS H II II II

a o o va-

in O* I CH

o u

O u-i u <u

a 0) E w o

I M

o CM

0) t-l 3 I?

••-( b

i

45

^ >Ww

The error is then multiplied by a gain, G. For the first one se-

cond following code acquisition G varies in a manner such that the mea-

surements made over that one second period are equally weighted, i.e.,

G«± t (14)

Following this one-second period G is constant so that the band-

width is approximately 0.1 Hz. The quantity (Gt,| is limited so that

its maximum absolute value is 1/4 chip per 250 ms, i.e., the output L

of the limiter is

Ged if |Ged| <_ 1/4 chip per 250

Le * 1/4 if Ge. 1/4 chip per 250 ms (15)

-1/4 if Ged < -1/4 chip per 250 ms

Velocity aiding from the carrier-loop filter is always applied to

the code-tracking loop. It is added to the limited code-loop error and

the sum is divided by five to generate the input to the code-loop RM/IPM

(VCO) at a 250 Hz rate. The code RM/IPM drives the appropriate generator

which provides the appropriate code estimates with a resolution of 1/64

of a chip.

46

••••» "" •• • • ••' '' ^W«W——I—wppip^w

Section 7. Hold-On-By-Your-Teeth (HOBYT)! Operation

The bandwidth of the Costas loop will generally be substantially

greater than the bandwidth of the AFC loop, and the bandwidth of the

AFC loop will generally be substantially greater than that of the code

1, p. Hence, as the jamming level increases, the Costas loop is the

first to lose lock. When this happens, the receiver enters the Hold-

On-By-Your-Teeth (HOBYT) mode, wherein it attempts to maintain code

lock, utilizing IMU data or, if an IMU is not available, AFC/Costas

data as an aid to code tracking. If the HOBYT mode fails to maintain

code lock, the receiver retreats to the reacquisition mode, as described

in Section 15. The jamming-to-signal ratio must return to a relatively

low value, less than 34 dB, (C/N >36 dB-Hz), before the reacquisition

mode will be successful [1,3].

If there is no IMU, when Costas loss-of-lock is sensed the AFC/

Costas loop is enabled*. The receiver operates in this mode until

loss-of-lock is indicated for the AFC/Costas loop. When AFC/Costas

lock is lost then the receiver attempts to reacquire the signal.

If IMU data is available, when Costas loss-of-lock is sensed and

the C/N estimate is between 14 and 24 dB-Hz the Costas loop is dis-

abled and the IMU is used to aid the code loop. IMU aiding is imple-

mented by turning off the inputs to the carrier loop filter and stuf-

fing the reformated line-of-sight acceleration and velocity data (from

the IMU via the data processor) into the appropriate integration re-

gisters in the carrier loop filter. As before, the output of the car-

rier loop filter is used to aid the code loop. When the C/N estimate

is less than 14 dB-Hz the receiver starts a reacquisition process for

that satellite signal.

The detailed criteria for entering and exiting from the various

HOBYT configurations are specified in Figure 14 of reference [3].

*See footnote on page 32.

47

—* '—' *•• -••"•"•••tl Mil« I 1

Section 8. Initial Acquisition Procedure

There are two methods by which a satellite signal may be acquired.

In the normal acquisition mode the X-set receiver first acquires and

tracks the Coarse/Acquisition (C/A) signal then switches to track the

Precision (P) signal. The second acquisition method, called direct ac-

quisition, acquires the P signal directly. Since the period of the P

signal is very long (approximately 267 days) and the chip duration is

very short (approximately 100 ns), direct acquisition requires precise

knowledge of system time to within 1 second and a good estimate of the

receiver velocity. On the other hand, because the C/A code has a short

period (1 ms) and a long chip length dps), normal acquisition doesn't

require apriori knowledge of system time or an estimate of receiver

velocity.

The operations performed for normal acquisition are shown in Fi-

gure 21. Each of these operations is described in detail in other sec-

tions and will be discussed only briefly here. First the sequential

detector uses all available channels (for the first signal to be ac-

quired the code channel and all four carrier channels are used so that

the average acquisition time is reduced by a factor of 5) to perform

simultaneous code and frequency correlations (and incoherent power de-

tections) using a single code delayed by different amounts. This pro-

cedure is repeated with different trial code delays and frequency es-

timates until substantial power is detected. Then one receiver chan-

nel concentrates on acquiring this signal while the remaining channels

search for the next signal. A Noncoherent Frequency-Locked Loop (NFLL)

pulls the frequency to within the range of the AFC/Costas loop, while

a Noncoherent Delay-Locked Loop (NDLL) attempts to track the code de-

lay. After 1 second the frequency and code pull-in mode switches to

a frequency and code tracking mode. AFC/Costas loops and a NDLL are

employed in this mode. When the carrier estimate is within the Costas

loop range the AFC portion of the loop is disabled and the third-order

Costas loop* and NDLL are used to track carrier phase and code delay,

respectively. When Costas lock has been achieved the user-time clock

is synchronized to the incoming data bits. (The user-time clock con-

trols all of the receiver sampling and resets the integrators in the

*See footnote on page 32,

48

I^fthdb . *.

• • •iiim^—wp—

CODE SEARCH (SEQUENTIAL DETECTOR)

FREQUENCY AND CODE PULL-IN /NONCOHERENT FREQUENCY-LOCKED AND) NONCOHERENT DELAY-LOCKED LOOPS /

FREQUENCY AND CODE TRACK f AFC/COSTAS AND NONCOHERENT! \DE LAY-LOCKED LOOPS /

PHASE AND CODE TRACK . /COSTAS AND NONCOHERENT] \DELAY-LOCKED LOOPS )

DATA BIT SYNCHRONIZATION

DATA DEMODUATION

DATA FRAME SYNCHRONIZATION

HANDOVER FROM C/A TO P CODE

Figure 21. X-Set Acquisition Procedure for A Single Channel From References [1,3]

49

tfaflttttiiiiüttM r»* •--"•"- - - — ^•fctfifa iüäw .im

integrate-and-dump circuits). Next the process controller demodulates

the data and identifies the next frame received. Using the received

data, the handover function from the C/A signal to the P signal is

initiated.

50

•••.mi i "i'ihinitiriri'it>»>

Section 9. C/A Code Search

The C/A code search in the X-set is performed by the sequential

detector. The sequential detector searchs in both time and frequency.

A uniform-time distribution and a Gaussian-frequency distribution are

assumed. The frequency search is centered about the pseudo-range rate

estimate provided by the data processor. The magnitudes of the time

and frequency uncertainties are also provided by the data processor.

For initial C/A acquisition, these values are 1 ms and 800 Hz (l-o),

respectively.

The sequential detector performs a maximum-likelihood-ratio test

on an approximation of the envelope of the received signal correlated

with the current code and frequency settings. There are three regions

in the ratio test; rejection, acceptance, and continue regions. If

after a fixed number of samples, 128, the current code and frequency

settings have not been rejected, the sequential detector assumes that

the signal-envelope estimate is within the acceptance region. A func-

tional block diagram of the sequential detector is shown in Figure 22.

The inputs to the sequential detector are the one-millisecond inphase

and quadrature samples, I. and Q. , respectively. The envelope of the

correlated signal is approximated by

env = 11. | + |Q. I (16)

A bias is subtracted from the envelope approximation. The difference

is accumulated, and after each sample the accumulation is compared with

the rejection threshold. (As of this writing, the rejection threshold

has not been determined). If the accumulation is below the rejection

threshold the current code setting is rejected. The desired average

number of samples N accumulated prior to rejecting a code setting is

ten. If the current number of samples differs from this desired aver-

age by more than 25% the gain of the automatic gain control circuitry

is appropriately increased or de< reased by 1 dB. If this is not the

case, a new bias value is determined. The new bias value is determined

in the following manner

bias = bias + (N-10)/8 (17)

Where N is the current number of samples taken prior to dismissal. N is

then set to one and the contents of the accumulator zeroed. The code

51

' ' •••"•• IM I • I HI I 11.^^^^ •"

r\ n

</> Ul Z > t

+ z

r\ Z <o

A co

w

!

z

co *z uj0u.

to 00 •D -O

1 + fS. Z z o < 4 ^

in u o I

CM CO H II Ul Z

A > z z > + CO < o < <

i o o CD Z

o o

A V z z u. u.

CO < s

O Z

J 21

Q- Ul

X 0 CC 3 4

Z CM CC »- ^ a. CO cc < Ul O Ul > 4 CC

I CO

u Z Ul

Ul Z Ul O Ul

X a 3 O CC

> 3 O Ul CC E

Q X £ O t- Ul U co Z Ul CO Ul

3 u < z a. < u. a. > G <

O a z Ul

i

u CO OJ ft Q.<*> O ft

.-1

£ 1—1

u SJ en m OJ 0) Ü w C

OJ OJ n Tl Ü) 0 u-i u OJ

CC •p OJ 1 Cfi 0

1 ^ X 1».

CN (N

OJ V4 3 0>

i s 8

52

IritttfilllliMiiittiaH

wmmmmmam»

generator is then advanced by 1/2 a chip. After the sequential detec-

tor advances the code generator, it determines whether it has completed

a pass through the time aperature. If it has, a new frequency estimate

is computed and the process is repeated with the new frequency and code

estimates. If not, the process is repeated with the current frequency

estimate and the new code estimate.

However if the accumulation of the envelope estimates minus bias

terms is greater than the rejection threshold, the number of samples in

the accumulation is tested to see if it is less than the maximum number

of samples, N„„ = 128, that must be taken before code acquisition is max * tentatively declared. If N is less than 128, N is incremented and the

process continues. If not, tentative code acquisition is declared and

the receiver enters the Pull-In mode.

53

n i rvnii^iinMfcuii r— •

———~ - -••

Section 10. Pull-in Mode

After the sequential detector tentatively declares that the code

has been found, the X-set receiver enters the Pull-in mode. In this

mode the receiver attempts to pull the frequency within the range of

the AFC/Costas loop and to pull-in the code. The noncoherent delay-

locked loop previously discussed is used for code pull-in. A first-

order Noncoherent Frequency-Locked Loop (NFLL) operating for a prede-

termined time interval, 1 second, is employed to generate an estimate

of the carrier frequency. At the end of the time interval the receiver

switches to the AFC/Costas loop and the AFC lock indicator is monitored.

If after 1 second the indicator fails to indicate lock, false code lock

is declared and the code search mode is reentered. However if AFC lock

is obtained, the AFC/Costas loop and the NDLL are used to track the fre-

quency and code, respectively.

The implementation of the NFLL and associated logic is shown in

functional block diagram form in Figure 23. The feedback signal is

alternately switched every 20 ms between

C(t--r)cos[(MF+450)2TTt]

and (18)

C (t-T) cos [ (MF-4 50) 2irt]

where MF is the frequency estimate of the NFLL. The one-millisecond

inphase and quadrature samples are used to form estimates, PU and PL,

of the power in the upper and lower frequencies. The next frequency

estimate is formed in the following manner

MFR = MF^j+CgtPU-PL) (19)

where C_=0.6 for the first four 40-ms samples and 0.2 thereafter. Then,

based upon the logic in Figure 23, the receiver decides to continue in

the pull-in mode, reenter the code search mode, or track the frequency

and code with the AFC/Costas loop and NDLL, respectively.

54

^:>....:'-' ^ - -•- . -•..,<•>-:.<«•• •>. , <••>"-»-• -«.-.....*.

c 1-1

I

OZ so u. U

I —

as 5; O z u. O

z a

uOI

III uzl Out

-#•

<« 1- o Z I- UJ U Si o1- tf) o 2

s 5 £8

ÜC

J

z Ik z

fl

/^V

^^

1 i •

fÄ - \ 0 z i3

z \ z t z ^ A /—» PS1

+ z - z SI

K3J

*

?L

3 G.

!

u S. u

>

I 01 w x c

(11

s I o o J I >,_ 0 m C » 01 ~-l 3 *- tr 01 (A l-i o> Du (J

e •U 0) c u oi o<

0) 01 £ OS o o e c o O K

<N

I 8

f* *- I

55

ftritti -- ••• MM

"'" ""'" " >~**!—mm*mmmmmmmtlKHm

Section 11. Data-Bit Synchronization

After Costas lock has been achieved the receiver synchronizes

the user-time clock to the incoming data bits. The NDLL is tracking

the C/A code which is synchronized to the data-bit transitions. How-

ever the C/A code repeats every one millisecond whereas data-bit tran-

sitions occur less frequently, every twenty milliseconds. Thus using

only information from the NDLL, the receiver can accurately locate the

data-bit transitions within a one-millisecond interval but is unable

to determine which of twenty possible one-millisecond intervals in

which the data-bit transition occurs. A histogram of the sum of the

sign reversals of the inphase samples of the received signal in each

of twenty one-millisecond time intervals is used to resolve this am-

biguity. One second of inphase samples (or equivalently fifty data

bits) is used to form the histogram. The sum of the sign reversals

in the one-millisecond interval which coincides with the data-bit tran-

sition must be larger than the sum in any other one-millisecond inter-

val by at least ten sign reversals. When this is true, data-bit syn-

chronization is declared. When data-bit synchronization has been de-

clared the user-time clock is appropriately advanced or delayed to

coincide with the data-bit transition. Then the integrate-and-dump

interval is set to four milliseconds. The receiver then enters the

data-frame synchronization mode.

If at any time during the data-bit synchronization process Costas

lock is lost, the procedure starts over.. This prevents cycle skipping

from being interpreted as data-bit transitions.

A flow diagram of the data-bit synchronization process is shown

in Figure 24.

56

""'"-"" .....^t^.j iji^pjun^pjffpBp^^^^iipump^puMiiiii """»nt^^wf

C ENTER J

•^ COSTAS >v N£>

V LOCK >*

FORM HISTORGRAM OF THE SUM OF THE SIGN REVERSALS OF lk FOR 20 1-ms INTERVALS

YES y< t< >v "m V istc >?

NO

1SUM

10 > THAN ANY OTHER

SUM

NO START OVER

(YES

DECLARE BIT SYNCHRONIZATION

SET USER TIME CLOCK

SET INTEGRATE-AND- OUMP INTERVAL TO 4 mi

Q DATA FRAME-SYNCHRONIZATION 3

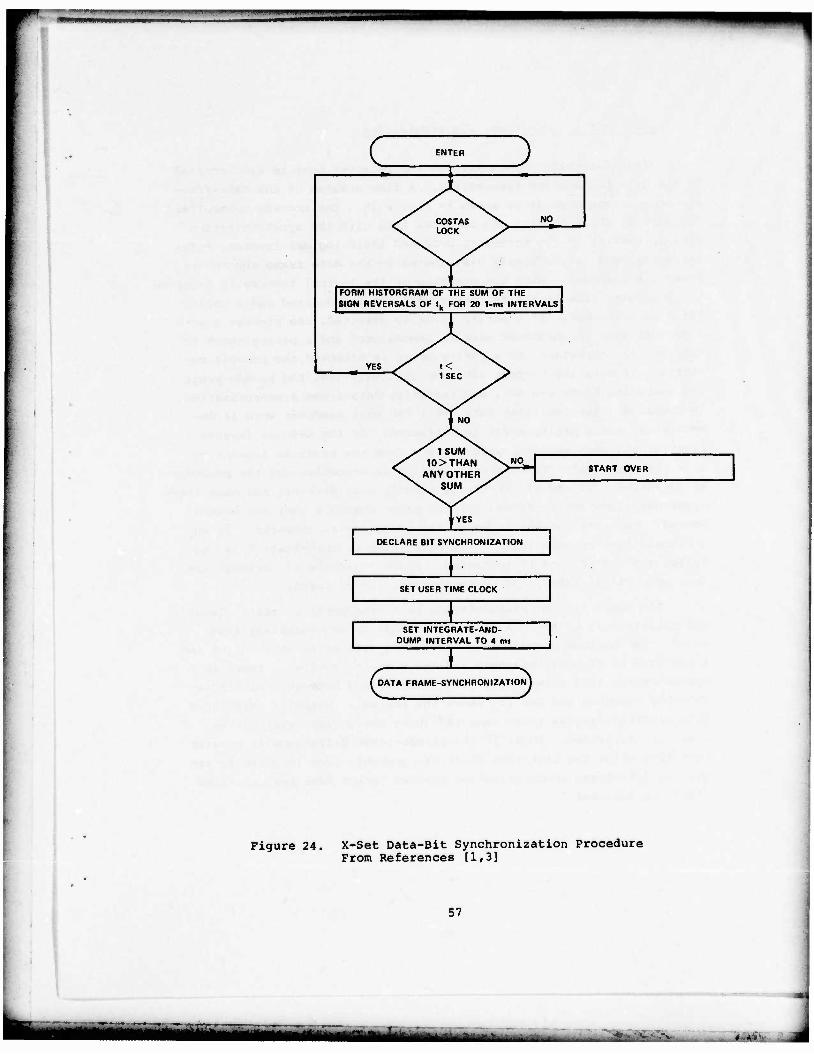
Figure 24. X-Set Data-Bit Synchronization Procedure From References [1,3]

57

-'•- ' -••••-

T "WTWWW JI.I-.I. it. ..•••..-•»....* -"• "»"""

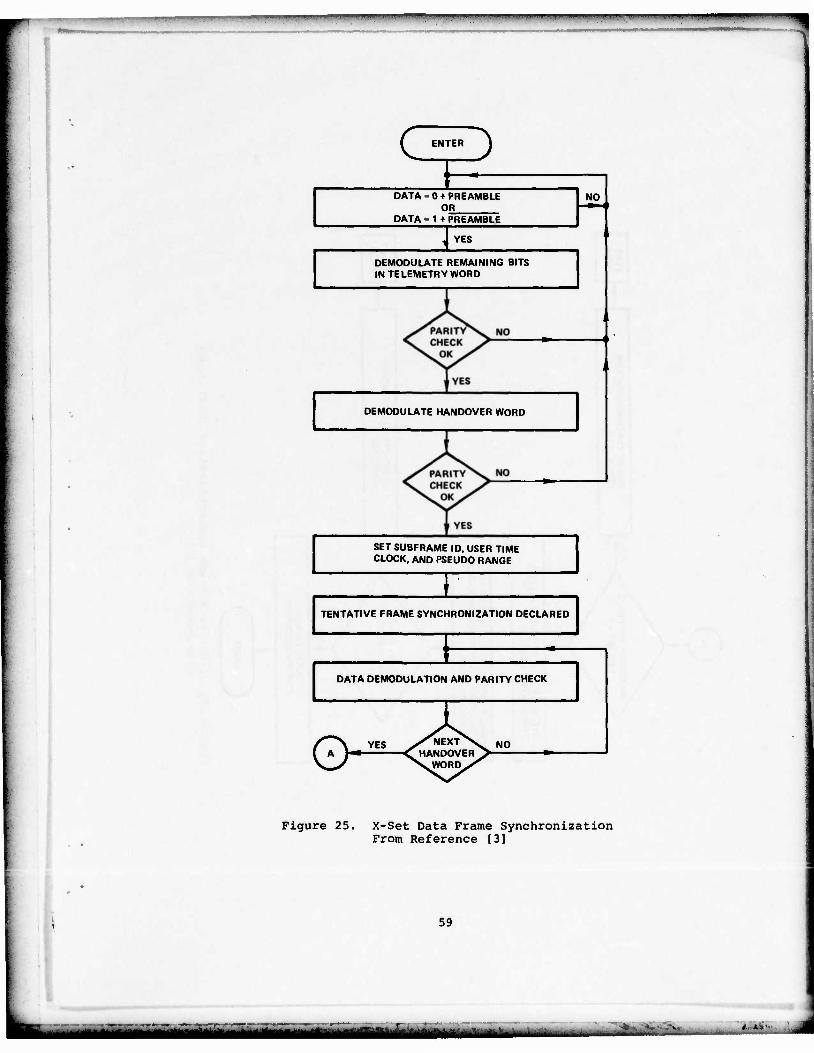
Section 12. Data-Frame Synchronization

After data-bit synchronization the receiver must be synchronized

to the data frame being transmitted. A flow diagram of the data-frame

synchronization process is shown in Figure 25. The process controller

demodulates the data bits and compares them with the synchronization

bits (preamble) of the telemetry word and their logical inverse. (The

telemetry word is uniformily distributed in the data frame and occurs

every six seconds). When the preamble or its logical inverse is detected

the remaining bits in the telemetry word are demodulated and a parity

check is performed. If a parity error is detected, the process starts

over. If not, the handover word is demodulated and a parity check is

made on it. As before, if a parity error is detected the process re-

starts. If not, the current subframe is identified, the pseudo-range

and user-time clock are set, and tentative data-frame synchronization

is declared. The remaining data until the next handover word is de-

modulated, and a parity check is performed. If the Z-count (system

time) of the next handover word differs from the previous Z-count by

more than one, data-frame synchronization is cancelled and the procedure

is restarted. If the difference is exactly one, data-bit and data-frame

synchronization are performed for the other channels that are Costas

locked. Then the pseudo-ranges of the channels are compared. If any

of them differ by more than 21 ms, data-frame synchronization is can-

celled and the process is restarted. However, if the differences are

less than 21 ms, data-frame synchronization is declared.

The comparison of pseudo-ranges is a reasonability test. Twenty-

one milliseconds of the C/A code corresponds to approximately 4000

miles. The maximum pseudo-range difference will exist when one of the

satellites is directly overhead and one near the horizon. There is

approximately 4 000 miles pseudo-range difference between a satellite

directly overhead and one 15° above the horizon. Normally satellites

with elevation angles lower than 15° above the horizon will not be

used for navigation. Thus, if the pseudo-range difference is greater

than 4 000 miles the user-time clock has probably been incorrectly set

and the data-frame synchronization process (which sets the user-time

clock) is repeated.

58

' '"• -•"•••*- «* • - •• '- -•-'--:

,.,**-,

,»w.il.»i.iimwm - in«--»»1".. IIIIMUIIII..I.ii ii. i .1.1. n. i. i. i j.i ii i ..ii.. i •• m .....ip.. in.. • • ii

( ENTER J

DATA - 0 + PREAMBLE OR

DATA = 1 +PREAMBLE

YES

DEMODULATE REMAINING BITS IN TELEMETRY WORD

DEMODULATE HANDOVER WORD

SET SUBFRAME ID, USER TIME CLOCK, AND PSEUDO RANGE

NO

TENTATIVE FRAME SYNCHRONIZATION DECLARED

DATA DEMODULATION AND PARITY CHECK

0 YES y^ NEXT \ NO A H"—— < HANDOVER

WORD.

Figure 25. X-Set Data Frame Synchronization From Reference [3]

59

riHtf* tllMlMll PJ^UMM.

&s 11 so O

z o •- < N z o cc X o _ 20

SlU So <z or < U. U

et oc u M O

ft»

z 0

— III

ui Z H H< < <K N So Z l-O O co 3 cc UI uj XV) 0 -1 U1& 2LU 2i >z 5»- 111 s CC » uj II 03z

°üJ5 OCK 3zS u. Ill tu 5 I

to

u,I»

< CC * a UJ u SK UOK

z 0 »- < N Z O CC z So uju, So <Z cc< UL U

» 1

111 >

r\

3 C

C 0 o

c o

•H •p a N

•r-l

a o u J= u c >1

CO ~ n

i cu u o

0) 10 )-i 4-> V IQ <H Q «

CC «J <u e

CO o I u X h

w . in

o M 3 D>

•H

60

-•*• «iff 1» M*

1 "• '•••''

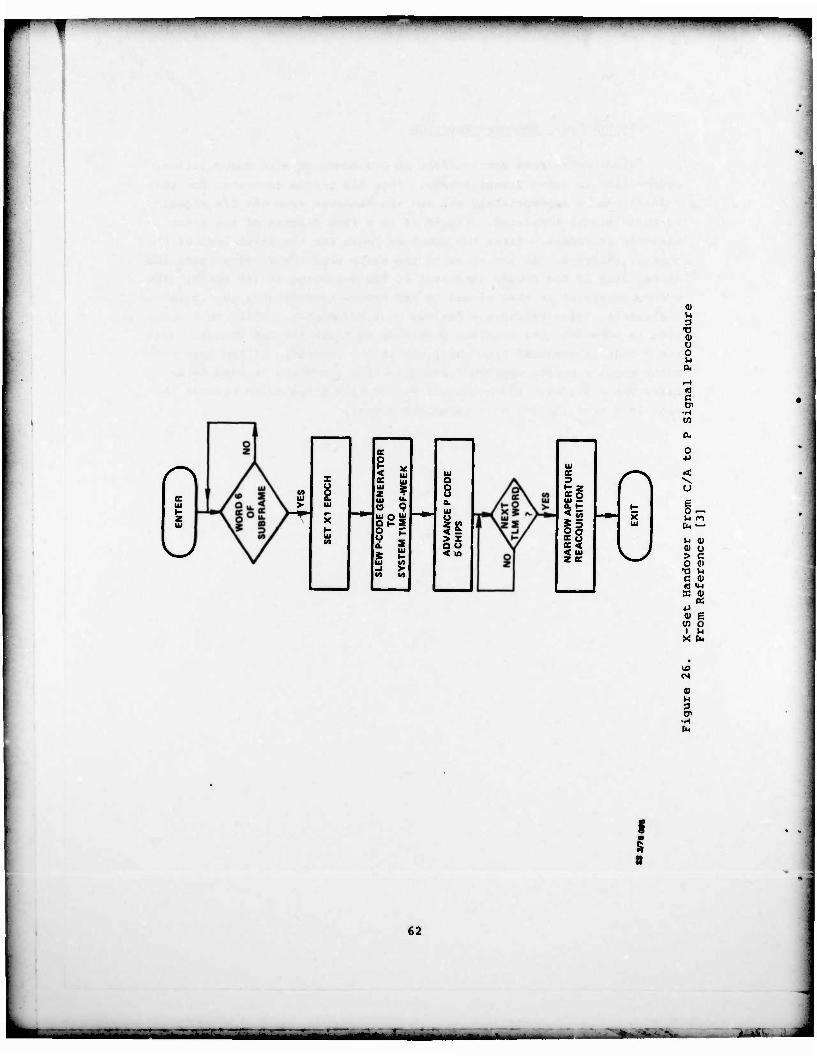
Section 13. Handover Function

After aata-frame synchronization and handover word demodulation,

system time is known unambiguously. Thus the P-code generator for that

channel can be appropriately set and the handover from the C/A signal

to the P signal completed. Figure 26 is a flow diagram of the X-set

handover procedure. First the receiver looks for the sixth word of the

current subframe. At the start of the sixth word the receiver sets the

XI register in the P-code generator at the beginning of its epoch. The

P-code generator is then slewed to the proper time-of-week in 1.5-second

increments. This requires a maximum of 1.62 seconds. While this opera-

tion is occuring, the receiver continues to track the C/A signal. Then

the P-code is advanced five chips and at the beginning of the next tele-

metry word, a narrow-aperature reacquisition procedure is used to ac-

quire the P signal. Advancing the P code five chips helps prevent the

code loop from locking on a multipath signal.

61

------ -r -~-~~r~—r -:--- - .. ' —

1 ' m

2 3

1

r\ oc UJ

\s

c o 5 £ UJ

X OC uj Q CO UJ

Q 2 1 *

UJ U.

O s a. Ul

if > Ul

OD

EG

TO

ri

ME

-O

X

I s > z o o s £ < in UJ U) -i > e» v>

Ul K 3 /^\ C Z K o a. f- »- «5 85 Ul Oo CCo <E < < Ul z ec <j

18 C

•H W

o

< u E o — U n tw —

4) > O

TJ C (U U-l £ Q)

K 41 o> e w o X En

S a

62

V 5 3

— - - -L-

1 " --^^mmmmmmm

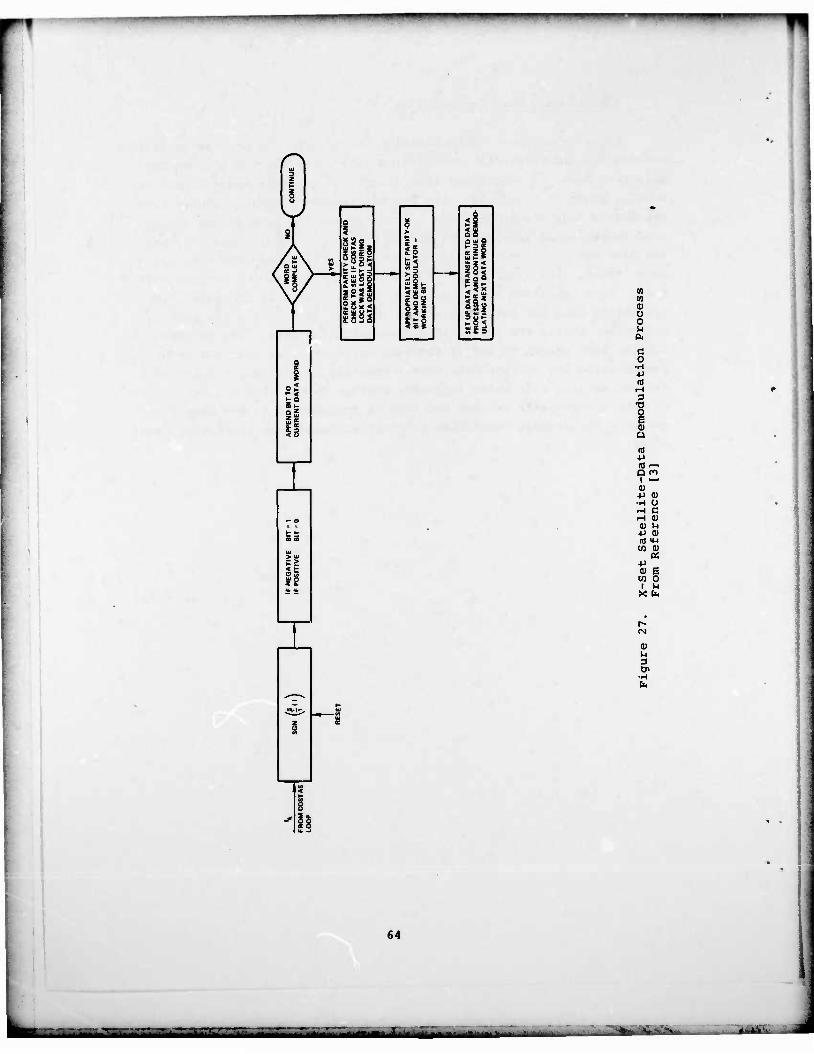
Section 14. Data Demodulation

After data-frame synchronization is complete the process controller

demodulates and reformats the incoming data words for transfer to the

data processor. A functional flow diagram of the data demodulation pro-

cess is shown in Figure 27. The four-millisecond inphase samples from

the Costas loop are summed over a data bit and the sign of the sum is

used to determine the incoming data bit. If the sum is negative then

the data bit is a "one" and if the sum is positive then the data bit

is a "zero". The last bit demodulated is appended to the current data

word. This operation continues until the data word is complete. There

are thirty bits per data word. When the word is complete the process

controller checks the parity of the current data word. The process con-

troller also checks to see if the receiver maintained Costas lock while

demodulating the current data word, Then the parity-okay bit and demo-

dulator working bit, which indicates whether Costas lock was maintained

or not, are properly set and the word is transferred to the data pro-

cessor. The process controller proceeds to demodulate subsequent data

words.

63

i^ „^^

F"f -,...J,.»,».»l|iMi..,HI»ipillUl.Ull|LI|ll| I II »II Uli« II. MMl. mil.l •• ll»l,lillUll|

PE

RF

OR

M P

AR

ITY

CH

EC

K A

ND

C

HE

CK T

O S

EE I

F C

OS

T A

S

LOC

K W

AS L

OS

T D

UR

ING

D

AT

A D

EM

OD

UL

AT

ION

5 >

H ii £ Q I

sr < u ft 8 < as 5

3*

Ui p> * ill 2«S < ° ~ ft y] C

ui S J v» a D

CO 10 a) o o M

c o

•H +J (0

rH 3

73 O § a) a

+J (8 ^- Q ro

4)

•* o rH C i-t <u Hi u 4J a) IQ "4-1

w Q> PS

+J a> E W O

64

* -:;:TL

11 "'•• mi» ' • •--' -• •—• •• -• i. .... i.... , I, .-, i I, i i n IPWPI——m

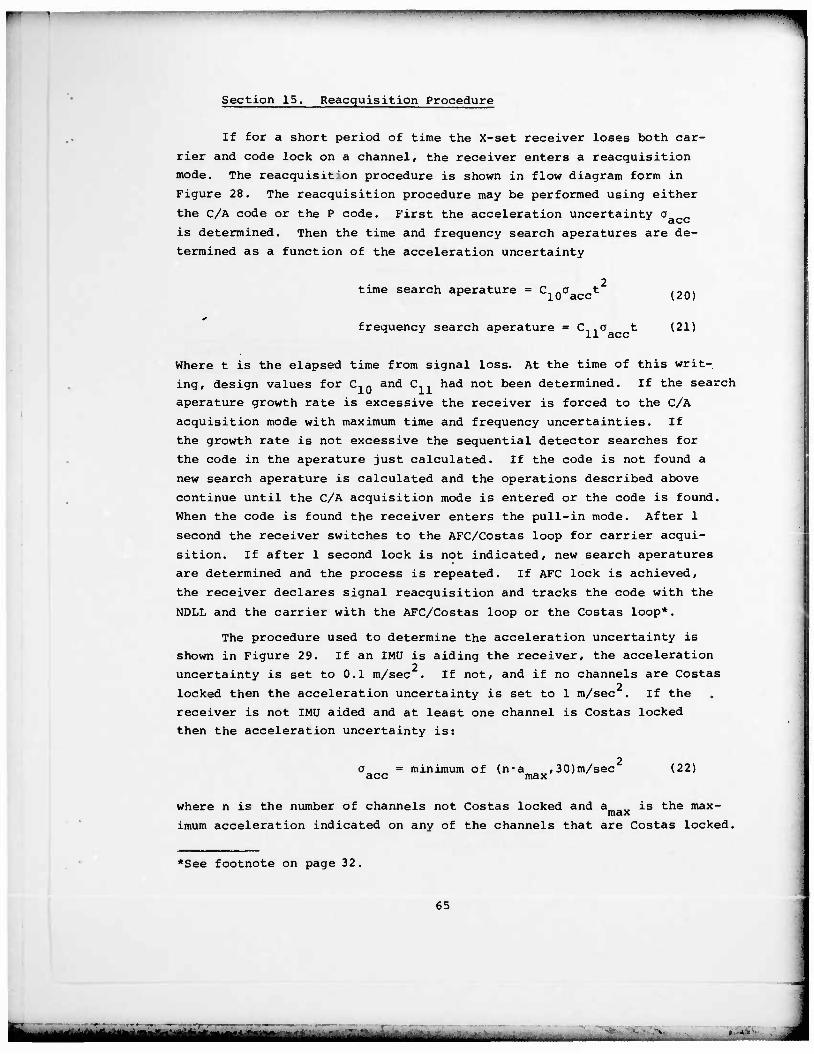
Section 15. Reacquisition Procedure

If for a short period of time the X-set receiver loses both car-

rier and code lock on a channel, the receiver enters a reacquisition

mode. The reacquisition procedure is shown in flow diagram form in

Figure 28. The reacquisition procedure may be performed using either

the C/A code or the P code. First the acceleration uncertainty a

is determined. Then the time and frequency search aperatures are de-

termined as a function of the acceleration uncertainty

2 time search aperature = Cn no___t X U aCC (20)

frequency search aperature = C..0 t (21) XX dCC

Where t is the elapsed time from signal loss. At the time of this writ-

ing, design values for C.0 and C] had not been determined. If the search

aperature growth rate is excessive the receiver is forced to the C/A

acquisition mode with maximum time and frequency uncertainties. If

the growth rate is not excessive the sequential detector searches for

the code in the aperature just calculated. If the code is not found a

new search aperature is calculated and the operations described above

continue until the C/A acquisition mode is entered or the code is found.

When the code is found the receiver enters the pull-in mode. After 1

second the receiver switches to the AFC/Costas loop for carrier acqui-

sition. If after 1 second lock is not indicated, new search aperatures

are determined and the process is repeated. If AFC lock is achieved,

the receiver declares signal reacquisition and tracks the code with the

NDLL and the carrier with the AFC/Costas loop or the Costas loop*.

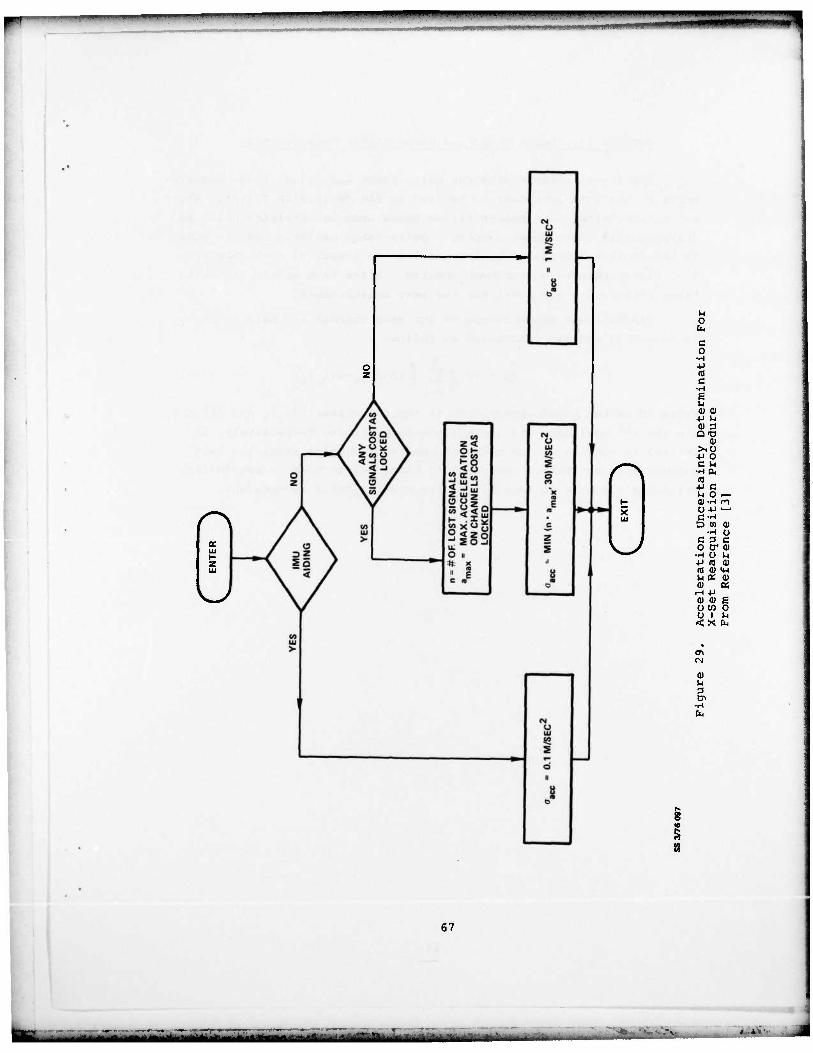
The procedure used to determine the acceleration uncertainty is

shown in Figure 29. If an IMU is aiding the receiver, the acceleration 2

uncertainty is set to 0.1 m/sec . If not, and if no channels are Costas 2

locked then the acceleration uncertainty is set to 1 m/sec . If the

receiver is not IMU aided and at least one channel is Costas locked

then the acceleration uncertainty is:

2 a _ = minimum of (n-a ,30)m/sec (22) ace max

where n is the number of channels not Costas locked and a .„ is the max- max imum acceleration indicated on any of the channels that are Costas locked.

*See footnote on page 32.

65

••"•••' --- -- :

- • L"" iwuiwiu wmmmmm.

r ENTER J

DETERMINE ACCELERATION UNCERTAINTY

"ace

TIME SEARCH APERTURE - C1(,oacet^

FREQUENCY SEARCH APERTURE = C,,»,,,.!

EXCESSIVE \. YES ^SEARCH APERTURE^

GROWTH

C/A ACQUISITION WITH MAXIMUM TIME AND FREQUENCY SEARCH APERTURES

SEQUENTIAL DETECTOR

NO

PULL-IN

AFC/COSTAS

NO

SS 3/76 086 C EX,T )

Figure 28. X-Set Reacquisition Procedure From Reference [3]

66

m hut m riiiilr —*•*—"• ••--• - ' •' -1' -—%r- - " -•

III. Ill, "•'" ' • '"" "" '»•'••• .1 I • J nm^WaWJI II I III! I II I

1,1 '•" •

i

r\ UJ

w

l^\

UJ

w

C o

•H •U (0 c

<D 0)

<D 3 DTI

0 >iU 4J O C U

•H 0< 10 4J C M O — <U-H n O -H —' C-H O to 4>

Ü 3 C er <u u ^ m <u

u « <u 0) K

rH JJ a) a) o w o I <x

c o

•H

§ M

CM

ai M 3

67

Sfc. •*-" •-' —*-••- -"-^"t"—-*-.~^-«-».*~-i Ml

r Section 16. Delta-Range and Pseudo-Range Measurements

The X-set receiver provides delta-range and pseudo-range measure-

ments to the data processor to be used in the navigation filter. The

navigation filter is a Kaiman filter based upon uncorrelated noise and

statistically independent samples. Delta-range measurements are made

in the process controller by integrating the output of each carrier

loop filter between measurement updates. After each update the delta-

range integrators are reset for the next measurements.

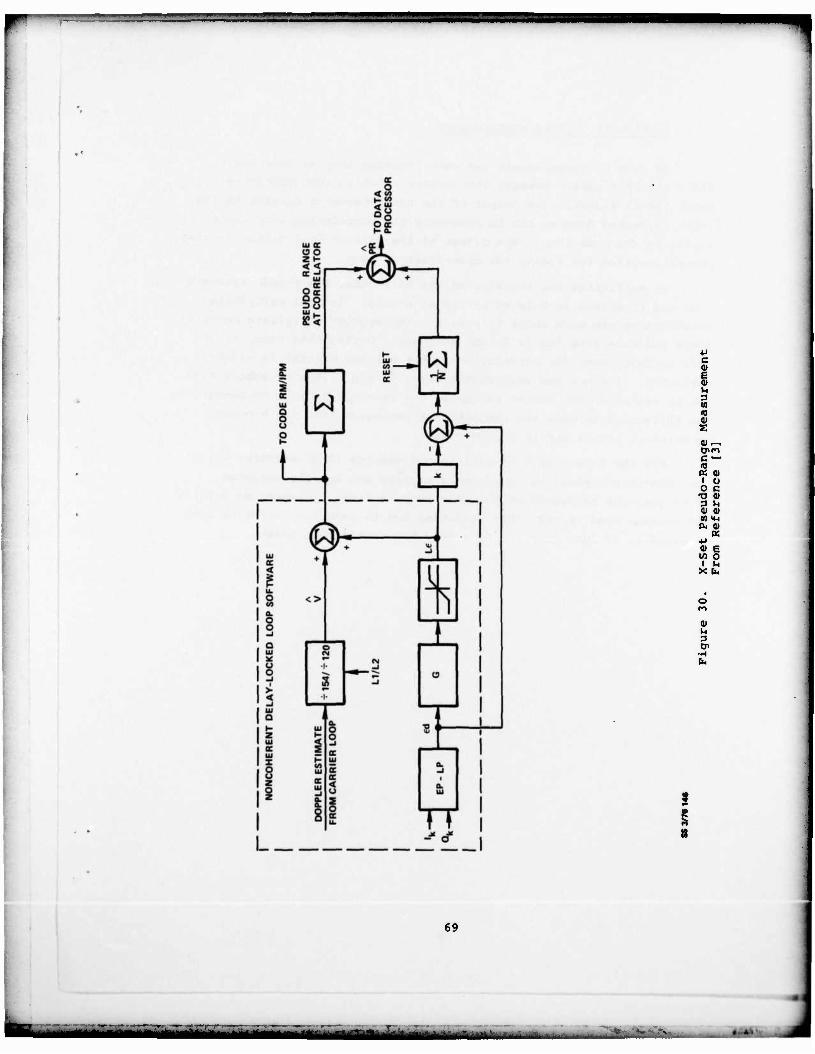
Pseudo-range-measurements PR for each channel are made as shown

in Figure 30 and are calculated as follows

^ 1Ä r -i PR = PR+i 2- Pp-Lp)k"lc(Le)k (23)

k=l J

where PR is the pseudo-range seen at the^correlator, (L )k and (EP-LP)^

are the ktn nonlinear and linear code-loop errors, respectively, de-

scribed in section 6, and N is the number of samples since the last

pseudo-range estimate. According to Magnavox, successive pseudo-range

estimates computed in this manner are statistically independent.

68

— -•

" " • - • • - • ••' = •mm as 7

i Dirt C — «J CC HI I o o c

"O 0) 3 VH O 0) (0 «H

EC

<U E w o

o m

0)

69

bk .i^li-T -••-^-^—•-' ---^ ' ••

gg^g?; IM imm^mmmm

Section 17. L1-L2 Measurements

To make L2 measurements the code tracking loop is switched to

track the L2 signal. However the carrier-tracking loop continues to

track the Ll signal. The output of the code channel's carrier RM/IPM

(VCO) is scaled down to the L2 frequency for correlation with the L2

signal in the code loop. The output of the carrier loop filter is also

properly scaled for aiding the code-tracking loop.

To initialize the tracking of the L2 P code, the P-code estimate

from the Ll signal is delayed by 1/2 of a chip. Initial early/late

measurements are made about this point. Subsequent early/late measure-

ments are made from the L2 P-code estimate. During this time, the Ll

code estimate used for correlation in the carrier channel is slightly

perturbed. The maximum perturbation is + j chip. Thus by subtracting

the L2 estimate from the Ll estimate, the receiver is able to measure

the difference between the pseudo-range estimates from the P codes

received on the Ll and L2 frequencies.

For the first 160 four-millisecond samples (0.64 seconds) all of

the code-loop inphase and quadrature samples are equally weighted.

After that the bandwidth of the code loop is fixed. However as before,

the maximum code RM/IPM (VCO) variation due to code loop error is con-

strained to be less than 1/4 of a chip per measurement update.

70

^^*—•-»- M*h

I i mipw^p^p I».»IP mmm pim.i.i .•^••. ••». ^».u j u , .. m. m mini ^^^w 1 I •! • I W MUMHPVniHHMMPBP

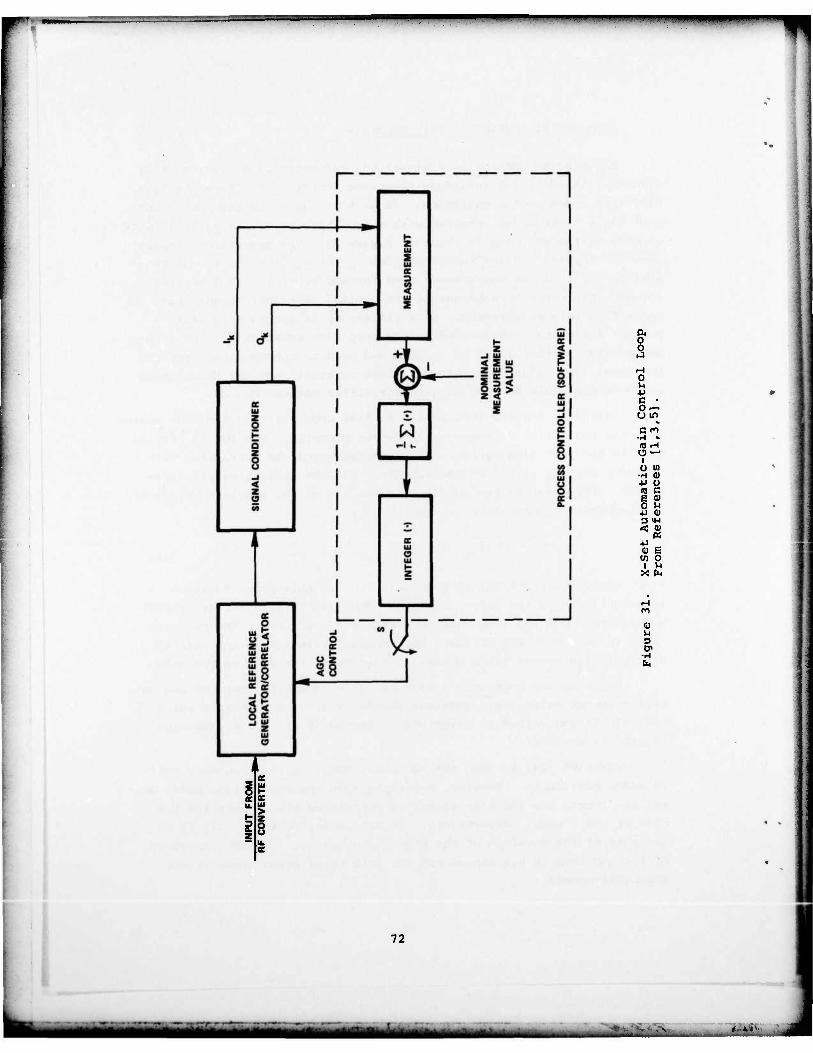
Section 18. Automatic Gain Control

The process controller controls the Automatic Gain Control (AGO

circuitry in the local reference generator/correlator. There are five

different modes of AGC operation. In each of the modes the AGC adjust-

ment has a first-order response with a 1 dB resolution. A general block

diagram of the AGC loop is shown in Figure 31. The process controller

uses the inphase and quadrature samples I. and Q from the signal con-

ditioner to form the measurement used for AGC control. It generates

the AGC loop error by subtracting the nominal (desired) measurement

value from this measurement. This difference is accumulated as in a

perfect integrator and divided by the loop time constant T. The inte-

ger portion of this value is sampled and used to appropriately set the

AGC gain. Tha adjustment interval, time constant, and the measurement

which is the basis for AGC adjustments differ between modes.

Initially the AGC must be set so that upon entering the code search

mode the sequential detector will operate properly. The AGC is initial-

ized in the following manner. The incoming signal is correlated with

a random setting of the P-code generator and the nominal carrier fre-

quency. The input to the AGC loop is the sum of the absolute values of

the inphase and quadrature samples, i.e.,

|iL + |Q|, (24)

Since there is no attempt at code alignment in this mode, Equation 24

is an estimate of the noise envelope. The gain is adjusted every four

milliseconds and the loop time constant is 0.2 seconds. The receiver

stays in this mode for at least one second. This allows the gain to

settle to its proper value before proceeding to the code search mode.

While in the code-search mode the gain is set so that the sequen-

tial detector maintains a constant search rate. The manner in which

the gain is controlled is described in Section 9 which discusses the

sequential detector.

Equation (24) is also the AGC measurement in the frequency pull-

in mode, Section 10. However, depending upon the acquisition mode, nor-

mal or direct, the incoming signal is correlated with either the C/A

code or the P code, respectively. In this mode, Equation (24) is an

estimate of the envelope of the signal plus noise:. The time constant

of the AGC loop is 0.1 second and the gain is adjusted every thirty-

two milliseconds.

71

—^---^- -' • •- -• ,-v .Mtik.

m

a o o

o u •p c •

C M •ri -

I o CO

•H ai *J o gg 0 M •P 4)

-»I •8 <?2 X fa

a> u

•rl

1 I

I

Ul t-

UJ >

72

. •-. • ."v.

There are two cases to consider when the carrier and code are be-

ing tracked. In the first case, the auton,?tic-frequency-control loop

is locked to the incoming signal but the Costas loop is not. Then

Equation (24) is again the AGC loop input. If Costas lock has been

achieved, gain settings are determined from the absolute value of the

inphase samples, which are coherent estimates of the signal amplitude.

In both cases the gain is adjusted every four milliseconds and the AGC

time constant is one second. Except when L2 measurements are being

made, the AGC setting of the code channel is the same as the AGC set-

ting of the carrier channel associated with the current code-error mea-

surement. When L2 is being measured the code channel AGC is set 3 dB

above the associated carrier channel AGC. (The L2 transmitted power

is 3 dB less than the Ll transmitted power).

When the receiver is not locked on the carrier and IMU aiding is

available, the AGC loop input is narrow-band power (NBP) minus wide-

band power (WBP) where:

\2 I, NBP=[£

\k=l *)HH and

WBP •i fr * °*)

(25)

(26)

The AGC loop time constant is ten seconds and the gain setting is ad-

justed every forty milliseconds.

73

mm* • — • • —n... —. *iifriiii

Section 19. List of References

1. Briefing charts presented at the NAVSTAR Global Positioning

System Phase I Set X Unaided Critical Design Review, Magnavox

Research Laboratory, 22-23 October 1975.

2. Rough draft of the "Computer program Development Specification

for the Set X Signal Processing Software X-SPS of the NAVSTAR

GPS User Equipment Segment Phase I", CP-US-300, 24 October 1975,

Received from J. Luse of SAMSO 10 February 197 6.

3. Draft of the "Prime Item Development Specification for the GPS

X-Receiver of the NAVSTAR GPS User Equipment Segment Phase 1,"

CID-US-101, 23 June 1975. Included as appendices are the fol-

lowing. "Simulation of the GPS Delay-Lock Receiver with IMU

Aiding," C.R. Cahn, MRL Reference No. MX-TM-3176-75. "Threshold

Reduction of GPS Receiver by IMU Aiding," C.R. Cahn, MRL Re-

ference No. MX-TM-3175-75. "Alert Algorithm Design Specifica-

tion," D. Knight, Magnavox Design Bulletin No. 0-15. "A Com-

posite AFC/Costas Loop for Transition Between Frequency and

Phase Tracking," C.R. Cahn, MRL Reference No. MX-TM-3165-75.

"Sequential Detectio ""est for GPS C/A Acquisition," D. Leimer,

MRL Reference No. MX-TM-3166-75. "Acquisition Time and Search

Strategy for the GPS C/A - Signal Tnitial Acquisition," T. Tilk,

MRL Interoffice Communications.

4. "A Proposal to SAMSO/JPO for the NAVSTAR Global Positioning Sys-

tem User System Segment," Vol. 2., General Dynamics, 12 June 1974.

5. Technical discussions with the GPS JPO and Aerospace Inc., 17-19

February 1976. Arranged by J. Luse of SAMSO.

6. Technical discussions with the GPS JPO and Aerospace Inc., 24

and 25 May 1976. Arranged by J. Luse of SAMSO.

7. Technical discussions with the GPS JPO, Aerospace Inc., and

Magnavox Research Laboratory, 20-22 June 1976.

8. J. Luse, "X-Set Functional Description," letter to William

Stonestreet, 19 October 1976.

74

^ k *-. • *•_


Recommended