SDAC-TR-77-12 THE'- ''LEVEL~ THE EFFECTS OF SPALL ON mb AND M O6 C i P.A. SOBEL Seismic Data Analysis Center Tel dyne Geotech; 314 Montgomery Street, Alexandria Virginia 22314 04 APRIL 197 __APPROVED FOR PUBLIC RELEASE: DISTRIBUTION UNLIMITED. - Sponsored by Thb Defense Advanced Reseatli. Projects Agency (DARPA) ARPA Order No. 2551 Monitored By AFTAC/VSC 312 Mcntgamery Street, Alemsndria. Virginia 2234 ... V, ,p
Transcript
SDAC-TR-77-12
THE'- ''LEVEL~THE EFFECTS OF SPALL ON
mb AND M O6
C iP.A. SOBEL
Seismic Data Analysis Center
Tel dyne Geotech; 314 Montgomery Street, Alexandria Virginia 22314
04 APRIL 197
__APPROVED FOR PUBLIC RELEASE: DISTRIBUTION UNLIMITED.
Unc la-s i fiedSECURITY CLASSIFICATION OF THIS PAGE(W%?on Date 1nto,-,
from near-field measurements of uphole time and spall observations fur 47 ex-
plosions. Spall energit:i; i,, ltiv to . xp'o ;iun energies were (;timated as-suming that a single spall closure w; responsible for most observed surfacedisplacements. Some calculated spall energies were larger than the explosionenergy entering the spall region, suqggesting that the method for calculatingspall energy is in error. Relat ive spall energies compared to explosion
energies foi 42 NTS explosions located below the water table show no relation-ship to Ms residuals or strain release . Subsurface vertical accelerometer re-cords show that spall energy is divided among several closures over a range ofdepths, the deeper formations closinq before the shallower layers. The large
observed spall pulses are due to closures closest to the gauge. The principalerror in the spall energy calculations %,as, therefore, the assumption that the
first spall closure contained most. of the spall energy. The total spallenergy, the sum of many spall closures, is probably much smaller than the spallenergy calculated for a single spal closure. The subsurface accelerometer
data show little, if any, spall energy leaving the source region, suggestingthat spall has little effect on mb and M, at teleseismic distances.
Unclassi fied
St CuPITY CL ASIF'ICATION OF THIS PAGE(l't-, le.ft FWf-,.d
THE EFFECTS OF SPALL ON Mlb AND M.
SEiSMIC DATA ANALYSIS CENTE'R REPORT No.: SDAC-TR-77-12
AFTAC Project Authiori~at ion No.: VELA T/8709/B/ETR
Project Title: Seismic Data Analysis Center
ARPA order No.: 2)51
Name of' Contractor : 1'EI)YNE (;EOTECH
Contract No.: F086O6- 78-C-000 7
Date of Contract: 0] October 1977
Amount of' Contract: $2,674,245
(:ontract Expirat ion lXit c: 30 September 1978
Pro ject Manager: 1?obert R. Bland ford( 70 1) 8 16- 3882
'IP. 0). Box 114, AMe.iidr ii, Vi rcln Li 223115
APPROVED FOR PUBLIC RELEASE; DISTRIBUTION UNLIMITED.
X1 t I~ o -
IsI
ABSTRACT
This study examines near-field observations of spalling, a phenomenon
associated with most underground nuclear explosions, and attempts to esti-
mate its effects on mb and Ms . Observations of spall on near-field accel-
erometers and particle velocity records were used to examine possible re-
lationships between radius of spallation, estimated spall thickness, max-
imum height attained by spall at the surface, shot depth of burial, and
yield.
Estimates of pP-P and P SPALL-P at teleseismic distances were calculatel
from near-field measurements of uphole time and spall observations for 47
explosions. Spall energies relative to explosion energies were estimated
assuming that a single spall closure was responsible for most of the observ-
ed surface displacements. Some calculated spall energies were larger than
the explosion energy entering the spall region, suggesting that the method
for calculating spall energy is in error. Relative spall energies compared
to explosion energies for 42 NTS explosions located below the water table
show no relationship to M residuals or strain release. Subsurface verti-s
cal accelerometer records show that spall energy is divided among several
closures over a range of depths, the deeper formations closing before the
shallower layers. The large observed spall pulses are due to closures
closest to the gauge. The principal error in the spall energy calculations
was, therefore, the assumption that the first spall closure contained rmst
of the spall energy. The total spall energy, the sum of many spall closure ;,
is probably much smaller than tht ;pall energy calculated for a single spall
closure. The subsurface accelerometer data show little, if any, spall
energy leaving the source region, suggesting that sp~ll has little effect
on mb and Ms at teleseismic distances.
A
-2-
AI.
-W A
TABLE OF CONTENTS
Page
ABSTRACT 2
LIST OF FIGURES 4
LIST OF TABLES 5
INTRODUCTION 7
NEAR-FIELD MEASUREMENTS OF SPALL 8
ESTIMATES OF SPALL PARAMETERS 16
ESTIMATES OF TELESEISMIC pP AND PSPALL 32
ARRIVAL TIMES FROM NEAR-FIELD DATA
SPALL ENERGY AND ITS EFFECTS ON mb AND M 35
CONCLUSIONS 51
ACKNOWLEDGEMENTS
REFERENCES 54
APPENDIX - Surface Particle Velocity Data A-I
S"•3-
LIST OF FIGURES
Figure No. Title Page
I Generation of a spall by a compressional stress wave. 9
2 Direct ray and spall pulse recorded at the surface near 10
an explosion.
3 Variation of maximum height of projection of spall layer (s) 11
vs. range (5).
4 Surface accelerometer, particle velocity and displacement 13
data at various horizontal distances from the shot holefor the Aleutian Islands explosion MLLROW.
5 Thickness of spall vs. yield. 19
6 Effective spall thickness (corrected to 122 mkt-1 /3) vs. 20
yield.
7 Scaled spall thickness vs. scaled shot depth of burial. 21
8 Spall thickness vs. shot depth of burial. 22
9 Radius of spallation vs. yield. 23
10 Scaled spall radius vs. scaled shot depth of burial. 24
11 S (maximum height attained by spall) observed near the 25max
source vs. scaled shot depth of burial.
212 S calculated from (At) g/ 8 vs. scaled shot depth of 26
buri.al.
13 S observed near the source vs. yield. 27max
14 Spall radius vs. spall thickness. 28
15 Energy vs. range for five spall closures. 36
16 Yield vs. radius of maximum spall energy. 37
17 Energy vs. time for spall closure. 38
18 Spall energy/explosion energy vs. yield. 41
19 M residual vs. spall energy/explosion energy for 42 NTS 43
explosions located below the water table.
-4
1A
LIST OF FIGURES (continued)
Figure No. Title Page
20 Subsurface vertical accelerometer array data for RAINIER 46
(Eisler, Chilton and Sauer, 1966).
21 Subsurface vertical accelerometer array data for GNOME 47(Weart, 1962).
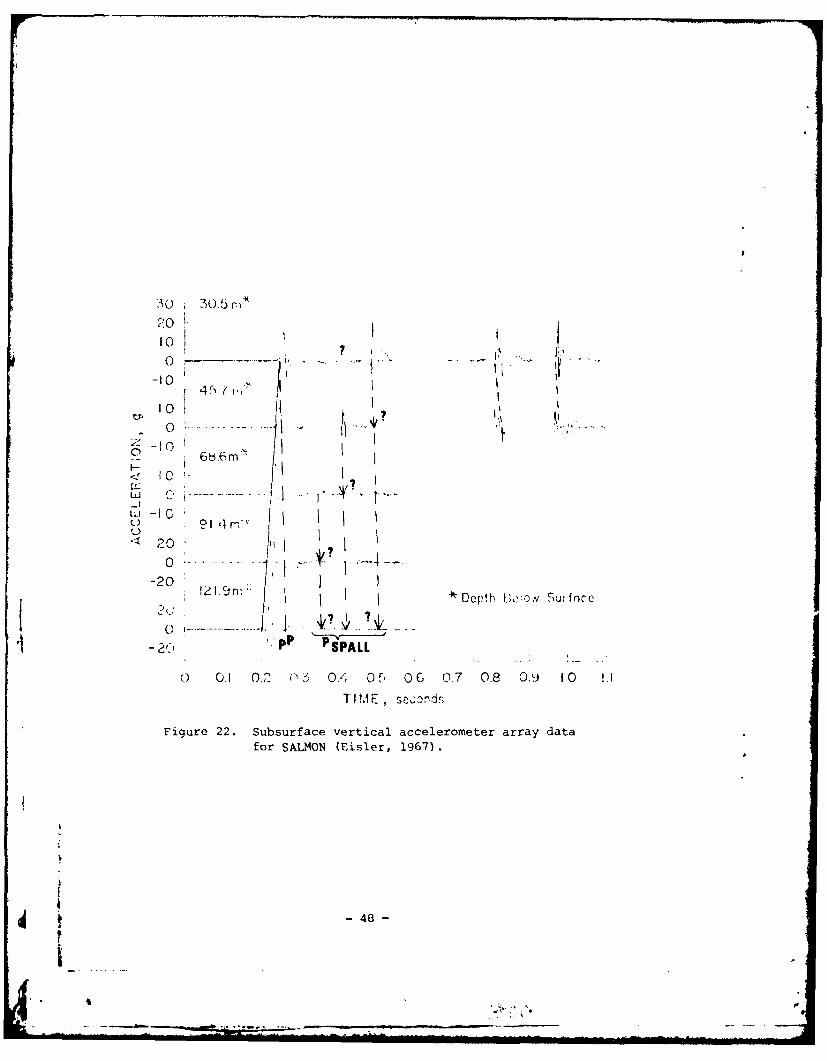
22 Subsurface vertical accelerometer array data for SALMON 48(Eisler, 1967).
23 Subsurface vertical accelerometer array data for MILROW 49(Perret and Breding, 1972).
'5
* . . * Z . .. . ... " : - "sw .. .. ° _
LIST OF TABLES
Table No. Title Page
I Spall parameters. 29
II Teleseismic pP-P and P SPALL-P estimates. 33
III Spall energies. 40
IV Explosion energies from Perret (1972) and from Perret's 44
efficiency estimates for the explosion medium.
Vt
-6- Li'" =
INTRODUCTION
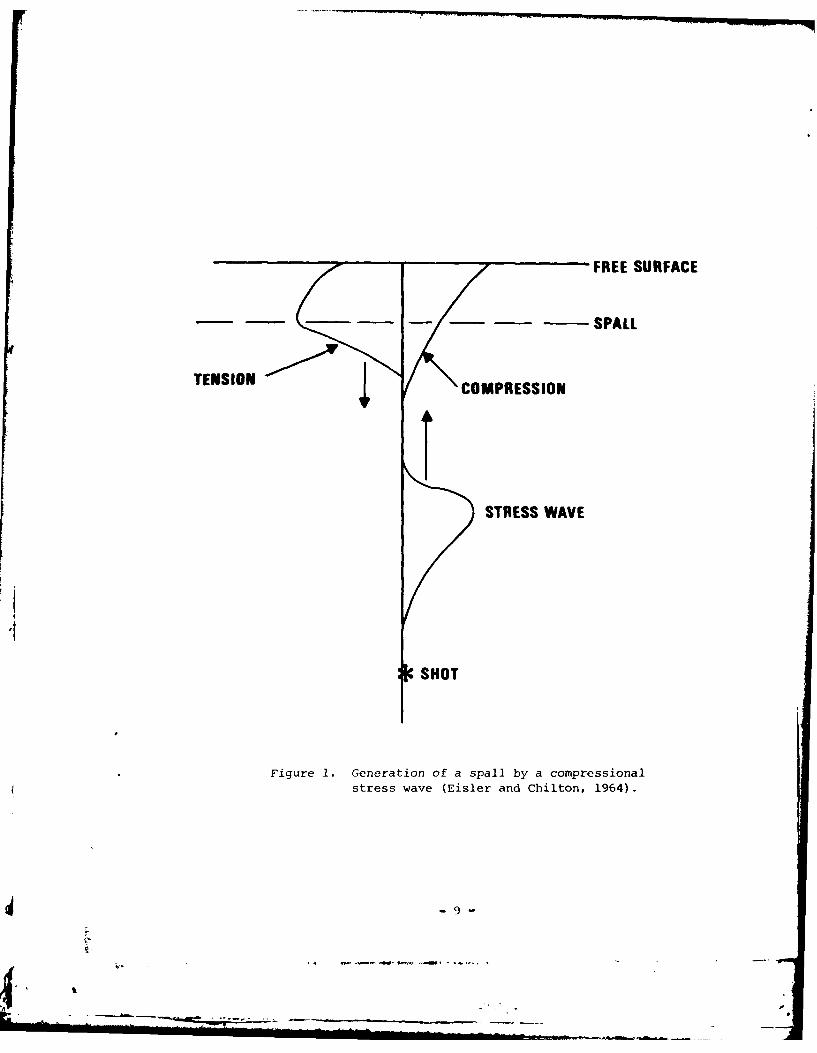
Spalling is a phenomenon associated with most underground nuclear explo-
sions. The compressional stress wave leaving the source is reflected at the
Earth's surface and travels downward as a tensile stress wave. Where tensile
stress exceeds compressive stress remaining in the upward travelling wave,
plus stress due to the overburden and tensile strength of the rock, near-
surface layers will physically part (Figure 1). The impact during closure of
the spall gap produces a signal observed on near-field instruments. The
purpose of this study is to estimate the effect, if any, of spall on tele-
seismic mb and Ms measurements.
Estimated spall depth, spall radius, maximum height attained by spall,
shot depth of burial, and yield were examined to determine any possible re-
lationships between these parameters. Estimates of teleseismic PSPALL -P
times were calculated from near-field accelerometer data for 47 explosions
with observed spall. Spall and explosion energies were calculated and sub-
surface vertical accelerometer data examined to determine the amount of spall
energy leaving the source region. This study demonstrates that assuming the
first, and deepest, spall closure contains most of the spall energy is wrong
and that calculations of spall energy cannot be based solely upon near-field
surface measurements.
-7-
I~~~~at 4W r*-~~' .--
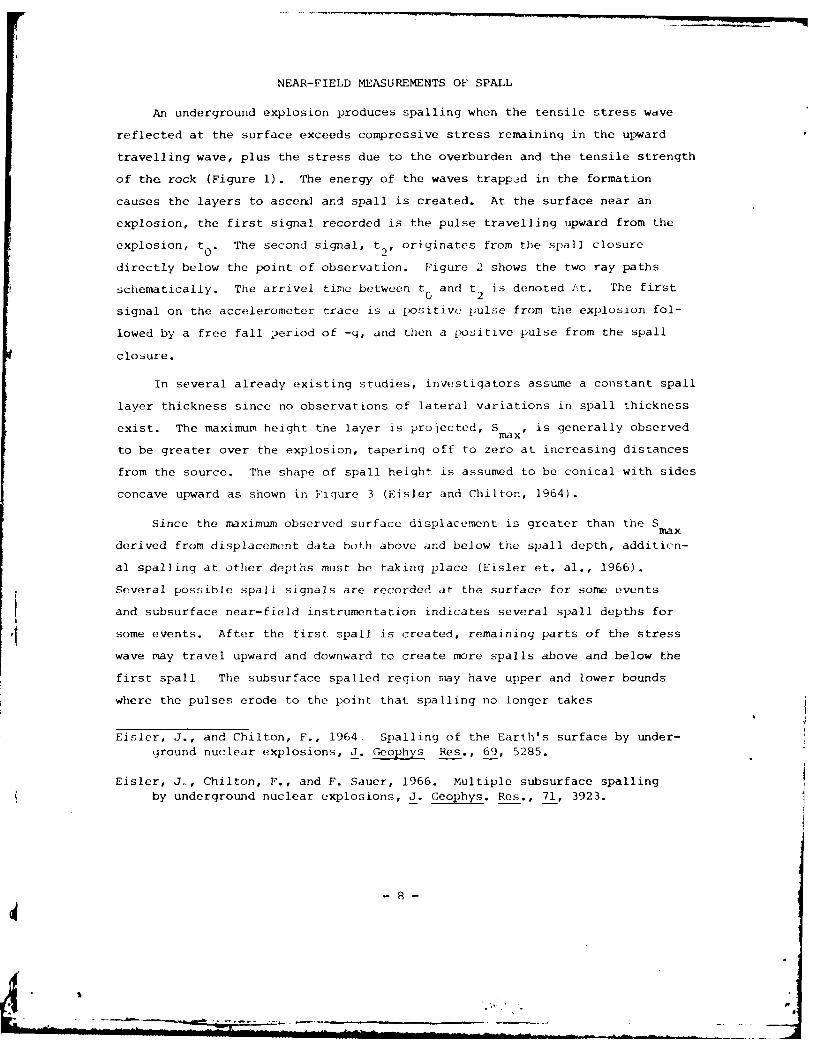
NEAR-FIELD MEASUREMENTS OF SPALL
An underground explosion produces spalling when the tensile stress wave
reflected at the surface exceeds compressive stress remaining in the upward
travelling wave, plus the stress due to the overburden and the tensile strength
of the rock (Figure 1). The energy of the waves trapped in the formation
causes the layers to ascerk] and spall is created. At the surface near an
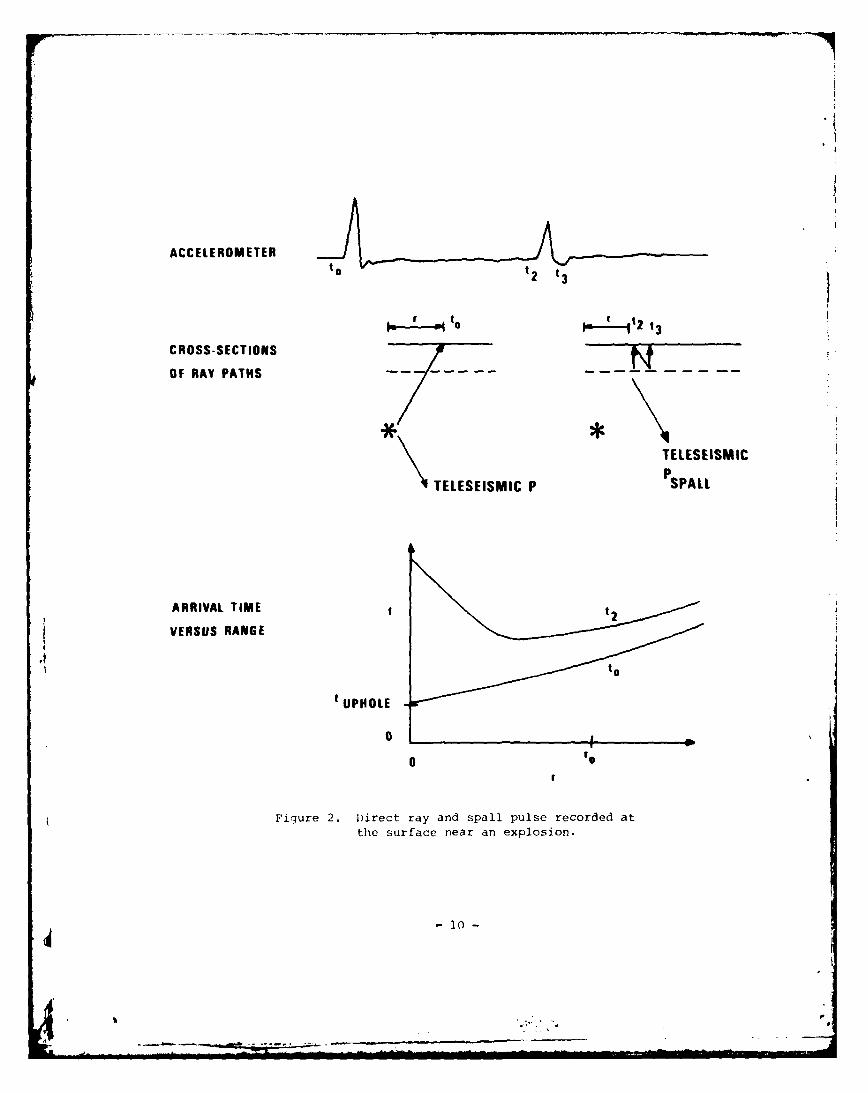
explosion, the first signal recorded is the pulse travelling upward from the
explosion, to. The second signal, t2, originates from the spall closure
directly below the point of observation. Figure 2 shows the two ray paths
schematically. The arrivel time between t and t2 is denoted At. The first
signal on the accelerometer trace is a positive pulse from the explosion fol-
lowed by a free fall 3eriod of -g, and then a positive pulse from the spall
closure.
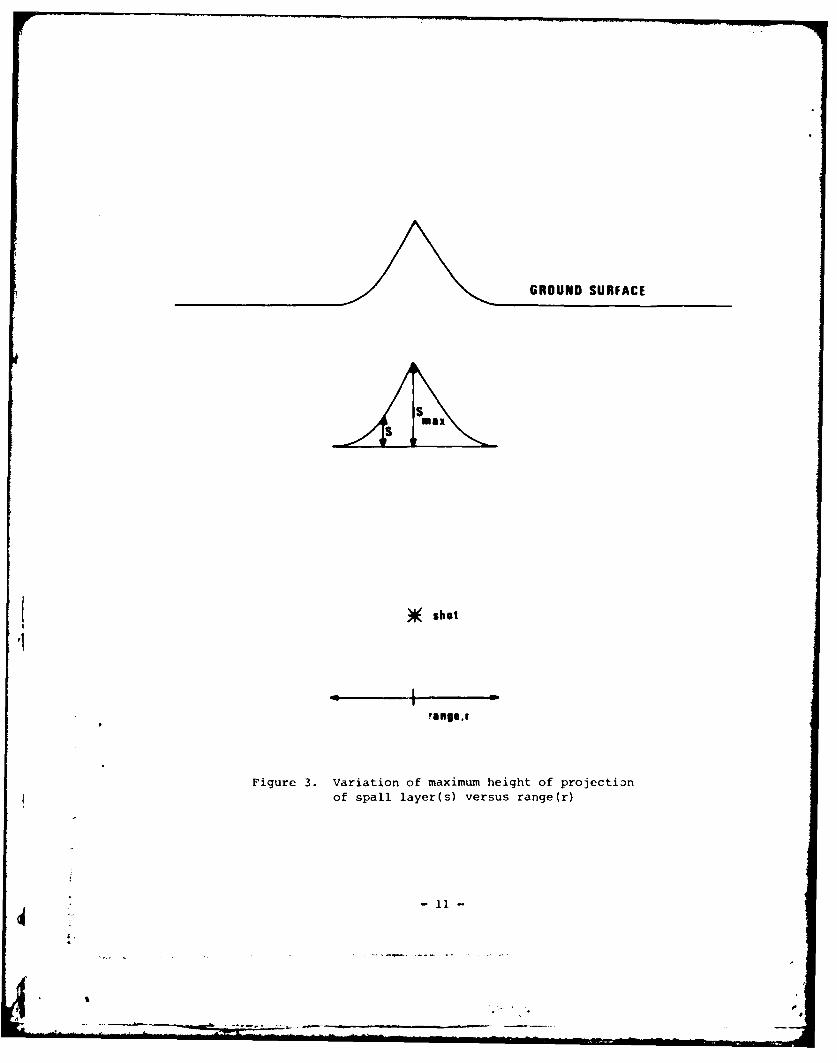
In several already existing studies, investigators assume a constant spall
layer thickness since no observations of lateral variations in spall thickness
exist. The maximum height the layer is projected, S max, is generally observed
to be greater over the explosion, tapering off to zero at increasing distances
from the source. The shape of spall height is assumed to be conical with sides
concave upward as shown in Figure 3 (Eisler and Chilton, 1964).
Since the maximum observed surface displacement is greater than the Smax
derived from displacement data both above and below the spall depth, additien-
al spalling at other depths must be taking place (Eisler et. al., 1966).
Several possible spall signals are recorded at the surface for some events
and subsurface near-field instrumentation indicates several spall depths for
some events. After the first spall is created, remaining parts of the stress
wave may travel upward and downward to create more spalls above and below the
first spall, The subsurface spalled region may have upper and lower bounds
where the pulses erode to the point that spalling no longer takes
Eisler, J., and Chilton, F., 1964. Spalling of the Earth's surface by under-ground nuclear explosions, J. Geophys Res., 69, 5285.
Eisler, J., Chilton, F., and F. Sauer, 1966. Multiple subsurface spallingby underground nuclear explosions, J. Geophys. Res., 71, 3923.
FREE SURFACE
T E S O
c o _ _
- S P A L L
TENSIONCOMPRESSION
STRESS WAVE
SHOT
Figure 1.Generation of a spall by a compressionalstress wave (Eisler and Chilton, 1964).
-9-
ACCELEROMETER
r 2 t 3
CROSS-SECTIONS NOF RAY PATHS -- -
TELESEISMIC
TELESEISMIC P PSPALL
ARRIVAL TIME t tVERSUS RANGE
t UPIIOLE
0 fe
Figure 2. D~irect ray and spall pulse recorded atthe surface near an explosion.
-10
Smax
*K shot
Figure 3. Variation of maximumi height of projectionof spall layer(s) versus range(r)
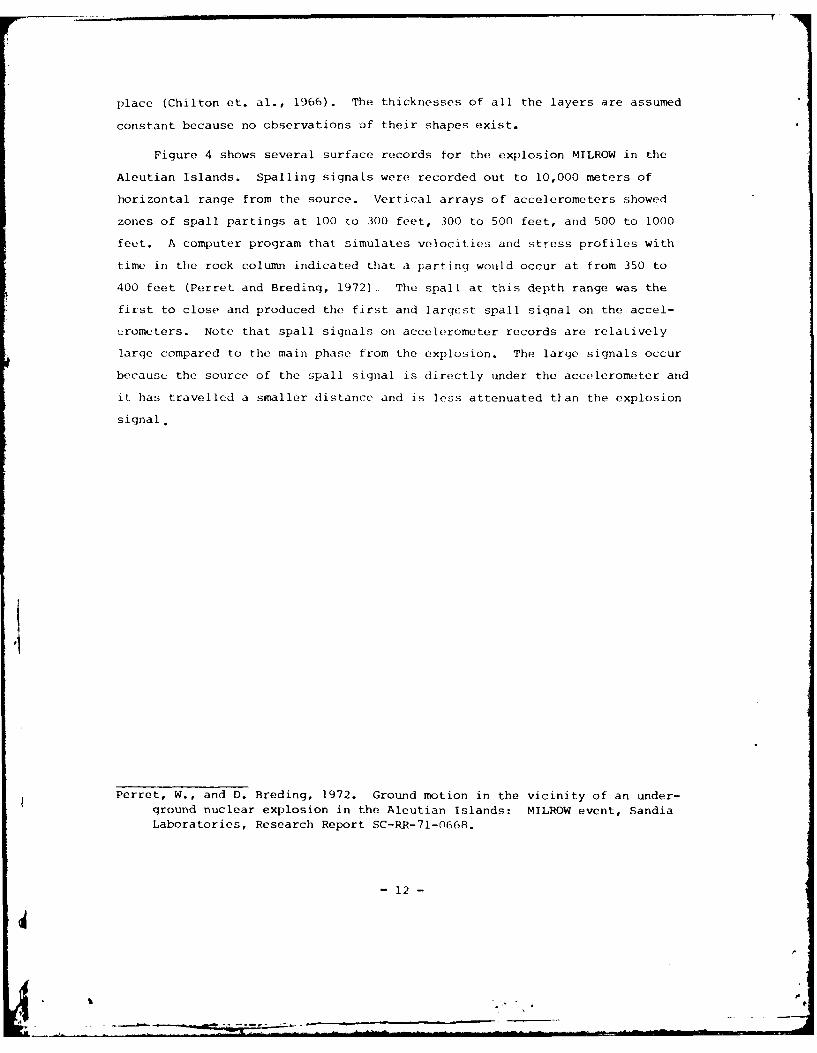
place (Chilton et. al., 1966). The thicknesses of all the layers are assumed
constant because no observations of their shapes exist.
Figure 4 shows several surface records for the explosion MILROW in the
Aleutian Islands. Spalling signals were recorded out to 10,000 meters of
horizontal range from the source. Vertical arrays of accelerometers showed
zones of spall partings at 100 to 300 feet, .300 to 500 feet, and 500 to 1000
feet. A computer program that simulates velocities and stress profiles with
time in the rock column indicated that a parting would occur at from 350 to
400 feet (Perret and Breding, 1972) The spall at this depth range was the
first to close and produced the first and largest spall signal on the accel-
-rometers. Note that spall signals on accelerometer records are relatively
large compared to the main phase from the explosion. The large signals occur
because the source of the spall signal is directly under the accelerometer and
it has travelled a smaller distance and is less attenuated tian the explosion
signal.
'I
Perret, W., and D. Breding, 1972. Ground motion in the vicinity of an under-ground nuclear explosion in the Aleutian Islands: MILROW event, SandiaLaboratories, Research Report SC-RR-71-0668.
- 12 -
I W.A
30 - t t2 -t- S-0SAV
20 -(RANGE= 76m.)
10
0S-2 AV
10 (7m
LO o
0
_ (1230m.)
U 29
10
2
0
0 1 2 3 4 5 6
TIME (sc)
Figure 4. Surface accelerometer, particle velocity,and displacement data at various horizontaldistances from the shot hole for the AleutianIslands explosion MILROW.
-13-
30
20
10
0 N-
-10 S2U
-20
-; 10
S 5
S 0
-10
*- 5
0
-5 S8U
-10
6
4
2
0 s
-2
-4 ___________________________
0 1 2 3 4 5 6J
TIME (sac)
Figure 4. (cont.) Surface accelerometer, particle velocity,and displacement data at various horizontaldistances from the shot hole for the AleutianIslands explosion M[LROW.
-14-
-w-7
200
100
50
0
60
f2 UV
20ZUIMO
30 .4 uv20
10-
0
8 fs-8 UV
4
0AL
0 1 2 3 4 5 6
TIME (sc)
Figure 4. (cont.) Surface accelerometer, particle velocity,and displacement data at various horizontaldistances from the shot hole for the AleutianIslands explosion MILROW.
-15-
ESTIMATES OF SPALL PARAMETERS
Viecelli (1973) estimated the depth, height, and radial extent of
spallation from near-field accelerometer records for seven NTS explosions
and plotted these parameters against shot depth of burial and yield. The
present study will add more data points to his figures from 47 explosions
at NTS, as well as other test areas in Nevada, New Mexico, Mississippi and
the Aleutians. These estimates of spall parameters will be used in a later
section to determine the energy of the spall closure for a falling disc witl
parameters estimated from near-field surface accelerometer and particle
velocity data.
The thickness of spall was determined from subsurface vertical acceler-
ometer array data near the sources, observations of partings in boreholes,
and determination of the arrival of the phase t3, which is reflected off the
spall layer (Figure 2). The first spall closure was assumed to contain most
of the enerqy. The maximum height of the spall was observed by near-field
vertical arrays or calculated theoretically from the observed maximum value
of At = t 2 -t 0 at the surface and the acceleration of gravity g according to
i-he formula
max8
(Eisler and Chilton, 1964). The radial extent of spallation is defined as
that horizontal range from the source where At becomes constant. For some
explosions this condition was approached near the largest range measured and
the radius of spallation is taken as the maximum horizontal range of measure-
ment.
Viecelli, J., 1973. Spallation and the generation of surface waves by an
underground explosion, J. Geophys. Res., 78, 2475.
-16-
In a few cases near-field vertical accelerometer data was available
from Eisler (1967), Eisler and Chilton (1964), Eisler, Chilton and Sauer
(1966), Perret (1968), Perret and Breding (1972), Viecelli (1973), and
Weart (1962).
Eisler, J., 1967. Near-field spalling from a nuclear explosion in a saltdome, J. Geophys. Res., 72, 1751.
Perret, W., 1968. Free-filed particle motion from a nuclear explosion insalt, Part I, Vela Uniform Program, SALMON event, Sandia Laboratories,
Report VUF-3012.
Weart, W., 1962. Particle motion near a nuclear detonation in halite,Bull. Seism. Soc. Amer., 52, 981.
- 17-
--. "" - -.- - . - . - - - -
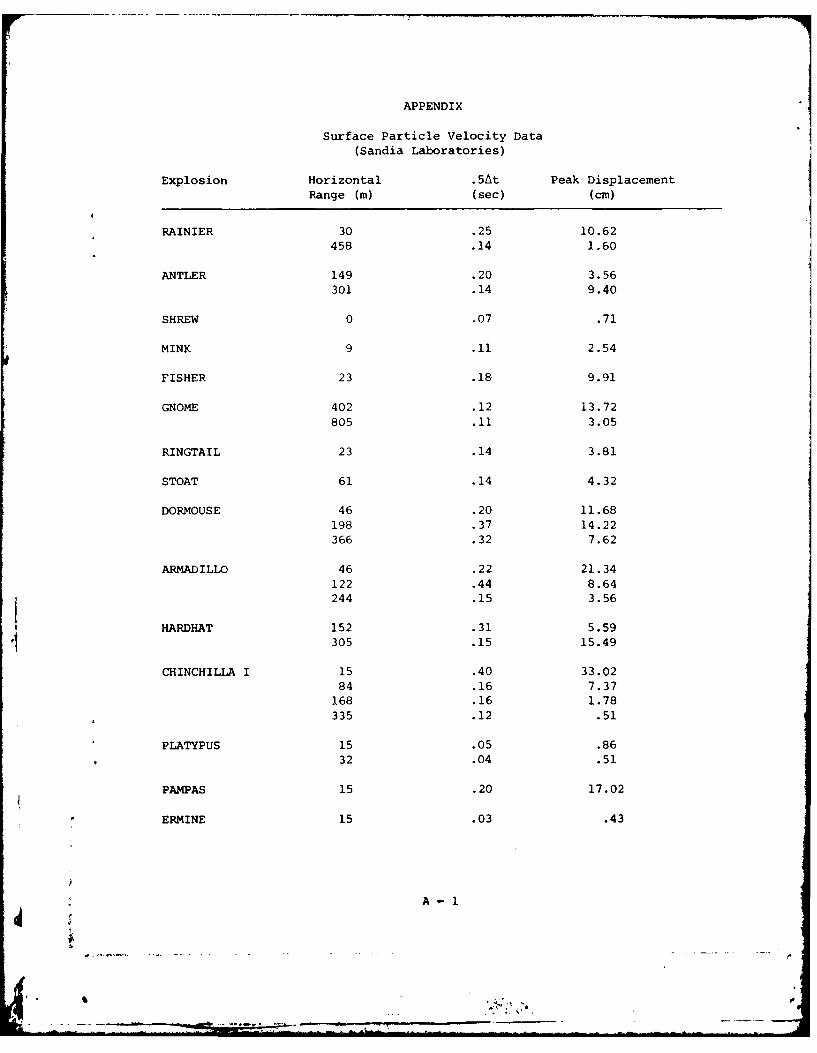
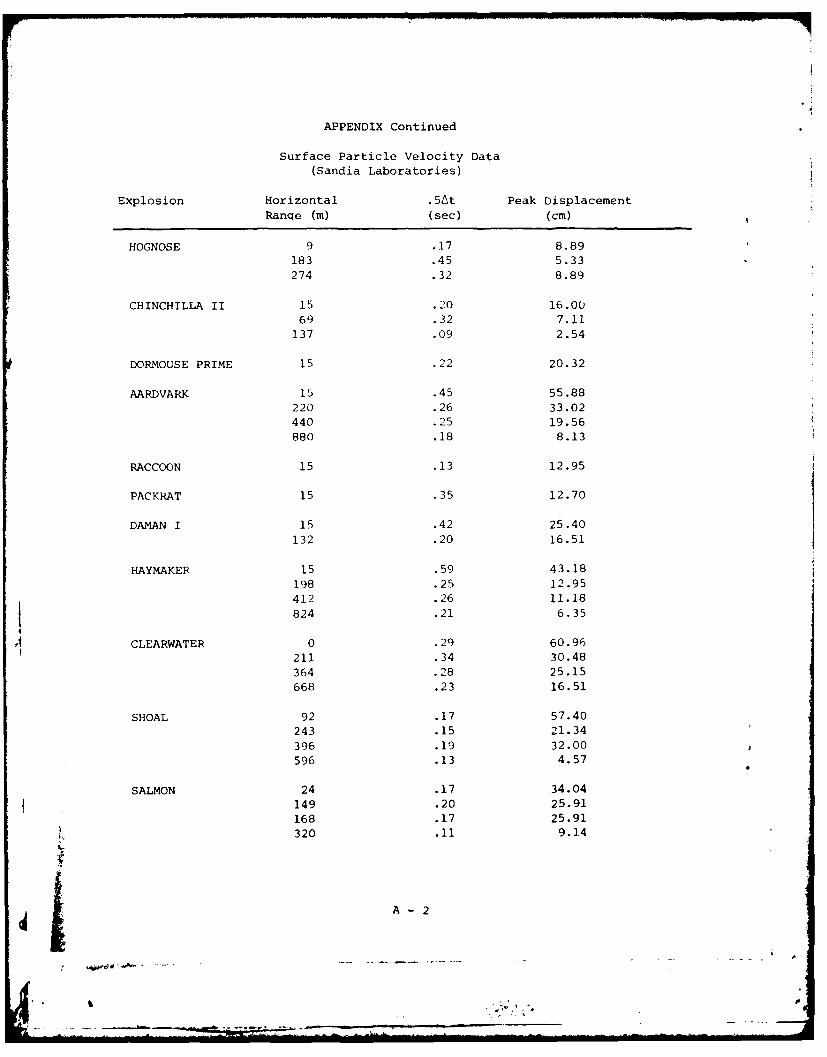
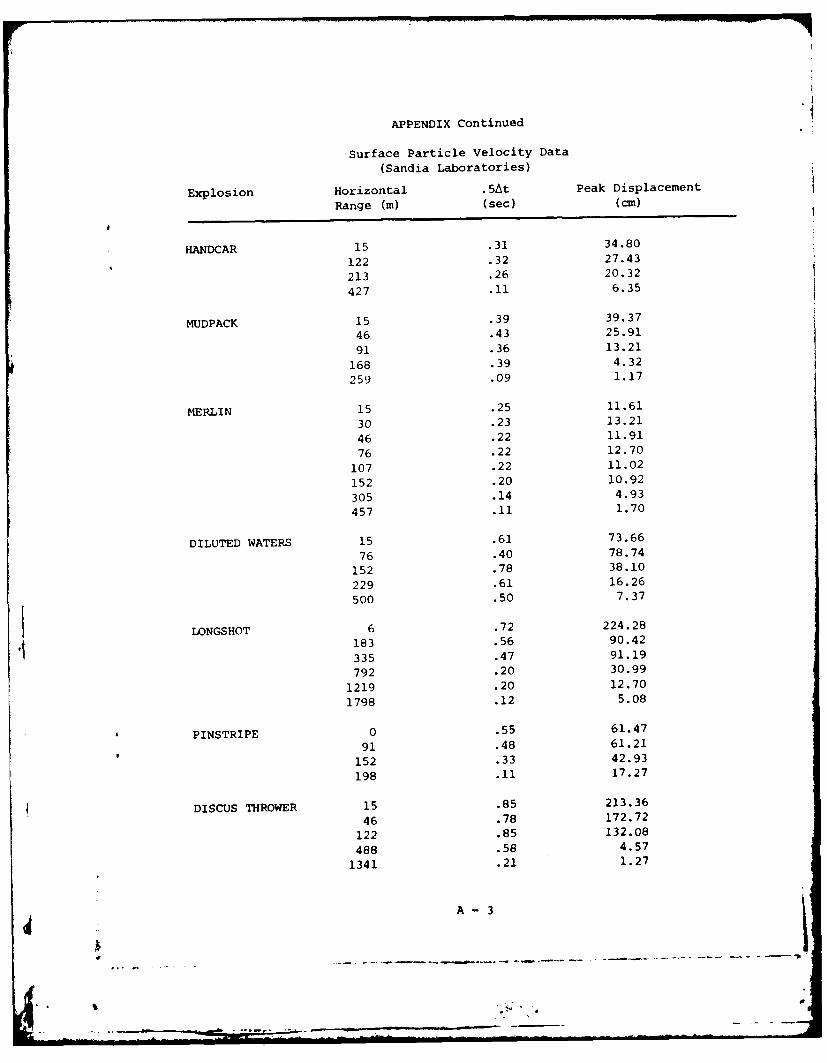
In all cases Sandia Laboratory near-field particle velocity data, that D.
Springer made available to the author at the Lawrence Livermore Laboratory,
was used to determine values of At and ground displacement as a function of
horizontal range. The Appendix includes this data for all horizontal ranges
out to the radial extent of spallation. The surface particle velocity data
listed times between the first and second zero crossing on the particle
velocity records at several horizontal ranges for each explosion. When the
particle velocity records were compared to the accelerometer data (Figure 4),
these times were found to be equal to 0.5At. Note in the appended material
that peak displacements do not always decrease with increasing range for any
given explosion. The conical approximation for the shape of S is notmax
always valid, probably because of changing lithologies in the source region.
In most cases this study picked a larger spall radius for the explosions
that the radius used in Viecelli's study. This discrepancy stems from the
methods used in the two different studies to determine spall radius.
Viecelli, as shown in Figure 2, uses the horizontal radius of the minimum
arrival time of t2 as the spall radius. He reasoned that where the t2 arrival
time was a minimum, the free fall time of the slab under that point was
smallest. The Sandia LaboraLury particle velocity data gave values of At
and not values of t2 and t at various ranges from the source. The spall
radius was established as the range where the time At became constant,
assuming that beyond that range there was no spall under those observation
points.
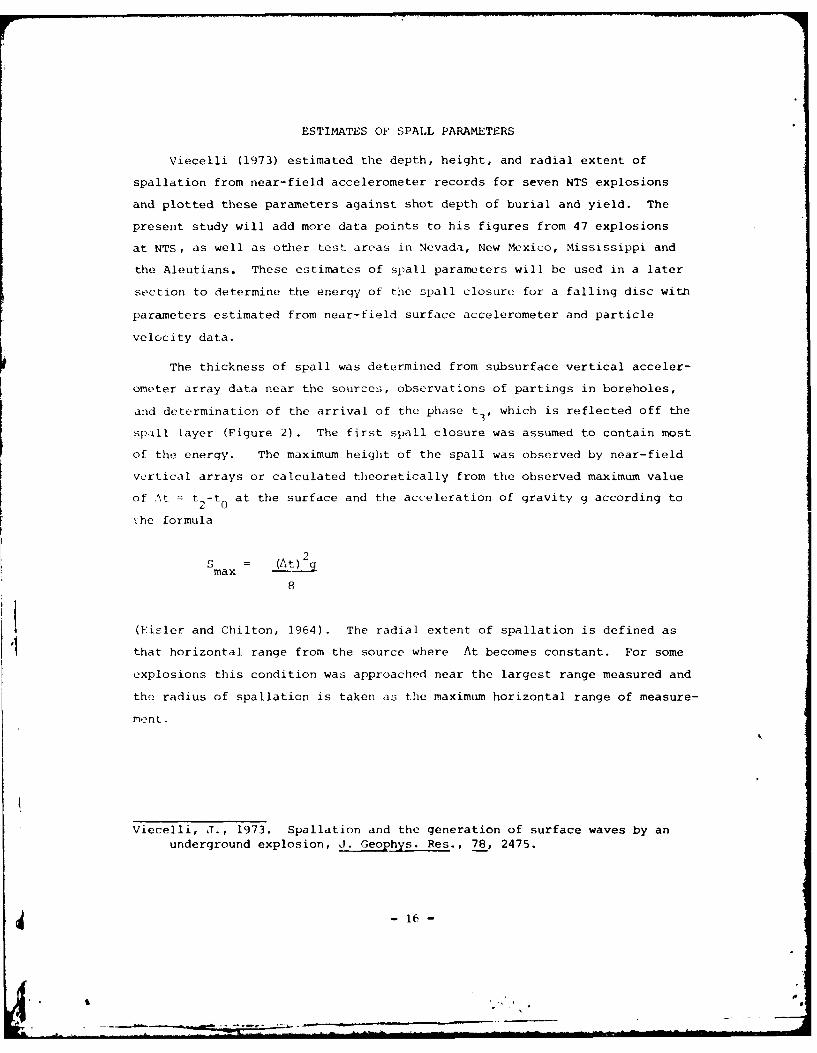
Figure 5 shows the thickness of spall versus explosion yield. In Figures
5 through 14 the dots are Viecelli's data points and the circles are from
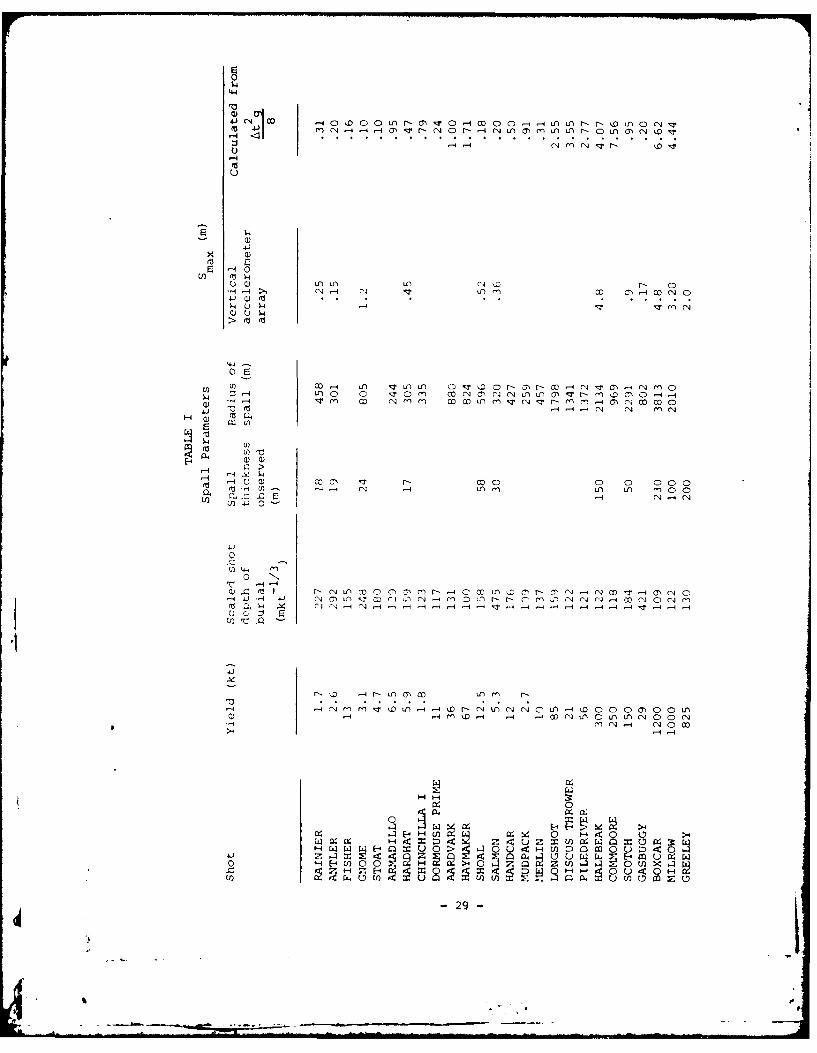
this study. Data points for this study are tabulated in Table I. Arrows
connect the two data points where our data points differ from Viecelli's for
the same explosions. The figures show the lines Viecelli used as best fits
to his data and the least squares lines of best fit calculated when the new
data points are added to the figures. The additional data points show more
scatter than Viecelli's original set, a conclusion found in all the figures
resulting from changing lithologies in the source regions. Viecelli's line
in Figure 5 has a slope of 1/3. The present study also indicates the same
relationship between spall thickness and yield, but the new best fit line has
- 18 -
+1
0 aJ
4U --=0
c a a4 -4 L
V) -4r
E E0
-4 t 4
- 00
CO) l~dS10 SMUMN
19U *'
"Il 1 I 1 IIl i P 1 ll ll I I
m
-1
,4J--N'
me4go w
am0
_ N.
4- -4
u a
44
-4
00
CD0
a 1.)
CA-11W~- Il 1013V0)SI1II M AL3I
* 0)
U@
- U
02
4hn
* .-| - d
°OU
- 20 -.- 0
100 10
SCLDSO ET O UIL*k'3
Fiue76 cld saltikesv.sae htdpho uil
a2
caS ca
caC!
+1
ca
y4-
4
ca 1
Q)'0
V4-
Cul~ =UIM 0ld
22
1 1 T I T1 1 T I I I T111 I I I
+ I
I.,aI.cm
*0
23 -
600
NM
R-Rainier Mesa
5600 NM- New MexicoY-YuccaNTS
p M-MississippiA A-Aleutians
400 - P -Pahute?A -Viecelli's date
- NTS
.P
300
20 YY NM NMc~a
200 -- Y
y NTSI M
yI100
100 - --- I F Viecelli
0 100 200 300 400 Soo BooSCALE0 SHOT DEPTH OF BURIAL(mkt 1 / 3
Figure 10. Scaled spall radius vs. scaled shot depth of burial.
- 24 -
4P
• ,+
-. . ° "- - " " - " - -J
Isa
r6
Thi stud .--.0±4
• U
Viseelli
so0 M=-4.0 lose1000
SCALED SHOT DEPTH OF BURIAL (nkt-1/31
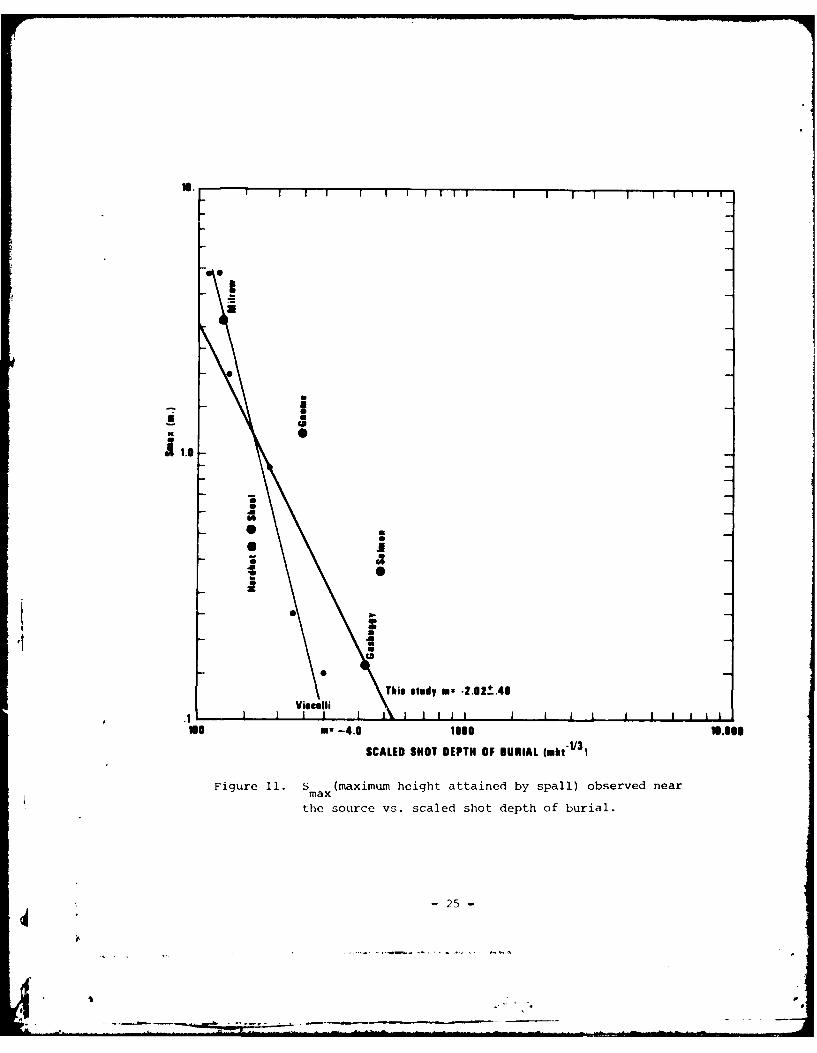
Figure 11. S mx(maximum height attained by spall) observed near
ax
the source vs. scaled shot depth of burial.
-25-
..
A 0 NTSo * NEW MEXICO
0 M MISSISSIPPI5. A ALEUTIANS
0
0
CA
1.00
0
0 0
0 N
'1 0
0
m -1.67!.42L I I I I - I I I l -- -, I I i I i II
100 200 1000 1.148
SCALED SHOT DEPTH OF BURIAL (mkt 1/ 3)
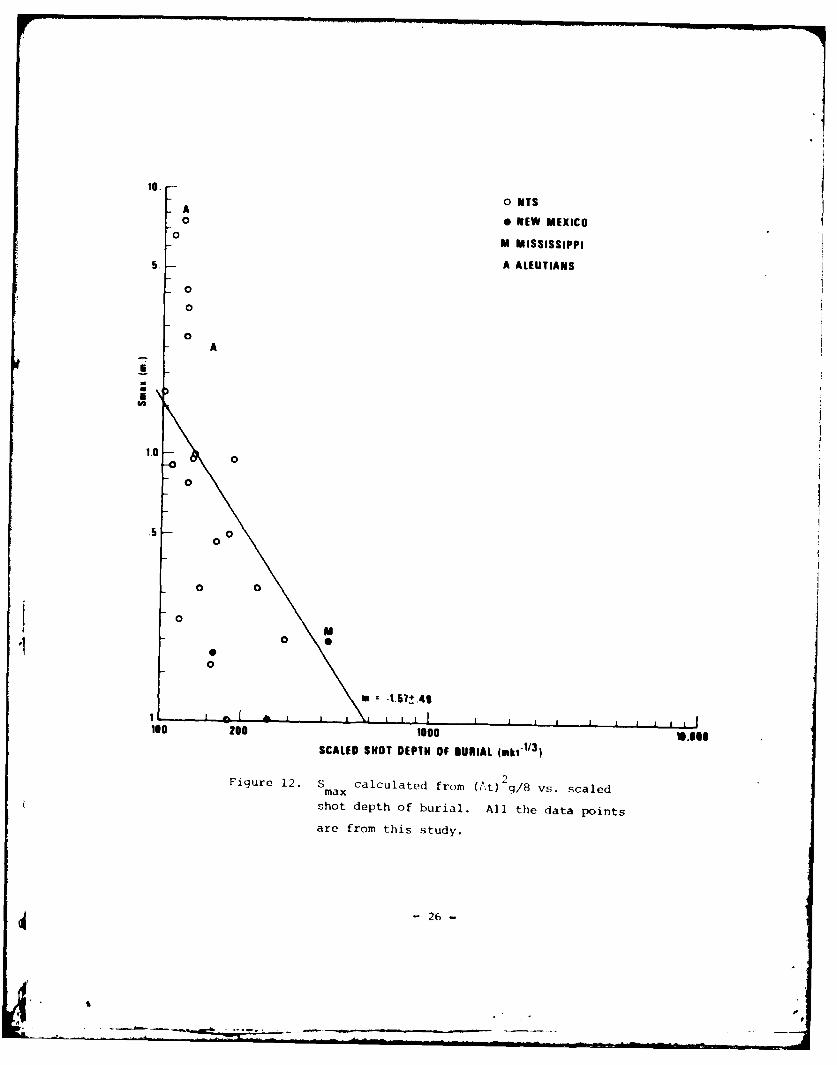
Fiqure 12. S calculated from (At)2g/8 vs. scaledmax
shot depth of burial. All the data points
are from this study.
-26-
III ! I I ~ IIII1 I J I I I I I -
Rd..
r4.14
ca
C, Q)u
0jo U)
00.
* Q)
P.4
tint~ ~ ~ ~ ~ fl I I tttLik Ltt I I
I'm) Ina8
27
i0*'
j,6
i*II:.
4.J
2 (A 0'FA
-4U
4154
In) *jniv Ula
281'a
41-4 CC.1 D 0 0 L 0%; 4x 4' nL r DL
'-4
x C)(o E-
E 1-4-0
u a)0 0' 0l 000N' ,r-
CO-I C'J -4L nr -X r4N T0 -1~ Nf mf r 0 0
4 2 U
Q) '
-44 -4 4-i -4r
cn Zli 5
'en
4 C'Jr.' -4-4 -4 -
I-4N1- C 0O
C4
0) '--EH fl
-29-
a smaller y-intercept value. In Figure 6 the spall thickness, corrected
to a scaled depth of burial of HALFBEAK (spall thickness X scaled depth of
burial /122m kt- / 3) is plotted versus yield. The adjusted data show the same
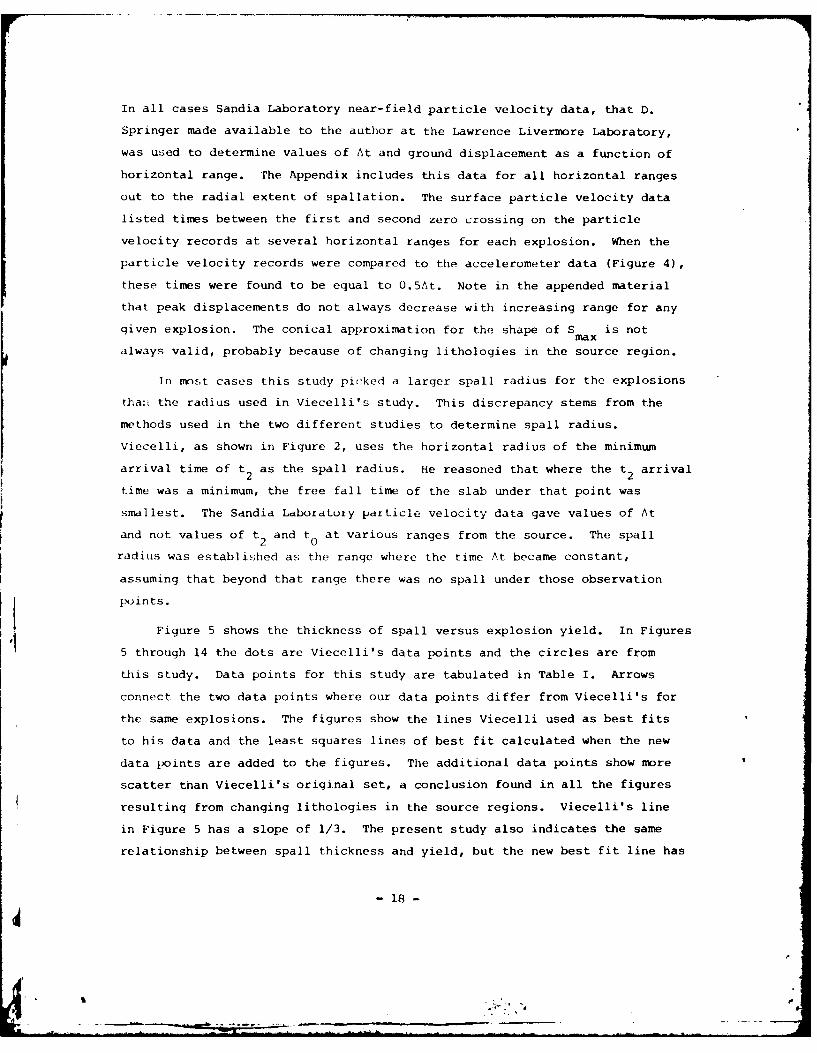
scatter as in Figure 5. Figure 7 shows scaled spall thickness (thickness/
yield / ) versus scaled shot depth of burial (depth/yield /3). Viecelli
found an inverse relationship between scaled spall thickness and scaled depth
of burial, but the additionof newdata points shows a much poorer fit to the
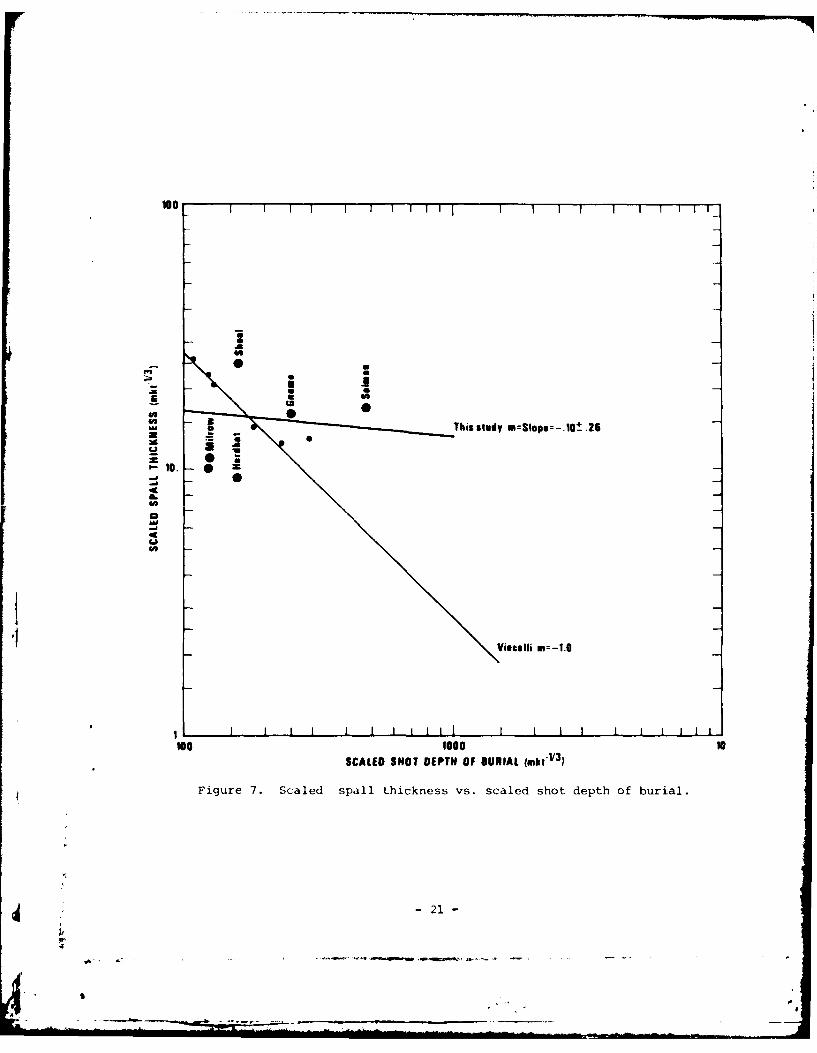
best fit line through the entire data set. A plot of spall thickness/shot
depth versus scaled shot depth of burial showed no relationship between those
two variables. In Figure 8 spall thickness is plotted versus shot depth of
burial. The line through the data has a slope of .10±.03 and spall thickness
is observed to range from 5 to 20 percent of shot depth.
In Figure 9 the radius of spallation is plotted versus yield. Viecelli's
best fit line is a lower bound to the new set of data. A line of similar
slope has been drawn through the new set of data. Both lines have a slope
of 1/3, suggesting the same dependence on yield as the thickness of the
spall. Figure 10 shows the scaled spall radius (radius/yield / 3 ) versus
the scaled shot depth of burial. No line could be found to fit the complete
data set. Viecelli's seven explosions all had scaled shot depth of burial
values in the limited range 95 to 105, but Viecelli's line is merely a lower
bound for our data set, which contains a greater range of scaled shot depth.
Great variation exists in scaled spall radius, even within a particular
region.
S versus scaled shot depth of burial is shown in Figures 11 and 12.
In Figure 11 S was observed near the source and in Figure 12 S wasmax maxcalculated from observed maximum At. Viecelli's data exhibits an inverse
fourth power dependence on depth, but the complete set of data in this study
shows an inverse second power dependence on depth and much more scatter than
Viecelli's data set. In Figure 13 S observed near the source is plotteamax
versus yield. The best-fit line has a slope of .40±.09.
Combining the results of Figures 5 and 9, Figure 14 shows spall radius
versus spall thickness. The data show a direct relationship, but the slope
of a line through the data is poorly defined. Clearly, data in Figures 5
and 9 show that both spall depth and radius are dependent on yield.
- 30 -
Lateral and vertical changes in lithology probably are the major factors that
affect the relationship between spall radius and spall thickness.
Possible relationships between yield (Y), shot depth (h), spall thick-
ness (D), radial extent of spall (r 0), and maximum height the spall is thrown
(S max ) were investigated using a multivariate general linear hypothesis
program. The following relationships were found between the variables:
log(D) = 1.35 + 0.351og(Y) - 0.07log(h)
log(r0 ) = 2.84 + 0.371og (Y) - 0.16log(h)
log(Sm) = 0.57 + 0.521og(Y) - 0.50log(h)max
The effect of shot depth is significantly different from zero only at the 50
percent level, implying that shot depth is not a significant variable. Shot
depth probably is a significant variable but this cannot be shown because of
the strong correlation of depth with yield and the small number of observations
(12 cases). Both log (D) and log (r 0 ) are approximately proportional to (1/3)
log (Y), as seen in Figures 5 and 9.
- 31 -
Lp
ESTIMATES OF TELESEISMIC pP AND PSPALL ARRIVAL TIMES
FROM NEAR-FIELD DATA
Springer (1974) estimated PSPALL-P times for explosions at teleseismic
distances using near-field surface accelerometer data that show t, the
uphole travel-time above the source, arid At, the difference between the spall
arrival time and the direct ray. Springer assumed that the spall signal on
the surface accelerometer data is due to the first, and deepest, spall
closure. At is a function of distance from the source and it is generally
largest over the source where the froe-fall time of spall is largest. (Figures
2 and 3). pP-P at teleseismic distances can be approximated by the formula
pP-P = 2t cosOup
where 0 is the take-off angle at the source. P SPALL-P can be approximated
by the formula
PSPALL-P = At .2t - .2t
---up up
cosR
(Springer 1974). Where no information on spall depth is available, the
travel-time between the spall depth and the surface is assumed to be 20 per-
cent of the uphole time, which accounts for the term .2tup.
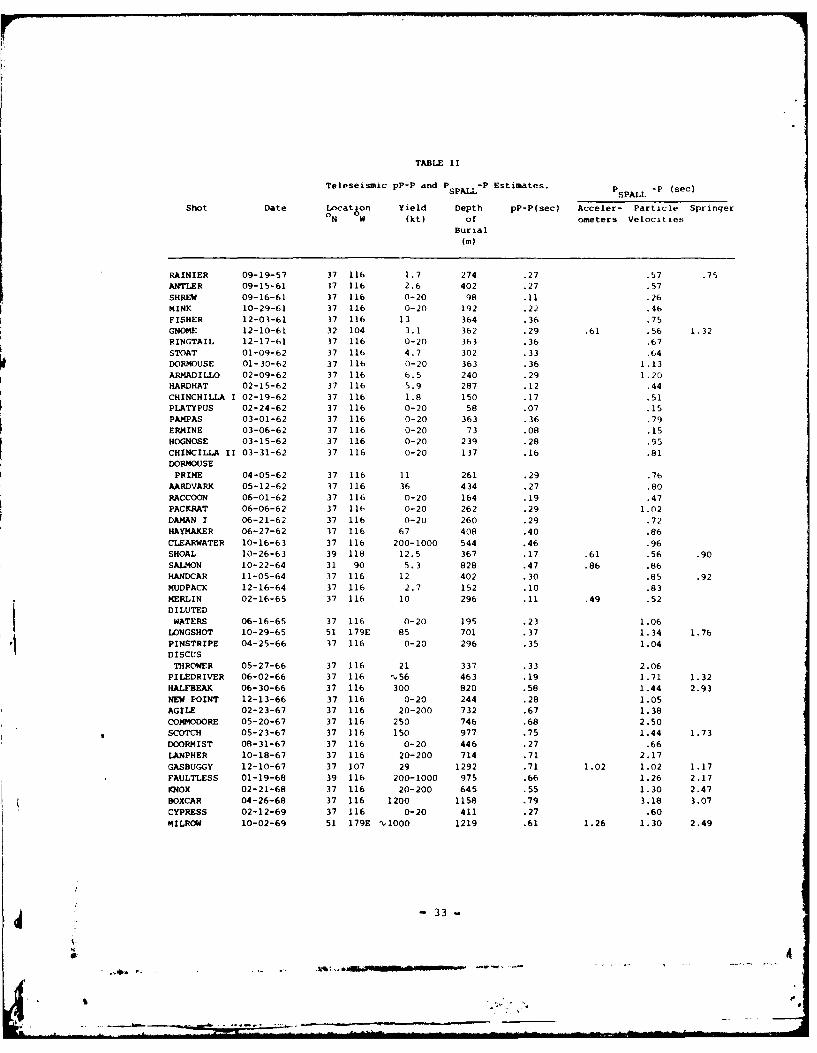
Table II lists pP-P and P PA,.-P times for 47 explosions. pP-P times
are from already published values of t . An epicentral distance of 50up
deqrees was used in the calculations. PSPALL-P times are from published
n*ar-field surface accelerometer measurements, particle velocity tables of
near-field data provided by Sandia Laboratories, and Springer's (1974) study.
The At values that Springer used were near the shot hole, where energy was
assumed to be at a maximum. Since this is also the maximum value of At
found, Springer's PSPALL-P times aie maximum values. As demonstrated in
the next section, the velocity of the slab at impact and, therefore, the
relative energy of spallation varies with distance from the shot hole. The
impact of the disc occurs over a time range of a few tenths of a second for
most explosions and the maximum energy as a function of radius occurs near
Springer, D., 1974. Secondary sources of seismic waves from undergroundnuclear explosions, Bull. Seism. Soc. Amer., 64, 581.
-32-
TABLE II
Teleseismic pP-P and P SPALL-P Estimates. P -p sec)PPLLSPALL -
sc
Shot Date Location Yield Depth pP-P(sec) Acceler- Particle Springer0N W (kt) of ometers Velocities
the spall region. Assuming a spherical explosion source, the fraction of
the explosion energy reaching the spall region depends upon the depth of
burial and the spall radius. For explosions stulitd. here that fraction
ranged from 1 to 37 percent.
Spall energy was calculated for 42 NTS explosions located below the
water table that lacked near-field data. Thickness of the spall layer was
estimated from the relationship between yield and saLi thickness
found in Figure 5. Similarly, the maximum radius of spall was found from
Figure 9 and the maximum height attained by spall was found from Figure 11.
The heiqht spall was thrown was assumed to vary inversely as the square of
the horizontal distance from the .;hot hole, which approximates the conical
shape of s,)all height observed by other investigators (Figure 31). Figure
P, shows the M residual (M - log yield + ,constant) for these explosions
(von Seqgern and (;urski, 1976) versus spall energy/1explosion energy.
No relationship exists between M residual and spall enerqy/explosion energy,s
a situation suggesting that spall has no effect on M . In addition, low5
strain release events (Masse', unpublished data) do not show a clearer
relationship than do average strain release events, sigoestinq that strain
release is not hiding the effect of spall energy.
The efficiency that Perret (1972) calculated is a source cf error
in the energy calculations. Table IV shows the explos ion en,,rgies that
Perret derived from near-field data and the explosion encrgies c.aIculated
for the same explosions using formula (1). The range of variat iPs betwee,1,
the two energy values for each explosion, and hence the error in estimating'Iexplosion energies using Perret's efficiencies, ranged from a factor of 1.0
to 2.7.
Another source of error in the energy calculations is the thickness of
the spall layer. In a few cases partings were observed in boreholes. However,
there were several spall partings and the one responsible for the spall signal
on the near-field surface accelerometer data must be determined. Because most
von Seggern, D., and J. Gurski, 1976. M versus yield of underground nuclearsexplosions at the Nevada Test Sites, SDAC-TR-76-11, Teledyne Geotech,Alexandria, Virginia 22314.
- 42 -
_,. ... ..-4J | " . . .,;
.40
®.30
20
.10
00- .0
. 0-.1 6
0
-.26
0@-. 30
-.40KEY
* Average strain release
®Low strain release-.50 (Masse. unpublished data(
-.16 t I I
O .16 .20 .36 .40
SPALL ENERGYYIELD z EFFICIENCY x 4.11xl0
Figure 19. M residual vs. spall energy/explosion energy for 42 NTSsexplosions located below the water table.
Perret's efficiency estimates for the explosion medium.
Energy (10 18erg s) - Differ-Yield x efficiency erence
Shot Perret X-41.8 - Yj_1.d- Effici ancy (1)
RAINIER 1.5 1.4 - 2.1 0-40 1.7 2 - 3
FISHER .68 .27 - .82 0-60 13 .05 - .15
GNOME 12. 3.9 68 3.1 3
HARDHAT 8.4 4.9 42 5.9 2
HAYMAKER 2.7 1.40 - 4.2 0-56 67 .05 - .15
SHOAL 13. 10.4 20 12.5 2
SALMON 7.6 6.6 13 5.3 3
HANDCAR 11. 10.0 9 12 2
MUDPACK .12 .11 - .34 0-183 2.7 .10 - .30
MERLIN .17 .21 - .63 24-271 10 .05 - .15
PISCUS THROWER 2.6 .88 - 2.6 0-66 21 .10 .30
PILEDRIVER 47. 47. 0 56 2
GASBUGGY 24. 24. 0 29 2
ROXCAR 1400. 1003. 28 1200 2
44
- 44 -
subsurface displacements are attributed to parting at one depth, the energy
for the falling disc varies directly with the thickness of the falling disc.
In some cases spall depth was determined from observations of the
arrival times of the phase t2 and the phase reflected off the spall layer t3.Figure 2 illustrates the ray paths of these two phases. This method of
determining spall depth is suspect because identification of the presumed
t3 arrival is uncertain. If the sources of the spall signals were close
to the surface, then the t arrival could not be separated from the t2 arrival,
and the total amount of energy in such a thin falling disc would be
small compared to the explosion energy.
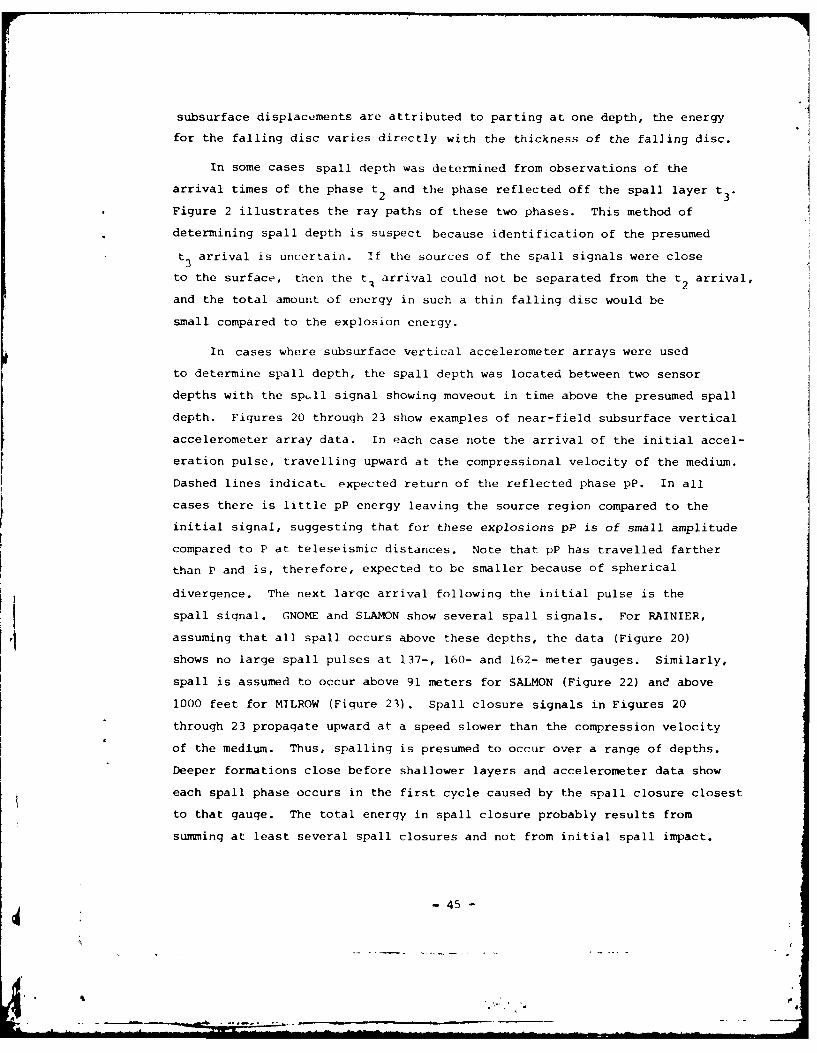
In cases where subsurface vertical accelerometer arrays were used
to determine spall depth, the spall depth was located between two sensor
depths with the sp.ll signal showing moveout in time above the presumed spall
depth. Figures 20 through 23 show examples of near-field subsurface vertical
accelerometer array data. In each case note the arrival of the initial accel-
eration pulse, travelling upward at the compressional velocity of the medium.
Dashed lines indicatL expected return of the reflected phase pP. In all
cases there is little pP energy leaving the source region compared to the
initial signal, suggesting that for these explosions pP is of small amplitude
compared to P at teleseismic distances. Note that pP has travelled farther
than P and is, therefore, expected to be smaller because of spherical
divergence. The next large arrival following the initial pulse is the
spall signal. GNOME and SLAMON show several spall signals. For RAINIER,
assuming that all spall occurs above these depths, the data (Figure 20)
shows no large spall pulses at 137-, 160- and 162- meter gauges. Similarly,
spall is assumed to occur above 91 meters for SALMON (Figure 22) and above
1000 feet for MILROW (Figure 23). Spall closure signals in Figures 20
through 23 propagate upward at a speed slower than the compression velocity
of the medium. Thus, spalling is presumed to occur over a range of depths.
Deeper formations close before shallower layers and accelerometer data show
each spall phase occurs in the first cycle caused by the spall closure closest
to that gauge. The total energy in spall closure probably results from
summing at least several spall closures and not from initial spall impact.
-45-
i
- ~ II.
p p "V I
Figure 20. Subsurface vertical accelerometer array datafor RAINIER (Eisler, Chilton, and Sauer, 1966).Arrows indicate the direction of flow of seismicenergy.
-46-
how
101
30
20k
1 3 ,S 5 ETENS ;I/ /
UI- -0o /
30
2o C
2, 0 EIglMF TE9S
-40 315 MCI[ S /
F.: Sb ra i
'447
25S 0 I d'L F.
6D Ic1
-?C TV 'E, . )I)S
Figure 21. Subsurface vertical accelerometer array data