314
Air Pollutant Emissions 1990-2015 REPORT M-704 | 2017 Informative Inventory Report (IIR) 2017. Norway
Air Pollutant Emissions 1990-2015
REPORT
M-704 | 2017
Informative Inventory Report
(IIR) 2017. Norway
1
COLOPHON
Executive institution
The Norwegian Environment Agency
Project manager for the contractor Contact person in the Norwegian Environment Agency
[Project manager for the contractor] Britta Maria Hoem
M-no Year Pages
704 2017 312
Publisher
The Norwegian Environment Agency
Author(s)
Title – Norwegian and English
Informative Inventory Report (IIR) 2017. Norway -Air Pollutant Emissions 1990-2015
Summary – sammendrag
This report documents the methodologies used in the Norwegian emission inventory of acidifying
pollutants, particulate matters, heavy metals and persistent organic pollutants submitted under the
UNECE Convention on Long-range Transboundary Air Pollution.
4 emneord 4 subject words
IIR, langtransportert luftforurensning IIR, Air Pollutant Emissions
Front page photo
Foto: Kallestad, Gorm, Scanpix

1
Content Executive Summary ................................................................................................................... 6
1 Introduction ............................................................................................................................... 7
1.1 National Inventory Background ................................................................................. 7 1.2 Institutional arrangements ......................................................................................... 7 1.3 Inventory preparation process ................................................................................... 8
Pollutants included, data collection, processing and archiving .................................. 8 Definitions and structure .......................................................................................... 10 Archiving .................................................................................................................. 10
1.4 Methods and data sources ...................................................................................... 10 Structure of the general emission model ................................................................. 11 The four axes: Pollutants, industries, fuels, and sources ......................................... 12
1.5 Key Categories ........................................................................................................ 15 1.6 QA/QC and Verification methods............................................................................. 15
QA Procedures ........................................................................................................ 15 General QC procedures .......................................................................................... 16 Source category-specific QC procedures ................................................................ 19 Verification studies .................................................................................................. 20
1.7 General uncertainty evaluation ................................................................................ 21 Acidifying substances and NMVOC ......................................................................... 21 Heavy metals and POPs ......................................................................................... 21
1.8 General Assessment of Completeness ................................................................... 21
2 Explanation of key trends ......................................................................................................... 24
2.1 Acidifying substances and NMVOC ......................................................................... 24 Total acidifying emission ......................................................................................... 24 NOX ......................................................................................................................... 24 SO2 .......................................................................................................................... 26 NH3 .......................................................................................................................... 28 NMVOC ................................................................................................................... 30
2.2 CO ........................................................................................................................... 32 2.3 PM, POPs and heavy metals ................................................................................... 33
PM10 ........................................................................................................................ 34 PM2.5 ........................................................................................................................ 36 Black carbon ............................................................................................................ 36 Dioxins ..................................................................................................................... 38 PAH-4 ...................................................................................................................... 39 HCB ......................................................................................................................... 41 PCB ......................................................................................................................... 43 Lead ........................................................................................................................ 45 Cadmium ................................................................................................................. 46 Mercury ................................................................................................................... 48 Chromium, arsenic and copper ............................................................................... 49
3 ENERGY (NFR sector 1) ............................................................................................................. 51
3.1 Overview ................................................................................................................. 51 3.2 Energy combustion .................................................................................................. 51
Overview ................................................................................................................. 51 Energy industries ..................................................................................................... 61 Manufacturing industries and construction .............................................................. 68 Transport ................................................................................................................. 70 Other sectors ......................................................................................................... 103 International bunkers ............................................................................................. 106
3.3 Energy production (fugitive emissions from fuels) ................................................. 107 Overview ............................................................................................................... 107

2
Fugitive emissions from coal mining and handling ................................................ 107 Fugitive emissions from uncontrolled combustion and burning coal dumps .......... 108 Oil and natural gas ................................................................................................ 109
4 INDUSTRIAL PROCESSES AND PRODUCT USE (NFR sector 2) ................................................. 117
4.1 Overview ............................................................................................................... 117 4.2 Mineral products .................................................................................................... 117
Cement production ................................................................................................ 118 Lime production ..................................................................................................... 120 Glass and glassfibre production ............................................................................ 121 Mining and extraction of stones and minerals ....................................................... 122 Construction and demolition .................................................................................. 123 Ceramics ............................................................................................................... 124 Non-metallurgical Magnesia Production ................................................................ 125 Sandpit and rock-crushing plant ............................................................................ 126 Concrete pumice stone .......................................................................................... 127 Rock wool production ............................................................................................ 128 Production of mineral white (plaster) ..................................................................... 130 Construction and repairing of vessels - Sandblasting ............................................ 131 Leather preparing .................................................................................................. 132 Production of asphalt ............................................................................................. 133
4.3 Chemical Industry .................................................................................................. 134 Ammonia Production ............................................................................................. 134 Production of nitric acid ......................................................................................... 135 Silicon carbide ....................................................................................................... 136 Production of calcium carbide ............................................................................... 139 Production of titanium dioxide ............................................................................... 141 Production of methanol .......................................................................................... 142 Production of sulphuric acid .................................................................................. 143 Production of plastic .............................................................................................. 144 Production of explosives ........................................................................................ 145 Chloralkali production ............................................................................................ 146 Production of pigments .......................................................................................... 146 Production of soap ................................................................................................. 147 Paint and varnish production ................................................................................. 148
4.4 Metal production .................................................................................................... 148 Production of iron and steel ................................................................................... 149 Production of ferroalloys ........................................................................................ 150 Production of primary aluminium ........................................................................... 157 Production of secondary aluminium....................................................................... 160 Production of magnesium ...................................................................................... 162 Production of zinc .................................................................................................. 163 Production of nickel ............................................................................................... 164 Manufacture of anodes .......................................................................................... 165
4.5 Solvents and product use ...................................................................................... 167 Solvent losses (NMVOC) ....................................................................................... 167 Creosote-treated materials .................................................................................... 171 Road paving with asphalt ...................................................................................... 172 Other product use .................................................................................................. 173 Mercury-containing products ................................................................................. 174 Tobacco ................................................................................................................. 174
4.6 Other production .................................................................................................... 176 Pulp and paper ...................................................................................................... 176 Food and beverages industry ................................................................................ 177 Ore mines .............................................................................................................. 178
4.7 Wood processing ................................................................................................... 180 Wood processing ................................................................................................... 180
5 AGRICULTURE (NFR sector 3) ................................................................................................. 181
3
5.1 Overview ............................................................................................................... 181 5.2 Livestock population characterisation .................................................................... 183
Data sources ......................................................................................................... 183 Method for estimating number of cattle ................................................................. 184 Method for estimating number of sheep ................................................................ 185 Deviations from FAO statistics............................................................................... 185 Uncertainties ......................................................................................................... 186 Source specific QA/QC .......................................................................................... 186
5.3 Nitrogen in animal manure as basis for emission estimates .................................. 186 5.4 Emissions from manure management ................................................................... 189
Description ............................................................................................................ 189 NH3 emissions from manure management ............................................................ 189 NOX emissions from manure management ........................................................... 195 NMVOC emissions from manure management ..................................................... 196 PM emissions from manure management ............................................................. 198 Completeness........................................................................................................ 199 Source specific QA/QC .......................................................................................... 199
5.5 Crop production and agricultural soils ................................................................... 199 Description ............................................................................................................ 199 NH3 emissions from agricultural soils .................................................................... 200 NOX emissions from agricultural soil ...................................................................... 205 NMVOC emissions from agricultural soils ............................................................. 206 Particle emissions from farm-level agricultural operations ..................................... 206 Uncertainties ......................................................................................................... 207 Completeness........................................................................................................ 208 Source specific QA/QC .......................................................................................... 208 Use of pesticides ................................................................................................... 208
5.6 Field burning of agricultural wastes ....................................................................... 209 Description ............................................................................................................ 209 Method .................................................................................................................. 209 Activity data ........................................................................................................... 209 Emission factors .................................................................................................... 210 Uncertainties ......................................................................................................... 211 Completeness........................................................................................................ 211 Source specific QA/QC .......................................................................................... 211
5.7 Other agricultural emission sources ...................................................................... 211 Description ............................................................................................................ 211 NH3 emissions from treatment of straw ................................................................. 211
6 WASTE (NFR sector 5) ............................................................................................................ 213
6.1 Overview ............................................................................................................... 213 6.2 Solid waste disposal on land ................................................................................. 214
Description ............................................................................................................ 214 Method .................................................................................................................. 214 Activity data ........................................................................................................... 214
6.3 Compost production .............................................................................................. 215 Description ............................................................................................................ 215
6.4 Waste incineration ................................................................................................. 216 Description ............................................................................................................ 216 Method .................................................................................................................. 216 Activity data ........................................................................................................... 217 Emission factors .................................................................................................... 218 Uncertainties ......................................................................................................... 218 Source specific QA/QC .......................................................................................... 219
6.5 Waste water handling ............................................................................................ 219 Description ............................................................................................................ 219 Method .................................................................................................................. 219 Activity data ........................................................................................................... 219

4
6.6 Other emission sources from the waste sector ...................................................... 220 Description ............................................................................................................ 220 Method .................................................................................................................. 220 Activity data ........................................................................................................... 221 Emission factors .................................................................................................... 221 Uncertainties ......................................................................................................... 222 Source specific QA/QC .......................................................................................... 222
7 Other and Natural emissions ................................................................................................. 223
8 Recalculations and Improvements ......................................................................................... 224
8.1 Recalculations ....................................................................................................... 224 Overall description of the recalculations for the long-range transboundary air pollutants 224 Specific description of the recalculations ............................................................... 224 Implications of the recalculations for long-range transboundary air pollutants ...... 234
8.2 Planned improvements .......................................................................................... 236 Overview ............................................................................................................... 236 General .................................................................................................................. 236 Energy ................................................................................................................... 236 Industrial processes and product use .................................................................... 237 Agriculture ............................................................................................................. 237 Waste .................................................................................................................... 237
9 Projections.............................................................................................................................. 238
9.1 Introduction ............................................................................................................ 238 9.2 The baseline scenario ........................................................................................... 238 9.3 Methodology and key assumptions ....................................................................... 239
Macroeconomic assumptions and CO2 emissions from the mainland economy.... 239
10 Reporting on gridded emissions and LPS ......................................................................... 241
10.1 Gridded emissions ................................................................................................. 241 EMEP grid squares ................................................................................................ 241 Scope .................................................................................................................... 241 Recent improvements ............................................................................................ 241 Planned improvements .......................................................................................... 242
10.2 LPS ........................................................................................................................ 242
References .................................................................................................................................... 243
Appendix A ................................................................................................................................... 251
Tier 1 Key Category Analysis- Norway – 2017 submission ................................................ 251
Appendix B ................................................................................................................................... 267
Emission factors used in the estimations of emissions from combustion ........................... 267 SO2 and heavy metals - Stationary and mobile combustion ............................................... 268 Aviation - NOX, NMVOC, CO, particles and PAH ............................................................... 270 Road traffic - NOX, NMVOC, CO, NH3, particles and PAH ................................................. 272 Navigation - NOX, NMVOC, CO, particles and POPs ......................................................... 273 Other mobile sources including railways - NOX, NMVOC, CO, NH3, particles and POPs ... 275 Other mobile sources including railways - NOX, NMVOC, CO, NH3, particles and POPs ... 276 NOX - Stationary combustion .............................................................................................. 278 NMVOC - Stationary combustion ........................................................................................ 280 CO - Stationary combustion ................................................................................................ 281 NH3 - Stationary combustion .............................................................................................. 283 Particulate matter - Stationary combustion ......................................................................... 283 POPs (Persistent Organic Pollutants) - Stationary combustion .......................................... 286 Source: Emission factor: Finstad et al. (2001). PAH-profile: EEA (2013)POPs (Persistent Organic Pollutants)
- Stationary combustion ............................................................................................... 291
Appendix C.................................................................................................................................... 294

5
Uncertainty analysis ........................................................................................................... 294
Appendix D ................................................................................................................................... 299
Economic sectors in the Norwegian emission model .......................................................... 299
Appendix E .................................................................................................................................... 304
Source classifications used in the Norwegian emission inventory ...................................... 304
6
Executive Summary This report documents the methodologies used in the Norwegian emission inventory of
acidifying pollutants, particulate matters, heavy metals and persistent organic pollutants.
The Norwegian emission inventory is a joint undertaking between the Norwegian Environment
Agency1 and Statistics Norway. This report has been prepared by the Norwegian Environment
Agency in close collaboration with Statistics Norway’s Division for Energy and Environmental
Statistics.
The most important changes since the 2016 submission are:
Emissions from road traffic have been updated due to revised emission factors. NMVOC
and CO has decreased throughout the period. NOX has decreased for most years, but
increased for 2011-2014.
NMVOC and NOX from agriculture (3B manure management systems and 3D agricultural
soils) have been included in the emission inventory.
Emissions of PM2.5, PM10 and TSP from agriculture have been revised according to EMEP
guidelines 2016. Emissions from agricultural operations previously defined under source
3I are now defined under source 3D Agricultural soils. Emissions of PM from 3B (manure
management systems) are included for the first time.
Emissions of CO from production of aluminium have been included for all years 1990-
2014. This has led to an increase in emissions of CO by 13.9 to 57.8 per cent.
PAH-4 have been split into benzo(a)pyren, benzo(b)fluoranthen, benzo(k)fluoranthen
and indeno(1,2,3_cd)pyrene. Emission factors used for estimation of emissions of
benzo(a)pyren, benzo(b)fluoranthen, benzo(k)fluoranthen and indeno(1,2,3_cd)pyrene
are taken from EEA Guidebook 2013 and 2016, Finstad et al (2001) and Danish IIR
(Aarhus University 2016). The PAH profile has been measured at some aluminum
producing plants. This has also led to updated distribution of PAH-4 emissions from
aluminum production.
Emissions of SO2, NOX, NH3, NMVOC, CO and heavy metals from car fires have been
included. This has led to increased emissions. The increase for 2014 in emission of lead,
chromium and copper were 153, 0.7 and 5 kg respectively.
Chapter 8.1 Recalculations gives a more thorough description of changes in the most recent
emission calculations.
1 Former names are "Climate and Pollution Agency" and "Norwegian Pollution Control Authority".
7
1 Introduction
1.1 National Inventory Background
The Norwegian national inventory for long-range transboundary air pollutants includes emission
data for the years 1990-2015. The emissions covered in this report are those embraced by the
convention on long-range transboundary air pollution, i.e. they are defined with a territorial
delimitation. The calculation methods used and the documentation of these, are, as far as
possible, in accordance with the strict demands formulated in the emission convention.
1.2 Institutional arrangements
The Norwegian emissions inventories have been produced for about three decades as
collaboration between Statistics Norway (SSB) and the Norwegian Environment Agency.
Statistics Norway is responsible for the official statistics on emissions to air, and contributes to
the reporting to the UNECE. Their tasks include:
collection of activity data
operation and further development of models for emission estimation
emission calculations
filling in most of the tables for international reporting to UNECE
publishing national official statistics on emissions to air.
The Norwegian Environment Agency is responsible for:
international reporting to the UNECE
emission factors for all emission sources
measured emission data from large industrial plants based on individual reports
submitted to the Norwegian Environment Agency on a regular basis
considering the quality and assuring necessary updating, of emission models like, e.g.
the road traffic model.
Activity data2 are collected either internally at Statistics Norway (e.g. data on energy use,
industrial production, number of animals, etc.) or reported to Statistics Norway, and in some
cases to the Norwegian Environment Agency, from external sources such as the Norwegian
Petroleum Directorate (OD) and the Norwegian Public Roads Administration (VD). Emission
figures are derived from models operated by Statistics Norway. In the modelling activities
Statistics Norway makes use of the data collected by the Norwegian Environment Agency on
emission factors and emissions from industrial plants.
2 Data on the magnitude of human activity resulting in emissions or removals taking place during a given period of
time.

8
The Norwegian Environment Agency is responsible for quality control of the data they deliver to
the emission model operated by Statistics Norway, but Statistics Norway makes an additional
consistency check (see chapter 1.6). Statistics Norway is responsible for quality control of the
activity data and the emission figures from the model, and the Norwegian Environment Agency
also participates in this quality control before reporting to the UNECE.
1.3 Inventory preparation process
The Norwegian emission inventory is based on a general emission model and a series of more
detailed supplementary models, which cover specific emission sources and pollutants (e.g. road
traffic, air traffic, solvents). These smaller models feed results into the general model. All models
are operated by Statistics Norway.
Data and information on point sources are recorded at the Norwegian Environment Agency in
the database Forurensning and published in Norske utslipp (http://www.norskeutslipp.no). This
is the Norwegian Pollutant Release and Transfer Register (PRTR). Forurensning is a further
development of the old register Inkosys, which was introduced in 1978 as an internal tool for
the authorities. The database was upgraded in 1992, and has later been under continuous
development in order to harmonise with the PRTR adopted by the OECD in 1996. Each polluting
industrial installation or plant is subjected to licensing and is obliged to produce an annual
report to the pollution control authorities. The report should provide activity data, emission
figures and information about the particular source, and it should address compliance with
current environmental standards. The Norwegian Environment Agency supplies Statistics
Norway with data from the Norwegian PRTR which are relevant for the preparation of the
national emission inventory.
Pollutants included, data collection, processing and archiving
Statistics Norway collects the majority of data necessary to run the Norwegian emission model.
These are as follows: activity levels, emission factors, aggregated results from the smaller,
supplementary models and emission figures for point sources. Table 1.1 gives an overview of
pollutants included in the emission inventory which are restricted by CLRTAP.
9
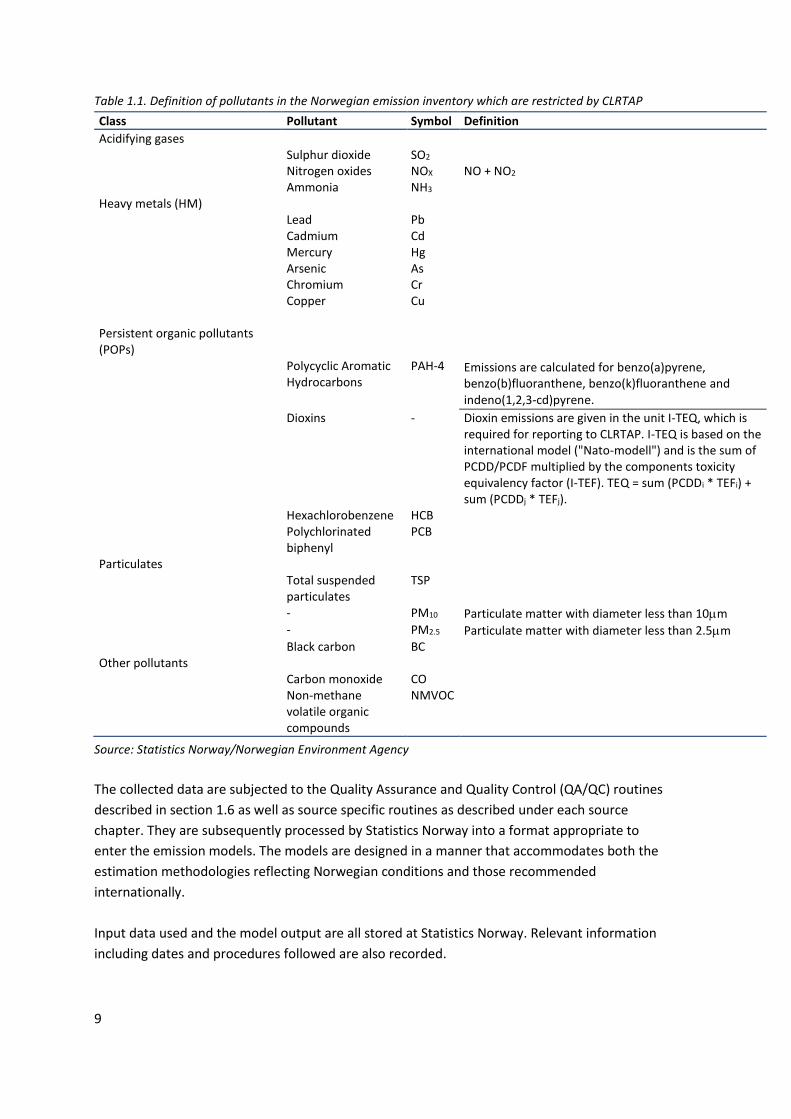
Table 1.1. Definition of pollutants in the Norwegian emission inventory which are restricted by CLRTAP
Class Pollutant Symbol Definition
Acidifying gases Sulphur dioxide SO2 Nitrogen oxides NOX NO + NO2 Ammonia NH3 Heavy metals (HM) Lead Pb Cadmium Cd Mercury Hg
Arsenic As Chromium Cr Copper Cu
Persistent organic pollutants (POPs)
Polycyclic Aromatic Hydrocarbons
PAH-4 Emissions are calculated for benzo(a)pyrene, benzo(b)fluoranthene, benzo(k)fluoranthene and indeno(1,2,3-cd)pyrene.
Dioxins - Dioxin emissions are given in the unit I-TEQ, which is required for reporting to CLRTAP. I-TEQ is based on the international model ("Nato-modell") and is the sum of PCDD/PCDF multiplied by the components toxicity equivalency factor (I-TEF). TEQ = sum (PCDDi * TEFi) + sum (PCDDj * TEFj).
Hexachlorobenzene HCB Polychlorinated
biphenyl PCB
Particulates
Total suspended
particulates TSP
- PM10 Particulate matter with diameter less than 10m - PM2.5 Particulate matter with diameter less than 2.5m Black carbon BC Other pollutants
Carbon monoxide CO Non-methane
volatile organic compounds
NMVOC
Source: Statistics Norway/Norwegian Environment Agency
The collected data are subjected to the Quality Assurance and Quality Control (QA/QC) routines
described in section 1.6 as well as source specific routines as described under each source
chapter. They are subsequently processed by Statistics Norway into a format appropriate to
enter the emission models. The models are designed in a manner that accommodates both the
estimation methodologies reflecting Norwegian conditions and those recommended
internationally.
Input data used and the model output are all stored at Statistics Norway. Relevant information
including dates and procedures followed are also recorded.

10
Definitions and structure
The structure of this documentation follows the nomenclature used for reporting to the
Convention on Long-Range Transboundary Air Pollution (CLRTAP) as Nomenclature For
Reporting (NFR14).
The main sectors here are:
NFR 1. Energy
NFR 2. Industrial processes and product use
NFR 3. Agriculture
NFR 6. Waste
The description of the pollutants included is given in Table 1.1.
Emissions of heavy metals, POPs and particulates are further described in the reports Finstad et
al. (2001), Finstad et al. (2002b), Finstad and Rypdal (2003) and Finstad et al. (2003). Emissions
of black carbon is described in Aasestad (2013), emissions of HCB in Aasestad (2014) and
emissions of PCB in Aasestad (2016).
Archiving
The national emission inventory is a part of Statistics Norway's data archiving system. All input
data to, and results from, the general Norwegian emission model from every publication cycle
are stored and documented in this system.
Several input data are used in preliminary calculations before entering into the general
Norwegian emission model. This includes supplementary models such as road traffic and air
traffic, as well as a number of simpler calculations that do not fit into the framework of the
general model. The preliminary calculations are not included in the central archiving system,
which is not suited for such a diverse collection of data. For some supplementary models there
is an established archiving routine where all input data and results from every calculation cycle
are stored.
1.4 Methods and data sources
This chapter describes the general structure of the Norwegian emission model. The model was
developed by Statistics Norway (Daasvatn et al. 1992), (Daasvatn et al. 1994). It was redesigned
in 2003 in order to improve reporting to the UNFCCC and UNECE, and to improve QA/QC
procedures.
The Norwegian emission model is organised around a general emission model called “Kuben”
(“the Cube”). Several emission sources, e.g. road traffic, air traffic and solvents are covered by
more detailed supplementary models. Aggregated results from the supplementary models are
used as input to the general model. The supplementary models are presented in the appropriate
sections of chapters 3-8. This chapter describes the general emission model.
11
Structure of the general emission model
The general emission model is based on equation (1.1).
(1.1) Emissions (E) = Activity level (A) Emission Factor (EF)
For emissions from combustion, the activity data concern energy use. In the Norwegian energy
balance, the use of different forms of energy is allocated to industries (economic sectors). In
order to calculate emissions to air, energy use must also be allocated to technical sources (e.g.
equipment). After energy use has been allocated in this way, the energy balance may be viewed
as a cube in which the three axes are fuels, industries and sources.
The energy use data are combined with a corresponding matrix of emission factors. In principle,
there should be one emission factor for each combination of fuel, industry, source and
pollutant. Thus, the factors may be viewed as a four-dimensional cube with pollutants as the
additional dimension. However, in a matrix with a cell for each combination, most of the cells
would be empty (no consumption). In addition, the same emission factor would apply to many
cells.
Emissions of some pollutants from major manufacturing plants (point sources) are available
from measurements or other plant-specific calculations. When such measured data are available
it is possible to replace the estimated values by the measured ones:
(1.2) Emissions (E) = [ (A - APS) EF] + EPS
where APS and EPS are the activity and the measured emissions at the point sources, respectively.
Emissions from activity for which no point source estimate is available (A-APS) are still estimated
with the regular emission factor.
Non-combustion emissions are generally calculated in the same way, by combining appropriate
activity data with emission factors. Some emissions may be obtained from current reports and
investigations, and some are measured directly as described in chapters 3-8. The emissions are
fitted into the general model using the parameters industry, source, and pollutant. The fuel
parameter is not relevant here. The source sector categories are based on EMEP/NFR
categories, with further subdivisions where more detailed methods are available.

12
The four axes: Pollutants, industries, fuels, and sources
The pollutants currently included in the model are listed in Table 1.1. The model uses
approximately 130 industries (economic sectors). The classification is common with the basis
data in the energy balance/accounts, and is almost identical to that used in the national
accounts, which is aggregated from the European NACE (rev. 2) classification. The large number
of sectors is an advantage in dealing with important emissions from manufacturing industries.
The disadvantage is an unnecessary disaggregation of sectors with very small emissions. To
make the standard sectors more appropriate for calculation of emissions, a few changes have
been made, e.g. "Private households" is defined as a sector.
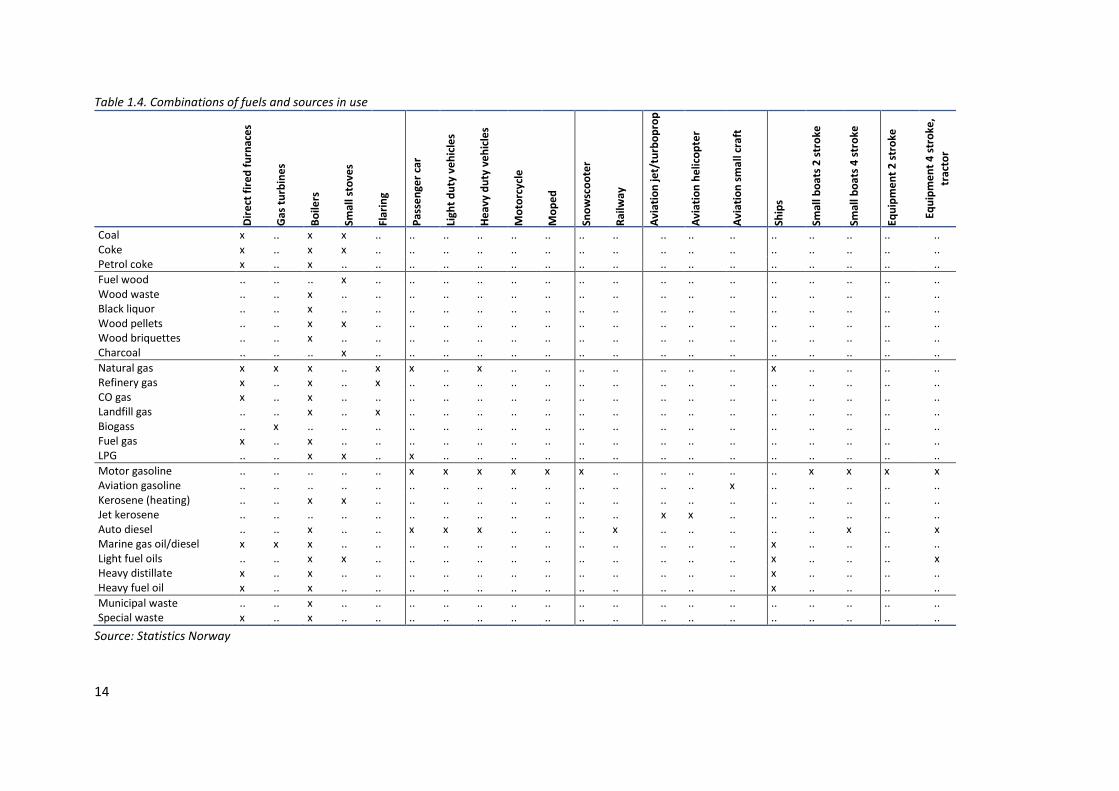
The fuels and technical sources used for combustion with energy use (NFR source sector 1A) are
shown in Table 1.2, Table 1.3 and Table 1.4.
Table 1.2. Energy commodities in the Norwegian emission inventory
Energy commodity Aggregate fuel category in NFR
Coal Solid Fuels Coke Solid Fuels Petrol coke Liquid Fuels Wood Biomass Wood waste Biomass Black liquor Biomass Wood pellets Biomass Wood briquettes Biomass Charcoal Biomass Natural gas Gaseous Fuels Refinery gas Liquid Fuels CO gas Solid Fuels Landfill gas Biomass Biogas Biomass Fuel gas Liquid Fuels LPG Liquid Fuels Gasoline (road transport) Liquid Fuels Aviation gasoline Liquid Fuels Kerosene (heating) Liquid Fuels Jet kerosene Liquid Fuels Autodiesel Liquid Fuels Marine gas oil Liquid Fuels Light fuel oils Liquid Fuels Heavy distillate Liquid Fuels Heavy fuel oil Liquid Fuels Municipal waste Other Fuels Special waste* Other Fuels
* Special waste was moved from Liquid to Other fuels in 2014.
Source: Statistics Norway/Norwegian Environment Agency
13
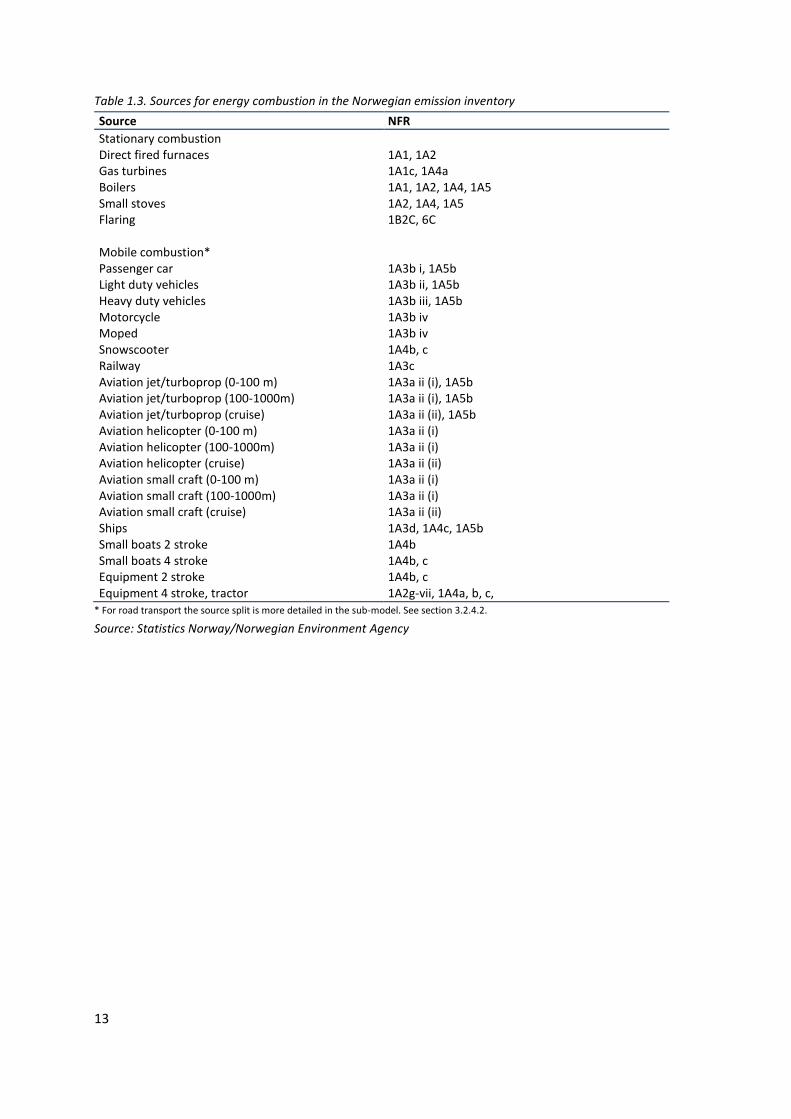
Table 1.3. Sources for energy combustion in the Norwegian emission inventory
Source NFR
Stationary combustion Direct fired furnaces 1A1, 1A2 Gas turbines 1A1c, 1A4a Boilers 1A1, 1A2, 1A4, 1A5 Small stoves 1A2, 1A4, 1A5 Flaring 1B2C, 6C Mobile combustion* Passenger car 1A3b i, 1A5b Light duty vehicles 1A3b ii, 1A5b Heavy duty vehicles 1A3b iii, 1A5b Motorcycle 1A3b iv Moped 1A3b iv Snowscooter 1A4b, c Railway 1A3c Aviation jet/turboprop (0-100 m) 1A3a ii (i), 1A5b Aviation jet/turboprop (100-1000m) 1A3a ii (i), 1A5b Aviation jet/turboprop (cruise) 1A3a ii (ii), 1A5b Aviation helicopter (0-100 m) 1A3a ii (i) Aviation helicopter (100-1000m) 1A3a ii (i) Aviation helicopter (cruise) 1A3a ii (ii) Aviation small craft (0-100 m) 1A3a ii (i) Aviation small craft (100-1000m) 1A3a ii (i) Aviation small craft (cruise) 1A3a ii (ii) Ships 1A3d, 1A4c, 1A5b Small boats 2 stroke 1A4b Small boats 4 stroke 1A4b, c Equipment 2 stroke 1A4b, c Equipment 4 stroke, tractor 1A2g-vii, 1A4a, b, c,
* For road transport the source split is more detailed in the sub-model. See section 3.2.4.2.
Source: Statistics Norway/Norwegian Environment Agency
14
Table 1.4. Combinations of fuels and sources in use
Dir
ect
fir
ed
fu
rnac
es
Gas
tu
rbin
es
Bo
ilers
Smal
l sto
ves
Flar
ing
Pas
sen
ger
car
Ligh
t d
uty
ve
hic
les
He
avy
du
ty v
eh
icle
s
Mo
torc
ycle
Mo
pe
d
Sno
wsc
oo
ter
Rai
lway
Avi
atio
n je
t/tu
rbo
pro
p
Avi
atio
n h
elic
op
ter
Avi
atio
n s
ma
ll cr
aft
Ship
s
Smal
l bo
ats
2 s
tro
ke
Smal
l bo
ats
4 s
tro
ke
Equ
ipm
en
t 2
str
oke
Equ
ipm
en
t 4
str
oke
,
trac
tor
Coal x .. x x .. .. .. .. .. .. .. .. .. .. .. .. .. .. .. .. Coke x .. x x .. .. .. .. .. .. .. .. .. .. .. .. .. .. .. .. Petrol coke x .. x .. .. .. .. .. .. .. .. .. .. .. .. .. .. .. .. ..
Fuel wood .. .. .. x .. .. .. .. .. .. .. .. .. .. .. .. .. .. .. .. Wood waste .. .. x .. .. .. .. .. .. .. .. .. .. .. .. .. .. .. .. .. Black liquor .. .. x .. .. .. .. .. .. .. .. .. .. .. .. .. .. .. .. .. Wood pellets .. .. x x .. .. .. .. .. .. .. .. .. .. .. .. .. .. .. .. Wood briquettes .. .. x .. .. .. .. .. .. .. .. .. .. .. .. .. .. .. .. .. Charcoal .. .. .. x .. .. .. .. .. .. .. .. .. .. .. .. .. .. .. ..
Natural gas x x x .. x x .. x .. .. .. .. .. .. .. x .. .. .. .. Refinery gas x .. x .. x .. .. .. .. .. .. .. .. .. .. .. .. .. .. .. CO gas x .. x .. .. .. .. .. .. .. .. .. .. .. .. .. .. .. .. .. Landfill gas .. .. x .. x .. .. .. .. .. .. .. .. .. .. .. .. .. .. .. Biogass .. x .. .. .. .. .. .. .. .. .. .. .. .. .. .. .. .. .. .. Fuel gas x .. x .. .. .. .. .. .. .. .. .. .. .. .. .. .. .. .. .. LPG .. .. x x .. x .. .. .. .. .. .. .. .. .. .. .. .. .. ..
Motor gasoline .. .. .. .. .. x x x x x x .. .. .. .. .. x x x x Aviation gasoline .. .. .. .. .. .. .. .. .. .. .. .. .. .. x .. .. .. .. .. Kerosene (heating) .. .. x x .. .. .. .. .. .. .. .. .. .. .. .. .. .. .. .. Jet kerosene .. .. .. .. .. .. .. .. .. .. .. .. x x .. .. .. .. .. .. Auto diesel .. .. x .. .. x x x .. .. .. x .. .. .. .. .. x .. x Marine gas oil/diesel x x x .. .. .. .. .. .. .. .. .. .. .. .. x .. .. .. .. Light fuel oils .. .. x x .. .. .. .. .. .. .. .. .. .. .. x .. .. .. x Heavy distillate x .. x .. .. .. .. .. .. .. .. .. .. .. .. x .. .. .. .. Heavy fuel oil x .. x .. .. .. .. .. .. .. .. .. .. .. .. x .. .. .. ..
Municipal waste .. .. x .. .. .. .. .. .. .. .. .. .. .. .. .. .. .. .. .. Special waste x .. x .. .. .. .. .. .. .. .. .. .. .. .. .. .. .. .. ..
Source: Statistics Norway
IIR 2017
15
The sources for non-combustion emissions and for combustion without energy use are based on
EMEP/NFR categories, with further subdivisions where more detailed methods are available.
1.5 Key Categories
Information about key categories is given in Appendix A.
1.6 QA/QC and Verification methods
This chapter describes general QA/QC procedures. For source specific QA/QC, see each source
sector for detailed descriptions.
The QA/QC work has several dimensions. In addition to accuracy, also timeliness is essential. As
these two aspects may be in conflict, the QA/QC improvements in recent years have been
focused on how to implement an effective QA/QC procedure and how to obtain a more efficient
dataflow in the inventory system.
During the past years several quality assurance and quality control procedures for the
preparation of the national emission inventory have been established in Norway. Statistics
Norway made its first emission inventory for some gases in 1983 for the calculation year 1973.
The emission estimation methodologies and the QA/QC procedures have been developed
continuously since then. Norway has implemented a formal quality assurance/quality control
plan, which covers the reporting of long-range transboundary air pollution as well as
greenhouse gases. A detailed description of this is presented in Annex V in the National
Inventory Report 2016 (NEA 2016).
The established QA/QC procedures include the following:
The Norwegian Environment Agency is the national entity designated to be responsible
for the reporting of the national inventory of greenhouse gases to the UNFCCC and the
reporting of long-range transboundary air pollution to the UNECE. This includes
coordination of the QA/QC procedures;
Statistics Norway is responsible for the quality control system with regard to technical
activities of the inventory preparation;
General inventory level QC procedures, as listed in table 6.1 in chapter 6 of the 2006
IPCC Guidelines (IPCC 2006), is performed every year;
Source category-specific QC procedures are performed for all key categories and some
non-key categories; with regard to emission factors, activity data and uncertainty
estimates.
QA Procedures
According to the IPCC Good practice guidance, good practice for QA procedures requires an
objective review to assess the quality of the inventory and to identify areas where
improvements could be made. Furthermore, it is good practice to use QA reviewers that have

IIR 2017
16
not been involved in preparing the inventory. In Norway, the Norwegian Environment Agency is
responsible for reviewing the inventory with regard to quality and areas for improvement. For
most source categories it is a person within the Norwegian Environment Agency who has not
been involved in the calculations and the quality controls who performs the QA for the
particular source.
Norway has performed several studies comparing inventories from different countries
(Haakonsen et al. 2000). Verification of emission data is another element to be assessed during
the elaboration of a QA/QC and verification plan.
Both Statistics Norway and the Norwegian Environment Agency are responsible for archiving the
data they collect and the estimates they calculate with associated methodology documentation
and internal documentation on QA/QC. Due to the differences in the character of data collected,
Norway has chosen to keep archiving systems in the separate institutions, which means that not
all information is archived at a single location. These archiving systems are, however, consistent,
and operate under the same rules. Although the data are archived separately, all can be
accessed efficiently during a review.
General QC procedures
The Norwegian emission inventory is produced in several steps. Preliminary estimates are first
produced by Statistics Norway 4-5 months after the end of the inventory year. These data are
based on preliminary statistics and indicators and data that have been subjected to a less
thorough quality control. The "final" update takes place about one year after the inventory year.
At this stage, final statistics are available for all sources. Recalculations of the inventory are
performed annually, as methodological changes and refinements are implemented. In itself, this
stepwise procedure is a part of the QA/QC-procedure since all differences in data are recorded
and verified.
For each of the steps described above, general quality control procedures are performed, but
with different levels of detail and thoroughness as mentioned. The national emission model was
revised in 2002 in order to facilitate the QC of the input data rather than the emission data only.
Input data include emissions reported from large plants, activity data, emission factors and
other estimation parameters.
In the following, the procedures listed in table 6.1 in chapter 6 of the 2006 IPCC Guidelines (IPCC
2006), are described, as well as how these checks are performed for the Norwegian emission
inventory.
Check that assumptions and criteria for the selection of activity data and emissions factors are
documented
Thorough checks of emission factors and activity data and their documentation have been
performed for existing emission sources. When new sources appear (for example a new
industrial plant) or existing sources for the first time are recognised as a source, the Norwegian
Environment Agency delivers all relevant information to Statistics Norway. This information is
IIR 2017
17
then thoroughly checked by the inventory team at Statistics Norway. All changes in
methodologies or data are documented and kept up to date.
Check for transcription errors in data input and references
Activity data are often statistical data. Official statistical data undergo a systematic revision
process, which may be manual or, increasingly frequently, computerised. The revision
significantly reduces the number of errors in the statistics used as input to the inventory.
Furthermore, all input data (reported emissions, emission factors and activity data) for the latest
inventory year are routinely compared to those of the previous inventory year, using automated
procedures. Large changes are automatically flagged for further, manual QC. In addition, implied
emission factors are calculated for emissions from stationary combustion at point sources. The
IEFs are subjected to the same comparison between the years t and t-1. The most thorough
checks are made for the gases and categories with the largest contribution to total emissions.
Check that emissions are calculated correctly
When possible, estimates based on different methodologies are compared. The Norwegian
Environment Agency and Statistics Norway control and verify emission data reported to the
Norwegian Environment Agency by industrial enterprises, registered in the database
Forurensning. First, the Norwegian Environment Agency checks the data received from these
plants, and if errors are discovered, they may then ask the plants’ responsible to submit new
data. Subsequently, Statistics Norway makes, where possible, occasional comparable emission
calculations based on activity data sampled in official statistics, and deviations are explained
through contact with the plants.
Check that parameter and emission units are correctly recorded and that appropriate conversion
factors are used
All parameter values are compared with values used in previous years and with any preliminary
figures available. Whenever large deviations are detected, the value of the parameter in
question is first checked for typing errors or unit errors. Changes in emissions from large plants
are compared with changes in activity level. If necessary, the primary data suppliers (e.g. The
Norwegian Petroleum Directorate, Norwegian Public Roads Administration, various plants etc.)
are contacted for explanations and possible corrections.
Check the integrity of database files
Control checks of whether appropriate data processing steps and data relationships are
correctly represented are made for each step of the process. Furthermore, it is verified that data
fields are properly labelled and have correct design specifications and that adequate
documentation of database and model structure and operation are archived.
Check that the movement for inventory data among processing steps is correct
Statistics Norway has established automated procedures to check that inventory data fed into
the model does not deviate too much from the figures for earlier years, and that the calculations
within the model are correctly made. Checks are also made that emissions data are correctly
transcribed between different intermediate products. The model is constructed so that it gives

IIR 2017
18
error messages if factors are lacking, which makes it quite robust to miscalculations.
Check that uncertainties in emissions and removals are estimated correctly
For long-range transboundary air pollutants the last uncertainty analysis was undertaken in
2001. See further information about the uncertainty analysis in section 1.7 and Appendix C.
Undertake review of internal documentation
For some sources, expert judgements dating some years back are employed with regard to
activity data/emission factors. In most of the cases these judgements have not been reviewed
since then, and may not be properly documented, which may be a weakness of the inventory.
The procedures have improved the last few years, and the requirements for internal
documentation to support estimates are now quite strict; all expert judgements and
assumptions made by the Statistics Norway staff should be documented. This should increase
reproducibility of emissions and uncertainty estimates. The model at Statistics Norway has
improved the process of archiving inventory data, supporting data and inventory records, which
does facilitate review. The model runs are stored and may be reconstructed, and all input data
from the Norwegian Environment Agency as well as notes with explanations on changes in
emissions are stored. This is a continuous process of improvement at Statistics Norway.
Check of changes due to recalculations
Emission time series are recalculated every year to ensure time series consistency. The
recalculated emission data for a year is compared with the corresponding figures estimated the
year before. The intention is to explain all major differences as far as possible. Changes may be
due to revisions in energy data, new plants, correction of former errors and new emission
methodologies.
Undertake completeness checks
Estimates are reported for all source categories and for all years as far as we know, apart from a
few known data gaps, which are listed in section 1.8. There may, of course, exist sources which
are not covered. However, we are quite certain that emissions from potentially additional
sources are very small or negligible. During comparisons with previous emission estimates, any
emission calculations that have been erroneously omitted during the most recent production
cycle will be identified and included.
Compare estimates to previous estimates
Internal checks of time series for all emission sources are performed every year when an
emission calculation for a new year is done. It is then examined whether any detected
inconsistencies are due to data or/and methodology changes. For example, in 2016 Statistics
Norway/the Norwegian Environment Agency calculated emission data for 2015 for the first time.
These data were compared with the 2014 figures for detection of any considerable deviations.
Some large deviations may be correct, caused for instance by the shutdown of large industrial
plants or the launch of new ones.

IIR 2017
19
Source category-specific QC procedures
Statistics Norway and the Norwegian Environment Agency have carried out several studies on
specific emission sources, e.g. emissions from road, sea, and air transport. These projects are
repeated in regular intervals when new information is available. During the studies, emission
factors have been assessed and amended in order to represent the best estimates for national
circumstances, and a rational for the choice of emission factor is provided. The emission factors
are often compared with default factors from the most recent EMEP/EEA air pollutant inventory
guidebook and emission factors from other literature. Furthermore, activity data have been
closely examined and quality controlled.
The QC procedures with regard to emission data, activity data and uncertainty estimates for the
different emission sources are described in the QA/QC-chapters of the relevant source-
categories. The source category-specific analyses have primarily been performed for key
categories on a case-by-case basis, which is described as being good practice. The QA/QC
process for many of the sources could be improved.
In the following is a more detailed description of QC of emission data reported from plants:
Plant emission data that are used in the European Emission trading system (EU-ETS) will undergo
annual QC checks. Activity data and emission estimates from plants that are included in the EU-
ETS undergoes annual third-party verification. The source-specific QC checks for other plants are
performed as part of the controls of the reporting under the emission permits.
The plant specific data undergo further QC from the emission inventory team at the Norwegian
Environment Agency before figures are sent to Statistics Norway for inclusion in the emission
inventory. Statistics Norway is responsible for reporting the results of the key category analysis
to the Norwegian Environment Agency, and the agency places special emphasis on plants that
belong to key categories.
At some point since the inclusion in the inventory, each plant has been QC checked more
thoroughly, including:
An assessment of the internal QA/QC of the plants reporting data to the Norwegian
Environment Agency
Their QA/QC system including archiving
Any changes to the QA/QC system
An assessment and documentation of measurements and sampling
Measurement frequency
Sampling
Use of standards (e.g. ISO)
Documentation for archiving
An assessment and explanation of changes in emissions over time (e.g. changes in
technology, production level or fuels) (annual check)
IIR 2017
20
An assessment of time-series consistency back to 1990 (if plant emission data are missing for
some years and estimates are made using aggregate activity data and emission factors)
A comparison of plant emissions to production ratios with those of other plants, including
explanations of differences
A comparison of the production level and/or fuel consumption with independent statistics
An assessment of reported uncertainties (including statistical and non-statistical errors) to
the extent this has been included in the reporting
The QC checks are made in close cooperation with the emission reporting plants. For more
details of QA/QC of specific source categories, see “source specific QA/QC” in relevant chapters.
Verification studies
In general, the final inventory data provided by Statistics Norway are checked and verified by
the Norwegian Environment Agency.
In the following, some verification studies which have been performed are briefly described.
Emission estimates for a source are often compared with estimates performed with a different
methodology.
In 2004, the Nordic Council of Ministers initiated a new project that was finalised in 2006. This
project focused on NMVOC, heavy metals and POPs. An unpublished, final report has been
worked out, containing the following elements:
comparisons of the emission estimation methodologies and emission factors used in
each country (review)
identification of gaps in knowledge
identification of possible "burden sharings" with respect to research areas (research
taking place in one country, but used in all countries)
discussions of the particular Nordic aspects influencing the emissions
discussions of the possible contributions from research in the Nordic countries
proposals for research areas
In 2006, the Nordic Council of Ministers initiated a new project that was finalised in 2010. This
project focused on emission of particulate matter. The final report contains the following
elements:
comparisons of the emission estimation methodologies and emission factors used in
each country (review)
identification of gaps in knowledge
discussions of the particular Nordic aspects influencing the emissions
discussions of the possible contributions from research in the Nordic countries
proposals for research areas
recommendations for further work
In 2015, a Nordic project started, financed by the Nordic Council of Ministers, with the aim to

IIR 2017
21
improve the Nordic emission inventories on heavy metals and POP compounds. In the proposed
programme the experts working with air pollutant inventories in Denmark, Finland, Iceland,
Norway and Sweden will have a yearly meeting for knowledge exchange. The main focus is to
compare emission factors and methodologies used, inform about national studies performed,
and study and set up further plans to develop national air pollution inventories, especially for
emission sources where studies and other Nordic information sources can be used in developing
methodologies suitable for Nordic countries.
1.7 General uncertainty evaluation
Acidifying substances and NMVOC
The emission estimates for long-range air pollutants in the Norwegian emission model may be
ranked roughly in order of increasing uncertainty as follows:
SO2 < NOX < NH3 NMVOC
The sources of uncertainty in the emission estimates include sampling errors, poor relevance of
emission factors or activity data, and gross errors.
Evaluation of the uncertainty in the long-range air pollutants is given in the report Rypdal and
Zhang (2001). Summary tables with the results are given in Appendix C.
Heavy metals and POPs
The uncertainty is generally higher for HM and POPs than for other components in the
Norwegian emission model except for N2O. There are various reasons for this high uncertainty.
The most important reason is that there is limited information about emission factors, and it is
not clear how usable the emission factors found in international literature are for Norwegian
conditions. Emission factors for some HM and POPs components are insufficient for some
sources, so emission factors for similar sources have then been used. In addition it is not certain
that all emission sources are known or sufficiently mapped. The industrial reporting to the
Norwegian Environment Agency has improved in recent years. The reported figures can,
however, vary a great deal from one year to another. For earlier years they can be insufficient,
and since HM and POPs are to be calculated from 1990, recalculations are necessary. These
recalculations are based on a combination of assumptions and knowledge of the plants.
Emission figures from the early 1990s are therefore more uncertain than figures produced
today.
1.8 General Assessment of Completeness
Norway is requested to report emissions to UNECE for the pollutants restricted by CLRTAP
(Convention on Long-Range Transboundary Air Pollution). Minimum reporting request each year
includes the acidifying pollutants (NOX, SO2, NH3) and NMVOC, the heavy metals Pb, Cd and Hg,
IIR 2017
22
particulate matter (TSP, PM10 and PM2.5), CO and the POPs dioxins, Benzo(a)pyrene,
benzo(b)fluoranthene, benzo(k)fluoranthene and indeno(1,2,3-cd)pyrene (PAH-4), HCB and PCB.
Norway also voluntary reports the heavy metals As, Cr and Cu and BC.
In terms of spatial coverage, the calculated air emissions cover all activities within Norway's
jurisdiction.
In the case of temporal coverage, emission figures for CO, SO2, NOX, NH3 and NMVOC are
produced and updated every year for all years from 1990. For HM, POPs, particles and BC,
emission figures are also produced for all years from 1990.
With regard to sectoral coverage, sources with relevant emission amounts which are not
covered in the inventory even if emissions can be expected, have been reported as Not
Estimated (NE) in the reported NFR tables. The following sources are not covered, even if
emissions might be expected:
Energy sector:
NH3 emissions from Energy Industries (1A1), from stationary combustion in
manufacturing industries and construction: Non-ferrous metals (1A2b), Pulp, Paper and
Print, Food processing(1A2d), beverages and tobacco (1A2e), from National Navigation
(1A3dii), from stationary combustion: in Commercial/Institutional (1A4i),
Agriculture/Forestry/Fishing (1A4ci), from Fishing (1A4ciii) and from Venting and Flairing
(1B2c)
NH3 and PCB emissions from Civil aviation, domestic and international LTO (1A3aii (i)
and 1A3ai (i))
Emissions of particulate matters (PM) from clutch wear (1A3b)
Emissions of PM from use of unpaved roads (1A3b)
Emissions of PM from sand strewing (1A3b)
Emissions of PM from Mopeds & motorcycles (1A3biv)
Emissions of HCB from Railways (1A3c), from Other sectors: mobile sources (1A4)
Fugitive emissions of NMVOC, PM, HM and PAH from solid fuel transformation (1B1b)
Fugitive emissions of SO2 from oil (exploration, production, transport) (1B2ai) and from
natural gas (by land-based desulphurisation) (1B2b)
Industry sector:
Emissions of NMVOC and PM from asphalt roofing (2D3c)
Emissions of CO and NH3 from ammonia production (2B1)
Agricultural sector:
Emission of NOX from Urine and dung deposited by grazing animals (3Da2)
Emission of NH3 from crop residues applied to soils (3Da4)
Emission of NMVOC and NH3 from cultivated crops (3De)
Waste sector:

IIR 2017
23
Emissions of NMVOC from composting (5B1) and NH3 from biogas facilities (5B2)
Emissions of NMVOC and NH3 from waste incineration (5C1)
Emissions from sewage sludge incineration (5C1biv) and open burning of waste (5C2)
Emissions of NH3 from waste-water handling (5D)
Evaporation of Hg from landfills and emission of Pb by detonation of explosives (5E)
Emissions of dioxins by smoking processes for preservation of meat and fish (5E)
The reasons for not including these emission sources are mainly lack of activity data, emission
factors or known calculation methodology.
In each sector chapter more details about completeness is given.

IIR 2017
24
2 Explanation of key trends
2.1 Acidifying substances and NMVOC
Total acidifying emission
Emissions of gases that transform into acid can be expressed in terms of acid equivalents. Total
emissions of the three gases NOX, SO2 and NH3 measured as acid equivalents have been reduced
by 27 per cent since 1990, from 7 350 tonnes acid equivalents to 5 370 tonnes acid equivalents.
SO2 and NOX emissions have been reduced by 69 and 24 per cent since 1990, respectively, while
NH3 emissions have increased by 12 per cent. In 1990, NOX constituted 59 per cent of the
acidifying emissions, NH3 19 per cent and SO2 22 per cent, while, in 2015, NOX, NH3 and SO2
were responsible for 61, 29 and 10 per cent of these emissions, respectively. Norway has met
the 2010 targets defined by the Gothenburg Protocol for SO2, NMVOC and NOX while NH3
emissions are still above the Gothenburg 2010 target. NOX target has only been met since 2015.
2020 targets defined by the revised Gothenburg Protocol have already been met for SO2 and
NOX.
Figure 2.1. Trends in emissions for NOX, SO2, NH3 and NMVOC. 1990-2015. Index 1990 = 100%
Source: Statistics Norway/Norwegian Environment Agency
NOX
2010 commitment of the Gothenburg Protocol: 156 000 tonnes.
2020 commitment of the revised Gothenburg Protocol: a 23 per cent reduction
compared to emissions in 2005, 156 700 tonnes.
Norway's NOX emissions totaled 151 300 tonnes in 2015. The 2010 commitment of the

IIR 2017
25
Gothenburg Protocol for NOX emissions was reached in 2015 by approximately 5 500 tonnes. In
2015, emissions have also been lower than the 2020 commitment of the Gothenburg Protocol.
NOX emissions have been reduced by 24 per cent since 1990 and by 4 per cent since 2014. The
biggest sources of NOX emissions in 2015 were energy industries and transport, accounted for
33 and 34 per cent of the total emission, respectively. Emissions in the energy industries sector
overall have increased by 79 per cent since 1990 while emissions from the transport sector
overall have been reduced by 46 per cent since 1990.
In the energy industries sector, manufacturing of solid fuels and other energy industries
accounts for 95 per cent, and have increased by 90 per cent since 1990. The transport reduction
figure nonetheless hides significant changes within the transport sector: emissions from
domestic and international aviation have increased by 134 per cent and 431 per cent
respectively since 1990, whereas emissions from passenger cars have been reduced by 65 per
cent.
Figure 2.2. Trends in NOX emissions, 1990-2015. 1000 tonnes
Source: Statistics Norway/Norwegian Environment Agency
Emissions from aviation have increased primarily due to increased traffic. Within road transport,
traffic has also increased significantly from 1990 to 2015. NOX emissions have however been
reduced due to policy measures. Stricter emission requirements for new passenger cars, heavy
duty vehicles and buses is the main cause of the reduction.
Emissions from national navigation have been reduced by 41 per cent since 1990. The reduced
emissions in navigation are partly due to measures implemented by the NOX Fund, which is
financed by industry and businesses. The measures are not directly linked to fuel efficiency, and
energy consumption in national navigation has not had the same decrease as the emissions.
Passenger cars was the largest emission source within transport between 1990 and 1992. Since
IIR 2017
26
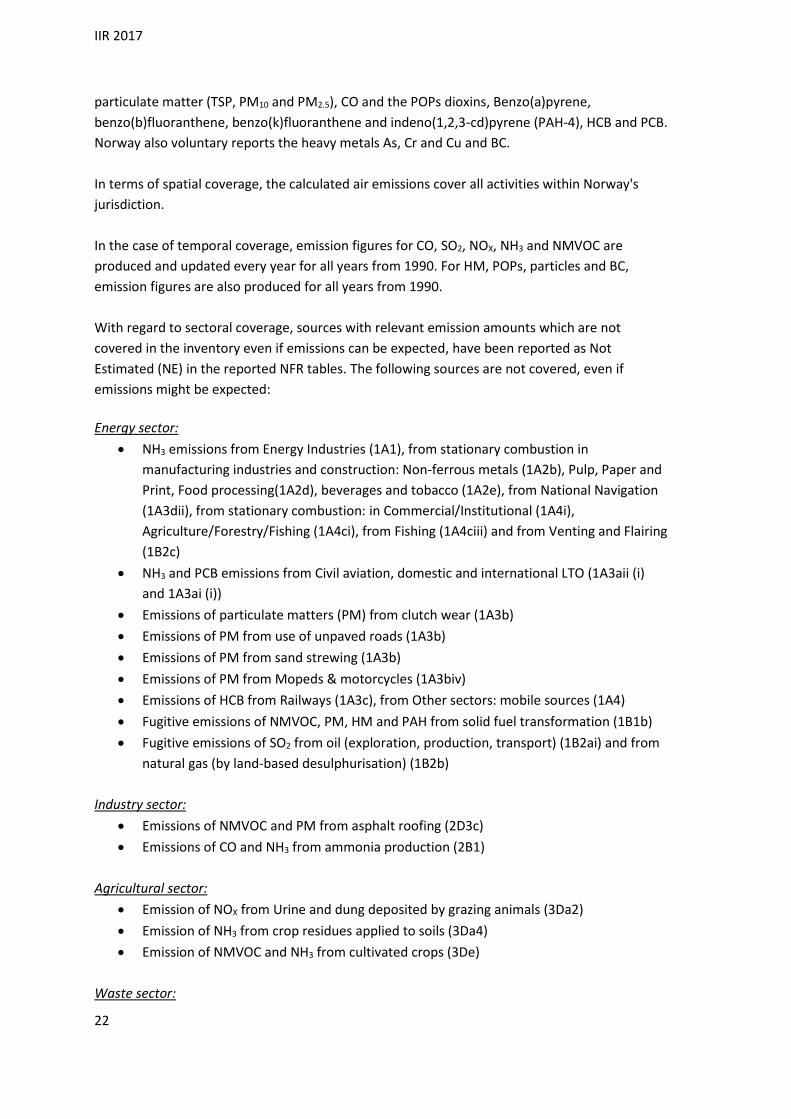
1993, national navigation has been the largest emission source. In 2015, it is responsible of 34
per cent of emissions within the transport sector. Passenger cars and heavy duty vehicles
followed, representing both 24 per cent.
Figure 2.3. Distribution of NOX emissions between emission sources, 2015. Per cent
Source: Statistics Norway/Norwegian Environment Agency
The third largest source of NOX emissions in 2015 was “other combustion” (NFR 1A4 and 1A5),
accounting for 14 per cent of the total NOx emissions. National fishing is the largest source of
emissions within the sector.
SO2
2010 commitment of the Gothenburg Protocol: 22 000 tonnes.
2020 commitment of the revised Gothenburg Protocol: a 10 per cent reduction
compared to emissions in 2005, 21 600 tonnes.
Norway's SO2 emissions totaled 16 300 tonnes in 2015. Both the 2010 and 2020 commitments of
the Gothenburg Protocol for SO2 emissions have been fulfilled since 2006.
The SO2 emissions in Norway in 2015 have been reduced by 69 per cent since 1990. This has
been achieved by pollution control, the closure of pollution-generating businesses, a reduction
of sulfur content in petroleum products and a reduced consumption of petroleum products.
Emissions have been reduced by 1 per cent between 2014 and 2015.
Metal industry was the largest source of SO2 emissions in 2015 representing 48 per cent of total
emissions. Emissions from this sector have been reduced by 54 per cent since 1990, primarily
due to reductions in the ferroalloys production. Nonetheless, the production of ferroalloys
IIR 2017
27
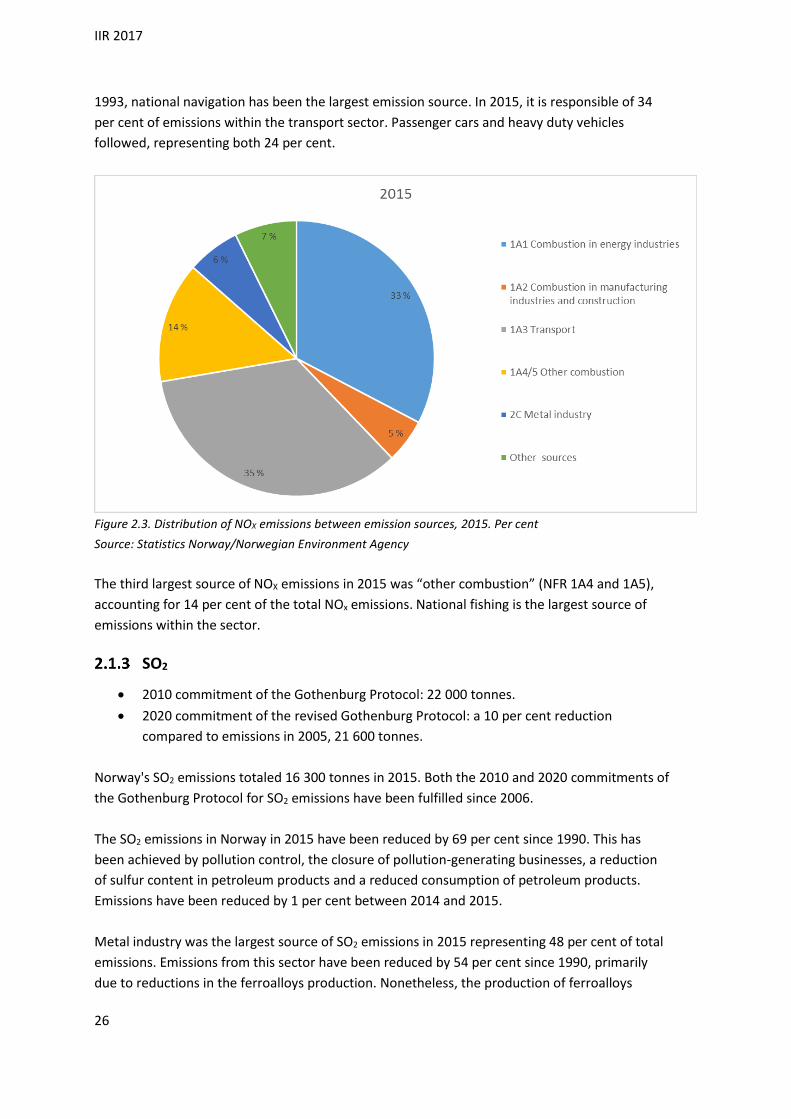
remains the most significant source of emissions within this category, being responsible for 71
per cent of emissions from the metal industry in 2015.
Figure 2.4. Trends in SO2 emissions, 1990-2015. 1000 tonnes
Source: Statistics Norway/Norwegian Environment Agency
Transport constituted 5 per cent of total emissions of SO2 in 2015. Emissions from transport
have been reduced by 90 per cent since 1990, mainly due to less sulphur content in fuels. Most
of the reduction took place at the beginning of the period. Indeed, in 1994, emissions were
reduced by almost 60 per cent compared to 1990.
Emissions from all transport subcategories have been reduced. Notably, there are currently only
significant emissions from national navigation (shipping) in this category, representing, in 2015,
84 per cent of the SO2 emissions in the transport category.
Emissions from combustions in manufacturing industries and construction have decreased by 86
per cent since 1990, whilst emissions from chemical industries, including carbide production,
have decreased with 88 per cent. The reduction is a result of lower production and closure of
two plants. In 2015, these two categories contributed to 6 and 4 per cent of total SO2 emissions,
respectively.
IIR 2017
28
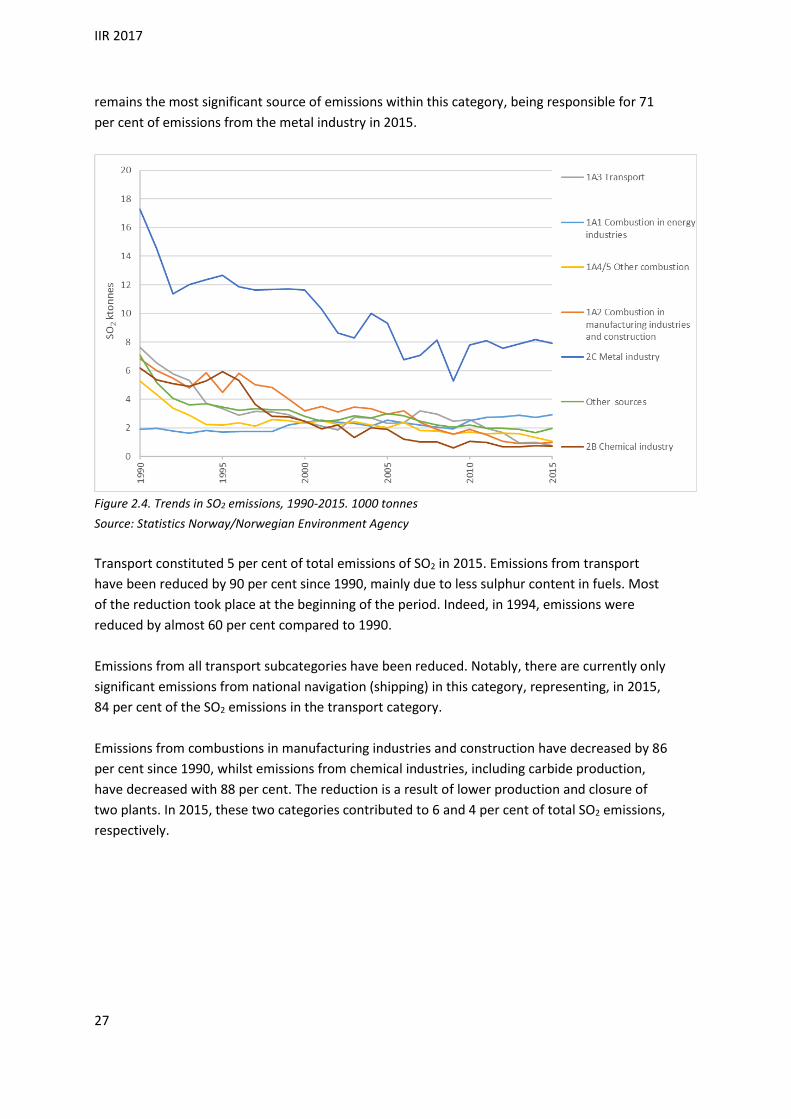
Figure 2.5. Distribution of SO2 emissions between emission sources, 2015. Per cent
Source: Statistics Norway/Norwegian Environment Agency
NH3
2010 commitment of the Gothenburg Protocol: 23 000 tonnes.
2020 commitment of the revised Gothenburg Protocol: an 8 per cent reduction
compared to emissions in 2005, 24 600 tonnes.
Norway's NH3 emissions totaled 26 700 tonnes in 2015. The 2010 commitment of the
Gothenburg Protocol for NH3 emissions has not been fulfilled yet. Despite the fact that the
revised commitment for 2020 is higher than the 2010 commitment, it will demand further
reductions.
The Norwegian emissions of NH3 increased by about 12 per cent from 1990 to 2015. From 2014
to 2015, the emissions decreased by 0.5 per cent. The most important reasons for the increase
in emissions from 1990 are higher emissions from agriculture and higher emissions from private
cars fitted with three-way catalytic converters. One important reason to the increased emissions
from agriculture are higher protein content in cattle fodder, which gives higher nitrogen content
in the cattle manure.
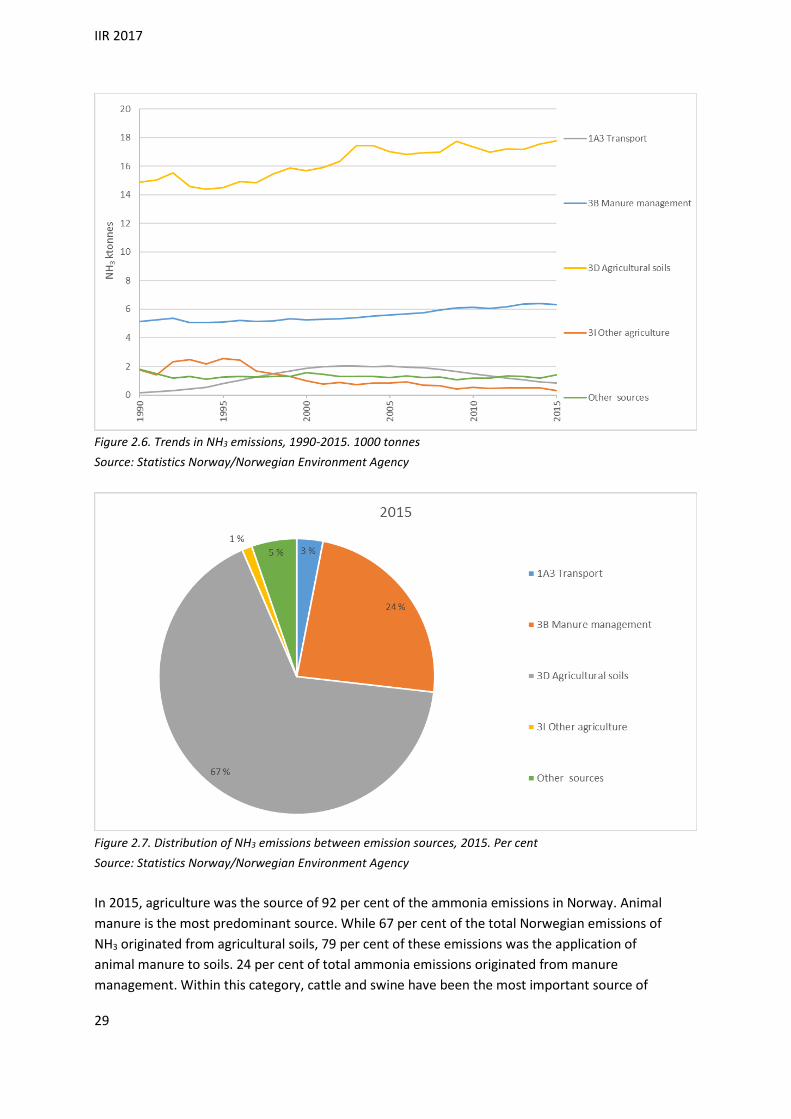
IIR 2017
29
Figure 2.6. Trends in NH3 emissions, 1990-2015. 1000 tonnes
Source: Statistics Norway/Norwegian Environment Agency
Figure 2.7. Distribution of NH3 emissions between emission sources, 2015. Per cent
Source: Statistics Norway/Norwegian Environment Agency
In 2015, agriculture was the source of 92 per cent of the ammonia emissions in Norway. Animal
manure is the most predominant source. While 67 per cent of the total Norwegian emissions of
NH3 originated from agricultural soils, 79 per cent of these emissions was the application of
animal manure to soils. 24 per cent of total ammonia emissions originated from manure
management. Within this category, cattle and swine have been the most important source of

IIR 2017
30
emissions, swine, dairy cattle and non-dairy cattle representing respectively 18 per cent, 22 per
cent and 18 per cent of the emissions from this category.
NMVOC
2010 commitment of the Gothenburg Protocol: 195 000 tonnes.
2020 commitment of the revised Gothenburg Protocol: a 40 per cent reduction
compared to emissions in 2005, 137 450 tonnes.
Norway's NMVOC emissions totaled 155 910 tonnes in 2015. The 2010 commitment of the
Gothenburg Protocol for NMVOC emissions has been fulfilled since 2008. Nevertheless, the
revised 2020 commitment will demand further reductions.
NMVOC emissions have been reduced by 48 per cent since 1990, and by 61 per cent since the
peak in 2001. Loading of crude oil offshore was the main reason for the increase in emissions
from 1990 to 2001. Measures to prevent these emissions resulted in a 83 per cent decrease in
fugitive emissions from fuels from 2001 to 2013. Since 2013, fugitive emissions from fuels have
increased by 22 percent because new fields have been in operation. Fugitive emissions from
fuels represent 38 per cent of total emissions of NMVOC in 2015.
30 per cent of the NMVOC emissions in 2015 originated from product use (solvents etc.), the
most important subcategories being "other solvent use" (2D3i), 55 per cent, and domestic
solvent use including fungicides, 29 per cent of emissions within this category.
The category “other combustion” (NFR 1A4 and 1A5) was responsible for 13 per cent of total
emissions of NMVOC in 2015. The two most significant sources of emissions are household and
gardening (mobile) and stationary plants in the residential sector. These two subcategories were
responsible for 92 per cent of emissions within this category. Emissions from household and
gardening have remained stable since 1990, whilst emissions from residential, stationary plants
show more interannual variations. NMVOC emissions from these two categories have been
reduced by 1 per cent since 1990 and by 3 per cent since 2014.
NMVOC emissions from transport have decreased by 86 per cent since 1990, mainly due to
reductions in emissions from passenger cars and gasoline evaporation. Stricter emission
standards for petrol passenger cars were implemented in 1989, and these have led to reduced
emissions. In addition, the increased share of diesel cars within the vehicle fleet has
strengthened the downwards trend.

IIR 2017
31
Figure 2.8. Trends in NMVOC emissions, 1990-2015. 1000 tonnes
Source: Statistics Norway/Norwegian Environment Agency
Figure 2.9. Distribution of NMVOC emissions between emission sources, 2015. Per cent
Source: Statistics Norway/Norwegian Environment Agency

IIR 2017
32
2.2 CO
Emissions from carbon monoxide, CO, amounted to 382 500 tonnes in 2015. They have been
reduced by 54 per cent since 1990 and by 4 per cent since 2014. This is mainly due to reductions
in emissions from transport, which have been reduced by 88 per cent since 1990. Emissions
from passenger cars represented almost 85 per cent of the transport category in 1990. They
have been reduced by 91 per cent since 1990, primarly due to stricter emission standards.
Emissions from light duty vehicles have also been significantly reduced (93 per cent since 1990)
albeit from a lower absolute level.
Figure 2.10. Trends in CO emissions, 1990-2015. 1000 tonnes
Source: Statistics Norway/Norwegian Environment Agency
The categories “other combustion” (NFR 1A4 and 1A5) and aluminium production were the
largest sources of emissions in 2015, representing both 38 per cent of the CO emissions.
Emissions from "other combustion" originated primarily from the NFR categories "Residential:
Stationary plants" and "Residential: Household and gardening (mobile)", which accounted for 64
and 28 per cent of the total emissions of the category, respectively, in 2015. Emissions from
"Residential: Stationary plants" were at a peak in 2002 but have decreased since. Emissions
were 39 per cent lower in 2015 than in 1990. These emissions are mainly due to wood
combustion for heating purposes. Emissions from "Residential: Household and gardening
(mobile)" have remained stable since 1990. Emissions from aluminium production increased by
17 per cent since 1990 while production increased by 40 per cent.
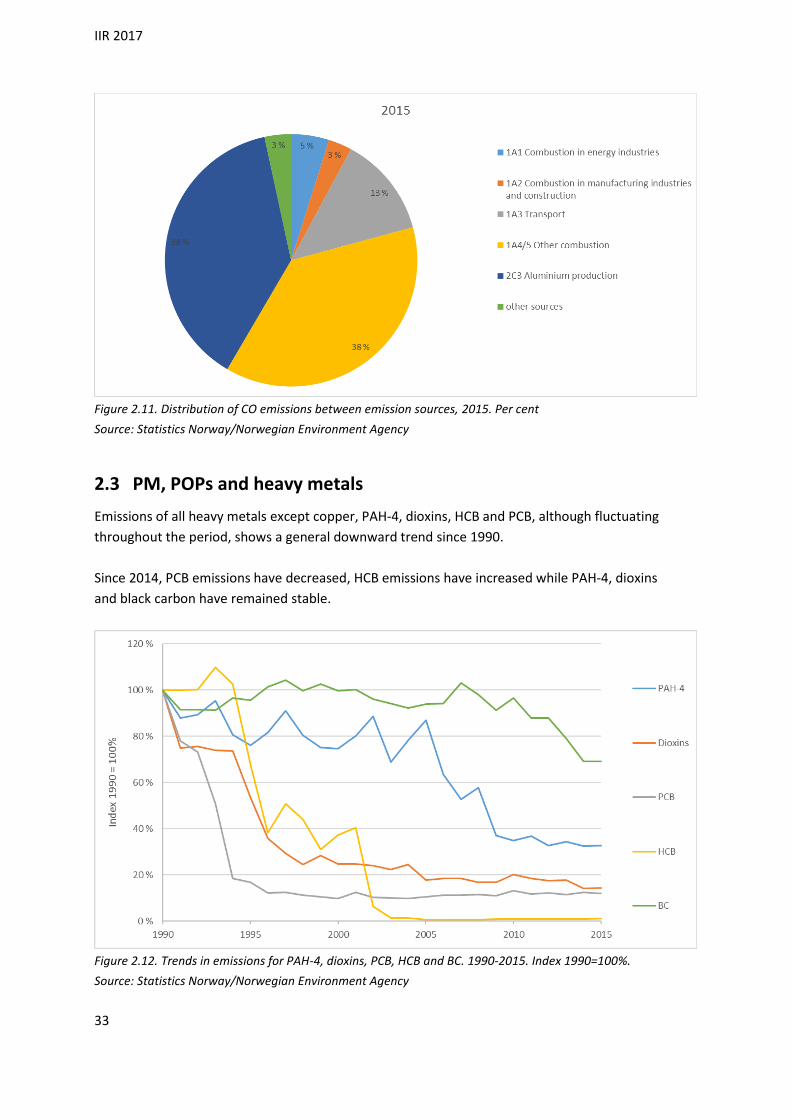
IIR 2017
33
Figure 2.11. Distribution of CO emissions between emission sources, 2015. Per cent
Source: Statistics Norway/Norwegian Environment Agency
2.3 PM, POPs and heavy metals
Emissions of all heavy metals except copper, PAH-4, dioxins, HCB and PCB, although fluctuating
throughout the period, shows a general downward trend since 1990.
Since 2014, PCB emissions have decreased, HCB emissions have increased while PAH-4, dioxins
and black carbon have remained stable.
Figure 2.12. Trends in emissions for PAH-4, dioxins, PCB, HCB and BC. 1990-2015. Index 1990=100%.
Source: Statistics Norway/Norwegian Environment Agency

IIR 2017
34
Figure 2.13. Trends in emissions for Heavy metals. 1990-2015. Index 1990=100%
Source: Statistics Norway/Norwegian Environment Agency
The emissions of several hazardous substances including PAHs (polycyclic aromatic
hydrocarbons) have been considerably reduced since 1990. The cause of the decrease is
primarily reduced emissions within manufacturing and mining. Cleaning measures, changes in
production processes and lower activity in some industries have all resulted in reduced
emissions. Norway has set a national target to reduce emissions compared with the emission
levels in 1995. Internationally, Norway has an obligation to reduce emissions of selected
hazardous substances compared to the level of emissions in 1990 through the Aarhus Protocol.
PM10
Emissions of particulate matter (PM10) totaled 37 100 tonnes in 2015. They have decreased by
29 per cent since 1990 and increased by 1 per cent since 2014.
The most important source of emissions is stationary residential plants (included in “other
combustion” (NFR 1A4 and 1A5)), which amounted to 16 500 tonnes of PM10 in 2015. Emissions
have been reduced by 24 per cent since 1990 but increased by 6 per cent since 2014. Wood
burning is the largest source of emissions from this subcategory. The wood consumption
increased by 7 per cent from 2014 to 2015, mainly due to a colder winter. Since 2000, the
reduction in particle emissions has been higher than reductions in wood consumption due to an
increased share of new technology in wood burning appliances.
Process emissions from manufacturing and mining amounted to 8 200 tonnes in 2015. Within
the process sector, the largest sources were mineral industry and metal industry, which
accounted for 42 and 38 per cent of the process category, respectively, in 2015. Emissions from
metal industry have decreased by 53 per cent since 1990 mainly due to reduced productions.
Emissions from mineral industry have increased by 12 per cent since 1990. Emissions from this
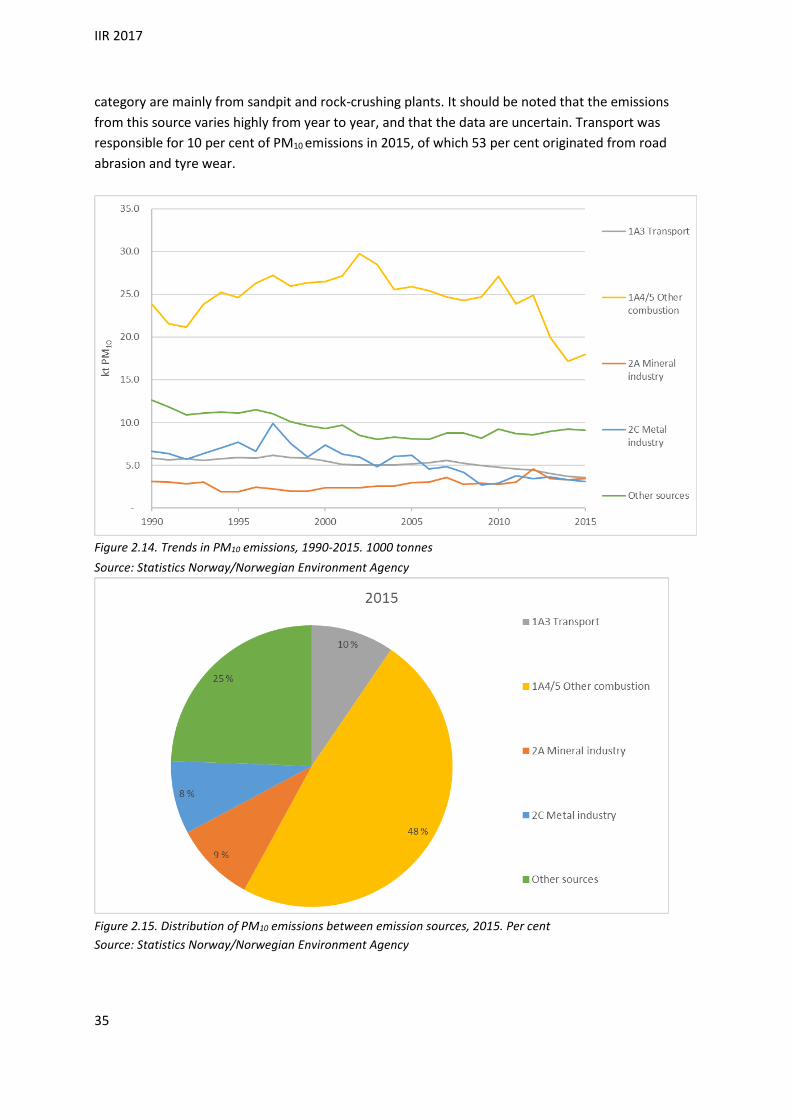
IIR 2017
35
category are mainly from sandpit and rock-crushing plants. It should be noted that the emissions
from this source varies highly from year to year, and that the data are uncertain. Transport was
responsible for 10 per cent of PM10 emissions in 2015, of which 53 per cent originated from road
abrasion and tyre wear.
Figure 2.14. Trends in PM10 emissions, 1990-2015. 1000 tonnes
Source: Statistics Norway/Norwegian Environment Agency
Figure 2.15. Distribution of PM10 emissions between emission sources, 2015. Per cent
Source: Statistics Norway/Norwegian Environment Agency

IIR 2017
36
PM2.5
2020 commitment of the revised Gothenburg Protocol: a 30 per cent reduction
compared to emissions in 2005, 27 300 tonnes.
Emissions of PM2.5 follows the same trend as PM10 emissions. Norway's emissions totaled 28 100
tonnes in 2015. The 2020 commitment of the revised Gothenburg Protocol has almost been
met.
Figure 2.16. Trends in PM2.5 emissions, 1990-2015. 1000 tonnes
Source: Statistics Norway/Norwegian Environment Agency
Black carbon
The emissions of BC amounted to 3 300 tonnes in 2015, a total reduction of 31 per cent since
1990 and of 4 per cent since 2014.
In 2015, the most important source of emissions was “other combustion” (NFR 1A4 and 1A5),
contributing to 40 per cent of the total emissions. From this category, 68 per cent of emissions
originated in 2015 from residential stationary plants, primarily due to wood combustion in
private households. Despite yearly variations, the emissions of BC from residential combustion
increased between 1990 and 2010 and have only been reduced since 2010. Emissions increased
by 35 per cent between 1990 and 2010 and decreased by 67 per cent since 2010.
In 2015, the second most important source of emissions was transport. It contributed to 28 per
cent of the total BC emissions . The greatest share of emissions within the transport sector stem
from shipping, passenger cars and light duty vehicles, contributing to 36, 24 and 19 per cent of
the emissions in 2015, respectively. From 1990 to 2015, emissions from shipping have been

IIR 2017
37
reduced by 36 per cent, while emissions from passenger cars have increased by 130 per cent.
Emissions from light duty vehicles have been reduced by 29 per cent since 1990.
Combustion in energy industries, which, in 2015, comprised 11 per cent of the total BC
emissions, have increased by 242 per cent since 1990. The most prominent source of emissions
within this category is manufacture of solid fuels and other energy industries. It represented 64
per cent of the sector emissions in 2015. During the period from 1990 to 2015, there has been
an increase of almost 150 per cent of BC emissions from this industry.
Figure 2.17. Trends in BC emissions, 1990-2015. 1000 tonnes
Source: Statistics Norway/Norwegian Environment Agency
Figure 2.18. Distribution of BC emissions between emission sources, 2015. Per cent
Source: Statistics Norway/Norwegian Environment Agency
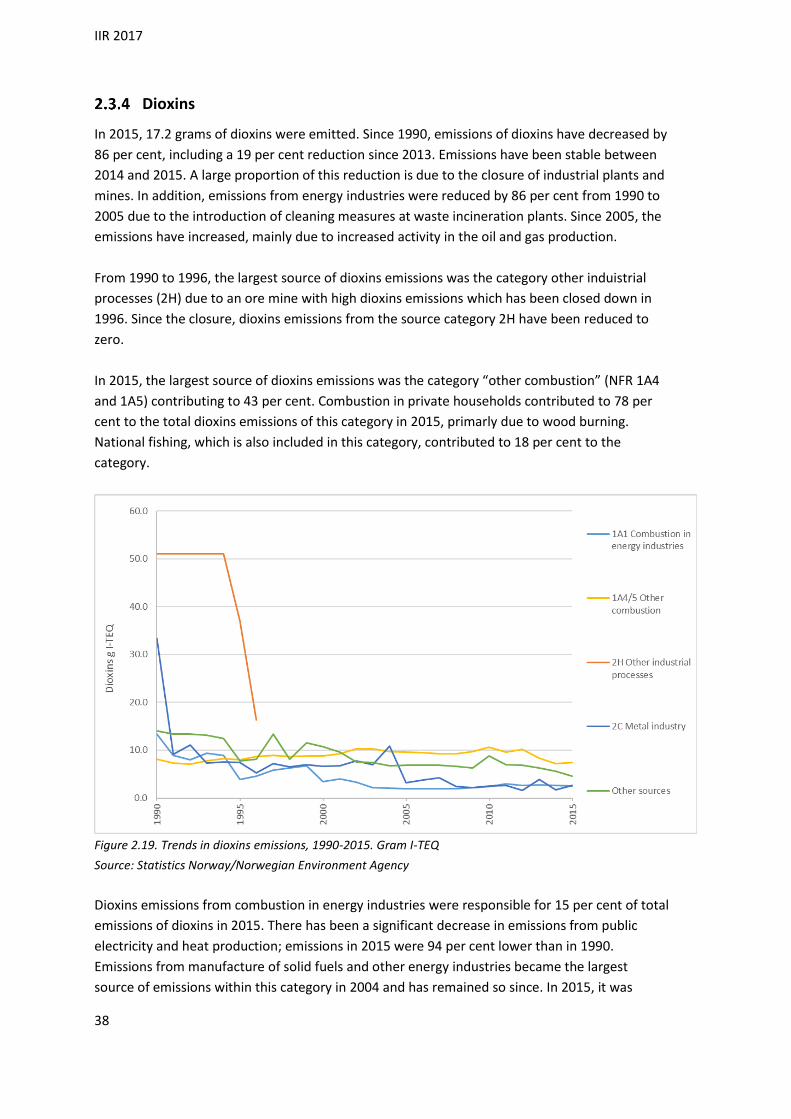
IIR 2017
38
Dioxins
In 2015, 17.2 grams of dioxins were emitted. Since 1990, emissions of dioxins have decreased by
86 per cent, including a 19 per cent reduction since 2013. Emissions have been stable between
2014 and 2015. A large proportion of this reduction is due to the closure of industrial plants and
mines. In addition, emissions from energy industries were reduced by 86 per cent from 1990 to
2005 due to the introduction of cleaning measures at waste incineration plants. Since 2005, the
emissions have increased, mainly due to increased activity in the oil and gas production.
From 1990 to 1996, the largest source of dioxins emissions was the category other induistrial
processes (2H) due to an ore mine with high dioxins emissions which has been closed down in
1996. Since the closure, dioxins emissions from the source category 2H have been reduced to
zero.
In 2015, the largest source of dioxins emissions was the category “other combustion” (NFR 1A4
and 1A5) contributing to 43 per cent. Combustion in private households contributed to 78 per
cent to the total dioxins emissions of this category in 2015, primarly due to wood burning.
National fishing, which is also included in this category, contributed to 18 per cent to the
category.
Figure 2.19. Trends in dioxins emissions, 1990-2015. Gram I-TEQ
Source: Statistics Norway/Norwegian Environment Agency
Dioxins emissions from combustion in energy industries were responsible for 15 per cent of total
emissions of dioxins in 2015. There has been a significant decrease in emissions from public
electricity and heat production; emissions in 2015 were 94 per cent lower than in 1990.
Emissions from manufacture of solid fuels and other energy industries became the largest
source of emissions within this category in 2004 and has remained so since. In 2015, it was

IIR 2017
39
responsible for 67 per cent of dioxins emissions within the energy industries category. Emissions
from manufacture of solid fuels and other energy industries have increased by 158 per cent
since 1990.
Transport was responsible for 11 per cent of total dioxins emissions in 2015. National navigation
(shipping) is by far the most significant source of emissions within this category, representing 82
per cent of the transport emissions. Emissions from passenger cars, which contributed to almost
half of emissions within this category in 1990, declined rapidly from 1990 to 1994 and further to
1996. Since then, they have been amounted to approximately the same absolute level. In 2015,
emissions from passengers cars were 91 per cent lower than in 1990.
Emissions from other waste, which accounted for 8 per cent of the total emissions in 2015, have
been reduced by 31 percent since 1990 including a reduction of 37 per cent since 2014.
Process emissions from metal production accounted 15 per cent of the total emissions of dioxins
in 2015.
Figure 2.20. Distribution of dioxins emissions between emission sources, 2015. Per cent
Source: Statistics Norway/Norwegian Environment Agency
PAH-4
The present emission inventory for polycyclic aromatic hydrocarbons (PAH) includes four PAHs:
benzo(a)pyrene, benzo(b)fluoranthene, benzo(k)fluoranthene and indeno(1,2,3-cd)pyrene. The
total emissions of PAH-4 in 2015 amounted to approximately 6.6 tonnes, which is a reduction of
67 per cent since 1990. Emissions increased by 1 per cent since 2014.
In 2015, benzo(b)fluoranthene contributed to 44 per cent of PAH-4 emissions while
benzo(k)fluoranthene, benzo(a)pyrene and indeno(1,2,3-cd)pyrene contributed to 21, 20 and 14
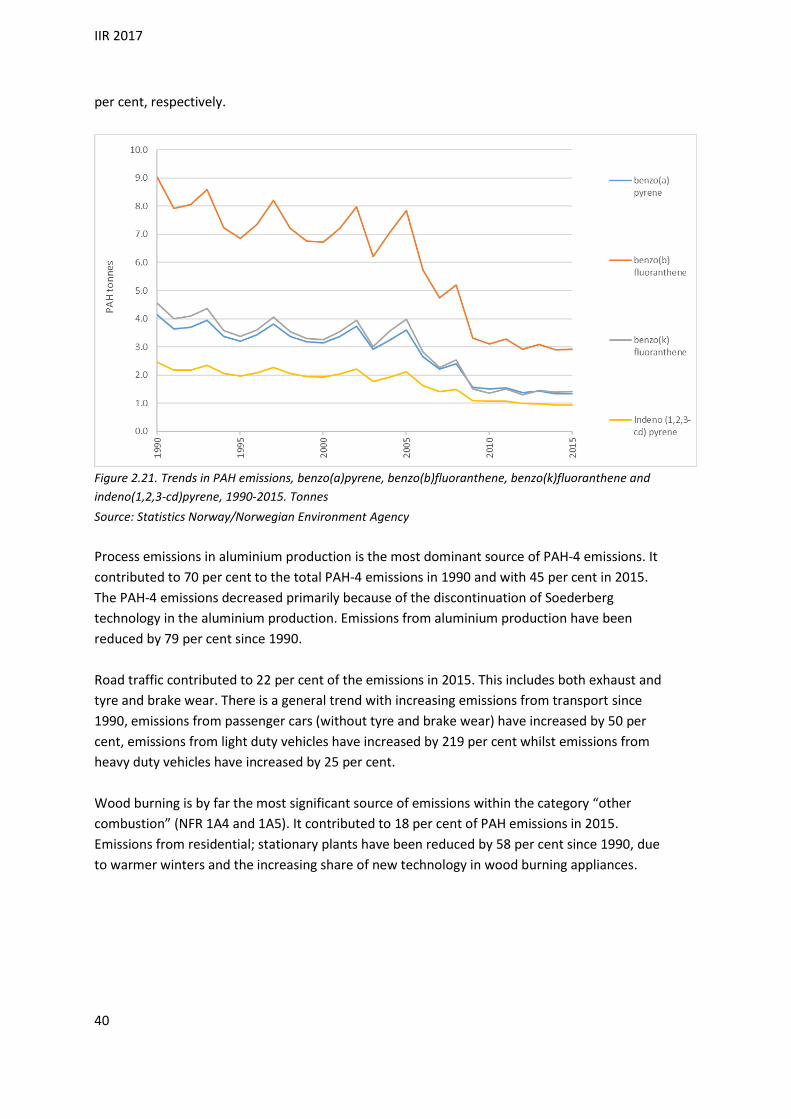
IIR 2017
40
per cent, respectively.
Figure 2.21. Trends in PAH emissions, benzo(a)pyrene, benzo(b)fluoranthene, benzo(k)fluoranthene and
indeno(1,2,3-cd)pyrene, 1990-2015. Tonnes
Source: Statistics Norway/Norwegian Environment Agency
Process emissions in aluminium production is the most dominant source of PAH-4 emissions. It
contributed to 70 per cent to the total PAH-4 emissions in 1990 and with 45 per cent in 2015.
The PAH-4 emissions decreased primarily because of the discontinuation of Soederberg
technology in the aluminium production. Emissions from aluminium production have been
reduced by 79 per cent since 1990.
Road traffic contributed to 22 per cent of the emissions in 2015. This includes both exhaust and
tyre and brake wear. There is a general trend with increasing emissions from transport since
1990, emissions from passenger cars (without tyre and brake wear) have increased by 50 per
cent, emissions from light duty vehicles have increased by 219 per cent whilst emissions from
heavy duty vehicles have increased by 25 per cent.
Wood burning is by far the most significant source of emissions within the category “other
combustion” (NFR 1A4 and 1A5). It contributed to 18 per cent of PAH emissions in 2015.
Emissions from residential; stationary plants have been reduced by 58 per cent since 1990, due
to warmer winters and the increasing share of new technology in wood burning appliances.

IIR 2017
41
Figure 2.22. Trends in total PAH-4 emissions, 1990-2015. Tonnes
Source: Statistics Norway/Norwegian Environment Agency
Figure 2.23. Distribution of total PAH-4 emissions between emission sources, 2015. Per cent
Source: Statistics Norway/Norwegian Environment Agency
HCB
Estimated HCB emissions in Norway amounted to 1.4 kilograms in 2015, and has decreased by
99 per cent since 1990. Emissions have increased by 49 per cent since 2005, but this amount to
a small increase in absolute numbers after a decrease of 99 per cent between 1990 and 2005.

IIR 2017
42
Emissions decreased mainly due to the closure of magnesium production which contributed to
almost 99 per cent of total HCB emissions in 1990.
Figure 2.24. Metal industry, trends in HCB emissions, 1990-2015. Kilogram
Source: Statistics Norway/Norwegian Environment Agency
Figure 2.25. Trends in total HCB emissions, 2003-2015. Kilogram
Source: Statistics Norway/Norwegian Environment Agency
The most important source of emissions of HCB in 2015 was road transport, which contributed
to 52 per cent to total emissions. Emissions from road transport have increased significantly

IIR 2017
43
since 1990, mainly due to increased traffic activity. For instance, HCB emissions from passenger
cars were more than fourteen times higher in 2015 than in 1990.
Figure 2.26. Distribution of HCB emissions between emission sources, 2015. Per cent
Source: Statistics Norway/Norwegian Environment Agency
PCB
Estimated PCB emissions in Norway amounted to 25 kilograms in 2015. Emissions have
increased by 20 per cent since 2000, after a decrease of 90 per cent between 1990 and 2000.
From 1990 to 1994, emissions from transport decreased by 86 per cent, due to fuel content
regulations. Emissions from passenger cars, which accounted for 79 per cent of the total PCB
emissions in 1990, decreased from 167 to 1 kilogram from 1990 to 2015.

IIR 2017
44
Figure 2.27. Trends in total PCB emissions, 1990-2015. Kilogram
Source: Statistics Norway/Norwegian Environment Agency
Despite large reductions, road transport stayed the most important source of emissions of PCB
in 2015. It contributed to 89 per cent of total emissions.
Figure 2.28. Distribution of PCB emissions between emission sources, 2015. Per cent
Source: Statistics Norway/Norwegian Environment Agency

IIR 2017
45
Lead
Lead emissions totaled 5.6 tonnes in 2015 and have been reduced by 97 per cent since 1990.
Regulations on lead content in fuels are the main reason for this reduction. Indeed, emissions
from passenger cars constituted 82 per cent of the total in 1990, and only 2 per cent in 2015.
Emissions of lead have been relatively constant in recent years.
Figure 2.29. Transport, trends in lead emissions, 1990-2015. Tonnes
Source: Statistics Norway/Norwegian Environment Agency
Figure 2.30. Trends in lead emissions, 1996-2015. Tonnes
Source: Statistics Norway/Norwegian Environment Agency
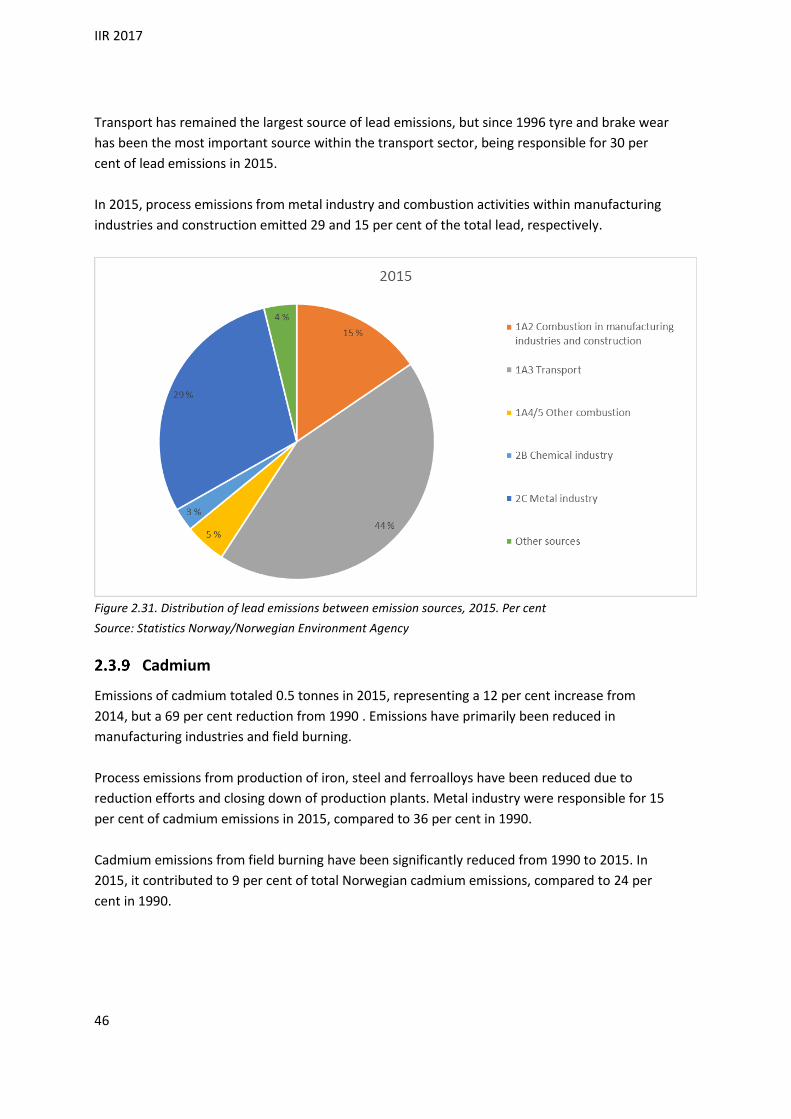
IIR 2017
46
Transport has remained the largest source of lead emissions, but since 1996 tyre and brake wear
has been the most important source within the transport sector, being responsible for 30 per
cent of lead emissions in 2015.
In 2015, process emissions from metal industry and combustion activities within manufacturing
industries and construction emitted 29 and 15 per cent of the total lead, respectively.
Figure 2.31. Distribution of lead emissions between emission sources, 2015. Per cent
Source: Statistics Norway/Norwegian Environment Agency
Cadmium
Emissions of cadmium totaled 0.5 tonnes in 2015, representing a 12 per cent increase from
2014, but a 69 per cent reduction from 1990 . Emissions have primarily been reduced in
manufacturing industries and field burning.
Process emissions from production of iron, steel and ferroalloys have been reduced due to
reduction efforts and closing down of production plants. Metal industry were responsible for 15
per cent of cadmium emissions in 2015, compared to 36 per cent in 1990.
Cadmium emissions from field burning have been significantly reduced from 1990 to 2015. In
2015, it contributed to 9 per cent of total Norwegian cadmium emissions, compared to 24 per
cent in 1990.
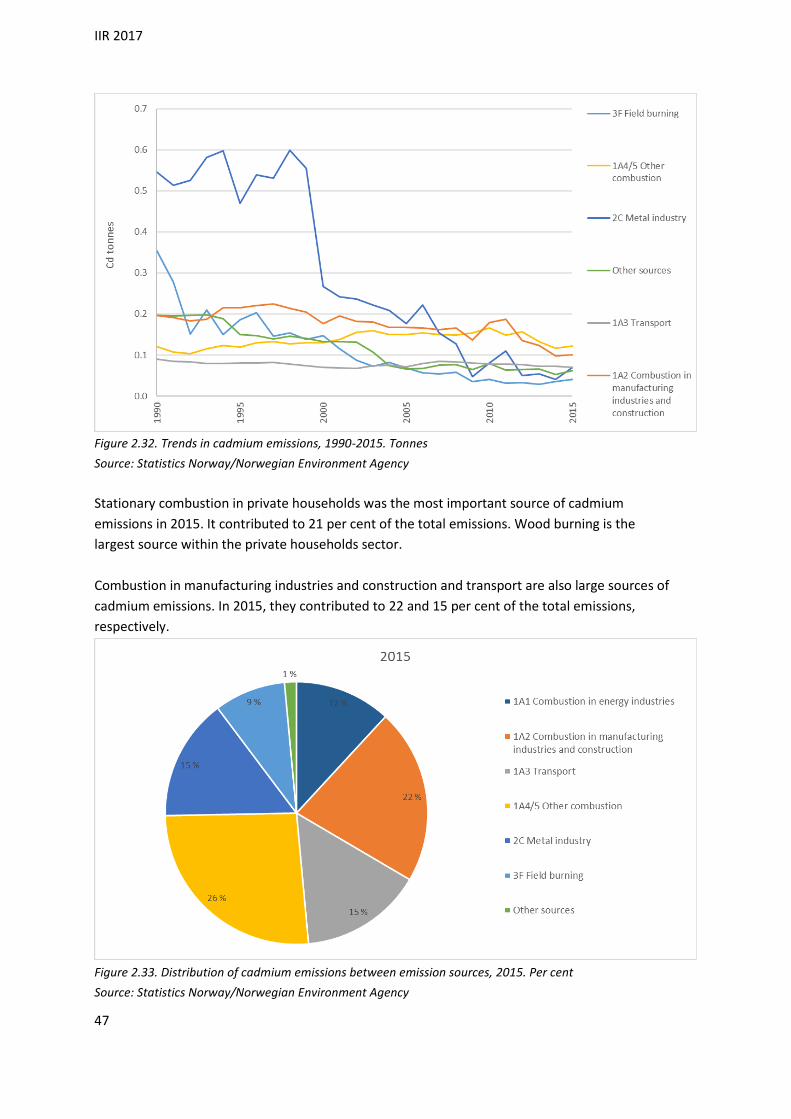
IIR 2017
47
Figure 2.32. Trends in cadmium emissions, 1990-2015. Tonnes
Source: Statistics Norway/Norwegian Environment Agency
Stationary combustion in private households was the most important source of cadmium
emissions in 2015. It contributed to 21 per cent of the total emissions. Wood burning is the
largest source within the private households sector.
Combustion in manufacturing industries and construction and transport are also large sources of
cadmium emissions. In 2015, they contributed to 22 and 15 per cent of the total emissions,
respectively.
Figure 2.33. Distribution of cadmium emissions between emission sources, 2015. Per cent
Source: Statistics Norway/Norwegian Environment Agency
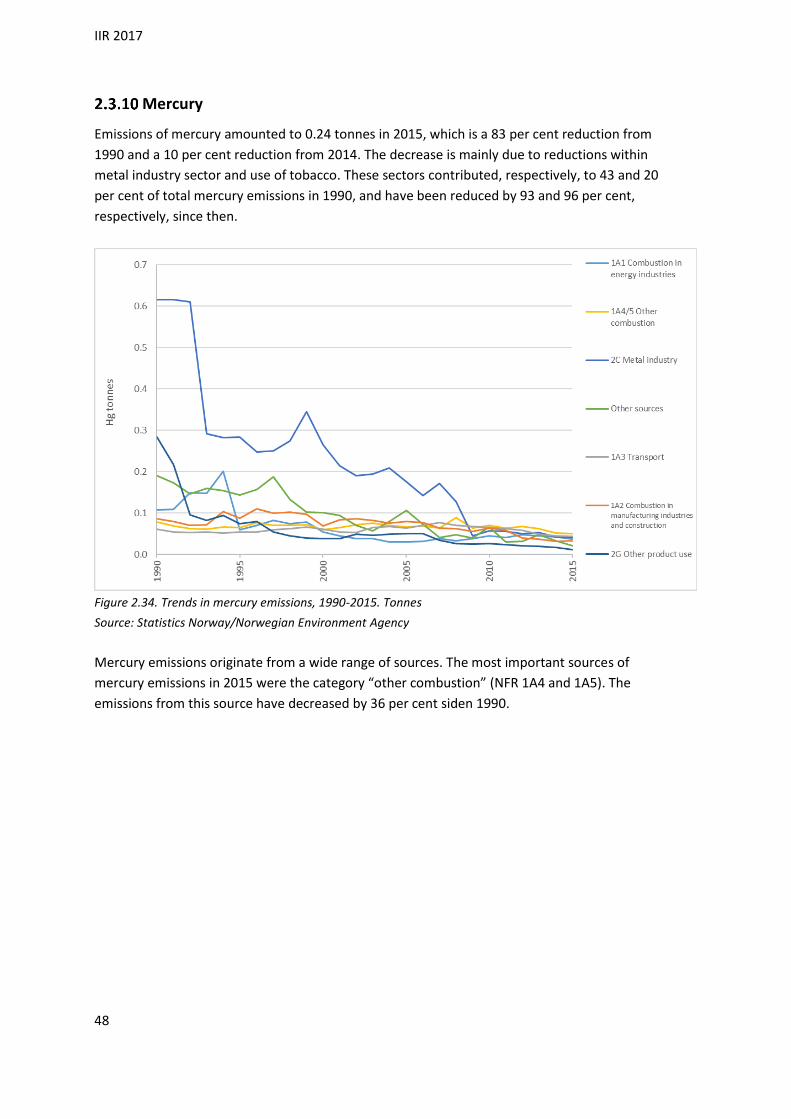
IIR 2017
48
Mercury
Emissions of mercury amounted to 0.24 tonnes in 2015, which is a 83 per cent reduction from
1990 and a 10 per cent reduction from 2014. The decrease is mainly due to reductions within
metal industry sector and use of tobacco. These sectors contributed, respectively, to 43 and 20
per cent of total mercury emissions in 1990, and have been reduced by 93 and 96 per cent,
respectively, since then.
Figure 2.34. Trends in mercury emissions, 1990-2015. Tonnes
Source: Statistics Norway/Norwegian Environment Agency
Mercury emissions originate from a wide range of sources. The most important sources of
mercury emissions in 2015 were the category “other combustion” (NFR 1A4 and 1A5). The
emissions from this source have decreased by 36 per cent siden 1990.
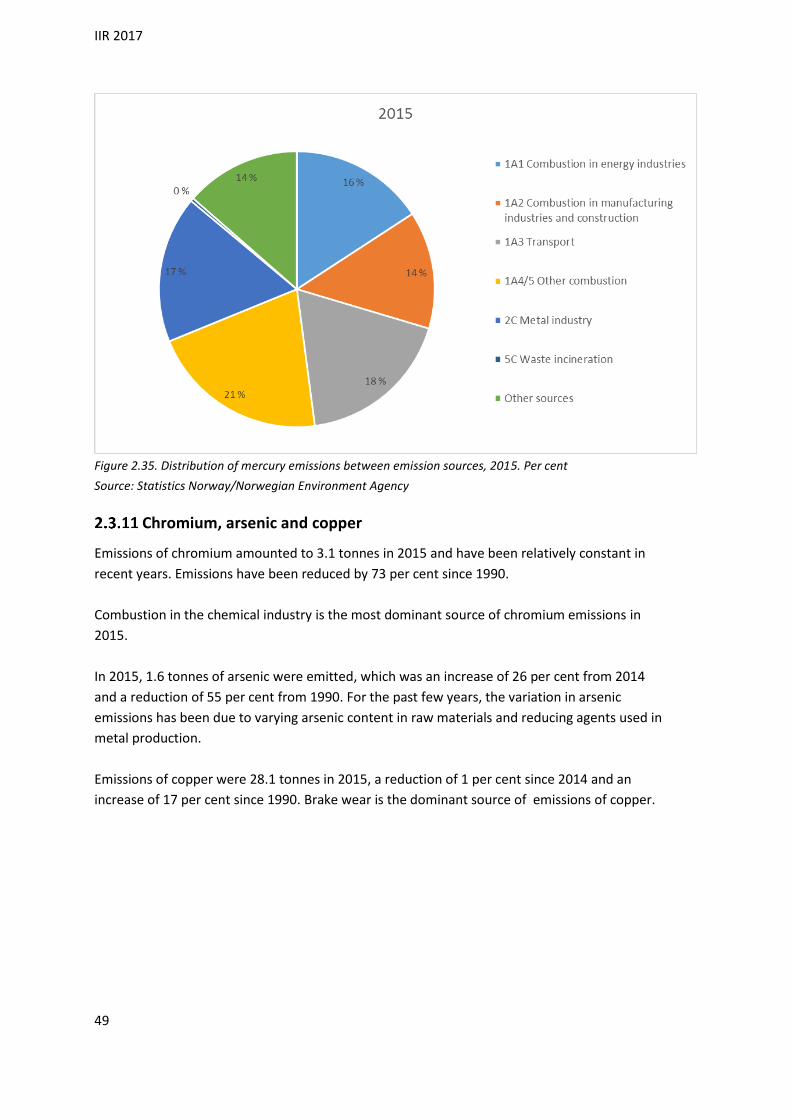
IIR 2017
49
Figure 2.35. Distribution of mercury emissions between emission sources, 2015. Per cent
Source: Statistics Norway/Norwegian Environment Agency
Chromium, arsenic and copper
Emissions of chromium amounted to 3.1 tonnes in 2015 and have been relatively constant in
recent years. Emissions have been reduced by 73 per cent since 1990.
Combustion in the chemical industry is the most dominant source of chromium emissions in
2015.
In 2015, 1.6 tonnes of arsenic were emitted, which was an increase of 26 per cent from 2014
and a reduction of 55 per cent from 1990. For the past few years, the variation in arsenic
emissions has been due to varying arsenic content in raw materials and reducing agents used in
metal production.
Emissions of copper were 28.1 tonnes in 2015, a reduction of 1 per cent since 2014 and an
increase of 17 per cent since 1990. Brake wear is the dominant source of emissions of copper.
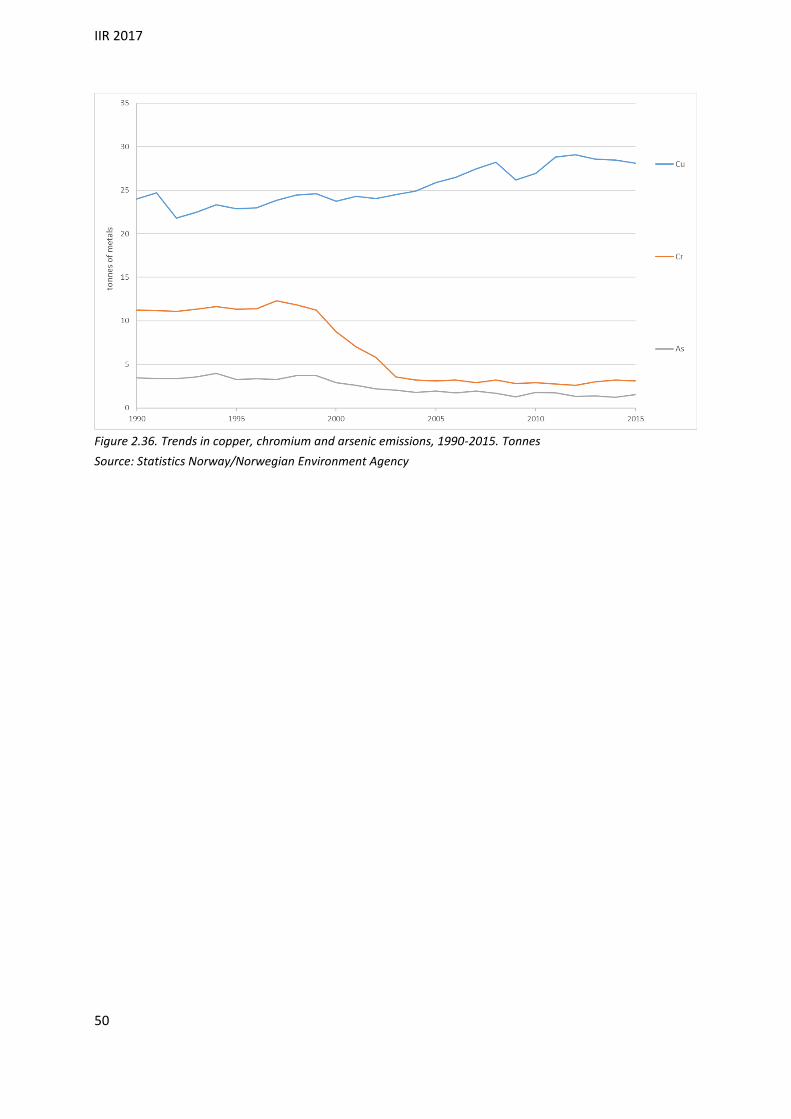
IIR 2017
50
Figure 2.36. Trends in copper, chromium and arsenic emissions, 1990-2015. Tonnes
Source: Statistics Norway/Norwegian Environment Agency
IIR 2017
51
3 ENERGY (NFR sector 1)
3.1 Overview
This chapter provides descriptions of methodologies employed to calculate emissions from the
energy sector. The disposition of the chapter is following the NFR classifications of the emission
sources. In section 3.2, emission estimations from energy combustion are described. This
includes combustion emissions from energy industries, manufacturing industries and
construction, transport and other combustion sources. Section 3.2 also includes memo items
about international bunker fuels.
In section 3.3, a description is given for fugitive emissions from fuels. This includes fugitive
emissions from coal mining and handling, and from oil and natural gas.
3.2 Energy combustion
NFR 1A
Last update: 10.03.2015
Overview
Combustion of fossil fuels and biomass leads to emissions of SO2, NOX, NMVOC, CO, particulate
matter, heavy metals, PAH, dioxins and NH3.
Table 3.1. Energy combustion emissions as per cent of total emissions, 2015
Pollutant Per cent of emissions
SO2 35 NOX 86 NMVOC 22 CO 58 NH3 3 PM10 68 BC 87
Source: Statistics Norway/Norwegian Environment Agency
The emissions of SO2, NMVOC and CO have been significantly reduced since 1990. The reduction
of SO2 emissions has taken place in all sectors due to reduced sulphur content in fuels. NMVOC
and CO emissions have been reduced mainly due to reductions in emissions from petrol
passenger cars. Catalysts in petrol passenger cars cause NH3 emissions.
Emissions of NOX and particles have stayed stable in the 1990s. Particles have been reduced
since 2002 while most of NOX reductions in totals happened after 2007.

IIR 2017
52
Figure 3.1. Trends for the emissions for most of the long-range transboundary air pollutants from energy
combustion. Index 1990 = 100%
Source: Statistics Norway/Norwegian Environment Agency
Emissions from energy combustion include contributions from all sources addressed in the
UNECE Guideline. Emissions from waste incineration at district heating plants are accounted for
under the energy sector, as the energy is utilised. Emissions from flaring in the energy sectors
are described in section 3.3 Energy production. Coal and coke used as reducing agents and gas
used for production of ammonia (non-energy part) are accounted for under industrial processes.
Flaring of natural gas and fuel gas in chemical industry is recorded in section 4.3. Other flaring
outside the energy sectors is described in section 6.4. The same applies to emissions from
accidental fires etc. Emissions from burning of crop residues and agricultural waste are
accounted for and described in section 5.6. Emissions from tobacco are described in section
4.5.6.
The main source for calculation of emissions from energy combustion is the energy balance,
which annually is prepared by Statistics Norway. The data used in the emission calculations are
at a much more disaggregated level than the published energy balance. Many different sources
are utilised in the preparation of the energy balance. E.g. energy use in extraction of oil and gas,
which constitutes an important part of Norwegian energy use, is reported from the Norwegian
Petroleum Directorate. Other energy producers, such as oil refineries and district heating plants,
also report their own energy use to Statistics Norway.
For different oil products, the total frame for annual use is given by Statistics Norway’s statistics
on deliveries of petroleum products. These statistics are also used in the estimation of use in
different economic sectors, together with other available information. The distribution between
sectors is of varying quality – e.g. in some cases projections of previous surveys are used in this
process. For manufacturing industries, however, Statistics Norway’s annual survey on all types
of energy use, based on reports from plants that are responsible for approximately 96 per cent
of the energy use in these sectors, combined with estimations for the remaining plants, provides
IIR 2017
53
figures of high quality.
Method
General
Emissions from energy combustion are estimated at the sectoral level in accordance with the
IPCC sectoral approach Tier 2/Tier 3. Often total fuel consumption is better known than the
sectoral consumption.
The general method to estimate emissions from fuel combustion is multiplication of fuel
consumption by source and sector by an appropriate emission factor. Exceptions are road and
air transport where more detailed estimation models are used, involving additional activity data
(see section 3.2.4.2 and 3.2.4.1 respectively). Fuel consumption figures are taken from the
Norwegian energy balance. The mean theoretical energy content of fuels and their density are
listed in Table 3.2.
Table 3.2. Average energy content and density of fuels
Energy commodity Theoretical energy content1 Density
Coal 28.1 GJ/tonne .. Coal coke 28.5 GJ/tonne .. Petrol coke 35.0 GJ/tonne .. Crude oil 42.3 GJ/tonne = 36.0 GJ/m3 0.85 tonne/m3 Refinery gas 48.6 GJ/tonne ..
Natural gas (dry gas)2 35.5 GJ/1000 Sm3 0.74 kg/Sm3 (domestic use)
Natural gas (rich gas)2 40.3 GJ/1000 Sm3 0.85 kg/Sm3 (continental shelf)
Liquefied propane and butane (LPG)
46.1 GJ/tonne = 24.4 GJ/m3 0.53 tonne/m3
Fuel gas3 50.0 GJ/tonne .. Petrol 43.9 GJ/tonne = 32.5 GJ/m3 0.74 tonne/m3 Kerosene 43.1 GJ/tonne = 34.9 GJ/m3 0.81 tonne/m3 Diesel oil, gas oil and light fuel oil 43.1 GJ/tonne = 36.2 GJ/m3 0.84 tonne/m3 Heavy distillate 43.1 GJ/tonne = 37.9 GJ/m3 0.88 tonne/m3 Heavy fuel oil 40.6 GJ/tonne = 39.8 GJ/m3 0.98 tonne/m3 Methane4 50.2 GJ/tonne .. Wood 16.8 GJ/tonne = 8.4 GJ/solid m3 0.5 tonne/solid m3 Wood waste (dry wt) 16.25-18 GJ/tonne .. Black liquor (dry wt) 7.2-9.2 GJ/tonne .. Waste 10.5 GJ/tonne ..
1 The theoretical energy content of a particular energy commodity may vary; Figures indicate mean values. All data are net calorific
value (NCV). 2 Sm3 = standard cubic metre (at 15 °C and 1 atmospheric pressure).
3 In this inventory, fuel gas is a hydrogen-rich excess gas from petrochemical industry. 4 Landfill gas and other types of biogas are reported as methane content in the energy balance.
Source: Statistics Norway/Norwegian Environment Agency
Handbook of Emission Factors (HBEFA; (INFRAS 2010)) describes methodologies used for road
traffic. Several documentation reports have been published describing the methodologies used
for road traffic (Holmengen & Fedoryshyn 2015) and navigation (Tornsjø 2001) and (Flugsrud et
IIR 2017
54
al. 2010). The methodology for aviation is described in an internal document from Statistics
Norway (Skullerud 2014).
Delimitation towards industrial processes etc.
The energy combustion sector borders to several other source categories. This section presents
the demarcation with other sectors used in the inventory.
Energy consumption reported as activity data in the emission inventories is generally delimited
in the same way as emissions. In cases where different substances are handled differently, the
delimitation of energy consumption follows the delimitation of CO2 emissions.
Flaring is not reported as energy use in 1A. Instead, flaring is reported in the following source
categories:
Flaring in refineries and in exploration/extraction is reported in 1B –
Fugitive emissions.
Flaring in manufacturing industries is reported in 2 – Industrial
processes, particularly in 2B – Chemical industry. (In the energy balance,
flaring in manufacturing is reported as "losses".)
Flaring of landfill gas is reported in 6C – Waste incineration.
Combustion of solid waste and hazardous waste is reported in the energy section (district
heating in 1A1a and in several manufacturing industries). No significant combustion of solid or
hazardous waste occurs without energy recovery.
Combustion of landfill gas with energy recovery is reported in the energy section (mainly in
1A4a Commercial/Institutional). Flaring is reported in 6C waste incineration, as mentioned
above.
Some special problems relating to allocation of reported total plant emissions are discussed in
section 3.2.1.1.4.
Emissions reported by plants: overview
However, for some major manufacturing plants (in particular offshore activities, refineries, gas
terminals, cement industry, production of plastics, ammonia production), emissions of one or
more compounds, reported to the Norwegian Environment Agency from the plants, are used
instead of figures calculated with general emission factors as described above. In these cases,
the energy consumption at the plants in question is subtracted from the total energy use before
the general method is used to calculate the remaining emissions of the compound in question,
in order to prevent double counting.
Emissions are reported to the Norwegian Environment Agency under a number of different
reporting obligations. Most CO2 emissions are today reported as part of the Emissions Trading
System (ETS).
In the general equation (2.2), Emissions (E) = [ (A - APS) EF] + EPS, EPS represents the reported

IIR 2017
55
emission data, while APS represents the energy consumption at the plants. Note that for most
plants, reported emissions are used only for a limited number of substances. For the remaining
substances in the inventory, the general method with standard emission factors is used.
Reported figures are used for a relatively small number of plants, but as these contribute to a
large share of the total energy use, a major part of the total emissions are based on such
reported figures. For the source categories petroleum refining, manufacture of solid fuels and
other energy industries and iron and steel, more than 90 per cent of the sector emissions are
based on reported data from plants. The reports are from the mandatory reporting obligation
that is a part of the plants’ permits given by the authorities.
Emissions reported by plants: Energy data
Energy data for plants with reported emissions (APS in equation (2.2)) should be consistent both
with the energy balance that is used for activity totals A and with the reported emission data.
Consistency with emission data means that the energy data should correspond to the same
activity as the reported emissions.
In most cases, figures on plant energy use in the inventory are based on data reported from the
plants to Statistics Norway. This ensures consistency with the energy balance. However, for
some plants, some of the energy data may differ between reports to Statistics Norway and data
reported together with emissions to the Norwegian Environment Agency. This may lead to
problems with consistency. This is most evident for CO2, where the range of implied emission
factors is very narrowly delimited. However, it may also affect the LRTAP substances.
Emissions reported by plants: Allocation to combustion/ processes
In some cases, emissions are reported as a plant total which includes both combustion and
process emissions. It is likely that most of the emissions are from processes. All emissions of
particulates, heavy metals and POPs are entered into the inventory as process emissions.
Emissions from combustion are set to 0 in order to avoid double counting.
Emissions reported by plants: Allocation to fuels
The following discussion is particularly relevant for CO2, but it also applies to the LRTAP
substances.
For some plants and substances, emissions are reported by fuel, but in most cases reported
combustion emissions are entered as a plant total. The emissions are then allocated to fuels
bases on standard EFs using equation 3.1:
(3.1) EPS, f = EPS ∙ APS,f EF f / ∑ f (EPS EF f)
where the subscript f denotes fuel type.

IIR 2017
56
This means that any deviations in data will be distributed across all fuels at the plant. Typical
situations include:
Plants with atypical fuels which differ from standard emission factors.
Plants with errors or other inconsistencies in energy data.
In such cases, implied emission factors may deviate from the standard range also for other fuels
than the one which is really affected.
Plants/substances which are entered by fuel currently include among others:
Particulate matter from manufacturing of wood products.
Heavy metal and POP emissions from combustion of municipal solid
waste and special waste.
Activity data
The annual energy balance, compiled by Statistics Norway, forms the framework for the
calculation of emissions from energy use. The energy balance defines the total energy
consumption for which emissions are accounted. However, a large part of the total emissions
are based on reports from plants that use much energy, i.e. offshore activities and energy-
intensive industries on shore. Energy consumption in these plants is included in the energy
balance, but this consumption is subtracted before the remaining emissions are calculated by
the standard method of multiplying energy use by emission factors. Energy figures reported
from the plants to Statistics Norway, which are used in the energy balance, sometimes deviate
from the energy figures used to estimate reported emission figures, and this may cause
inaccuracies in implied emission factors.
The energy balance surveys the flow of the different energy carriers within Norwegian territory.
It includes energy carriers used as raw materials and reducing agents, but these are presented in
a separate item and are not included in the data used to estimate emissions from combustion.
Some emissions vary with the combustion technology; a distribution between different sources
is thus required. Total use of the different oil products is based on the Norwegian sales statistics
for petroleum products. For other energy carriers, the total use of each energy carrier is
determined by summing up reported/estimated consumption in the different sectors. A short
summary of the determination of amounts used of the main groups of energy carriers and the
distribution between emission sources is given below.
Natural gas
Most of the combustion of natural gas is related to extraction of oil and gas on the Norwegian
continental shelf. The amounts of gas combusted, distributed between gas turbines and flaring,
are reported annually to Statistics Norway by the Norwegian Petroleum Directorate (NPD).
These figures include natural gas combusted in gas turbines on the various oil and gas fields as
well as on Norway’s four gas terminals on shore. Statistics Norway's annual survey on energy
use in manufacturing industries and sales figures from distributors give the remainder. Some
manufacturing industries use natural gas in direct-fired furnaces; the rest is burned in boilers
and, in some cases, flared.

IIR 2017
57
LPG and other gases
Consumption of LPG in manufacturing industries is reported by the plants to Statistics Norway in
the annual survey on energy use. Figures on use of LPG in households are based on sales figures,
collected annually from the oil companies. Use in agriculture and construction is based on non-
annual surveys; the figure for agriculture is interpolated for years not included in surveys,
whereas the figure for construction is adjusted annually, based on employment figures.
Use of refinery gas is reported to Statistics Norway from the refineries. The distribution between
the sources direct-fired furnaces, flaring and boilers is based on information collected from the
refineries in the early 1990's. However, the total emissions from the refineries included in the
inventory are equal to emissions reported from the plants and are regarded being of high
quality.
At some industrial plants, excess gas from chemical and metallurgical industrial processes is
burned, partly in direct-fired furnaces and partly in boilers. These amounts of gases are reported
to Statistics Norway. A petrochemical plant generates fuel gas derived from ethane and LPG.
Most of the gas is burned on-site, but fuel gas is also sold to several other plants. All use of fuel
gas is reported as energy consumption in the inventory.
Several metallurgical plants generate CO-rich excess gas that is either burnt on-site or sold to
adjacent plants. Two ferroalloy plants sell parts of their CO gas to some other plants (one
producer of ammonia, a district heating plant, iron and steel producers and mineral industry),
where it is combusted for energy purposes. These amounts are reported as energy
consumption.
One sewage treatment plant utilizes biogas extracted at the plant, and reports quantities
combusted (in turbines). By definition, no CO2 emissions arise from biogas, but other emissions
are estimated by Statistics Norway, using the same emission factors as for combustion of natural
gas in turbines.
Oil products
Total use of the different oil products is based on Statistics Norway's annual sales statistics for
petroleum products. The data are generally considered reliable (with some reservations which
are accounted for further down in this chapter), since all major oil companies selling oil products
report to these statistics and have an interest in the quality of the data. The statistics are
corrected for direct import by other importers or companies. The use of sales statistics provides
a total for the use of oil products. The use in the different sectors must sum up to this total. This
is not the case for the other energy carriers. The method used for oil products defines use as
identical to sales; in practice, there will be annual changes in consumer stocks, which are not
accounted for.
However, since the late 1990s the distribution in the sales statistics between different middle
distillates has not been in accordance with the bottom-up estimated consumption of the

IIR 2017
58
products. In particular, the registered sales of light fuel oil have generally been too low, and it is
known that some auto diesel also is used for heating. In order to balance the accounts for the
different products, it has since 1998 been necessary to transfer some amounts between
products instead of using the sales figures directly. The most important transfer is from auto
diesel to light fuel oil, but in addition some auto diesel has also been transferred to heavy
distillate.
Due to inaccuracies in the reporting of sales of marine gas oil from approximately 2005, there is
also some uncertainty connected to the distribution between domestic and international sea
transport for the latest years.
Stationary use takes place in boilers and, in some manufacturing industries, in direct-fired
furnaces. There is also some combustion in small ovens, mainly in private households. Mobile
combustion is distributed between a number of different sources, described in more detail in
chapter 3.2.4 Transport. In addition to oil products included in the sales statistics, figures on use
of waste oil are given in Statistics Norway's statistics on energy use in the manufacturing
industries. Statistics Norway also collects additional information directly from a few companies
about the use of waste oil as a fuel source.
Generally, in Norway there is a continual shift between use of oil and hydroelectricity,
corresponding to changes in prices. Between years, this may cause changes in use of oil
products and corresponding emissions which can be considerable.
Coal, coke and petrol coke
Use of coal, coke and petrol coke in manufacturing industries is annually reported from the
plants to Statistics Norway. The statistics cover all main consumers and are of high quality.
Combustion takes place partly in direct-fired furnaces, partly in boilers. Figures on some minor
quantities burned in small ovens in private households are based on sales figures. In addition,
the figure on an insignificant use of coal in the agricultural sector was formerly collected from
one farmer. Since 2002, there has been no use of coal in Norwegian agriculture.
Biofuels
Use of wood waste and black liquor in manufacturing industries is taken from Statistics Norway's
annual survey on energy use in these sectors. Use of wood in households is based on figures on
the amount of wood burned from the annual survey on consumer expenditure for the years
before 2005 and for 2012. The statistics cover purchase in physical units and estimates for self-
harvest. The survey figures refer to quantities acquired, which not necessarily correspond to use.
The survey gathers monthly data that cover the preceding twelve months; the figure used in the
emission calculations (taken from the energy balance), is the average of the survey figures from
the year in question and the following year. For the years 2005-2011, the figures are based on
responses to questions relating to wood burning in Statistics Norway’s Travel and Holiday
Survey. The figures in this survey refer to quantities of wood used. The survey quarterly gathers
data that cover the preceding twelve months. The figure used in the emission calculations is the
average of five quarterly surveys. Figures on some minor use in agriculture and in construction

IIR 2017
59
are derived from earlier surveys for these sectors. Combustion takes place in boilers and in small
ovens in private households. Consumption figures for wood pellets and wood briquettes are
estimates, based on annual information from producers and distributors. Data on use of peat for
energy purposes is not available, but according to the Energy Farm, the centre for Bioenergy in
Norway, such use is very limited (Hohle 2005).
Waste
District heating plants and incineration plants annually report combusted amounts of waste
(boilers) to Statistics Norway and the Norwegian Environment Agency. There is also some
combustion in manufacturing industries, reported to Statistics Norway.
According to the Norwegian Pollution Act, each incineration plant has to report emission data
for SO2, NOX, CO, NH3, particles, heavy metals and dioxins, and the amount of waste incinerated
to the county governor. The county governor then reports this information to the Norwegian
Environment Agency. If emissions are not reported, the general method to estimate emissions
from waste incineration is to multiply the amount of waste used by an appropriate emission
factor. Normally a plant specific emission factor is made for the component in question. This
factor is based on the ratio between previous emission figures and quantities of waste burned.
This factor is then multiplied with the amount of waste incinerated that specific year.
Energy balance sheets vs. energy accounts
There are two different ways of presenting energy balances: Energy balance sheets (EBS) and
energy accounts. The energy figures used in the emission calculations are mainly based on the
energy balance sheets.
The energy accounts follow the energy consumption in Norwegian economic activity in the same
way as the national accounts. All energy used by Norwegian enterprises and households is to be
included. Energy used by Norwegian transport trades and tourists abroad is also included, while
the energy used by foreign transport industries and tourists in Norway is excluded.
The energy balance sheet follows the flow of energy within Norway. This means that the figures
only include energy sold in Norway, regardless of the users' nationality. This leads to deviations
between the energy balance sheet and the energy accounts, especially for international shipping
and aviation.
The energy balance sheet has a separate item for energy sources consumed for transportation
purposes. The energy accounts place the consumption of all energy under the relevant
consumer sector, regardless of whether the consumption refers to transportation, heating or
processing.
Figures from the energy sources balance sheet are reported to international organisations such
as the OECD and the UN. The energy balance sheet should therefore usually be comparable with
international energy statistics.
IIR 2017
60
Important differences between figures presented in the energy balance sheet (EBS) and figures
used in the emission calculations (EC) are:
Air transport: EC use only Norwegian domestic air traffic (excluding military), while EBS
includes all energy sold in Norway for air transport, including military and energy used
for international air transport.
Coal/coke for non-energy purposes: This consumption is included in net domestic
consumption in EBS, whereas EC include only energy used for combustion in the
calculation of emissions from energy. Emissions from coal and coke used as reducing
agents are accounted for in the IPPU sector.
Emission factors
Emission factors used for the energy sector are given in Appendix B. Emission factors for SO2 are
independent of combustion technology. In cases where technology for cleansing of SO2 has been
installed, this will be reflected in the emission figures reported from the respective plants. For
the other emission components, further descriptions are also given for each source sector.
The emission factors of NOX, CO, NMVOC and NH3 for stationary combustion have been
evaluated by Norsk Energi for the Norwegian Environment Agency. The evaluation is described
in the report ”Vurdering av utslippsfaktorer for beregning av NOX-utslipp med mer fra stasjonær
forbrenning i Norge” (Evaluation of NOX emission factors etcetera from stationary combustion in
Norway) (Norsk Energi 2003). The report focused mainly on NOX, but also emission factors for
CO, NMVOC and NH3 were considered.
The conclusion in Norsk Energi (2003) was that there are significant discrepancies between the
emission factors from literature and the factors used in the inventory. Some of the emission
factors used in the national inventory are higher and some lower than the emission factors
found in literature. To some extent the discrepancy is due to the fact that the emission factors
from literature are not reflecting technology used in Norway and are therefore not valid for
Norwegian conditions. In addition it is considered that some of the Norwegian emission factors
are based on more reliable data than the factors from literature. However, Norsk Energi (2003)
proposed to change some of the emission factors, due to the fact that the factors from literature
were considered to be of better quality than those used in the Norwegian emission inventory.
One of the factors was the NOX emission factor for heavy fuel oil, see below. In general, for all
other compounds the emission factors proposed in Norsk Energi (2003) were lower than the
emission factors that are used in the Norwegian emission inventory. We consider that the effect
on national totals of not replacing the emission factors with the proposed factors in Norsk Energi
(2003) has led to overestimated emissions. However, Norway is continuously considering all
aspects of the Norwegian emission inventory, including the emission factors, and with the
updated EMEP Guidebook (EEA 2016) we now consider to evaluate the emission factors in our
inventory.
NOX
The NOX emission factors used in the Norwegian emission inventory have, as mentioned above,
been evaluated by Norsk Energi in Norsk Energi (2003) and also in “NOX-utslipp i forbindelse
med eventuell NOX-avgift” (Evaluation of NOX emissions in connection with implementing NOX
tax) (Norsk Energi 2006). The conclusion in both reports is that the NOX emission factors used in
IIR 2017
61
the inventory are within the intervals Norsk Energi found in their own measured data and from
literature.
Norsk Energi (2003) concluded that the general emission factor for heavy fuel oil should be
considered to be changed from 4.2 to 5 kg NOX per tonne fuel and for chemical and metal
industry from 5 to 6 kg NOX per tonne heavy fuel oil. The consumption of heavy fuel oil in
stationary combustion in Norway is very small and NOX emissions in the Norwegian inventory
from the largest consumers of heavy fuel oil in industry are based on plant specific data. Due to
this, the proposed emission factors from Norsk Energi (2003; 2006) are not included in the
Norwegian emission inventory.
SO2
The emission factors for SO2 from oil products change yearly, in accordance with variations in
the sulphur content in the products. The presented factors refer to uncleansed emissions; in
cases where the emissions are reduced through installed cleansing measures, this will be
reflected in emission figures reported from the respective plants.
Uncertainties
Uncertainty estimates for long-range transboundary air pollutants are given in Appendix C, as
well as under the individual underlying source categories.
Generally, the total energy use is less uncertain than the energy use in each sector. For some
sectors (e.g. the energy and manufacturing industries) the energy use is well known, while it is
more uncertain in households and the service sectors. The energy use in the most uncertain
sectors has been adjusted in the official energy statistics, so that the sum of the energy use in all
sectors equals the total sales.
Completeness
All known combustion with energy utilization in different industries and private households is
included.
QA/QC
The emission sources in the energy sector are subjected to the QA/QC procedures described in
section 1.6.
Energy industries
NFR 1A1
Last update: 10.03.2015
Description
Energy industries include emissions from electricity and heat generation and distribution,
extraction of oil and natural gas, coal production, gas terminals and oil refineries. Norway
produces electricity mainly from hydropower, so emissions from electricity production are small
compared to most other countries. Due to the large production of oil and gas, the emissions
from combustion in energy production are high.

IIR 2017
62
Emissions from drilling at moveable offshore installations are included here. Emissions from
these installations while not in operation (during transport, etc.) are included with 1A3d
Navigation.
Method
A general description of the method used for estimation of emissions from fuel combustion is
given in section 3.2.1.1. For waste incineration, also a more detailed description of the
methodology for some components is given in this section.
Waste incineration
N2O and NOX
Emissions of NOX are reported from each plant to the Norwegian Environment Agency. An
estimated amount of 2.5 per cent of this NOX is subtracted and reported to UNFCCC as N2O (SFT
1996). Accordingly, the net NOX emissions constitute 97.5 per cent of the emissions reported by
the plants. For some years, emissions of NOX have not been reported for a number of plants. In
these cases, specific emission factors for the plants have been made, based upon earlier
emissions and amounts of waste incinerated. These new factors have been used to estimate the
missing figures.
Particles
Emissions of particles from district heating plants are reported to the Norwegian Environment
Agency. The different plants started to report particulate emissions at various points in time.
Most of them started reporting from 1994. Emissions of particles in the years before reporting
have been assumed to be the same as in the first year the plant reported. New control device
systems (mainly wet scrubbers) were installed at the end of the 1980s at the largest plants.
Around 1995 more control device systems were installed as a result of stricter emission
requirements. Most plants today have fabric filter or electrofilter together with wet scrubbers.
Only two plants do not have wet scrubbers.
The emission permits do not state which particle fraction that is going to be measured. It is
common to measure total amount of particles. It is however presumed that the particles
emitted are less than PM2.5. TSP and PM10 are therefore the same as PM2.5.
Dioxins
Emissions of dioxins from waste burning at district heating plants are reported to the Norwegian
Environment Agency. We have reported data for each plant from the period 1994/1995. Before
1994 we have only national totals. For estimating the emissions of dioxins for each plant before
1994 we derived an emission factor from total amount of waste burned together with the total
dioxin estimate. The emissions of dioxins were estimated by multiplying the given emission
factor of 20 μg/tonne waste by the amount of waste burned at each plant. This calculation was
done for each of the missing years for plants that did not report emissions.
PCB
PCB emissions are nor reported to the Norwegian Environment Agency. A country specific

IIR 2017
63
emissions factor has been used to estimate PCB. To take into accounts emission reduction
systems implemented in incinerators, this emission factor decreases during the period, following
the trend of dioxins emission factor.
Heavy metals
The estimate of heavy metals from waste combustion at district heating plants is reported to the
Norwegian Environment Agency. Before 1999, many emissions of heavy metals were reported
together as one group. This made it difficult to use the data to estimate the emission of each
component. From 1999, there are separate data for each component, but for As, Cr and Cu
there are a few plants that have insufficient reporting. To calculate the emissions of heavy
metals before 1999 we have estimated an emission factor for each plant with the aid of
reported emission data and amount of waste burned at each plant. The emission factor derived
has been used to calculate emissions for previous years by multiplying each specific emission
factor with the amount burned for the corresponding year for each plant.
Every district heating plant had stricter emission requirements for particles from 1995. It is
expected that the emissions of heavy metals, except for mercury, were reduced analogously. At
the same time, the emission of mercury was regulated from 0.1 mg/Nm3 to 0.05 mg/Nm3. These
regulations are considered while calculating emissions for previous years.
Activity data
Electricity and heat generation and distribution
The energy producers annually report their use of different energy carriers to Statistics Norway.
There is only some minor use of oil products at plants producing electricity from hydropower.
Combustion of coal at Norway's only dual-purpose power plant at Svalbard/Spitsbergen is of a
somewhat larger size. The amount of waste combusted at district heating plants is reported
annually both to Statistics Norway and the Norwegian Environment Agency. The data are
considered to be of high quality.
Extraction of oil and natural gas
Production of oil and natural gas is the dominating sector for emissions from combustion in the
energy industries in Norway. The Norwegian Petroleum Directorate annually reports the
amounts of gas combusted in turbines and diesel burned in turbines and direct-fired furnaces on
the oil and gas fields. The data are of high quality, due to the CO2 tax on fuel combustion. These
activity data are used for 1990-2002. From 2003 onwards, reported emission figures from the
field operators are used.
Coal production
Norway's coal production takes place on Svalbard. The only coal producing company annually
reports its coal consumption and some minor use of oil products. In addition to emissions
related to Norway's own coal production, also emissions from Russian activities are included in
the Norwegian emission inventory. Russian activity data are scarce, and emissions from an
estimated quantity of coal combusted in Russian power plants are calculated. Since 1999 there
has been only one such plant, in earlier years there were two of those.

IIR 2017
64
Gas terminals
Natural gas from the Norwegian continental shelf is landed, treated and distributed at gas
terminals on shore. There are four gas terminals in Norway. The eldest started up before 1990,
one in 1996 and two in 2007. Annual figures on natural gas combusted in turbines and flared are
reported to the Norwegian Petroleum Directorate (figures on flaring at one plant is reported to
the Norwegian Environment Agency).
Gas power plants
Norway had in 2011 two major gas power plants and several minor ones. The first of the large
plants was opened in 2007 and runs intermittently, depending on electricity and gas prices. The
second large plant was opened in 2010. Several of the smaller plants are back-up plants that are
run only in emergency situations. Thus, there will be large annual fluctuations in emissions.
Oil refineries
The oil refineries annually report their use of different energy carriers to Statistics Norway.
Refinery gas is most important, but there is also some use of LPG and oil products. Burning of
coke while regenerating the catalyst in cracker units is reported under 1B2A4 – Fugitive
emissions – Refining/Storage.
Emission factors
Emission factors used for the energy sector are given in Appendix B. For some industries and
components more information about the derivation of the emission factors are given in this
section.
SO2
Russian electricity and heat production
Emissions from combustion of coal for electricity production in the Russian settlements on
Svalbard are included in the Norwegian emission inventory. Up to 1998 there were two Russian
settlements with electricity and heat production: Barentsburg and Pyramiden. Since the coal
production at Pyramiden was closed down in 1998, the settlement was abandoned, and all
activity now takes place in Barentsburg. For SO2, emission factors are based on information from
Trust Arktikugol in Moscow. From 1999, the factor 70 kg/tonne is used, and for earlier years 16
kg/tonne. The factor-estimated figures are reduced by 60 per cent, due to the assumption that
such an amount of the sulphur is bound in the ash.
NOX
Offshore installations
NOX emissions from diesel engines at offshore installations were revised in 2014 based on
Karlsson and Finborud (2012). The recommended factors are shown in Table 3.3.
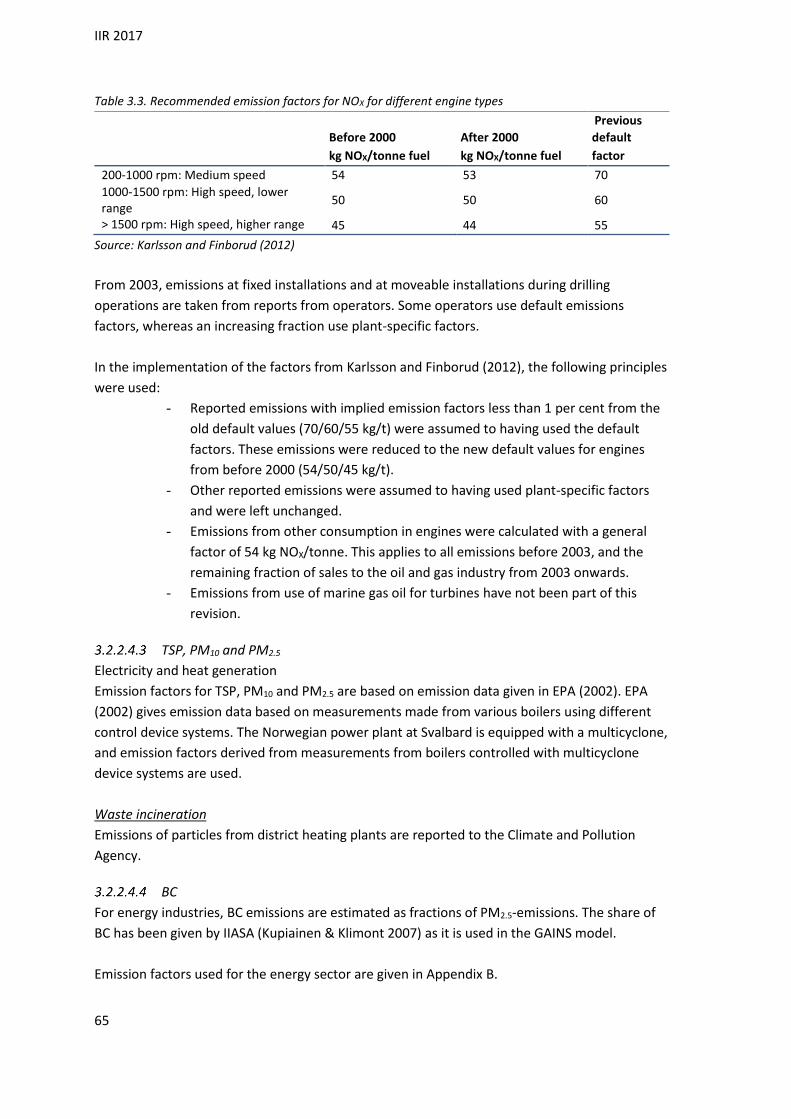
IIR 2017
65
Table 3.3. Recommended emission factors for NOX for different engine types
Previous
Before 2000 After 2000 default
kg NOX/tonne fuel kg NOX/tonne fuel factor
200-1000 rpm: Medium speed 54 53 70
1000-1500 rpm: High speed, lower range
50 50 60
> 1500 rpm: High speed, higher range 45 44 55
Source: Karlsson and Finborud (2012)
From 2003, emissions at fixed installations and at moveable installations during drilling
operations are taken from reports from operators. Some operators use default emissions
factors, whereas an increasing fraction use plant-specific factors.
In the implementation of the factors from Karlsson and Finborud (2012), the following principles
were used:
- Reported emissions with implied emission factors less than 1 per cent from the
old default values (70/60/55 kg/t) were assumed to having used the default
factors. These emissions were reduced to the new default values for engines
from before 2000 (54/50/45 kg/t).
- Other reported emissions were assumed to having used plant-specific factors
and were left unchanged.
- Emissions from other consumption in engines were calculated with a general
factor of 54 kg NOX/tonne. This applies to all emissions before 2003, and the
remaining fraction of sales to the oil and gas industry from 2003 onwards.
- Emissions from use of marine gas oil for turbines have not been part of this
revision.
TSP, PM10 and PM2.5
Electricity and heat generation
Emission factors for TSP, PM10 and PM2.5 are based on emission data given in EPA (2002). EPA
(2002) gives emission data based on measurements made from various boilers using different
control device systems. The Norwegian power plant at Svalbard is equipped with a multicyclone,
and emission factors derived from measurements from boilers controlled with multicyclone
device systems are used.
Waste incineration
Emissions of particles from district heating plants are reported to the Climate and Pollution
Agency.
BC
For energy industries, BC emissions are estimated as fractions of PM2.5-emissions. The share of
BC has been given by IIASA (Kupiainen & Klimont 2007) as it is used in the GAINS model.
Emission factors used for the energy sector are given in Appendix B.

IIR 2017
66
Waste incineration
The share of BC among TSP proposed in Kupiainen and Klimont (2004) has been used to
estimate BC emissions. It gives a mass share of 0.9 percent of BC in PM2.5.
For incineration of special waste, the same BC share as for heavy fuel oil combustion in
residential, commercial, services and agriculture have been used. The share is given in Appendix
B.
Dioxins and PAH
Electricity and heat generation
Dioxin emissions from coal combustion at the power plants at Svalbard are derived from
emission factors found in literature. The emission factor used is the emission factor
recommended in Bremmer et al. (1994). The same emission factor is also used in Parma et al.
(1995) and Hansen (2000). Burning of coal at power plants is also expected to give particle-
bound dioxin emissions, but because of the effective control device using multicyclone collector,
the emissions are expected to be low.
Emission factors used for benzo(a)pyrene, benzo(b)fluoranthene, benzo(k)fluoranthene and
indeno(1,2,3-cd)pyrene are the emission factor recommended in Guidebook 2016. Chapter 5C1,
table 3-1. Is used for the years 1990-1995, and table 3-2 is used for the years after 1995.
PAH emissions from waste incineration are calculated by emission factors and amount of waste
burned. We have no plant or country specific emission profile of PAH from waste incineration at
district heating plants in Norway.
PCB
So as to take into account emissions regulation in waste incineration, which was first
implemented in 1995 and reinforced in 2006, PCB emissions factor decreases along the period.
From 1990 to 1994, the value given in the EMEP/EEA guidebook (2007) has been used to
estimate PCB emissions from municipal waste and special waste.
In 2010, a PCB emission factor for municipal waste was estimated from emission measurements
of waste incineratiors. This emission factor has been considered for the estimations of PCB
emissions after 2006. For the period 1995-2005, an emission factor has been derived from the
dioxins trend observed during the same period.
As no measurements have been done for incineration of special waste, emission factors for the
years after 1995 has been estimated using the same trend as for municipal waste. Table 3.4
presents PCB emissions factors.
Table 3.4. Emission factors for PCB from waste incineration plants, mg/tonn of waste
1990-1994 1995-2005 2006 ->
Municipal waste 0.82 0.00064 0.000032
Special waste 5 0.0039 0.0002
Source:Statistics Norway

IIR 2017
67
Heavy metals
Electricity and heat generation
The emission factors for heavy metals used for calculating emissions from coal fired power
plants are from EEA (2001). The factors are, however, not specific for coal fired power plants but
standard factors recommended for calculating emissions from coal combustion in energy and
transformation industries.
HCB
For energy industries, HCB emissions have been estimated for the use of coal, light fuel oil,
wood waste, black liquor, municipal and other waste. Emission factors used for the energy
sector are given in Appendix B.
Waste incineration
HCB emissions are not reported by waste incineration plants. So as to take into account
emissions regulation in waste incineration, which was first implemented in 1995 and reinforced
in 2006, HCB emission factor decreases along the period. Most of installations have anticipated
2006 regulation. Therefore, the emission factor from waste incineration in Denmark (Nielsen et
al. 2010) has been considered since the year 2005. For 1995, emission factor has been estimated
using the reduction trend of dioxins emission factor observed between 1995 and 2004. This
emission factor has been used for the period 1995-2004. For the period 1990-1994, an emission
factor from a former guidebook (EEA 2007) has been considered. Emission factors are presented
in the Table 3.5.
Table 3.5. Emission factors for HCB from waste incineration plants, mg/tonn of waste
1990-1994 1995-2004 2005 ->
Municipal waste 2 0.9 0.045
Other waste 10 4.5 0.2
Source:Statistics Norway, Nielsen et al. (2010), EEA (2007)
Extraction of oil and natural gas
HCB emissions from the use of marine gas oil in offshore platform have been estimated using
the same emission factor as for the use of marine gas oil in ship. 0.08 mg HCB/tonn of gas oil has
been used.
Uncertainties
Uncertainty estimates for long-range air pollutants are given in Appendix C. Since the energy use
is well known for the energy industries, the uncertainty in the activity data is considered to be
minor.
The uncertainty in the activity data is ± 3 per cent of the mean for oil, ± 4 per cent for gas and ±
5 per cent of the mean for coal/coke and waste.
Completeness
Major missing emission sources are not likely.
IIR 2017
68
Source specific QA/QC
The energy industries are subjected to the general QA/QC procedures described in section 1.6.
Some source specific QA/QC activities were conducted in the following industries:
Heat generation in district heating plants
Emissions of heavy metals and POPs from waste incineration have been subject to detailed
control. The estimates are based on measurements, but the values are uncertain due to high
variability. Reported emission values can vary by orders of magnitude from year to year. Each
historical value has been checked in the QA/QC process, and some data have been rejected and
replaced by calculated values.
Extraction of oil and natural gas
For emissions of NOX from turbines offshore, time series over the emissions calculated with field
specific emission factors have been compared with the emissions given, using the earlier used
average emission factor.
From 2003 onwards, field specific emission figures reported from the companies are used
directly in the emission model. These figures are compared with emissions calculated on the
basis of field specific activity data and emission factors.
Manufacturing industries and construction
NFR 1A2
Last update: 20.05.09
Description
Emissions from the sector of manufacturing industries and construction include industrial
emissions that to a large extent originating from the production of raw materials and semi-
manufactured goods (e.g. metals, petrochemicals, pulp and paper and mineral products). These
emissions are related to fuel combustion only, that is, emissions from use of fuel for heating
purposes. Consumption of coal as feedstock and reduction medium is not included in this sector,
but is accounted for under the industrial processes sector (chapter 4).
The interannual variation in implied emission factors for heavy metals and dioxins in 1A2 is in
some cases considerable. Examples are emissions of Pb, Hg and dioxin in 1A2d. These emission
estimates are based on a combination of reported figures from the plants to the Norwegian
Environment Agency and emissions based on activity data multiplied with emission factors given
in Appendix B. Energy use from the same plants is reported to Statistics Norway. Whenever
emissions are reported these figures are used in the inventory.
Emissions of Pb in 1A2d have increased since 2000 due to increased combustion of special waste
at the plants. The EF used for burning of special waste is 14 g Pb/tonne while for instance the EF
for burning of heavy fuel oil is 1 g Pb/tonne. Emissions have increased, while the total energy
consumption (activity data) has been more or less at the same level since 1994, with a minor
decrease the latest years. This has led to increased IEFs. For some glass production plants the
IIR 2017
69
reported emissions of Pb is not splitted into emissions from process and combustion. In these
cases, the whole emission is placed on the source that is thought to be the most prominent.
For Hg the emissions in 1A2d follow the same trend as the amount of liquid fuels used. The IEFs
increases the years the consumption of liquid fuels increases and decreases the years the
consumption of liquid fuels decreases.
For dioxins, IEFs vary due to variations in reported figures for one plant. The plant burnt various
waste fractions in addition to regular fuel. The plant was closed down during 2001.
Activity data
Most of the emission figures are calculated on the basis of activity data and emission factors. For
some large plants, varying emission figures are based on reported figures from the plants.
Statistics Norway carries out annual sample surveys on energy use in manufacturing industries,
which supply most of the data material for the calculation of combustion emissions in these
sectors in cases when reported emission figures not are used. The energy use survey is assumed
to cover approximately 96 per cent of the energy use in this sector. For the remaining
companies, figures are estimated based on data from the sample, together with data on
economic turnover, taking into account use of different energy carriers in the same industries
and size groups. A change in methodology from 1998 has had minor consequences for the time
series, since the energy use is mainly concentrated to a few major plants within the industry,
from which data were collected in both the present and the earlier method. The data on energy
use in manufacturing industries are considered to be of high quality. Information on use of
waste oil and other hazardous waste is also collected through the energy use statistics.
For the construction industry, the figures on use of the different energy carriers are partly taken
from the annual sales statistics for petroleum products and partly projected from earlier
surveys; the energy data are considered rather uncertain. In some sectors, autodiesel is mainly
used in machinery and off-road vehicles, particularly in mining and construction. This amount of
fuel is based on reported consumption of duty-free autodiesel in the manufacturing industries
and on reported sales of duty-free autodiesel to construction. The methods for calculating
emissions from motorized equipment are discussed in section 3.2.4.7. Emissions from off-road
machinery in manufacturing industries and construction are reported in NFR category 1A2g vii.
Emission factors
Emission factors used for the energy sector are given in Appendix B.
Uncertainties
Uncertainty estimates for long-range air pollutants are given in Appendix C. The energy use is
considered well known for the manufacturing industries.
Completeness
Major missing emission sources are not likely.

IIR 2017
70
Source specific QA/QC
There is no specific QA/QC procedure for this source. See section 1.6 for the description of the
general QA/QC procedure.
Transport
NFR 1A3
Aviation
NFR 1A3a
Last update: 04.03.2016
Method
The calculation methodology applied is described in Skullerud (2014). According to the IPCC
Good Practice Guidance the methodology used is Tier 2 based on the detailed methodology in
EEA (2001). This methodology allows estimation of emissions and fuel consumption for different
types of aircraft according to the average flying distance and numbers of landings and take-offs
(LTO). All movements below 1000 m are included in the "Landing Take Off" (LTO) cycle.
Movements over 1000 m are included in the cruise phase. All emissions from international
aviation are excluded from national totals, and are reported separately (see section 3.2.6.3).
Activity data
Statistics Norway annually collects data on use of fuel from the air traffic companies. These data
include specifications on domestic use and amounts bought in Norway and abroad. The types of
fuel used in aircrafts are both jet fuel (kerosene) and aviation petrol. The latter is used in small
aircrafts only. Emissions from the consumption of jet kerosene in domestic air traffic are based
directly on these reported figures. Domestic consumption of jet kerosene has been reported to
Statistics Norway by the airlines since 1993. The survey is annual, but data from the surveys for
1993 and 1994 have not been used here, as one of the largest airlines in Norway was not
included. Domestic consumption prior to 1995 is estimated by extrapolation on the basis of
domestic kilometres flown and is more uncertain (Finstad et al. 2002a). Sales figures are used
for the minor use of aviation petrol. The time series for liquid fuels used in aviation is given in
Table 3.6.
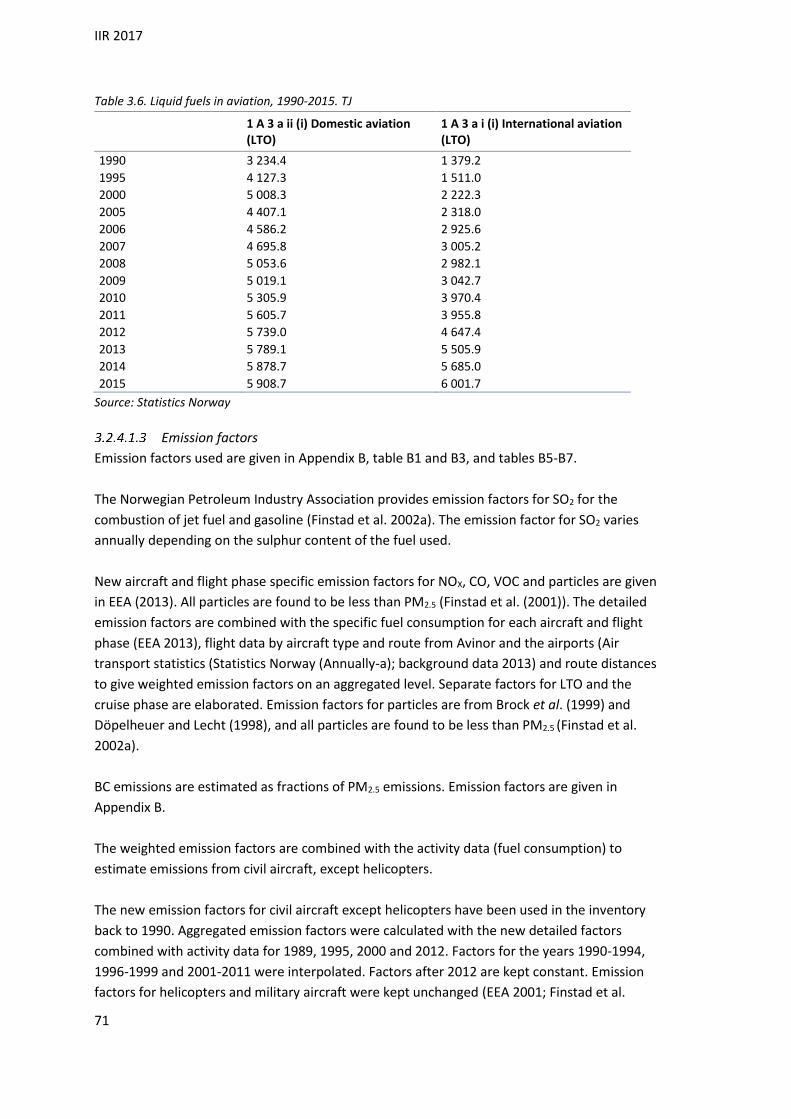
IIR 2017
71
Table 3.6. Liquid fuels in aviation, 1990-2015. TJ
1 A 3 a ii (i) Domestic aviation (LTO)
1 A 3 a i (i) International aviation (LTO)
1990 3 234.4 1 379.2
1995 4 127.3 1 511.0
2000 5 008.3 2 222.3
2005 4 407.1 2 318.0
2006 4 586.2 2 925.6
2007 4 695.8 3 005.2
2008 5 053.6 2 982.1
2009 5 019.1 3 042.7
2010 5 305.9 3 970.4
2011 5 605.7 3 955.8
2012 5 739.0 4 647.4
2013 5 789.1 5 505.9
2014 5 878.7 5 685.0
2015 5 908.7 6 001.7
Source: Statistics Norway
Emission factors
Emission factors used are given in Appendix B, table B1 and B3, and tables B5-B7.
The Norwegian Petroleum Industry Association provides emission factors for SO2 for the
combustion of jet fuel and gasoline (Finstad et al. 2002a). The emission factor for SO2 varies
annually depending on the sulphur content of the fuel used.
New aircraft and flight phase specific emission factors for NOX, CO, VOC and particles are given
in EEA (2013). All particles are found to be less than PM2.5 (Finstad et al. (2001)). The detailed
emission factors are combined with the specific fuel consumption for each aircraft and flight
phase (EEA 2013), flight data by aircraft type and route from Avinor and the airports (Air
transport statistics (Statistics Norway (Annually-a); background data 2013) and route distances
to give weighted emission factors on an aggregated level. Separate factors for LTO and the
cruise phase are elaborated. Emission factors for particles are from Brock et al. (1999) and
Döpelheuer and Lecht (1998), and all particles are found to be less than PM2.5 (Finstad et al.
2002a).
BC emissions are estimated as fractions of PM2.5 emissions. Emission factors are given in
Appendix B.
The weighted emission factors are combined with the activity data (fuel consumption) to
estimate emissions from civil aircraft, except helicopters.
The new emission factors for civil aircraft except helicopters have been used in the inventory
back to 1990. Aggregated emission factors were calculated with the new detailed factors
combined with activity data for 1989, 1995, 2000 and 2012. Factors for the years 1990-1994,
1996-1999 and 2001-2011 were interpolated. Factors after 2012 are kept constant. Emission
factors for helicopters and military aircraft were kept unchanged (EEA 2001; Finstad et al.

IIR 2017
72
2002a).
Uncertainties
Activity data
The uncertainty in the activity data for civil aviation is estimated to be 20 per cent of the mean,
primarily due to the difficulty in separating domestic emissions from emissions from fuel used in
international transport (Rypdal & Zhang 2000). Fuel consumption in 2012 was also estimated
bottom-up based on the fuel consumption factors from EEA (2013) and compared to the
reported figures according to the method described in Finstad et al. (2002a), see also section
3.2.4.1.6). The estimated and reported data differed by about 25 per cent. However, the
reported data are considered most accurate and were used in the calculation. As described
above, data before 1995 are more uncertain than for later years. This may also to a certain
degree affect the time series consistency.
Completeness
Major missing emission sources are not likely.
Source specific QA/QC
In 2002, a methodology improvement was made in the emission calculations for civil aviation
(Finstad et al. 2002a). According to the IPCC Good Practice Guidance the methodology used is
Tier 2 based on the detailed methodology in EEA (2001). This methodology allows estimation of
emissions and fuel consumption for different types of aircrafts according to the average flying
distance and numbers of landings and take-offs (LTO). The estimation is provided with new
emission and fuel consumption factors for civil aircraft, except helicopters, from EEA (2013).
Road transport
NFR 1A3b i-v
Last update: 04.03.2016
Description
Emissions from this source includes combustion emissions from vehicles driven on roads, i.e. the
categories passenger cars, light duty vehicles, heavy duty vehicles (including buses and coaches)
and mopeds and motorcycles, as well as NMVOC emissions from gasoline evaporation. The
methodology used for calculating emissions is described in more detail i Holmengen and
Fedoryshyn (2015). The methodology corresponds to a Tier 3 methodology from the EMEP/EEA
2016 Guidebook (EEA 2016), using detailed information on vehicle fleet composition and driving
patterns.
For passenger cars and light duty vehicles there has been a marked shift from petrol to diesel
vehicles. In the 1990's petrol consumption within road transport far exceeded auto diesel.
Distance driven by petrol passenger cars equally exceeded distances for auto diesel passenger
cars. From 1.1.2007, there was a change in the registration tax for new passenger cars, and CO2
became one parameter in calculating the level in addition to curb weight and engine power. This
led to an increase in the sale of new diesel passenger cars. In 2006, the share of diesel vehicles
within new passenger cars was 48 per cent. In 2007, the same share had increased to 74 per
IIR 2017
73
cent and was steady on that level until 2011. Since 2012, a NOX – component was added to the
passenger cars taxation. The share of diesel cars sold has then been reduced. The share
amounted to 49 per cent of diesel cars in 2014 and 41 per cent in 2015.
Method
The consumption of gasoline for road traffic is estimated as total sales minus consumption for
other uses, i.e. a top-down approach. Other uses for gasoline are e.g. small boats, snow scooters
and motorized equipment. For auto diesel, the total consumption in road traffic is all auto diesel
charged with auto diesel tax, with two per cent addition for assumed tax free auto diesel used in
road traffic. For the years prior to 1997, the auto diesel taxation was incomplete, and the
consumption of auto diesel in road traffic was calculated as for gasoline, by subtracting the
consumption for other uses. Other uses of auto diesel are e.g. motorized equipment in
agriculture and construction. CNG and LPG are estimated by bottom-up approaches. The total
consumption of each fuel is attributed to different vehicle classes based on results from the
emission model of the Handbook of Emission Factors (HBEFA; (INFRAS 2009)).
Pollutants other than CO2 are estimated by the emission model of the Handbook of Emission
Factors (HBEFA; (INFRAS 2009)). The model uses a mileage approach: Emissions = mileage *
emission per km. The model results are used directly without any adjustment for discrepancies
between estimated and registered fuel consumption.
The HBEFA model provides emission factors and possibilities for calculating emissions for
segments and sub-segments for six vehicle classes: passenger cars, light commercial vehicles,
heavy commercial vehicles, urban buses, coaches and motorcycles (including mopeds). The
segments are based on engine volume for passenger cars and motorcycles, total weight for
heavy commercial vehicles, urban buses and coaches, and tare weight for light commercial
vehicles. The segments are further disaggregated to subsegments based on fuel type and
technology type (e.g. Euro-1 – Euro-5). The segments used for Norway in the HBEFA model are
given in Table 3.7.

IIR 2017
74
Table 3.7. Segments used for Norway in the HBEFA
Vehicle class Segment Fuel type Segment split based on
Engine volume/ weight class
Passenger car PC petrol <1,4L Petrol Engine volume < 1.4 litres
PC petrol 1,4-<2L Petrol Engine volume 1.4- 2.0 litres
PC petrol >=2L Petrol Engine volume >= 2.0 litres
PC diesel <1,4L Diesel Engine volume < 1.4 litres
PC diesel 1,4-<2L Diesel Engine volume 1.4- 2.0 litres
PC diesel >=2L Diesel Engine volume >= 2.0 litres
PC LPG LPG - All engine volumes
Light commercial vehicles LCV petrol M+N1-I Petrol Tare weight < 1305 kilos
LCV petrol N1-II Petrol Tare weight >= 1305-1760 kilos
LCV petrol N1-III Petrol Tare weight >= 1760-3859 kilos
LCV diesel M+N1-I Diesel Tare weight < 1305 kilos
LCV diesel N1-II Diesel Tare weight >= 1305-1760 kilos
LCV diesel N1-III Diesel Tare weight >= 1760-3859 kilos
Heavy goods vehicles RT petrol Petrol - All gross weights
RigidTruck <7,5t Diesel Gross weight <= 7.5 tonnes
RigidTruck 7,5-12t Diesel Gross weight > 7.5 - 12 tonnes
RigidTruck >12-14t Diesel Gross weight > 12 - 14 tonnes
RigidTruck >14-20t Diesel Gross weight > 14 - 20 tonnes
RigidTruck >20-26t Diesel Gross weight > 20 - 26 tonnes
RigidTruck >26-28t Diesel Gross weight > 26 - 28 tonnes
RigidTruck >28-32t Diesel Gross weight > 28 - 32 tonnes
RigidTruck >32t Diesel Gross weight > 32 tonnes
Tractor for AT <=7,5t Diesel Gross weight <= 7.5 tonnes
Tractor for AT>7,5-14t Diesel Gross weight > 7,5 - 14 tonnes
Tractor for AT>14-20t Diesel Gross weight > 14 - 20 tonnes
Tractor for AT>20-28t Diesel Gross weight > 20 - 28 tonnes
Tractor for AT >34-40t Diesel Gross weight > 34 - 40 tonnes
Tractor for AT >40-50t Diesel Gross weight > 40 - 50 tonnes
Tractor for AT >50-60t Diesel Gross weight > 50 - 60 tonnes
Coach Coach Std <=18t Diesel Gross weight <= 18 tonnes
Coach 3-Axes >18t Diesel Gross weight > 18 tonnes
Urban bus Ubus Midi <=15t Diesel Gross weight <= 15 tonnes
Ubus Std >15-18t Diesel Gross weight >15 - 18 tonnes
Ubus Artic >18t Diesel Gross weight > 18 tonnes
Ubus Std >15-18t CNG CNG Gross weight >15 - 18 tonnes
Ubus Artic >18t CNG CNG Gross weight > 18 tonnes
Motorcycles and mopeds Moped <=50cc (v<50kmh) Petrol Engine volume <= 50 cc
MC 2S <=150cc Petrol Engine volume <= 150 cc
MC 2S >150cc Petrol Engine volume >150 cc
MC 4S <=150cc Petrol Engine volume <= 150 cc
MC 4S 151-250cc Petrol Engine volume 151-250 cc
MC 4S 251-750cc Petrol Engine volume 251-750 cc
MC 4S >750cc Petrol Engine volume > 750 cc
Source: Statistics Norway/Norwegian Environment Agency
The model combines the number of vehicles within each segment with driving lengths for the
same segments to produce annual national mileage per subsegment. For heavy goods vehicles,
the vehicle number is corrected for vehicles driving with trailers, and the driving is split into
three load classes (empty, half loaded and fully loaded).

IIR 2017
75
The annual national mileage is split between shares driven in different traffic situations. The
traffic situations are a combination of area (urban/rural), road type (e.g. trunk road and access
road), speed limit and level of service (freeflow, heavy, saturated, and stop and go). The traffic
situations are further disaggregated by gradients, where the amount of driving on roads with
slopes ranging from -6 per cent to 6 per cent is specified for each traffic situation.
Hot emission factors are provided on the disaggregated level of subsegments and traffic
situations with different gradients, and the emissions are estimated after these steps of
disaggregation.
The HBEFA model provides emission factors for cold emissions and evaporative emissions (soak,
running losses and diurnal), in addition to hot emission factors. In order to calculate cold and
evaporative emissions, information on diurnal variation in curves of traffic, trip length
distributions, parking time distributions and driving behaviour distributions must be provided, in
addition to variations in mean air temperature and humidity.
Activity data
All activity data are, as far as possible, updated for every year of the inventory. Data are taken
primarily from official registers, public statistics and surveys. However, some of the data are
based on assumptions. Many of the data sources are less comprehensive for the earliest years in
the inventory. The sources of activity data are listed below:
Total fuel consumption: the total amounts of fuels consumed are corrected for off-road use
(in boats, snow scooters, motorized equipment, etc.). These corrections are estimated either
from assumptions about the number of units, annual operation time and specific fuel
consumption, or from assumptions about and investigations of the fraction of consumption
used off-road in each sector. Statistics Norway’s sales statistics for petroleum products supply
the data for total fuel consumption (Statistics Norway Annually-b). Fuel consumption in road
transport is given in Table 3.8.
Number of vehicles: the number of vehicles in the various categories and age groups is taken
from the statistics on registered vehicles, which receives data from the official register of the
Norwegian Directorate of Public Roads. The model input is number of vehicles per vehicle
class for each inventory year, and the share of vehicles for any given combination of segment
and fuel type. These data are combined with information on the introduction of technology
classes to provide number of vehicles within each subsegment. The information on
introduction of technology classes are for recent years based on information from the official
register of the Norwegian Directorate of Public Roads, and on legislation for the years in
which the information in the register is insufficient.
The HBEFA model distinguishes between two types of buses: urban buses, mainly used for
urban driving, and coaches, mainly used for rural and motorway driving. Due to lack of
specific information to make this split in the national vehicle register, the distinction between
urban buses and coaches are based on a methodology used in Sweden (Swedish
environmental protection agency 2011), where the split is made based on the ratio p/w. Here,
p is equal to the maximum allowed number of passengers (number of seats plus number of

IIR 2017
76
allowed standing passengers), and w is equal to the gross vehicle weight. These data are
available from the national vehicle register. Buses with a p/w-value above 3.75 are classified
as urban buses, whereas buses with a p/w-value below 3.75 are classified as coaches.
Average annual mileage: Mileages for passenger cars, light commercial vehicles, heavy goods
vehicles, coaches and urban buses are from 2005 onwards based on odometer readings taken
during annual or biannual roadworthiness tests. The readings are collected by the Directorate
of Public Roads and further processed by Statistics Norway (Statistics Norway 2010a). For
earlier years, most figures are determined from surveys by Statistics Norway or the Institute
of Transport Economics. In some instances assumptions are needed.
The statistics on number of vehicles depict the vehicle fleet per December 31st of the
inventory year, while the statistics on mileages represents annual driving for the entire year,
including vehicles that have been scrapped or in other ways been in the vehicle fleet for only
parts of the inventory year. To adjust for this discrepancy for the years 2005-2011, mean
annual driving lengths for each vehicle category have been adjusted upwards in such a way
that the totals correspond to the total annual traffic activity from the statistics on annual
driving lengths.
The average annual mileages vary as a function of age, with older vehicles generally driving
shorter annual distances than newer vehicles. The correction of driving as a function of
vehicle age is based on odometer readings taken during the roadworthiness test. The
functions are calculated as the mean of the years 2005-2011, and the same correction curve is
used for all years.
Motorcycles and mopeds are not subject to roadworthiness tests in Norway. Average annual
mileages are taken from a report on transport volumes in Norway (Vågane & Rideng 2010).
Due to lack of data, corrections of annual mileage as a function of age for motor cycles and
mopeds are taken from a Swedish survey (Bjørketun & Nilsson 2007) under the assumption
that annual mileages as a function of age are comparable in Norway and Sweden.
Load data are taken from the Road goods transport survey (Statistics Norway 2010b).
Transformation patterns are calculated using information from Statistics Norway’ Road goods
transport survey on use of trailers and trailer size (Statistics Norway 2010b).
Traffic situations: The Directorate of Public Roads has data on the annual number of vehicle-
kilometres driven on national and county roads. The data are allocated by speed limits, road
type, area type (urban/rural), and vehicle size (small/ large). Traffic on municipal roads
(approx. 15 per cent) is estimated by Statistics Norway based on road lengths, detailed
population data, traffic on adjoining roads, etc. The HBEFA model has emission factors for
different situations of traffic flow (freeflow, heavy traffic, saturated traffic, and stop and go).
Assumptions have been made as to this distribution for the different combinations of area
type, road type and speed limits for Norway. Effects of road gradients are included, based
primarily on Swiss data supplied to the HBEFA.
Ambient conditions (air temperature and humidity) are included in the model to calculate cold
and evaporative emissions. An average of five larger Norwegian cities has been used for
spring, summer, autumn and winter separately. The data are based on measurements from
the Norwegian Meteorological Institute.
Trip length and parking time distributions are calculated from the Norwegian travel survey
(Institute of transport economics 1993). The distributions are given on an hourly basis.
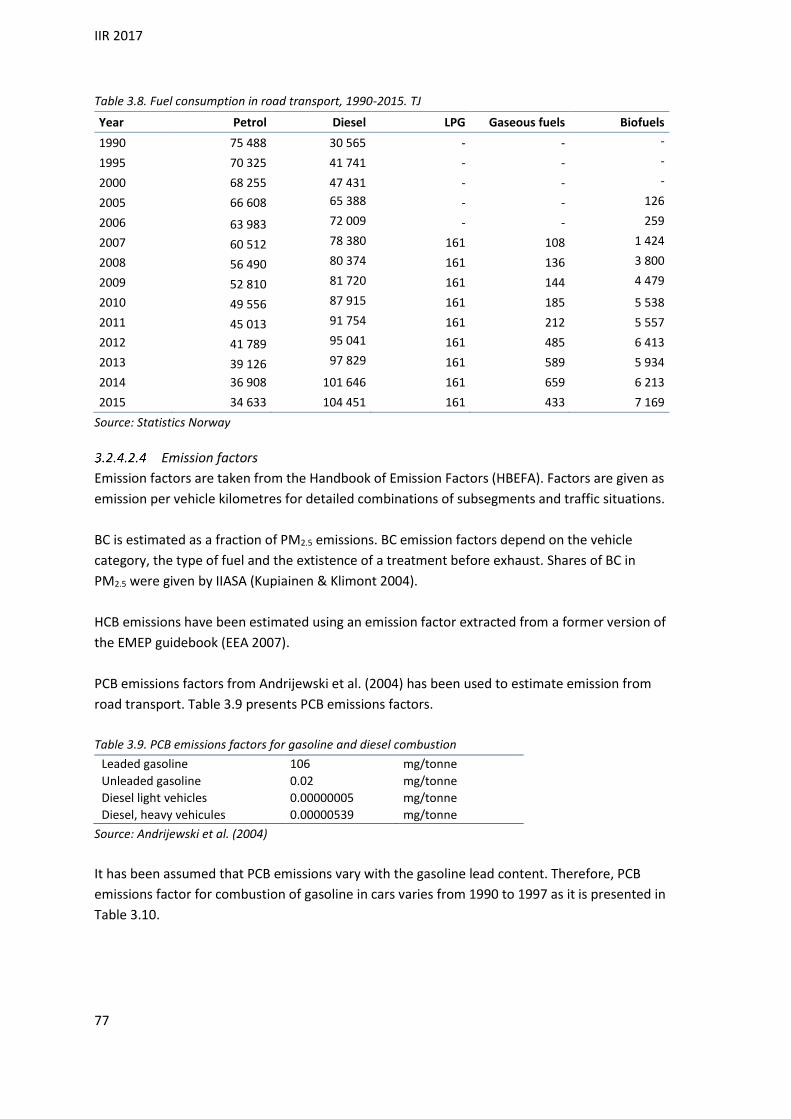
IIR 2017
77
Table 3.8. Fuel consumption in road transport, 1990-2015. TJ
Year Petrol Diesel LPG Gaseous fuels Biofuels
1990 75 488 30 565 - - -
1995 70 325 41 741 - - -
2000 68 255 47 431 - - -
2005 66 608 65 388 - - 126
2006 63 983 72 009 - - 259
2007 60 512 78 380 161 108 1 424
2008 56 490 80 374 161 136 3 800
2009 52 810 81 720 161 144 4 479
2010 49 556 87 915 161 185 5 538
2011 45 013 91 754 161 212 5 557
2012 41 789 95 041 161 485 6 413
2013 39 126 97 829 161 589 5 934
2014 36 908 101 646 161 659 6 213
2015 34 633 104 451 161 433 7 169
Source: Statistics Norway
Emission factors
Emission factors are taken from the Handbook of Emission Factors (HBEFA). Factors are given as
emission per vehicle kilometres for detailed combinations of subsegments and traffic situations.
BC is estimated as a fraction of PM2.5 emissions. BC emission factors depend on the vehicle
category, the type of fuel and the extistence of a treatment before exhaust. Shares of BC in
PM2.5 were given by IIASA (Kupiainen & Klimont 2004).
HCB emissions have been estimated using an emission factor extracted from a former version of
the EMEP guidebook (EEA 2007).
PCB emissions factors from Andrijewski et al. (2004) has been used to estimate emission from
road transport. Table 3.9 presents PCB emissions factors.
Table 3.9. PCB emissions factors for gasoline and diesel combustion
Leaded gasoline 106 mg/tonne
Unleaded gasoline 0.02 mg/tonne
Diesel light vehicles 0.00000005 mg/tonne
Diesel, heavy vehicules 0.00000539 mg/tonne
Source: Andrijewski et al. (2004)
It has been assumed that PCB emissions vary with the gasoline lead content. Therefore, PCB
emissions factor for combustion of gasoline in cars varies from 1990 to 1997 as it is presented in
Table 3.10.

IIR 2017
78
Table 3.10. PCB emissions factors for gasoline combustion for the period 1990-1997. Mg PCB/ tonne 1990 1991 1992 1993 1994 1995 1996 1997
mg/tonne 106 82 74 49 8 8 0.2 0.02
Source: Statistics Norway
Biofuels for transport are not handled as separate fuels. The consumption is included with
gasoline and autodiesel.
Average factors are listed in Appendix B.
Uncertainties
The uncertainty estimates are given in Appendix C.
The comparison of bottom up estimates of fuel consumption from HBEFA with total sales
(source specific QA/QC) reveals a discrepancy of 5-15 per cent. This is deemed to be a
reasonable difference. This discrepancy is handled differently for different emission
components. The total consumption of each type of fuel is the most important parameter in
relation to the reporting requirements of the UNFCCC, as this forms the basis for the calculation
of CO2 from road traffic (IPCC 2006). One kilogram of gasoline or autodiesel yields a fixed
amount of CO2 irrespective of vehicle type.
Guidelines for greenhouse gas reporting, the IPCC guidelines (IPCC 2006), states that CO2
emissions should be calculated using fuel consumption, and that sold amount of fuel should
form the basis. Calculations of emissions of CH4, N2O and many of the components of emissions
reported to CLRTAP (e.g. NOX and particulates), however, depends on more detailed information
about vehicle types and driving patterns, and here a more detailed model (for example HBEFA)
should be applied. The relationship between emissions and fuel consumption must be
considered differently for the emission components that are directly dependent on the
composition and quantity of fuel (CO2, SOX and heavy metals) and those who to a larger extent
depend on the type of vehicle and driving mode (e.g. NOX, CH4, N2O, NH3, CO, particles).
Fuel consumption is not an input to HBEFA, where emissions are calculated based on mileage
and number of vehicles in each subsegment of vehicle classes, as well as other data sets, such as
cold start and age distribution of mileage. Fuel consumption is however calculated in the model
similarly to emission calculations. The estimated fuel consumption for the country as a whole
can be compared with sold fuel sales statistics for petroleum products and energy balance. The
comparison shows that the fuel consumption calculated in HBEFA is systematically lower than
the fuel in the energy balance, and that the difference is greater for auto diesel than for petrol.
The difference has been between approximately 1 and 10 per cent for gasoline, and 4 and 15
per cent for diesel in the period 1990-2011. Exceptions are 1990 and 1991 for auto diesel when
the difference was very small, and 1993, when the difference was almost 30 percent. There is no
increasing or decreasing trend in the deviations, but there seems to be a correlation between
the deviation of petrol and diesel.
It is not known why there is a discrepancy between the consumption in the energy balance and
IIR 2017
79
bottom-up calculation in HBEFA, but there are several possible explanations as to why fuel sold
does not match the fuel consumption calculated from the road transport emission model:
Fuel purchased by foreign vehicles. Foreign vehicles are not included in the vehicle register
statistics, even though they drive on Norwegian roads. Similarly, no fuel bought by Norwegian
vehicles abroad is sampled. It is likely that there is no systematic "fuel tourism" across the
Norwegian border, as there are no significant price differences between fuel prices in Norway
and Sweden. The current calculations are based on the assumption that driving in Norway by
foreign vehicles equals the driving of Norwegian vehicles abroad.
1. Vehicles drive longer in reality than what the model calculates. Seeing that the Technical
Inspection of vehicles is a new data source for mileage, it is hard to imagine that
mileages in the model are systematically underestimated. Motorcycles do not have such
a Technical Inspection. They can however not explain the discrepancy between the
calculated use and the amount of fuel sold. For example, they mostly run on gasoline,
while the largest deviation is within auto diesel.
2. Driving patterns. There may be elements in the driving patterns that causes fuel
consumption per kilometer per vehicle to be higher than what the model calculates.
One possible reason here is that the fuel consumptions stated in the vehicle type
approvals are used as part of the input to the model, and there is an ongoing discussion
about whether these systematically underestimate consumption. These data are
however available only for the latter part of the series, and can not explain the
discrepancies in the 1990s.
Whether the emission calculations should be corrected for differences in fuel consumption
depends on the pollutants in question. For those components that are directly dependent on
the amount of fuel (CO2, SO2, heavy metals) it will always be appropriate to use the fuel
consumption from the energy balance as a basis for calculation. For the other emission
components, the decision on whether to correct for total fuel consumption or not will depend
on what is causing the discrepancy between fuel consumption calculated in the model and fuel
consumption in the energy balance. If the reason is that the total mileage is underestimated in
the model, and that the energy balance represents a "truer" picture of the consumption of fuels,
emissions should be corrected. If the discrepancy, however, is due to an underestimation of the
fuel consumption per kilometer, the emission estimates should not be corrected unless one
finds a clear correlation between changes in consumption per kilometer and emissions per
kilometer for the relevant emission components. As long as we do not know the reason for the
discrepancy, an assessment of data quality in the various input data is crucial to determining
whether emissions should be reconciled against fuel sales or not.
In the previous model (SFT 1993; SFT 1999b), the emissions of all substances were corrected to
account for the discrepancy between the energy balance and the model calculations, because
the energy balance was considered the most secure data source. When HBEFA was introduced
as the computational model, a new data source was also introduced, namely the mileage

IIR 2017
80
statistics from Statistics Norway. These statistics are based on data from periodical technical
inspections, and goes back to 2005. This important new data source is considered to be of good
quality, and it has changed the assessment of whether the emissions shall be corrected for the
consumption in the energy balance or not. There is no reason to believe that the total run
lengths are underestimated, and we consider it likely that the reason for the discrepancy lies in
the estimates of fuel consumption per kilometer. The energy balance is based on the
assessment that Norwegian purchases abroad correspond to foreign purchases in Norway, and
the same assessment is applied to the emission calculations. We have not found any reason to
believe that the reasons for the discrepancies in fuel consumption are directly correlated with
driving behavior. It has therefore been assessed that HBEFA estimated emissions of pollutants
that are not directly related to fuel consumption should not be reconciled with fuel
consumption.
There are currently no comprehensive statistics on foreign vehicles driving in Norway. One
possible explanation for the discrepancy between the calculated fuel consumption in HBEFA and
sold quantity of fuel is that foreign driving in Norway exceeds Norwegian driving abroad. There
has been an issue that the proportion of heavy vehicles with foreign vehicles increases.
However, we see no clear increasing trend in the difference between the model results and
sales. Better data related to foreign driving in Norway and the Norwegian driving vehicles
abroad would strengthen or refute the current assumption that these two balance each other
out.
Completeness
Major missing emission sources are not likely.
Source specific QA/QC
Top-down and bottom-up data on fuel consumption are compared for gasoline and diesel
vehicles on an annual basis. The consumption of gasoline and auto diesel for road traffic is
estimated as total sales minus consumption for other uses, i.e. a top-down approach. The HBEFA
emission model also makes bottom-up estimates of consumption, which can be compared with
the top-down data. The estimated fuel consumption from HBEFA deviates from the top-down
estimate by approximately 5-15 per cent per year, with the higher value for auto diesel. The
causes are on one hand uncertainties in the amount of non-road use and on the other hand
uncertainties in mileage and specific consumption in road transport.
However, the total consumption of auto diesel is well known. The uncertainty concerns the
allocation between road and non-road use, connected to illegal use of diesel without road tax in
road traffic. The total emissions may be sensitive to this allocation, due to different emission
calculation methodologies. When inspected, taxed and tax free diesel can be identified by
colour. The fine for illegal use of tax free diesel is currently from NOK 20 000,- and upwards.
There is no reason to believe that this is a major problem.
Railways
NFR 1A3c
Last update: 04.03.2016

IIR 2017
81
Description
Railway traffic in Norway uses mainly electricity. Auto diesel is used at a small number of lines,
for shunting etc. There is also a minor consumption of coal in museum railways.
Method
General estimation methodology for calculating combustion emissions from consumption
figures and emission factors is used.
Activity data
Consumption figures for auto diesel used in locomotives are collected annually from the
Norwegian State Railways. Consumption of coal is estimated based on information from
different museum railways; the same figure is used for all years from 1990. There has been a
continuous electrification of the railroads in Norway, and the diesel consumption is more than
halved from the level in the early 1990's.
Table 3.11. Fuel consumption in railways, 1990-2015. TJ
Liquid fuels Solid fuels
1990 1306 3.9
1995 1405 3.9
2000 663 3.9
2005 581 3.9
2006 564 3.9
2007 593 3.9
2008 617 3.9
2009 612 3.9
2010 535 3.9
2011 514 3.9
2012 573 3.9
2013 634 3.9
2014 588 3.9
2015 619 3.9
Source: Statistics Norway
Emission factors
Emission factors for NOX, HC, CO, and PM10 were estimated by Bang (1993) based on a literature
survey and data on Norwegian usage profiles. The HC factor of 4 g/kg was used directly for
NMVOC.
The other emission factors are the same as for diesel machinery in mining and quarrying (see
section 3.2.4.7.4), with the following exception:
NH3: 0.007 g/kg vs 0.005 g/kg for machinery (EEA 2013)
BC: emission factors as share of PM2.5 from IIASA (Kupiainen & Klimont 2004) have been
used. They are presented in Appendix B.
General emission factors for coal are used in the calculations.

IIR 2017
82
Uncertainties
The consumption data are of high quality. Their uncertainty is estimated to be 5 per cent of the
mean.
Completeness
Major missing emission compounds are not likely.
Source specific QA/QC
Consumption data from the Norwegian State Railways have previously been compared with
sales to railways according to the Petroleum statistics. However, the latter includes some
consumption by buses operated by the Norwegian State Railways. From 1998, the reported
sales of "tax-free" auto diesel to railways have been higher than the consumption data from the
Norwegian State Railways, although there was only a minor difference in 2009. The reason for
this discrepancy has not been checked. "Tax-free" auto diesel is only for non-road use, so
consumption by buses should not be the cause.
Electric railway conductions
NFR 1A3c
Last update: 01.09.05
Method
Electric railway conductions contain copper that is emitted in contact with trains. In the
inventory, copper emissions are calculated by emission factors and activity data.
Activity data
The activity data used for calculating emissions of copper from electric wires are annual train
kilometers given by the Norwegian State Railways (NSB).
Emission factors
According to Norwegian State Railways (Rypdal & Mykkelbost 1997) the weight of a contact wire
is 0.91 kg/meters. The weight is reduced by 20 per cent after 3 million train passes. This gives an
emission factor of 0.06 g/train kilometers. It is, however, uncertain how much of this is emitted
to air. In the inventory it is assumed that 50 per cent is emitted to air. This gives an emission
factor of 0.03 g/ train kilometer.
Table 3.12. Emission factor for electric railway conductions. g/km
Emission factor (g/train kilometers)
Cu 0.03
Source: Norwegian Environement Agency
Uncertainties
The emission factor used is uncertain. First, there is an uncertainty connected to the reduction
of 20 per cent after 3 million train passes. Secondly, there is uncertainty regarding the
assumption that 50 per cent are emissions to air (Finstad & Rypdal 2003).
Completeness

IIR 2017
83
No major components are assumed missing.
Source specific QA/QC
There is no specific QA/QC procedure for this source. See section 1.6 for the description of the
general QA/QC procedure.
Navigation
NFR 1A3d
Last update: 07.03.17
Description
According to CLRTAP Norwegian national sea traffic is defined as ships moving between two
Norwegian ports. In this connection, installations at the Norwegian part of the continental shelf
are defined as ports.
Fishing is described in section 3.2.5
Method
Emissions from navigation are estimated according to the Tier 2 IPCC methodology. Emissions
from moveable installations used in oil and gas exploration and extraction are split between 1A1
– energy industries (section 3.2.2) and navigation: Emissions from drilling are reported under
1A1, while emissions from transport and other activities are reported under navigation.
Emissions from international marine bunkers are excluded from the national totals and are
reported separately (section 3.2.6.2), in accordance with the IPCC Good Practice Guidance.
Annual emissions are estimated from sales of fuel to domestic shipping, using average emission
factors in the calculations.
For 1993, 1998, 2004 and 2007 emissions have also been estimated based on a bottom-up
approach. Fuel consumption data were collected for all categories of ships (based on the full
population of Norwegian ships in domestic transport); freight vessels (bulk and tank), oil loading
vessels, supply/standby ships, tug boats, passenger vessels, fishing vessels, military ships and
other ships. Emissions were estimated from ship specific emission factors and fuel use. From this
information, average emission factors were estimated for application in the annual update
based on fuel sales. This approach is unfortunately too resource demanding to perform
annually.
Activity data
The annual sales statistics for petroleum products gives figures on the use of marine gas oil,
heavy distillates and heavy fuel oil in domestic navigation. Information on fuel used in the ship
categories in the bottom-up analysis is mainly given by data from the Business Sector’s NOX fund
for 2007 and by earlier SSB analyses for 1993 and 1998 (Tornsjø 2001), and 2004. Data on fuel
consumed by public road ferries are available from the Directorate of Public Roads.
Information on fuel use at mobile drilling rigs is taken from the sales statistics, but information

IIR 2017
84
on use (whether it is used for drilling, stationary combustion etc.,) is taken from Environmental
Web/EPIM Environment Hub (EEH) (reported from oil companies to the Norwegian Environment
Agency and the Norwegian Petroleum Directorate). Consumption during drilling activities are
reported under ”Energy industries” (CRF 1A1c). Only the remaining part of sales, assumed to be
for drilling rigs during transit etc., is included with Navigation.
For marine gas oil, the amount used for navigation is equal to total sales figures except bunkers,
after the deduction of estimated stationary use, mainly in oil and gas extraction, but also some
minor use in manufacturing industries and construction. Due to inaccuracies in the reporting of
distribution of marine gas oil between domestic and international shipping from approximately
2005, there is some uncertainty connected to the figures for the latest years.
Use of natural gas in navigation, which was introduced in 2000 and has increased considerably
from 2007, is based on sales figures reported to Statistics Norway from the distributors. Fuel
consumption in national navigation is given in Table 3.13.
Table 3.13. Fuel consumption in national navigation, 1990-2015. TJ
Liquid fuels Gaseous fuels
1990 22 817 -
1995 25 606 -
2000 30 117 46
2005 26 459 332
2006 27 641 329
2007 29 143 1 577
2008 24 699 1 856
2009 25 300 1 980
2010 26 691 2 157
2011 25 320 2 465
2012 23 180 3 174
2013 19 680 3 736
2014 15 843 4 222
2015 16 331 4 417
Source: Statistics Norway
Emission factors
Emission factors used for navigation are given in Appendix B, table B1, table B4 and tables B9-
B12.
SO2
The emission factors are determined from the sulphur content of the fuel.
NOX
NOX factors for different engine types (slow, medium and high speed) have been estimated by
Marintek based on data from a comprehensive measure programme for NOX emissions from
ships, which has been implemented under the leadership of the Business Sector’s NOX fund. The

IIR 2017
85
new basis factors from Marintek apply to emissions from different engine types built before and
after emission restrictions were implemented in 2000 (Bremnes Nielsen & Stenersen 2009).
Table 3.14. Recommended emission factors for NOX for different engine types
Engine building year
Before 2000
kg NOX/tonne fuel
After 2000 kg NOX/tonne fuel
Slow speed NOX factor 82 78
Medium speed NOX factor 54 53 High speed NOX factor 47 41
Source: Bremnes Nielsen and Stenersen (2009)
The factors were weighted in two steps: First, by engine type distribution within ship categories
(passenger, general cargo, offshore, fishing, etc.). Secondly, by estimated fuel consumption
among categories. The fuel consumption weights were calculated based on data for 1993, 1998,
2004 and 2007, which are years with good availability of activity data. Average factors for other
years were interpolated. In the interpolation of the average factors over the time series, a peak
in the use of shuttle tankers has been taken into consideration. The fact that we have reported
data for public road ferries for some years, and a gradual change to new engines with lower
emissions starting in 2000 due to new restrictions, has also been taken into consideration. The
factors from Marintek are valid for engines with no particular NOX reduction measures. The NOX
factors used in the inventory are documented in Flugsrud et al. (2010).
The method outlined above is used for the years up to 2007. From 2008 onwards, a large
number of NOx reducing technologies have been installed, funded through the NOx fund and
certified by emission measurementes. Annual emissions are reported by companies to the NOx
fund and/or to the Norwegian Tax Administration as part of a national NOx tax xystem.
In 2016, data on NOx emissions and consumption of fuel in the third quarter of 2016 were
collected from companies participating in the NOx fund with ships operating in Norwegian
coastal traffic. The data were made available to Statisics Norway for inventory preparation. The
NOx emissions in these data are mainly based on ship-specific measurements. For ships without
measurements, a sligthly adjusted version of the Marintek factors were used3. Based on these
data, an average NOx factor for domestic navigation in 2016 was calculated. Emission factors for
2008-2015 were obtained by linear interpolation.
For gas engines the NOX factor 5.6 kg NOX/ tonne LNG is established based on the mass of LNG
consumed (Bremnes Nielsen & Stenersen 2010).
For offshore drilling rigs, the factor 54 kg NOX /tonne is used (Karlsson & Finborud 2012). See
3 Medium speed engines 200-1000 rpm and high speed engines >1500 rpm used factors from table 3.14. Slow speed
engines <200 rpm used 100 kg NOx/tonne. Medium/high speed engines 1000-1500 rpm used 50 kg NOx/tonne.
(Norwegian Tax Administration, http://www.skatteetaten.no/globalassets/saravgifter/avgiftsrundskriv/2016-nox.pdf)
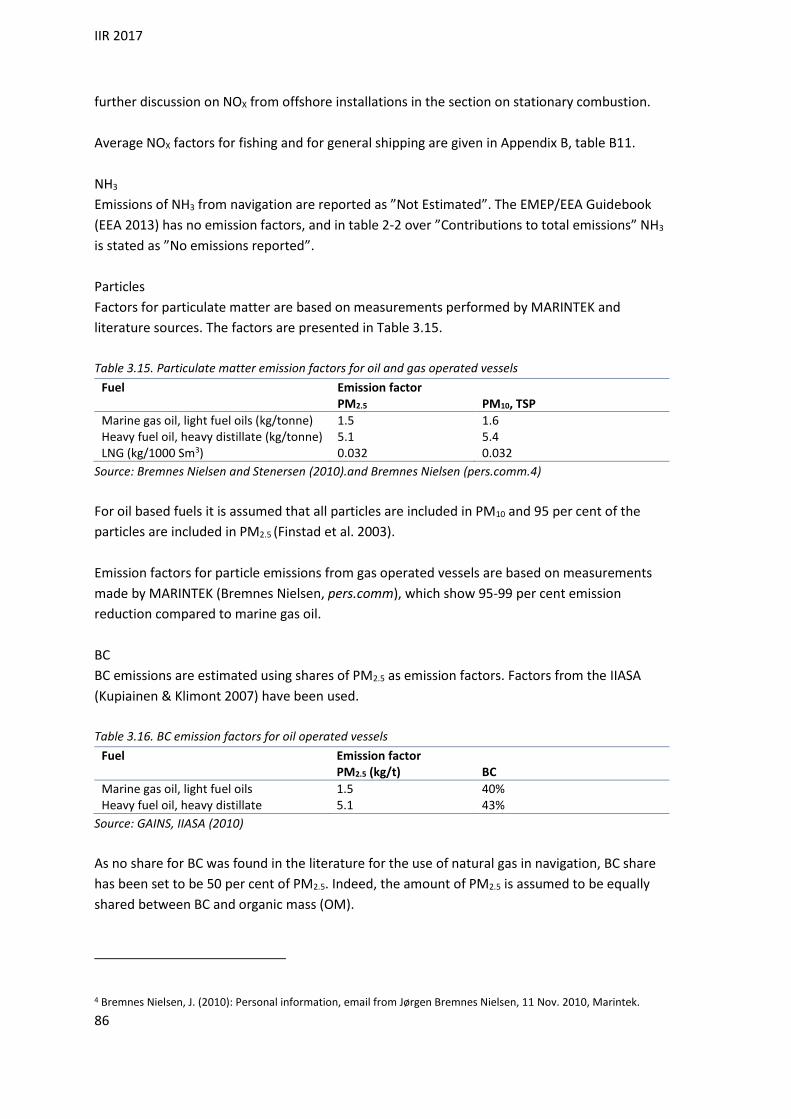
IIR 2017
86
further discussion on NOX from offshore installations in the section on stationary combustion.
Average NOX factors for fishing and for general shipping are given in Appendix B, table B11.
NH3
Emissions of NH3 from navigation are reported as ”Not Estimated”. The EMEP/EEA Guidebook
(EEA 2013) has no emission factors, and in table 2-2 over ”Contributions to total emissions” NH3
is stated as ”No emissions reported”.
Particles
Factors for particulate matter are based on measurements performed by MARINTEK and
literature sources. The factors are presented in Table 3.15.
Table 3.15. Particulate matter emission factors for oil and gas operated vessels
Fuel Emission factor PM2.5 PM10, TSP
Marine gas oil, light fuel oils (kg/tonne) 1.5 1.6 Heavy fuel oil, heavy distillate (kg/tonne) 5.1 5.4 LNG (kg/1000 Sm3) 0.032 0.032
Source: Bremnes Nielsen and Stenersen (2010).and Bremnes Nielsen (pers.comm.4)
For oil based fuels it is assumed that all particles are included in PM10 and 95 per cent of the
particles are included in PM2.5 (Finstad et al. 2003).
Emission factors for particle emissions from gas operated vessels are based on measurements
made by MARINTEK (Bremnes Nielsen, pers.comm), which show 95-99 per cent emission
reduction compared to marine gas oil.
BC
BC emissions are estimated using shares of PM2.5 as emission factors. Factors from the IIASA
(Kupiainen & Klimont 2007) have been used.
Table 3.16. BC emission factors for oil operated vessels
Fuel Emission factor PM2.5 (kg/t) BC
Marine gas oil, light fuel oils 1.5 40% Heavy fuel oil, heavy distillate 5.1 43%
Source: GAINS, IIASA (2010)
As no share for BC was found in the literature for the use of natural gas in navigation, BC share
has been set to be 50 per cent of PM2.5. Indeed, the amount of PM2.5 is assumed to be equally
shared between BC and organic mass (OM).
4 Bremnes Nielsen, J. (2010): Personal information, email from Jørgen Bremnes Nielsen, 11 Nov. 2010, Marintek.
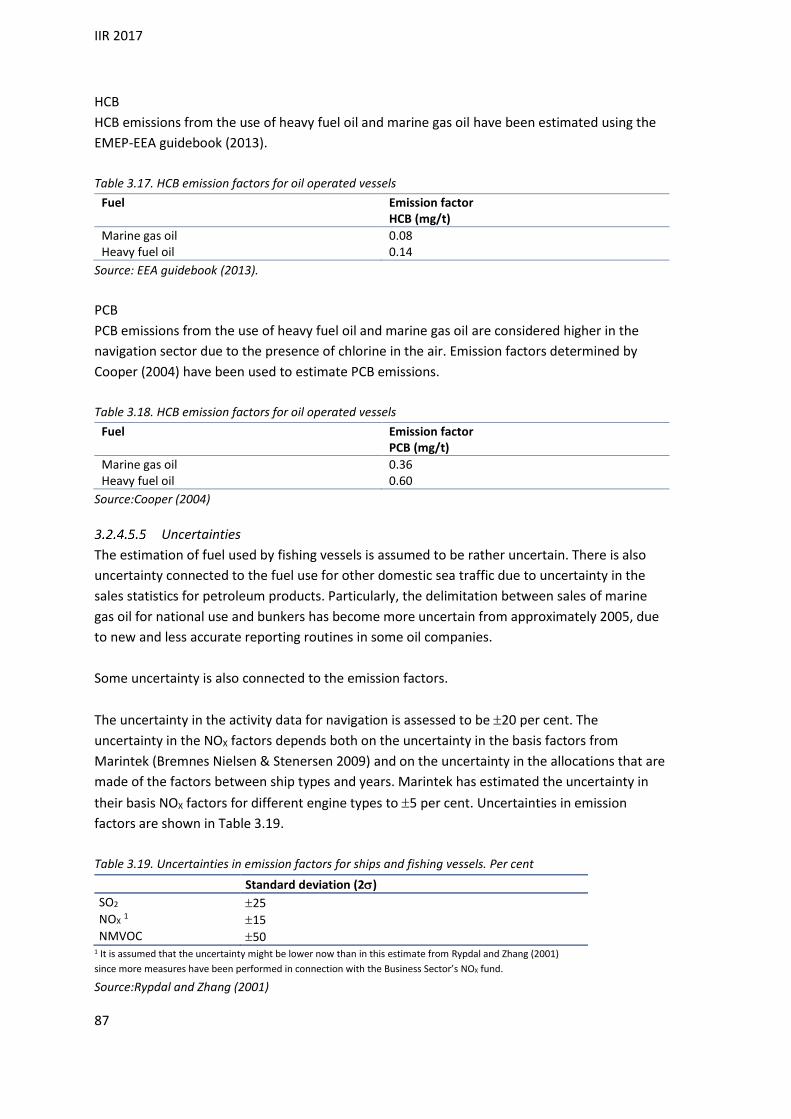
IIR 2017
87
HCB
HCB emissions from the use of heavy fuel oil and marine gas oil have been estimated using the
EMEP-EEA guidebook (2013).
Table 3.17. HCB emission factors for oil operated vessels
Fuel Emission factor HCB (mg/t)
Marine gas oil 0.08 Heavy fuel oil 0.14
Source: EEA guidebook (2013).
PCB
PCB emissions from the use of heavy fuel oil and marine gas oil are considered higher in the
navigation sector due to the presence of chlorine in the air. Emission factors determined by
Cooper (2004) have been used to estimate PCB emissions.
Table 3.18. HCB emission factors for oil operated vessels
Fuel Emission factor PCB (mg/t)
Marine gas oil 0.36 Heavy fuel oil 0.60
Source:Cooper (2004)
Uncertainties
The estimation of fuel used by fishing vessels is assumed to be rather uncertain. There is also
uncertainty connected to the fuel use for other domestic sea traffic due to uncertainty in the
sales statistics for petroleum products. Particularly, the delimitation between sales of marine
gas oil for national use and bunkers has become more uncertain from approximately 2005, due
to new and less accurate reporting routines in some oil companies.
Some uncertainty is also connected to the emission factors.
The uncertainty in the activity data for navigation is assessed to be 20 per cent. The
uncertainty in the NOX factors depends both on the uncertainty in the basis factors from
Marintek (Bremnes Nielsen & Stenersen 2009) and on the uncertainty in the allocations that are
made of the factors between ship types and years. Marintek has estimated the uncertainty in
their basis NOX factors for different engine types to 5 per cent. Uncertainties in emission
factors are shown in Table 3.19.
Table 3.19. Uncertainties in emission factors for ships and fishing vessels. Per cent
Standard deviation (2)
SO2 25 NOX 1 15 NMVOC 50
1 It is assumed that the uncertainty might be lower now than in this estimate from Rypdal and Zhang (2001)
since more measures have been performed in connection with the Business Sector’s NOX fund.
Source:Rypdal and Zhang (2001)
IIR 2017
88
Completeness
Major missing emission sources are not likely.
Source specific QA/QC
As mentioned, emission estimates for ships have been made bottom-up for 1993 and 1998
(Tornsjø 2001) and for 2004 and 2007. These results have been compared with top-down data
(from sales) on fuel consumption used in the annual estimates.
The outcome showed that data from sales were only 1 per cent higher than data from reported
consumption in 2007. For 2004 the sales data were 27 per cent higher than the consumption
data in the bottom-up analysis. This can be explained by the fact that the bottom-up method
does not cover all ships, but it may also be that the domestic/international distinction is not
specified precisely enough in the sales statistics. Another element, which not has been taken
into account, is possible changes in stock. For the years 1993 and 1998 a deviation of -12 and -15
per cent, respectively, has been found. In the calculations, sales figures are used, as they are
assumed to be more complete and are annually available.
Pipeline
NFR 1A3e i
Last update: 22.03.10
Figures on natural gas used in turbines for pipeline transport at two separate facilities are
reported annually from the Norwegian Petroleum Directorate to Statistics Norway. However,
energy generation for pipeline transport also takes place at the production facilities. Specific
data on consumption for transport are not available. Thus, the consumption at the two pipeline
facilities does not give a correct picture of the activity in this sector. As a consequence, all
emissions from pipelines are reported under NFR 1A1.
Motorized equipment
NFR 1A2f g-vii etc.
Last update: 10.03.2015
Description
The category "motorized equipment" comprises all mobile combustion sources except road, sea,
air, and railway transport. Farm and construction equipments are the most important
categories. Other categories include mines and quarries, forestry, snow scooters, small boats
and miscellaneous household equipment.
Emissions from motorized equipments are reported under several categories:

IIR 2017
89
Table 3.20. Motorised equipment categories
NFR
Manufacturing and construction 1A2g-vii Commercial and institutional 1A4a-ii Households 1A4b-ii Agriculture/Forestry/Fishing 1A4c-ii Military 1A5b
Source: Statistics Norway/Norwegian Environment Agency
Primarily consumption of gasoline and auto diesel is considered. A small amount of fuel oil used
for equipment in construction is also accounted for.
Method
Emissions are estimated through the general methodology described earlier, involving
consumption figures and appropriate emission factors.
Activity data
Gasoline and auto diesel are handled differently. Consumption of gasoline is estimated bottom-
up for each type of machinery based on data on the number of each type of equipment, usage
and specific consumption.
Snow scooters: Number of equipment is obtained annually from the Norwegian Public Roads
Administration. We assume a mileage of 850 km/year and a specific consumption of 0.15 l/km
(National institute of technology 1991). A portion of 16 per cent of petrol consumption in agri-
culture is assigned to snow scooters. The remaining snow scooter fuel consumption is assigned
to households.
Chainsaws and other two-stroke equipments: Only consumption in forestry is considered, based
on felling data. Felling statistics are gathered by Statistics Norway. 50 per cent is supposed to be
felled with use of chain saws, with a consumption of 0.33 l/m3. Note: Consumption has been
kept fixed since 1994 based on a calculation by the Institute of Technology (Bang 1996).
Lawn mowers and other four-stroke equipment: Only consumption in households is considered.
Consumption of auto diesel is based on data from the energy balance. Auto diesel used in off-
road vehicles has no road tax from 1993. Total use of auto diesel in motorized equipment is
given as the difference between total sales of tax free diesel and estimated use for railway
transportation. It is important to bear in mind that the total consumption of auto diesel in
motorized equipment from 1993 is considered being of good quality since there from 1993 is no
road tax on this part of the auto diesel. There is CO2 tax on the auto diesel used for motorized
equipment as well as for road traffic.
Distribution of auto diesel between industries: From 2001, a certain fraction of the consumption
in a number of industries is allocated to motorized equipment, based on the distribution of
taxed and tax-free diesel – the latter is meant for use outside road transport. The distribution
formulas are based on figures from the statistics on energy use in manufacturing industries or

IIR 2017
90
from the sales statistics. The statistics on energy use in manufacturing industries did not have
such a split before 2001, and therefore distribution formulas for 2001 are used for 2000 and
earlier years.
Emission factors
Emission factors used are given in Appendix B.
For diesel machinery, emission factors for HC, CO, and PM10 were estimated by Bang (1993),
based on a literature survey and data on Norwegian usage profiles. Source for emission factor
for NOX from diesel machinery is from Bang (1993) for motor gasoline and light fuel oils. For
autodiesel emission factors from a Danish report (Winther & Nielsen 2006) is used. NMVOC
factors were calculated by subtracting an assumed CH4 fraction of 0.3 g/kg diesel.
Emission factors for tractors are used for tax-free auto diesel consumption in agriculture and
forestry, while emission factors for construction machinery are used for tax-free auto diesel
consumption in all other industries and households.
The emission factors used in the emission model are calculated from the basic factors in Winther
and Nielsen (2006), weighted by the age and engine rating distribution of the tractor and
construction machinery populations, as well as assumptions on motor load and operating hours
and the introduction scheme for emission regulations by the EU (Stage I, II, III and IV).
Uncertainties
The estimates of consumption are considered quite uncertain, particularly for gasoline.
However, the total consumption of gasoline is well known. For auto diesel, some uncertainty in
the delimitation of different middle distillates may cause variations in figures on total use in
motorized equipment between years.
Completeness
Major missing emission sources are not likely.
Source specific QA/QC
There is no source specific QA/QC procedure for this sector. See section 1.6 for the description
of the general QA/QC procedure.
Automobile tyre and brake wear
NFR 1A3b vi
Last update: 22.12.16
Tyre wear
Description
Tyre wear is a source for emission of particles, heavy metals and persistent organic pollutants.
The tyres are worn down by 10 to 20 per cent of its total weight during its lifetime. Most of the
rubber is lost during acceleration and braking. All rubber lost is assumed to be particles
containing heavy metals and PAH.
Method
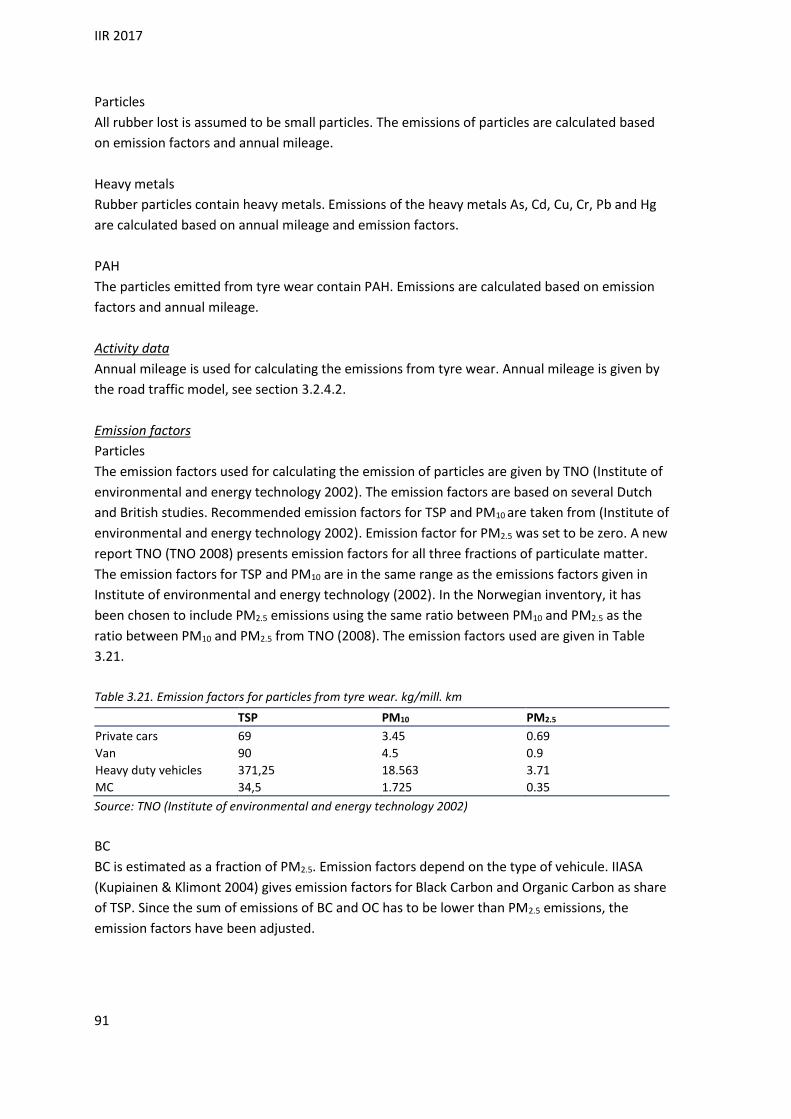
IIR 2017
91
Particles
All rubber lost is assumed to be small particles. The emissions of particles are calculated based
on emission factors and annual mileage.
Heavy metals
Rubber particles contain heavy metals. Emissions of the heavy metals As, Cd, Cu, Cr, Pb and Hg
are calculated based on annual mileage and emission factors.
PAH
The particles emitted from tyre wear contain PAH. Emissions are calculated based on emission
factors and annual mileage.
Activity data
Annual mileage is used for calculating the emissions from tyre wear. Annual mileage is given by
the road traffic model, see section 3.2.4.2.
Emission factors
Particles
The emission factors used for calculating the emission of particles are given by TNO (Institute of
environmental and energy technology 2002). The emission factors are based on several Dutch
and British studies. Recommended emission factors for TSP and PM10 are taken from (Institute of
environmental and energy technology 2002). Emission factor for PM2.5 was set to be zero. A new
report TNO (TNO 2008) presents emission factors for all three fractions of particulate matter.
The emission factors for TSP and PM10 are in the same range as the emissions factors given in
Institute of environmental and energy technology (2002). In the Norwegian inventory, it has
been chosen to include PM2.5 emissions using the same ratio between PM10 and PM2.5 as the
ratio between PM10 and PM2.5 from TNO (2008). The emission factors used are given in Table
3.21.
Table 3.21. Emission factors for particles from tyre wear. kg/mill. km
TSP PM10 PM2.5
Private cars 69 3.45 0.69
Van 90 4.5 0.9
Heavy duty vehicles 371,25 18.563 3.71
MC 34,5 1.725 0.35
Source: TNO (Institute of environmental and energy technology 2002)
BC
BC is estimated as a fraction of PM2.5. Emission factors depend on the type of vehicule. IIASA
(Kupiainen & Klimont 2004) gives emission factors for Black Carbon and Organic Carbon as share
of TSP. Since the sum of emissions of BC and OC has to be lower than PM2.5 emissions, the
emission factors have been adjusted.

IIR 2017
92
Table 3.22. Emission factors for BC from tyre wear in share of PM2.5. Particles are shown in kg/mill. km
TSP PM2.5 BC
Passenger cars 69 0.69 30%
Light duty vehicles 90 0.9 30%
Heavy duty vehicles 371,25 3.71 30%
MC 34,5 0.35 30%
Source: IIASA (Kupiainen & Klimont 2004)
Heavy metals
The emission factors used for the heavy metals As, Cd, Cu, Cr and Pb are derived from a particle-
heavy metal distribution given by Dutch studies (van den Brink 1996). The content of heavy
metals in the particles, given by this distribution, is multiplied by the PM10 emission factor (Table
3.21). This gives the emission factors for the heavy metals As, Cd, Cu, Cr and Pb from tyre wear
(Table 3.23).
Table 3.23. Emission factors for heavy metals from tyre wear. g/mill. Km
As Cd Cu Cr Pb
Private cars 0.003 0.007 1.691 0.014 0.552
Van 0.005 0.009 2.205 0.018 0.720
Heavy duty vehicles 0.019 0.037 9.096 0.074 2.970
MC 0.002 0.003 0.845 0.007 0.276
Source: van den Brink (1996)
The emission factor used for the estimation of the emissions of Hg is 0.079 g/ mill. km. This
emission factor is derived from a study of heavy metal content in tyres (Bækken 1993) and an
estimate of the amount of tyre in Norway in 1993 of 6000 tonnes (Finstad et al. 2001).
PAH
Emission factors for PAH are given in Finstad et al. (2001), but there is no information about how much of the emissions that are emitted to air, and how much that goes to soil and to water. All emissions are therefore supposed to be emitted to air. There is also no PAH profile available, so in lack of other data the same PAH profile as for burning of tyres is used (EPA 1998). PAH emission factors for tyre wear are given in Table 3.24. There are no data available for Benzo(a)pyrene, benzo(k)fluoranthene and indeno(1,2,3-cd)pyrene. All PAH-4 emissions are assumed to be benzo(b)fluoranthene. The PAH-4 profile is given in table 3.25.
Table 3.24. Emission factors for PAH from tyre wear. g/mill. Km
PAH PAH-4
Light duty vehicles 10.4 6
Heavy duty vehicles 0.1 0,035
Source:Finstad et al. (2001)
Table 3.25. PAH profile road dust, also used for tyre wear (only PAH-4 is shown)
Per cent
Benzo(a)pyrene ..
benzo(b)fluoranthene 100
benzo(k)fluoranthene ..
indeno(1,2,3-cd)pyrene ..

IIR 2017
93
Source:Finstad et al. (2001)
Uncertainties
The calculation of emissions from tyre wear is uncertain. First, the emission factors for particles
used are based on international studies and not on Norwegian conditions. There is also
uncertainty concerning how much of the particles that are emitted to air. According to a Dutch
judgement, all particles emitted to air are PM10. This is however only a judgement, and not
based on scientific research.
The heavy metal emission factors are based on the particle emission factors for PM10, and since
this factor is uncertain, the heavy metal emission factors will also be uncertain. The content of
heavy metals in the particles emitted from tyre wear is based on a Dutch study and can
therefore differ from Norwegian conditions and type of tyres used.
Completeness
Tyre wear also leads to emissions of other heavy metal components, such as zinc, nickel etc., but
these components are not included in the Norwegian emission inventory.
Until 2004, different methods for calculating the emissions of heavy metals from tyre wear were
used. One method was used for calculating emissions of Pb, Cd and Hg (Finstad et al. 2001) and
another for calculating emissions of Cu, Cr and As (Finstad & Rypdal 2003). From 2004, the same
method has been used for all the heavy metal components.
Source specific QA/QC
There is no specific QA/QC procedure for this source. See section 1.6 for the description of the
general QA/QC procedure.
Brake wear
Description
Brake blocks will wear during braking and this generates dust containing various metals. In the
inventory, emissions of particles and heavy metals are included from this source.
Method
Particles
Emissions of particles are calculated based on emission factors recommended by an annual
mileage.
Heavy metals
Emissions of lead, copper and chromium are calculated after a method described in SLB
(Stockholms luft- och bulleranalys 1998a). The calculations are based on annual brake wear,
driven kilometers and the brake blocks' metal content.
Brake wear, private cars and vans
To calculate emissions, brake wear first has to be estimated. It is assumed that private cars
change brake blocks every fourth year. The background for this assumption is that private cars,

IIR 2017
94
by normal driving, change brake blocks at front after 30 – 40 thousand kilometers and at the
back after 60 – 80 thousand kilometers. A private car drives in average 150 thousand kilometers
each year. Assuming that the brake blocks are changed after 60 thousand kilometers, the car
will be four years old when blocks first are changed.
The brake blocks at front weigh 0.13-0.15 kg and 0.09-0.11 kg at the back. It is assumed in the
calculations that the brake blocks weigh 0.15 kg at the front and 0.11 kg at the back, that the
brake blocks are worn 70 per cent before they are changed and that the front and back blocks
are changed after 40 and 60 thousand kilometers, respectively. Brake wear per kilometer are
given equations (3.4) and (3.5):
(3.4) Front brake blocks (private cars): 0.7*4*0.15/40 000
(3.5) Back brake blocks (private cars): 0.7*4*0.11/60 000
The same method is used for calculating emissions from brake wear for vans and minibuses.
Brake wear, heavy duty vehicles
The number of brake blocks at a heavy duty vehicle varies with both brand and model. It is
assumed that each front brake block weighs 2.5 kg and 3.5 kg at the back (Stockholms luft- och
bulleranalys 1998a). This means that a truck with four wheels have 12 kg of brake blocks. It is
assumed that the blocks are changed after 100 thousand kilometers when the brake blocks are
worn 70 per cent.
Metal content
The metal content in the brake blocks for cars have been tested (Stockholms luft- och
bulleranalys 1998a). For calculating the emissions from brake blocks, annual brake wear has
been multiplied by the metal content. The metal content in the brake blocks in front of the car
differs from the content in the brake blocks at the back (Table 3.26). For heavy duty vehicles, the
metal content is independent of age or type of brake block.
Table 3.26. Metal content in brake blocks. mg/kg
Private cars Heavy duty vehicles Front Back Front and back
Cr 137 73.4 165 Cu 117941 92198 9031 Pb 9052 18655 457
Source: Stockholms luft- och bulleranalys (1998a); Stockholms luft- och bulleranalys (1998b)
How much of the heavy metal emissions that are emitted to air were investigated by Sternbeck
et al. (2001). Tunnel experiments showed that approximately 20 per cent of the brake wear
emissions were emitted to air. This result is used in the calculations of brake wear emissions.

IIR 2017
95
Activity data
For calculating the emissions of particles, are annual mileage given by the road traffic model, see
section 3.2.4.2.
For calculating the emissions of heavy metals, annually driven kilometres are also given by the
road traffic model.
Emission factors
Particles
Emission factors recommended by TNO (Institute of environmental and energy technology
2002), based on different European studies, are used (Table 3.27).
Table 3.27. Particle emission factors for brake wear. kg/mill. km
PM2.5 PM10 TSP
Private cars (BM1+DM1) 6 6 6
Van (BN1+DN1) 7.5 7.5 7.5
Heavy duty vehicles 32.25 32.25 32.25
MC 3 3 3
Source: TNO (Institute of environmental and energy technology 2002)
BC
BC is estimated as a fraction of TSP from emission factors depending on the vehicle type, given
by IIASA (Kupiainen & Klimont 2004).
Table 3.28. Emission factors for BC from tyre wear in share of TSP. Particles are shown in kg/mill. km
TSP BC
Passenger cars 6 1%
Light duty vehicles 7.5 1%
Heavy duty vehicles 32.25 1%
MC 3 1%
Source: IIASA (Kupiainen & Klimont 2004)
Heavy metals
Emission factors for Cr, Cu and Pb are derived based on the above information and are given in
Table 3.29.
Table 3.29. Heavy metal emission factors for brake wear. g/mill. km
Private cars and vans Heavy duty vehicles
Cr 0.36 14.82
Cu 342.33 303.44
Pb 38.16 40.95
Source: Statistics Norway
Uncertainties
There is high uncertainty in different steps in the emission calculations of heavy metals from
brake wear, since many assumptions have been done. For example, there is uncertainty
connected to the weight and the metal content of the brake blocks, and to the number of driven

IIR 2017
96
kilometres before blocks are changed.
Completeness
Brake wear also leads to emissions of other heavy metal components, such as zinc, nickel etc.,
but these components are not included in the Norwegian emission inventory.
No other major emission components are assumed missing.
Source specific QA/QC
There is no specific QA/QC procedure for this source. See section 1.6 for the description of the
general QA/QC procedure.
Automobile road abrasion
NFR 1A3bvii
Last update: 22.12.16
Description
Asphalt dust is emitted to air while using studded tires. The abrasion layer on asphalt roads can
contain approximately 90 per cent stones (rock/minerals) and 5 per cent filler. The rest is
bitumen. During studded tyre abrasion, stone materials are worn down to minor particles and
will together with detached filler and bitumen whirl up and become airborne. How much
dust/particles studded tires generate depends on:
Weight of the stud
The road surface resistance against abrasion
Vehicle velocity
Share of heavy vehicle
If the road surface is dry, wet or ice coated
A great share of the dust from studded tyres will bind up to the water film when the road
surface is wet. Some of it will however whirl up again when the road surface dries up. This is not
included in the calculation.
Bitumen is a mixture of a great number of organic components, including PAH components. The
emissions of benzo(b)fluoranthene,from road abrasion are calculated and included in the
emission inventory. Calculated emissions of Cd are also included.
PM emissions from road abrasion are declining due to implementation of measures. In the
largest cities there is a tax to pay when you drive with studded tyres in the city. This, together
with information from the authorities about problems caused by PM, has reduced the numbers
of cars with studded tyres both in the cities and all over the country. In addition, the weight of
the stud has been reduced and hence also the emissions of PM. Consequently, the emissions are
decreasing even though the annual total driving length is increasing. In contrast, emissions from
automobile tyre and brake wear are calculated by multiplying the driving length with an
emission factor, not taking into account the type of tyres. Since the driving length is increasing,
the emissions from this source category also increase.
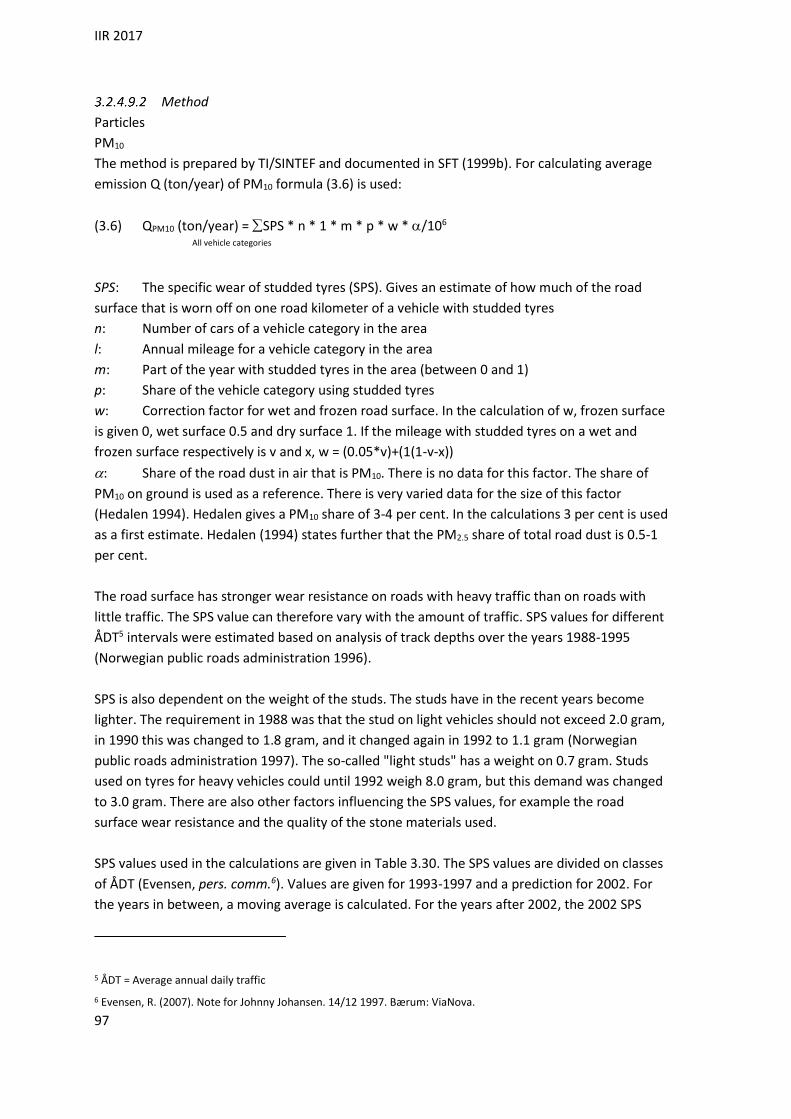
IIR 2017
97
Method
Particles
PM10
The method is prepared by TI/SINTEF and documented in SFT (1999b). For calculating average
emission Q (ton/year) of PM10 formula (3.6) is used:
(3.6) QPM10 (ton/year) = SPS * n * 1 * m * p * w * /106
All vehicle categories
SPS: The specific wear of studded tyres (SPS). Gives an estimate of how much of the road
surface that is worn off on one road kilometer of a vehicle with studded tyres
n: Number of cars of a vehicle category in the area
l: Annual mileage for a vehicle category in the area
m: Part of the year with studded tyres in the area (between 0 and 1)
p: Share of the vehicle category using studded tyres
w: Correction factor for wet and frozen road surface. In the calculation of w, frozen surface
is given 0, wet surface 0.5 and dry surface 1. If the mileage with studded tyres on a wet and
frozen surface respectively is v and x, w = (0.05*v)+(1(1-v-x))
: Share of the road dust in air that is PM10. There is no data for this factor. The share of
PM10 on ground is used as a reference. There is very varied data for the size of this factor
(Hedalen 1994). Hedalen gives a PM10 share of 3-4 per cent. In the calculations 3 per cent is used
as a first estimate. Hedalen (1994) states further that the PM2.5 share of total road dust is 0.5-1
per cent.
The road surface has stronger wear resistance on roads with heavy traffic than on roads with
little traffic. The SPS value can therefore vary with the amount of traffic. SPS values for different
ÅDT5 intervals were estimated based on analysis of track depths over the years 1988-1995
(Norwegian public roads administration 1996).
SPS is also dependent on the weight of the studs. The studs have in the recent years become
lighter. The requirement in 1988 was that the stud on light vehicles should not exceed 2.0 gram,
in 1990 this was changed to 1.8 gram, and it changed again in 1992 to 1.1 gram (Norwegian
public roads administration 1997). The so-called "light studs" has a weight on 0.7 gram. Studs
used on tyres for heavy vehicles could until 1992 weigh 8.0 gram, but this demand was changed
to 3.0 gram. There are also other factors influencing the SPS values, for example the road
surface wear resistance and the quality of the stone materials used.
SPS values used in the calculations are given in Table 3.30. The SPS values are divided on classes
of ÅDT (Evensen, pers. comm.6). Values are given for 1993-1997 and a prediction for 2002. For
the years in between, a moving average is calculated. For the years after 2002, the 2002 SPS
5 ÅDT = Average annual daily traffic
6 Evensen, R. (2007). Note for Johnny Johansen. 14/12 1997. Bærum: ViaNova.

IIR 2017
98
values are used. In the calculations average values for SPS, weighted after the size of traffic load
on roads with different ÅDT, are used. The values are given in g/km and are valid for all vehicles.
To estimate how much of the emissions that originate from heavy vehicles, it is provided that
heavy vehicles wear 5 times more than light vehicles. The vehicle velocity is not given as an own
factor, since it is included in the calculation of SPS.
Table 3.30. SPS values. g/km
ÅDT 1973-1980 1981-1987 1988-1992 1993-1997 2002-
0-1500 22 20 20 18 16 1500-3000 20 20 18 16 14 3000-5000 16 15 14 12 10 >5000 14 12 11 10 9
Average1 17.1 15.6 14.7 13.1 11.6 1 Weight after traffic load on roads with different ÅDT.
Source: Evensen, pers.comm.6
Annual traffic load (trafikkarbeid) (n l in the formula) used in the calculations are annual mileage
given by the road traffic model, see section 3.2.4.2.
Use of studded tyres is forbidden in Norway from the first Monday after Easter and until 31st of
October. There is an exception from this rule in the three northern counties, Nordland, Troms
and Finnmark. In these counties, use of studded tyres is forbidden between 1st of May to 15th of
October. It is assumed in the calculations that studded tyres are used the whole period when it
is allowed. This means that m is 6.5/12 in the northern counties and 5.5/12 for rest of the
country.
Shares of traffic load on studded tyres in the five largest towns in Norway are given in Table
3.31. There has been a decrease in use of studded tyres in Norway during the latest years. The
factor p in the formula will therefore vary from one year to another. Information regarding the
share of studded tyres originates from the Norwegian Public Roads Administration. There is also
national data on share of the car fleet with studded tyres. The data material is based on
interviews of car drivers (Norwegian public roads administration 1995a; Norwegian public roads
administration 1995b; Norwegian public roads administration 1998). The questionnaires were
given out at daytime and caused that most of the answers were from local car drivers.
Accordingly, the survey included too many car drivers with annual mileage over 20 000 km. The
survey from 1997 was however done differently. In the calculation program, the studded tyre
share was decided to be 0.2. This value was adjusted by the different local road administrations,
based on interviews or other available knowledge. In 2000, the Norwegian Public Roads
Administration made a new investigation over local use of studded tyre (Johansen & Amundsen
2000). In 2006, Gjensidige made a survey over the use of studded tyres in different counties in
Norway, winter 05/06 (Vaaje 2006). For 2001-2004 averages of the two investigations are
calculated for the counties. For the five largest cities, data from the Norwegian Public Roads
Administration was used also for 2001-2005, but for the rest of the country the results from
Gjensidige (Vaaje 2006) was used. The data are given in Table 3.32. For the period 1973-1990 it
is assumed that the studded tyre share was 90 per cent.

IIR 2017
99
Table 3.31. Use of studded tyres in five prioritized communities. Share of traffic load with studded tyres.
Light duty vehicles
1998/ 1999
1999/ 2000
2000/ 2001
2001/ 2002
2002/ 2003
2003/ 2004
2004/ 2005
Oslo 51.9 32.4 21.2 31.3 29.2 28.4 24.0 Drammen 49.6 48.7 52.1 41.8 42.3 40.6 31.5 Stavanger 38.1 31.3 26.8 29.3 28.8 35.2 30.1 Bergen 37.0 29.4 28.3 31.0 30.7 30.4 30.3 Trondheim 67.0 64.4 62.1 44.4 40.2 38.8 38.1
2005/ 2006
2006/ 2007
2007/ 2008
2008/ 2009
2010/ 2011
2011/ 2012
2012/ 2013
2013/ 2014
Oslo 19.9 20.3 17.0 16.4 14.4 16.1 15.2 15.2 Drammen 27.0 28.0 27.3 22.9 25.2 25.0 20.6 20.6 Stavanger 32.2 28.4 33.2 19.6 27.9 28.9 26.8 26.8 Bergen 29.6 21.4 10.5 14.7 12.3 18.0 16.6 16.6 Trondheim 32.9 31.2 19.4 28.6 25.8 28.4 35.3 35.3
2014/ 2015
2015/ 2016
Oslo 15 14 Drammen 20 20 Stavanger 22 24 Bergen 14 13 Trondheim 36 36
Source: The Norwegian Public Roads Administration

IIR 2017
100
Table 3.32. Averaged studded tyre share in Norway weighted by traffic load in the different counties. Light
duty vehicles
Year
1990 0.90
1991 0.87
1992 0.88
1993 0.88
1994 0.87
1995 0.86
1996 0.83
1997 0.79
1998 0.70
1999 0.63
2000 0.58
2001 0.56
2002 0.55
2003 0.53
2004 0.51
2005 0.49
2006 0.48
2007 0.46
2008 0.45
2009 0.44
2010 0.43
2011 0.43
2012 0.42
2013 0.41
2014 0.40
2015 0.39
Source: Statistics Norway based on data from the Norwegian Public Roads Administration and Gjensidige
To calculate the correction factor for humid road surface, traffic load data is used. This is divided
into different road conditions after Evensen (pers. comm.7) (Table 3.33). Share of wet and dry
road surface will change some as a consequence of varied share of studded tyres. In the
calculations for 1973-1997 a correction factor is used, based on the estimation that 80 per cent
of light duty vehicles and 60 per cent of heavy duty vehicles use studded tyres.
7 Evensen, R. (1997) Personal information, telephone call 20/11 1997. Bærum: ViaNova.
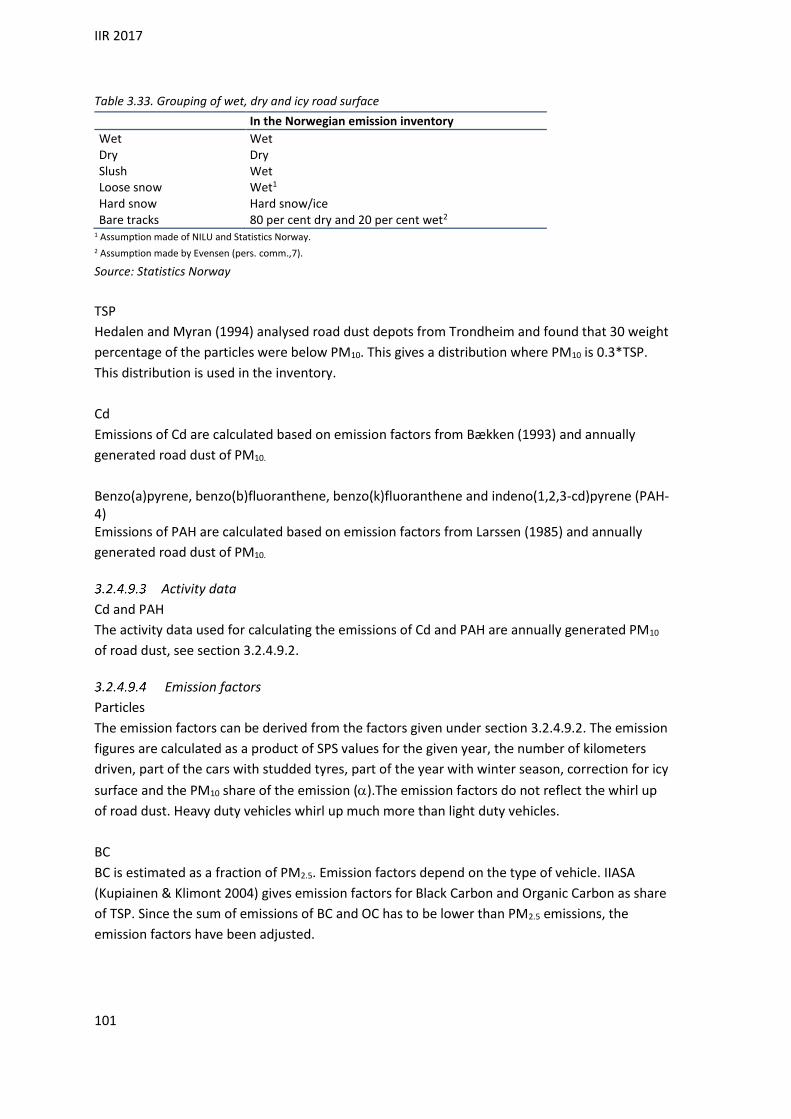
IIR 2017
101
Table 3.33. Grouping of wet, dry and icy road surface
In the Norwegian emission inventory
Wet Wet Dry Dry Slush Wet Loose snow Wet1 Hard snow Hard snow/ice Bare tracks 80 per cent dry and 20 per cent wet2
1 Assumption made of NILU and Statistics Norway. 2 Assumption made by Evensen (pers. comm.,7).
Source: Statistics Norway
TSP
Hedalen and Myran (1994) analysed road dust depots from Trondheim and found that 30 weight
percentage of the particles were below PM10. This gives a distribution where PM10 is 0.3*TSP.
This distribution is used in the inventory.
Cd
Emissions of Cd are calculated based on emission factors from Bækken (1993) and annually
generated road dust of PM10.
Benzo(a)pyrene, benzo(b)fluoranthene, benzo(k)fluoranthene and indeno(1,2,3-cd)pyrene (PAH-4) Emissions of PAH are calculated based on emission factors from Larssen (1985) and annually
generated road dust of PM10.
Activity data
Cd and PAH
The activity data used for calculating the emissions of Cd and PAH are annually generated PM10
of road dust, see section 3.2.4.9.2.
Emission factors
Particles
The emission factors can be derived from the factors given under section 3.2.4.9.2. The emission
figures are calculated as a product of SPS values for the given year, the number of kilometers
driven, part of the cars with studded tyres, part of the year with winter season, correction for icy
surface and the PM10 share of the emission ().The emission factors do not reflect the whirl up
of road dust. Heavy duty vehicles whirl up much more than light duty vehicles.
BC
BC is estimated as a fraction of PM2.5. Emission factors depend on the type of vehicle. IIASA
(Kupiainen & Klimont 2004) gives emission factors for Black Carbon and Organic Carbon as share
of TSP. Since the sum of emissions of BC and OC has to be lower than PM2.5 emissions, the
emission factors have been adjusted.

IIR 2017
102
Table 3.34. Emission factors for BC from tyre wear in share of TSP
BC
Light duty vehicles 0.83%
Heavy duty vehicles 0.83%
Source: IIASA (Kupiainen & Klimont 2004)
Cd
The Cd content in the bitumen is uncertain. According to Bækken (1993), the Cd content varies
between 1.9 and 43 g Cd per tonne road dust. Statistics Norway has chosen an average emission
factor of 22.5 g/ton, see Table 3.35.
Table 3.35. PAH and Cd emission factors from road dust1. g/tonne. PM10 of road dust
Emission factor (g/tonne PM10 from road dust)
Norwegian standard (PAH-total) 61.7 Benzo(a)pyrene, .. benzo(b)fluoranthene 5,5 benzo(k)fluoranthene .. indeno(1,2,3-cd)pyrene, .. Cd 22.5
1 Dry road surface.
Source: Finstad et al. (2001)
PAH
The PAH content in the bitumen is uncertain and can vary over time. According to Larssen
(1985), the PAH content in airborne dust from wet roads is 330 ppm and 75 ppm from dry roads.
Statistics Norway has chosen 85 ppm. In Table 3.35, the emission factor of 85 g/ton is converted
to correspond to the PAH components included in NS9815. This gives an emission factor of 61.7
g/ton for PAH-total.
Uncertainties
Particle distribution of road dust has also been investigated by others than Hedalen and Myran,
among them the Norwegian Institute for Air Research (NILU). The results from these
measurements show another distribution than Hedalen and Myran, with a PM10-fraction much
lower than 30 weight percentage. In the calculation of PM10, data from Hedalen and Myran
(1994) are used, and for consistency reasons the same source is used for estimating TSP, despite
the uncertainty and the discrepancy with NILUs estimations.
The value of (PM10 share in road dust) is very uncertain. An average velocity is assumed in the
calculations. This is further complicated when road surface on roads with high velocities have
another wear resistance than other road surfaces.
The emission factor used for calculating Cd emissions is uncertain since it is based on two
measurements.
The estimation of the PAH content in road dust from Larssen (1985) is very uncertain, since it is
based on only one measurement in Oslo, but it is the only estimate available, and is used in lack

IIR 2017
103
of other data.
Completeness
Major missing emission sources are not likely.
Source specific QA/QC
There is no source specific QA/QC procedure for this sector. See section 1.6 for the description
of the general QA/QC procedure.
Other sectors
NFR 1A4/1A5
Last update: 10.03.2015
Description
The source category "Other sectors" includes all military combustion, stationary combustion in
agriculture, forestry, fishing, commercial and institutional sectors and households, motorized
equipment and snow scooters in agriculture and forestry, and ships and boats in fishing.
Activity data
Motorized equipment is described in section 3.2.4.7.
Households
Use of wood in households for the years 2005-2011 are based on responses to questions
relating to wood-burning in Statistics Norway’s Travel and Holiday Survey. The figures in the
survey refer to quantities of wood used. The survey quarterly gathers data that cover the
preceding twelve months. The figure used in the emission calculations is the average of five
quarterly surveys. For the years before 2005 and for 2012, figures are based on the amount of
wood burned from the annual survey on consumer expenditure. The statistics cover purchase in
physical units and estimates for self-harvest. The survey figures refer to quantities acquired,
which not necessarily correspond to use. The survey gathers monthly data that cover the
preceding twelve months; the figure used in the emission calculations (taken from the energy
accounts), is the average of the survey figures from the year in question and the following year.
Combustion takes place in small ovens in private households.
Figures on use of coal and coal coke are derived from information from the main importer.
Formerly, Norway's only coal producing company had figures on coal sold for residential heating
in Norway. From about 2000, this sale was replaced by imports from abroad. Figures for LPG are
collected from the suppliers. Heavy fuel oil is taken from the sales statistics for petroleum
products. As the consumption of each energy carrier shall balance against the total sales in the
sales statistics, use of fuel oil, kerosene and heavy distillates in households is given as the
residual after consumption in all other sectors has been assessed. Use of natural gas is based on
sales figures reported to Statistics Norway from the distributors.
Agriculture
Data on energy use in hothouses are collected in surveys performed regularly. Sales figures are

IIR 2017
104
used to project the figures for consumption of oil products in the years between. For biofuels
and LPG, figures are interpolated for years not included in surveys. The Agricultural Budgeting
Board has figures on the use of gasoline, auto diesel and fuel oil in agriculture excluding
hothouses. A figure on the minor use of coal was previously collected annually from the only
consumer. Since 2002, however, there has been no known use of coal in the Norwegian
agricultural activities. Use of natural gas in agriculture, which has increased considerably since it
first was registered in 2003, is based on sales figures reported to Statistics Norway from the
distributors.
Fishing
Figures on the use of marine gas fuel, heavy distillate and heavy fuel oil are identical with the
registered sales to fishing in the sales statistics for petroleum products. In addition to these
figures on use in large fishing vessels, a minor figure on estimated use of gasoline in small fishing
boats is also included.
Commercial and institutional sectors
Figures on energy use in wholesale and retail trade, and hotels and restaurants, are based on a
survey for 2000, performed by Statistics Norway. For the following years, figures from this
survey have been adjusted proportionally to the development in employment in the industries
in question. For earlier years, the figures are based on a survey from the mid-1980s (Sagen
1987). LPG figures for the whole period from 1990 have, however, been estimated separately
after consultation with an oil company.
For most other commercial and institutional sectors, the total use of fuel oil appears as a
residual after the use in all other sectors has been estimated; the distribution of this residual
between sub-sectors is done by using figures on energy use per man-labour year from the
energy survey from the mid-1980s.
Use of heating kerosene in commercial industries is calculated by projecting a figure on use from
the mid-1980s proportionally with the registered sales to buildings in industrial industries
outside the manufacturing industries. The estimated total amount is distributed between sub-
sectors by using figures on energy use per man-labour year from the mid-1980s survey.
Use of natural gas is based on sales figures reported to Statistics Norway from the distributors.
Calculated emissions from combustion of biogas at a sewage treatment plant are included for all
years since 1993.
Military
Figures on fuel oil are annually collected directly from the military administration, while figures
from the sales statistics for petroleum products are used for other energy carriers.
Emission factor
Emission factors used are given in Appendix B.
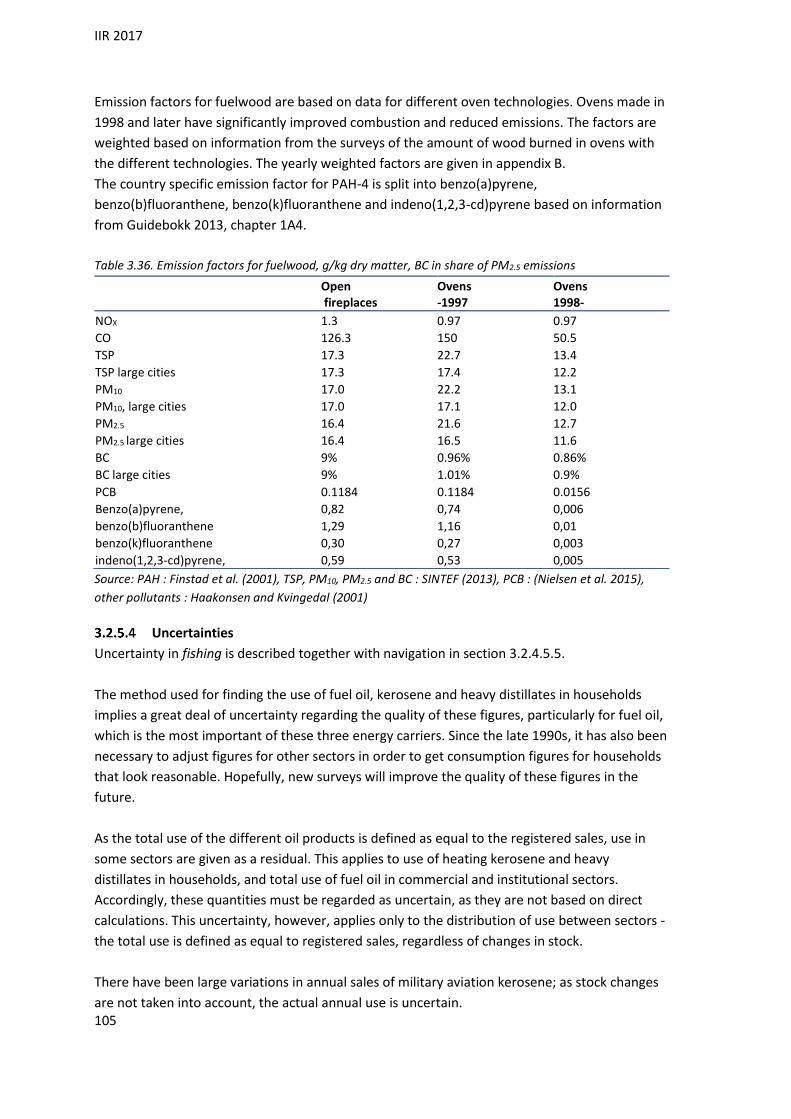
IIR 2017
105
Emission factors for fuelwood are based on data for different oven technologies. Ovens made in
1998 and later have significantly improved combustion and reduced emissions. The factors are
weighted based on information from the surveys of the amount of wood burned in ovens with
the different technologies. The yearly weighted factors are given in appendix B.
The country specific emission factor for PAH-4 is split into benzo(a)pyrene,
benzo(b)fluoranthene, benzo(k)fluoranthene and indeno(1,2,3-cd)pyrene based on information
from Guidebokk 2013, chapter 1A4.
Table 3.36. Emission factors for fuelwood, g/kg dry matter, BC in share of PM2.5 emissions
Open fireplaces
Ovens -1997
Ovens 1998-
NOX 1.3 0.97 0.97
CO 126.3 150 50.5
TSP 17.3 22.7 13.4
TSP large cities 17.3 17.4 12.2
PM10 17.0 22.2 13.1
PM10, large cities 17.0 17.1 12.0
PM2.5 16.4 21.6 12.7
PM2.5 large cities 16.4 16.5 11.6
BC 9% 0.96% 0.86%
BC large cities 9% 1.01% 0.9%
PCB 0.1184 0.1184 0.0156
Benzo(a)pyrene, 0,82 0,74 0,006
benzo(b)fluoranthene 1,29 1,16 0,01
benzo(k)fluoranthene 0,30 0,27 0,003
indeno(1,2,3-cd)pyrene, 0,59 0,53 0,005
Source: PAH : Finstad et al. (2001), TSP, PM10, PM2.5 and BC : SINTEF (2013), PCB : (Nielsen et al. 2015),
other pollutants : Haakonsen and Kvingedal (2001)
Uncertainties
Uncertainty in fishing is described together with navigation in section 3.2.4.5.5.
The method used for finding the use of fuel oil, kerosene and heavy distillates in households
implies a great deal of uncertainty regarding the quality of these figures, particularly for fuel oil,
which is the most important of these three energy carriers. Since the late 1990s, it has also been
necessary to adjust figures for other sectors in order to get consumption figures for households
that look reasonable. Hopefully, new surveys will improve the quality of these figures in the
future.
As the total use of the different oil products is defined as equal to the registered sales, use in
some sectors are given as a residual. This applies to use of heating kerosene and heavy
distillates in households, and total use of fuel oil in commercial and institutional sectors.
Accordingly, these quantities must be regarded as uncertain, as they are not based on direct
calculations. This uncertainty, however, applies only to the distribution of use between sectors -
the total use is defined as equal to registered sales, regardless of changes in stock.
There have been large variations in annual sales of military aviation kerosene; as stock changes
are not taken into account, the actual annual use is uncertain.

IIR 2017
106
Completeness
Major missing emission sources are not likely.
Source specific QA/QC
There is no source specific QA/QC procedure for this sector. See section 1.6 for the description
of the general QA/QC procedure.
International bunkers
NFR - memo item
Last update: 31.03.06
Description
Emissions from international bunkers (marine and aviation) have been estimated and reported
separately from national estimates, in accordance with the IPCC Guidelines. Differences
between the IEA (International Energy Agency) data and the data reported to UNFCCC in
sectoral data for marine shipping and aviation, are due to the fact that different definitions of
domestic use are employed. In the Norwegian inventory, domestic consumption is based on a
census in accordance with the IPCC good practice guidance. On the other hand, the IEA makes
its own assessment with respect to the split between the domestic and the international
market.
Shipping
Method
Emissions are calculated by multiplying activity data with emission factors. The sales statistics
for petroleum products, which is based on reports from the oil companies to Statistics Norway,
has figures on sales for bunkers of marine gas oil, heavy distillates and heavy fuel oil. The same
emission factors as in the Norwegian national calculations are used.
Activity data
Sales figures for international sea transport from Statistics Norway's sales statistics for
petroleum products are used for marine gas oil, heavy distillates and heavy fuel oil.
Emission factor
Emission factors used for Shipping are described under Navigation in section 3.2.4.5.
Aviation
Method
The consumption of aviation bunker fuel in Norway is estimated as the difference between total
purchases of jet kerosene in Norway for civil aviation and reported domestic consumption.
Figures on total aviation fuel consumption are derived from sales data reported to Statistics
Norway from the oil companies. These data do not distinguish between national and
international uses. Data on domestic fuel purchase and consumption are therefore collected by
Statistics Norway from all airline companies operating domestic traffic in Norway. The figures on
domestic consumption from airlines are subtracted from the total sales of jet kerosene to arrive

IIR 2017
107
at the total fuel sales for international aviation. The bottom-up approach of Norway is the
detailed Tier 2 CORINAIR methodology. The methodology is based on detailed information on
types of aircraft and number of LTOs, as well as cruise distances.
Activity data
Statistics Norway annually collects data on use of fuel from the air traffic companies, including
specifications on domestic use and purchases of fuel in Norway and abroad.
Emission factor
Emission factors used for Aviation are described under Aviation in section 3.2.4.1.
3.3 Energy production (fugitive emissions from fuels)
NFR 1B
Overview
Emission sources included in the inventory from the sector Fugitive emissions from fuels are
fugitive emissions from coal mining and handling, and from oil and natural gas.
Fugitive emissions from oil and natural gas include emissions from loading and refining of oil,
gasoline distribution, and fugitive emissions from the gas terminals on shore. There are also
fugitive emissions in connection with venting and flaring offshore.
Fugitive emissions from coal mining and handling
NFR 1B1
Last update: 12.12.2013
Description
Coal has been shipped from Svalbard since 1907. There are today two coal mines at Spitsbergen
(the largest island in the Svalbard archipelago) operated by a Norwegian company. They opened
the second mine in 2001. As the Norwegian GHG inventory, according to official definitions, shall
include emissions from all activities at Svalbard, also emissions from Russian coal production
have been estimated. Until 1998, there was production in two Russian coal mines, Barentsburg
and Pyramiden, but since then, production takes place only in the Barentsburg mine. The
Norwegian mines and Pyramiden are defined as surface mines, whereas Barentsburg is an
underground mine. Russian production has in recent years been considerably smaller than the
Norwegian production, and due to a fire that started in 2008 the production in 2008 and 2009
was very small. In autumn 2010, ordinary production was restarted. Russian activity data are
more uncertain than the Norwegian, which causes a correspondingly higher uncertainty in the
emission figures.
At Svalbard there was a smouldering fire in Pyramiden, the Russian mine that was closed down
in 1998. At an inspection in 2005, no emissions were registered, which indicates that the fire had
burnt out. Due to lack of data, emissions for earlier years from this fire have not been estimated.

IIR 2017
108
However, Norwegian authorities assume that these emissions are limited.
Method
NMVOC
NMVOC emissions from handling of coal are estimated by multiplying the amount of coal
extracted (raw coal production) with Tier 2 emission factors from EMEP/EEA Guidebook 2013
(EEA 2013).
Particles
Emissions of particles from handling of coal are estimated by multiplying the amount of coal
extracted (raw coal production) with Tier 1 emission factors from EMEP/EEA Guidebook 2013
(EEA 2013).
Activity data
Figures on Norwegian production (raw coal production) are reported by the plant to Statistics
Norway. Russian figures are reported to the Norwegian authorities on Svalbard; these figures
are, however, regarded as highly uncertain, consisting of a mixture of figures on production and
shipments.
Emission factors
NMVOC
Emission factors for NMVOC are taken from EMEP/EEA Guidebook 2013 (EEA 2013). The Tier 2
factors used are 3 kg NMVOC per tonne coal for surface mines and 0.2 kg NMVOC per tonne coal
for underground mines.
Particles
Emission factors for particles are taken from EMEP/EEA Guidebook 2013 (EEA 2013). The same
Tier 1 factors are used for both surface and underground mines. The factors are 0.089 kg
particles per tonne coal for TSP, 0.042 kg particles per tonne coal for PM10 and 0.005 kg particles
per tonne coal for PM2.5.
Uncertainties
The uncertainty in the activity data concerning Norwegian coal production is regarded as being
low. The uncertainty in Russian data is considerably higher.
Fugitive emissions from uncontrolled combustion and burning coal
dumps
NFR 1B1b
Last update: 07.06.11
Description
In 2005, a fire broke out in one of the Norwegian coal mines at Spitsbergen, causing minor
emissions.

IIR 2017
109
Method
Emissions have been calculated by multiplication of the quantity of coal combusted by standard
emission factors for combustion of coal.
Activity data
The company operating the mine has provided an estimate on the quantity of coal combusted in
the fire.
Emission factors
Emission factors for direct-fired furnaces, as given in Appendix B, have been used in the
calculations.
Emissions of BC have been estimated using the same share of PM2.5 as used for coal burning.
Uncertainties
The uncertainty in the activity data, that is the quantity of coal combusted, is unknown.
However, as the emissions are small, the uncertainty is insignificant.
Completeness
The only fire in a Norwegian coal mine since 1990 is included. Emissions from a smouldering fire
in a Russian mine, which is supposed to have lasted for several years, are not included in the
emission inventory, due to lack of data. The same applies to another fire in 2008. These
emissions are, however, probably insignificant.
Source specific QA/QC
There is no specific QA/QC procedure for this source.
Oil and natural gas
NFR 1B2
Last update: 10.03.2015
Description
1B2a covers emissions from loading and storage of crude oil, refining of oil and distribution of
gasoline. Loading, unloading and storage of crude oil on the oil fields off shore and at oil
terminals on shore cause emissions of NMVOC. Non-combustion emissions from Norway's two
oil refineries (a third was closed down in 2000) include NOX, NMVOC, SO2 and particulates.
Gasoline distribution causes emissions of NMVOC. Especially from 2007 there has been a shift in
the consumption of fuels for road traffic from gasoline to auto diesel. This is mainly due to the
introduction of a CO2 tax on passenger cars (PC) from January 1st 2007. This resulted in diesel
driven cars becoming less expensive than gasoline driven cars. From 2007, approximately 70 per
cent of all new PCs were diesel driven. This has led to a reduction in the distributed amount of
gasoline, and consequently of the NMVOC emissions from this source.
1B2b covers fugitive emissions of NMVOC from gas terminals on shore.

IIR 2017
110
1B2c covers fugitive emissions from venting and flaring. Venting emissions include emissions of
NMVOC from exploration and production drilling of gas and oil. The major source is cold vent
and leakage of NMVOC from production drilling.
Most of the emissions in 1B2c come from flaring of natural gas offshore (during both well
testing, extraction and pipeline transport) and at gas terminals and flaring of refinery gas at the
refineries. This flaring causes emissions of NOX, NMVOC, SO2, CO, particulates, BC,
PAHs (benzo(a)pyrene, benzo(b)fluoranthene, benzo(k)fluoranthene and indeno(1,2,3-
cd)pyrene) and dioxins. There is also some flaring of oil in connection with well testing -
amounts flared and emissions are reported to NPD (the Norwegian Petroleum Directorate) and
the Norwegian Environment Agency.
The major source in sector 1B2 is flaring of natural gas on the Norwegian continental shelf. Table
3.37 gives an overview over the calculations of the fugitive emissions of NMVOC.
Table 3.37 Fugitive emissions from oil and natural gas. Emission sources, compounds, methods, emission
factors and activity data included in the Norwegian GHG Inventory
B Fugitive emissions from fuels NMVOC Method Emission factor
Activity data
1.B.2.a Oil i. Exploration IE Tier II CS PS ii. Production IE Tier II CS PS iii. Transport R/E Tier II CS PS iv. Refining/Storage R Tier I/II CS PS v. Distribution of oil products R/E Tier I C/CS CS/PS vi. Other NO 1.B.2.b Natural gas i. Exploration IE IE IE IE ii. Production/Processing IE IE IE IE iii. Transmission IE IE IE IE iv. Distribution IE Tier II OTH CS/PS v. Other leakage industrial plants, power stations R Tier II CS PS residential/commercial sectors NO 1.B.2.c Venting i. Oil IE Tier II CS/PS PS ii. Gas IE Tier II CS/PS PS iii. Combined R/E Tier II CS/PS PS Flaring i. Oil (well testing) R/E Tier II CS PS ii. Gas Gas and oil fields R/E Tier II CS PS Gas terminals R/E Tier I CS CS Refineries E Tier I CS CS iii. Combined IE Tier I CS CS
R = emission figures in the national emission inventory are based on figures reported by the plants. E = emission figures are estimated by Statistics Norway (Activity data * emission factor). IE = Included elsewhere, NO = Not occurring, CS = Country specific, PS = Plant specific, Tier = the qualitative level of the methodology used, C=Corinair, OTH=Other.
Source: Statistics Norway/Norwegian Environment Agency

IIR 2017
111
Method
Loading and storage of crude oil off shore and on shore
NMVOC
From 2003, emission of NMVOC from loading and storage of crude oil on shuttle tankers
included in the GHG inventory are based on reported emission figures from the oil companies.
Emissions, activity, and to some extent emission factors, are reported from each field operator
into the database Environmental Web/EPIM Environment Hub (EEH). The database is operated
by Norwegian Oil and Gas Association. In addition the field operators each year deliver a report
where they describe the activities during the last year.
Before 2003, the emissions of NMVOC were calculated by Statistics Norway. The calculation was
based on the field specific amounts of crude oil loaded and stored multiplied with field specific
emission factors. Field specific activity data and emission factors (the latter only to the
Norwegian Environment Agency) used in the calculation were annually reported by the field
operators to Statistics Norway and the Norwegian Environment Agency. Since 2000, an
increasing share of the shuttle tankers have had installed vapour recovery units (VRU), and
emissions from loading of crude oil on shuttle tankers with and without VRU were calculated
separately for each field. In addition, emission figures were annually reported to the Norwegian
Environment Agency and used in the QC of the calculated emission figures.
Only emissions from loading and storage of the Norwegian part of oil production are included in
the inventory. For the Norwegian oil terminals on shore, the emissions from loading of crude oil
are reported annually from the terminals to the Norwegian Environment Agency. At one of the
terminals, VRU for recovering NMVOC was installed in 1996. The calculation of the emissions of
NMVOC at the terminals is based upon the amount of crude oil loaded and oil specific emission
factors dependent on the origin of the crude oil loaded.
Oil refineries
NOX, NMVOC, SO2 and particulates
Emission figures from the oil refineries are reported to the Norwegian Environment Agency, and
are after QA/QC procedures used in the emission inventory.
NMVOC emissions are based on measurements carried out by Spectracyne in 2002 and 2005.
Gasoline distribution
NMVOC
Emissions from gasoline distribution are calculated from figures on amounts of gasoline sold and
emission factors for, respectively, loading of tanker at gasoline depot, loading of tanks at
gasoline stations, and loading of cars.
Gas terminals
NMVOC
Fugitive emissions of NMVOC from gas terminals are annually reported from the terminals to
the Norwegian Environment Agency.

IIR 2017
112
The emissions are calculated based on the number of sealed and leaky equipment units that is
recorded through the measuring and maintenance program for reducing the leakage. The
number of sealed and leaky equipment units is collected two times a year and the average
number of the counting is used in the calculation. It is assumed in the calculation that a leakage
has lasted the whole year if not the opposite is documented.
Measurements of the total emissions were carried out in 2002 and 2003.
Venting
NMVOC
Emissions of NMVOC from cold venting and diffuse emissions for each field are reported
annually to the Norwegian Environment Agency from the field operator. The emissions are
mostly calculated by multiplying the amount of gas produced with an emission factor for each
emission source identified at the field.
Flaring
NOX, NMVOC, CO, particulates, BC, PAHs (benzo(a)pyrene, benzo(b)fluoranthene,
benzo(k)fluoranthene and indeno(1,2,3-cd)pyrene) and dioxins
Emissions from flaring of natural gas off shore are calculated by Statistics Norway on the basis of
field specific gas consumption data and emission factors. For NOX, NMVOC and SO2, calculated
emissions are used in the inventory for the years until 2002. From 2003, emissions of these
pollutants from flaring offshore have been reported by the oil companies to NPD and the
Norwegian Environment Agency are used in the inventory. The same method is used in the
calculation of emissions from flaring in connection with well testing.
Emissions of NOX from flaring at gas terminals are reported for all years. For NMVOC, emissions
are calculated for one gas terminal and reported figures used for the others. Other emissions
from the gas terminals are based on activity data and emission factors.
Activity data
Loading and storage of crude oil off shore and on shore
The amount of oil buoy loaded and oil loaded from storage tankers is reported by the field
operators in an annual report to the Norwegian Environment Agency and the Norwegian
Petroleum Directorate (NPD). The amount of oil loaded on shuttle tankers with or without VRU
is separated in the report.
Before 2003, Statistics Norway gathered data on amounts of crude oil loaded at shuttle tankers
and stored at storage vessels from the NPD. The data from each field are reported monthly by
the field operators to NPD on both a mass and a volume basis. The allocation of the amount of
crude oil loaded at shuttle tankers and stored at storage vessels with or without VRU is from the
annual report the field operators are committed to deliver to the Norwegian Environment
Agency and NPD.
The amount of oil loaded at on shore oil terminals is also reported to the Norwegian
Environment Agency and NPD.
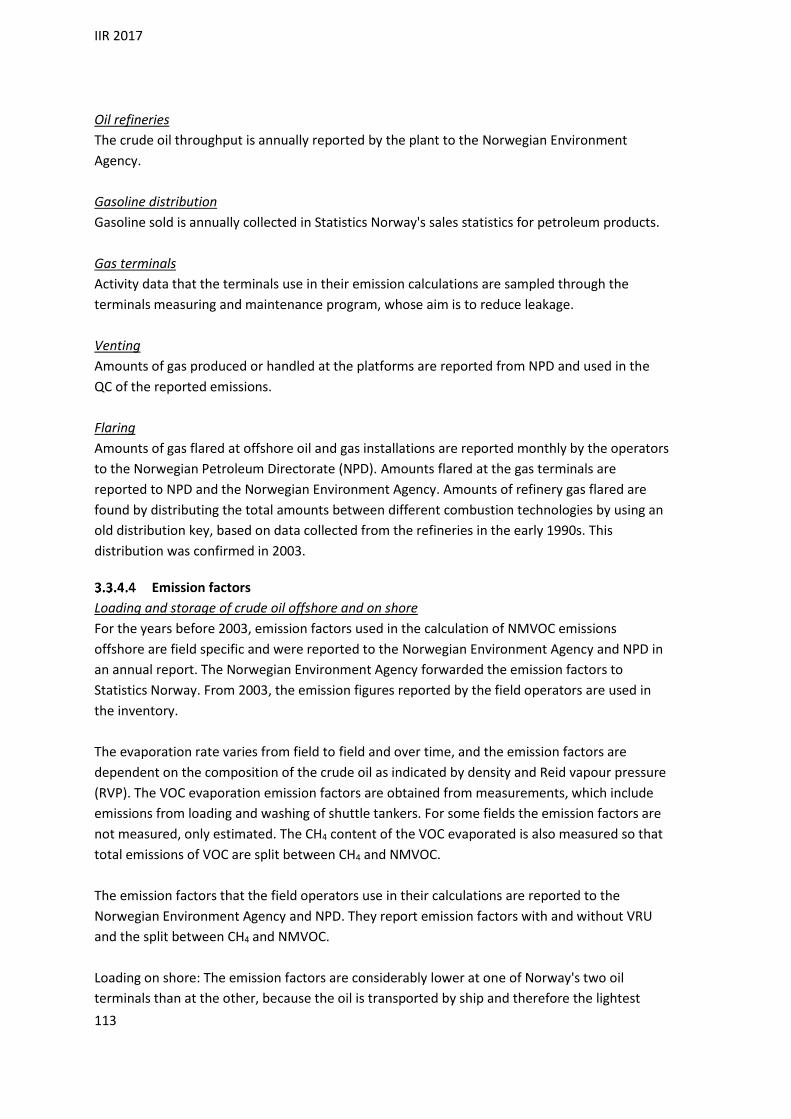
IIR 2017
113
Oil refineries
The crude oil throughput is annually reported by the plant to the Norwegian Environment
Agency.
Gasoline distribution
Gasoline sold is annually collected in Statistics Norway's sales statistics for petroleum products.
Gas terminals
Activity data that the terminals use in their emission calculations are sampled through the
terminals measuring and maintenance program, whose aim is to reduce leakage.
Venting
Amounts of gas produced or handled at the platforms are reported from NPD and used in the
QC of the reported emissions.
Flaring
Amounts of gas flared at offshore oil and gas installations are reported monthly by the operators
to the Norwegian Petroleum Directorate (NPD). Amounts flared at the gas terminals are
reported to NPD and the Norwegian Environment Agency. Amounts of refinery gas flared are
found by distributing the total amounts between different combustion technologies by using an
old distribution key, based on data collected from the refineries in the early 1990s. This
distribution was confirmed in 2003.
Emission factors
Loading and storage of crude oil offshore and on shore
For the years before 2003, emission factors used in the calculation of NMVOC emissions
offshore are field specific and were reported to the Norwegian Environment Agency and NPD in
an annual report. The Norwegian Environment Agency forwarded the emission factors to
Statistics Norway. From 2003, the emission figures reported by the field operators are used in
the inventory.
The evaporation rate varies from field to field and over time, and the emission factors are
dependent on the composition of the crude oil as indicated by density and Reid vapour pressure
(RVP). The VOC evaporation emission factors are obtained from measurements, which include
emissions from loading and washing of shuttle tankers. For some fields the emission factors are
not measured, only estimated. The CH4 content of the VOC evaporated is also measured so that
total emissions of VOC are split between CH4 and NMVOC.
The emission factors that the field operators use in their calculations are reported to the
Norwegian Environment Agency and NPD. They report emission factors with and without VRU
and the split between CH4 and NMVOC.
Loading on shore: The emission factors are considerably lower at one of Norway's two oil
terminals than at the other, because the oil is transported by ship and therefore the lightest
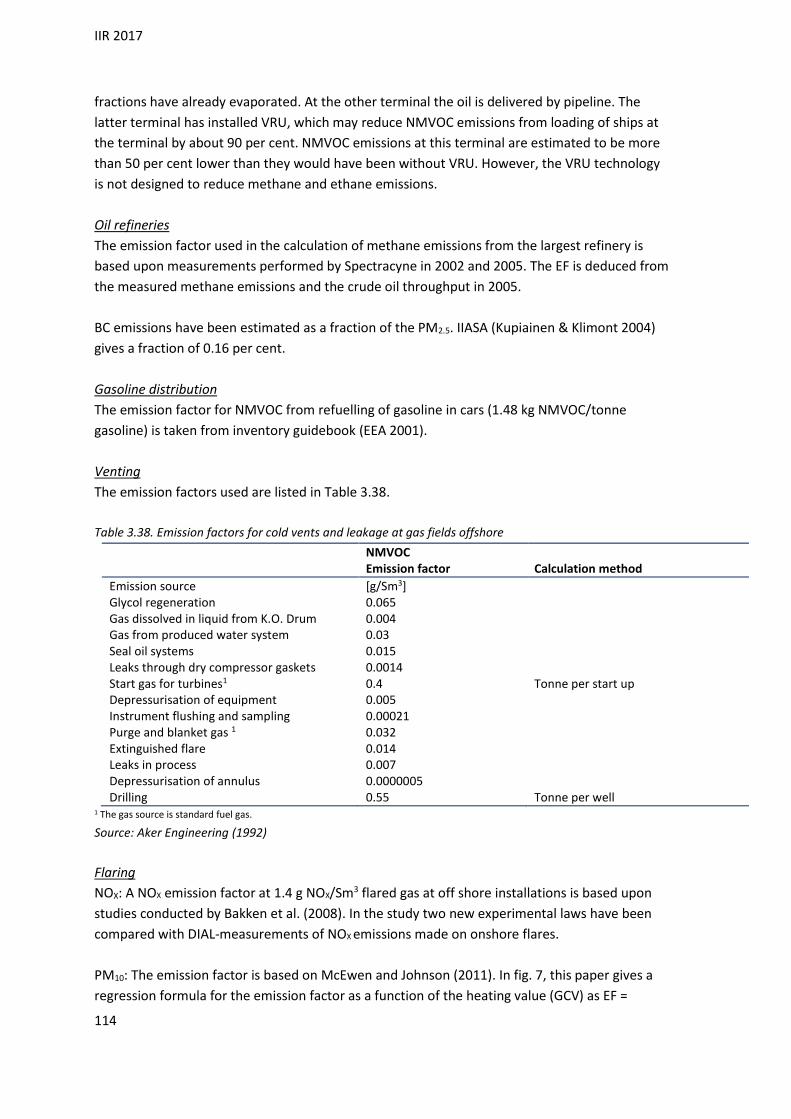
IIR 2017
114
fractions have already evaporated. At the other terminal the oil is delivered by pipeline. The
latter terminal has installed VRU, which may reduce NMVOC emissions from loading of ships at
the terminal by about 90 per cent. NMVOC emissions at this terminal are estimated to be more
than 50 per cent lower than they would have been without VRU. However, the VRU technology
is not designed to reduce methane and ethane emissions.
Oil refineries
The emission factor used in the calculation of methane emissions from the largest refinery is
based upon measurements performed by Spectracyne in 2002 and 2005. The EF is deduced from
the measured methane emissions and the crude oil throughput in 2005.
BC emissions have been estimated as a fraction of the PM2.5. IIASA (Kupiainen & Klimont 2004)
gives a fraction of 0.16 per cent.
Gasoline distribution
The emission factor for NMVOC from refuelling of gasoline in cars (1.48 kg NMVOC/tonne
gasoline) is taken from inventory guidebook (EEA 2001).
Venting
The emission factors used are listed in Table 3.38.
Table 3.38. Emission factors for cold vents and leakage at gas fields offshore
NMVOC Emission factor Calculation method
Emission source [g/Sm3] Glycol regeneration 0.065 Gas dissolved in liquid from K.O. Drum 0.004 Gas from produced water system 0.03 Seal oil systems 0.015 Leaks through dry compressor gaskets 0.0014 Start gas for turbines1 0.4 Tonne per start up Depressurisation of equipment 0.005 Instrument flushing and sampling 0.00021 Purge and blanket gas 1 0.032 Extinguished flare 0.014 Leaks in process 0.007 Depressurisation of annulus 0.0000005 Drilling 0.55 Tonne per well
1 The gas source is standard fuel gas.
Source: Aker Engineering (1992)
Flaring
NOX: A NOX emission factor at 1.4 g NOX/Sm3 flared gas at off shore installations is based upon
studies conducted by Bakken et al. (2008). In the study two new experimental laws have been
compared with DIAL-measurements of NOX emissions made on onshore flares.
PM10: The emission factor is based on McEwen and Johnson (2011). In fig. 7, this paper gives a
regression formula for the emission factor as a function of the heating value (GCV) as EF =
IIR 2017
115
0.0578(HV) – 2,09. For Norwegian offshore flaring a heating value of 48 MJ/Sm3 is suggested in
Bakken et al. (2008). This gives an emission factor of 0.856 g PM10/Sm3.
BC: Emissions are estimated using the same methodology as PM10 emissions. The regression
formula for the BC emission factor, given as a function of the heating value (GCV) is EF =
0.0578(HV) – 2,09. This gives an emission factor of 0.684 g BC/Sm3.
Other emission factors from flaring of gas are shown in appendix B. The same factors are used
for flaring of gas in connection with well testing. For flaring of oil, the emission factors are
shown in Table 3.39.
Table 3.39. Emission factors for flaring of oil in connection with well testing
Compounds (unit) unit/tonnes flared oil
Source
NOX (tonnes) 0.0037 (OLF 2009)
NMVOC (tonnes) 0.0033
CO (tonnes) 0.018
TSP (tonnes) 0.025 Measurements (OLF1) Use the same distribution as for combustion of heavy fuel oil in industry (EPA 2002)
PM10 (tonnes) 0.0215
PM2.5 (tonnes) 0.014
PAH (kg) 0.012 (OLF 1991) Use the same distribution as for com-bustion of heavy fuel oil in industry (EPA 1998)
Benzo(a)pyrene, benzo(b)fluoranthene benzo(k)fluoranthene indeno(1,2,3-cd)pyrene,
0.00024
..
..
Dioxins (mg) 0.01 Measurements (OLF) PCB (mg) 220 Langøren and Malvik (2010)
1The Norwegian Oil Industry Association (OLF) now Norwegian Oil and Gas Association.
Uncertainties
The uncertainty in the emission factors for NMVOC (Rypdal & Zhang 2001) from oil loading is
estimated to be 40 per cent and in the activity data 3 per cent.
The uncertainty in the amount of gas flared is in regarded as being low, ±1.4 per cent, based on
data reported in the emission trading scheme (Climate and Pollution Agency 2011) and
assumptions in Rypdal and Zhang (2000). The uncertainty in NMVOC emissions from venting is
much higher than for flaring.
The emission factors for both storage and transmission of natural gas are uncertain, since
Austrian factors are used in lack of country specific Norwegian factors.
All uncertainty estimates for this source are given in Appendix C.
IIR 2017
116
Source-specific QA/QC and verification
Statistics Norway gathers activity data on oil and gas activities from the Norwegian Petroleum
Directorate (NPD). These data are reported monthly by the field operators to NPD. The activity
data are quality controlled by comparing them with the figures reported in the field operator's
annual report to the Norwegian Environment Agency and NPD. The emissions calculated by
Statistics Norway for 1990-2002 were compared with the emission data that the field operators
reported to the Norwegian Environment Agency and NPD. From 2003, Statistics Norway
estimate emissions based on activity data that the field operators monthly report to NPD, and
reported emission factors. When discrepancies are found between the two sets of data these
are investigated and corrections are made if appropriate. If errors are found, the Norwegian
Environment Agency contacts the plant to discuss the reported data and changes are made if
necessary.
The reported emissions from the gas terminals are compared with previous years’ emissions.
The Norwegian Environment Agency collects the activity data used for venting and flaring in the
calculation from the NPD. The figures are quality controlled by comparing them with the figures
reported in the field operators’ annual report to the Norwegian Environment Agency and NPD,
and time series are checked.
The Norwegian Environment Agency perform internal checks of the reported data for venting
from the field operators. Some errors in the time-series are usually found and the field
operators are contacted and changes are made. The same procedure is followed to check the
amount of gas reported as flared. The quality of the activity data is considered to be high, due to
the fact that there is a tax on gas flared offshore. NPD has a thorough control of the amount of
gas reported as flared.

IIR 2017
117
4 INDUSTRIAL PROCESSES AND PRODUCT USE (NFR
sector 2)
NFR 2
4.1 Overview
This chapter provides descriptions of the methodologies employed to calculate emissions of
greenhouse gases and long-range transboundary air pollutants from industrial processes and
product use. Only non-combustion emissions are included in this chapter. Emissions from fuel
combustion in the manufacturing industries are reported in the Energy chapter. Emission figures
are either reported by plants to the Norwegian Environment Agency or calculated by Statistics
Norway, based on emission factors and activity data. The emission factors are collected from
different sources, while the activity data used in calculations carried out by Statistics Norway
mainly come from official statistics collected by Statistics Norway.
4.2 Mineral products
NFR 2A
Last update: 22.10.16
The sector category Mineral products in the Norwegian inventory includes emissions from
fourteen different products. SO2, NOX, NH3, particles, BC, heavy metals dioxins, PAHs
benzo(a)pyrene, benzo(b)fluoranthene, benzo(k)fluoranthene and indeno(1,2,3-cd)pyrene) and
HCB are components that are emitted during the production of mineral products and included in
the inventory.
Table 4.1 shows the various components emitted from the different activities, and for which
components the emission figures in the national inventory are based on figures reported by the
plants (R) and for which the figures are estimated by Statistics Norway (E).
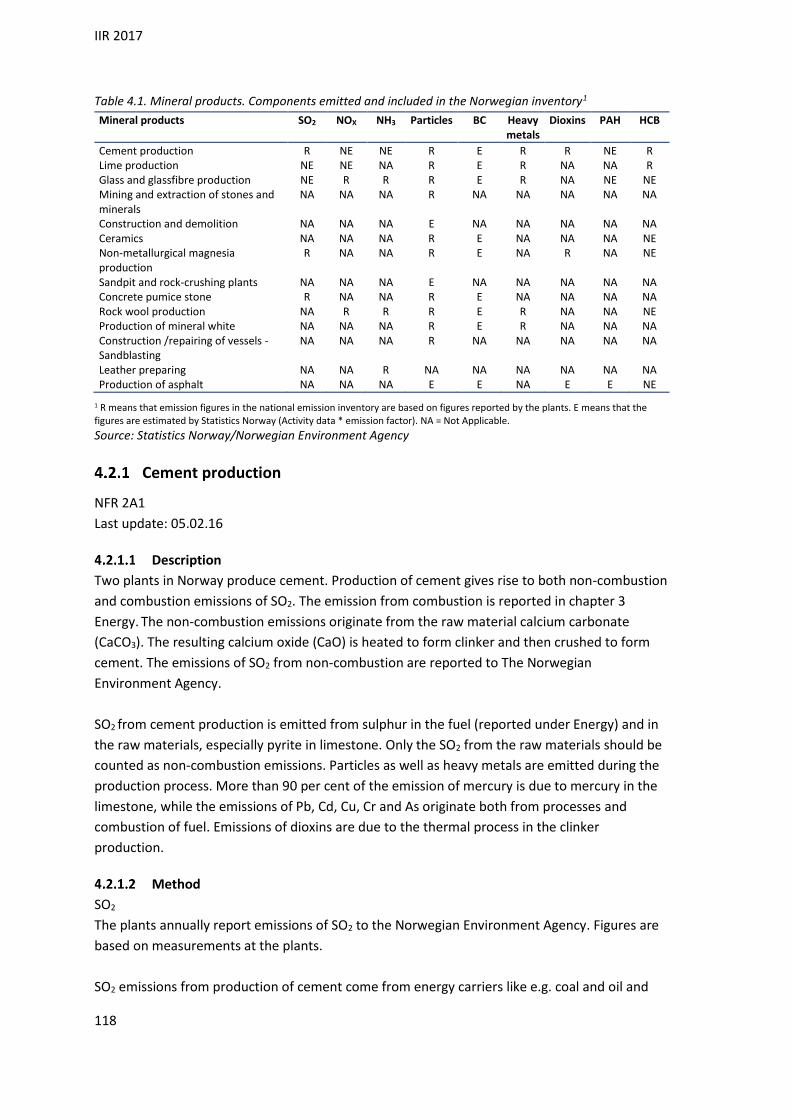
IIR 2017
118
Table 4.1. Mineral products. Components emitted and included in the Norwegian inventory1
Mineral products SO2 NOX NH3 Particles BC Heavy metals
Dioxins PAH HCB
Cement production R NE NE R E R R NE R Lime production NE NE NA R E R NA NA R Glass and glassfibre production NE R R R E R NA NE NE Mining and extraction of stones and minerals
NA NA NA R NA NA NA NA NA
Construction and demolition NA NA NA E NA NA NA NA NA Ceramics NA NA NA R E NA NA NA NE Non-metallurgical magnesia production
R NA NA R E NA R NA NE
Sandpit and rock-crushing plants NA NA NA E NA NA NA NA NA Concrete pumice stone R NA NA R E NA NA NA NA Rock wool production NA R R R E R NA NA NE Production of mineral white NA NA NA R E R NA NA NA Construction /repairing of vessels - Sandblasting
NA NA NA R NA NA NA NA NA
Leather preparing NA NA R NA NA NA NA NA NA Production of asphalt NA NA NA E E NA E E NE
1 R means that emission figures in the national emission inventory are based on figures reported by the plants. E means that the figures are estimated by Statistics Norway (Activity data * emission factor). NA = Not Applicable.
Source: Statistics Norway/Norwegian Environment Agency
Cement production
NFR 2A1
Last update: 05.02.16
Description
Two plants in Norway produce cement. Production of cement gives rise to both non-combustion
and combustion emissions of SO2. The emission from combustion is reported in chapter 3
Energy. The non-combustion emissions originate from the raw material calcium carbonate
(CaCO3). The resulting calcium oxide (CaO) is heated to form clinker and then crushed to form
cement. The emissions of SO2 from non-combustion are reported to The Norwegian
Environment Agency.
SO2 from cement production is emitted from sulphur in the fuel (reported under Energy) and in
the raw materials, especially pyrite in limestone. Only the SO2 from the raw materials should be
counted as non-combustion emissions. Particles as well as heavy metals are emitted during the
production process. More than 90 per cent of the emission of mercury is due to mercury in the
limestone, while the emissions of Pb, Cd, Cu, Cr and As originate both from processes and
combustion of fuel. Emissions of dioxins are due to the thermal process in the clinker
production.
Method
SO2
The plants annually report emissions of SO2 to the Norwegian Environment Agency. Figures are
based on measurements at the plants.
SO2 emissions from production of cement come from energy carriers like e.g. coal and oil and

IIR 2017
119
from limestone. The sulphur from the energy carriers is to a large extent included in the clinker
during the process. The emissions are distributed between combustion and non-combustion
emissions based on studies conducted by Institute for Energy Technology in 1970 and 1999.
Both studies indicate that 80-99 per cent of the sulphur from energy carriers is included in the
clinker.
The total SO2 emissions from the two plants are based on measurements. When the SO2
emissions reported from the plant are not distributed between combustion and non-
combustion emissions, the Norwegian Environment Agency distributes the total emissions, using
the same percentage distribution as in the last year with reported distributed SO2 emissions. The
production technology is to some extent different for the two plants. In the last years, the
distribution between combustion and non-combustion emissions is about 10/90 for one plant
and 18/82 for the other plant. The difference is assumed to be due to the fact that one plant has
a ”by-pass” system where some of the flue gas is not in contact with the raw materials.
The amount of energy carriers used in cement production is subtracted from the energy balance
to avoid double counting, see section 3.2.1.2.
Particles
Emissions have been reported to the Norwegian Environment Agency since 1991 for one plant
and since 1992 for the other. It is believed that the reported figures also include emissions from
combustion. Therefore, emissions from combustion of coal, coke and waste oil used in cement
production are not calculated, to avoid double counting. The plants have installed particle filter.
Particle size distribution for emitted particles from cement production is found in TNO (Institute
of environmental and energy technology 2002). In the Norwegian emission inventory, PM10 and
PM2.5 are assumed to be 85 and 30 per cent of TSP, respectively.
BC
Emissions have been estimated from a share of PM10 emissions given by IIASA in Kupiainen and
Klimont (2004). As a share of PM10, BC emission factor is 0.25 per cent.
Heavy metals and POPs
Emission figures for heavy metals are reported to the Norwegian Environment Agency. It is
believed that these figures also include emissions from combustion. Therefore emissions from
combustion of coal, coke and waste oil used in cement production are not calculated, to avoid
double counting.
Dioxin figures are reported to the Norwegian Environment Agency. It is also here assumed that
the reported figures include emissions from fuel combustion, therefore emissions from
combustion are not calculated.
HCB emissions were reported by the plant to the Norwegian Environment Agency in 2010. This
reporting has been used to estimate emissions in 2010. For other years in the time series,

IIR 2017
120
emissions have been estimated using a Tier 2 emission factor from the EEA (2016).
Uncertainties
Uncertainty estimates for long-range transboundary air pollutants are given in Appendix C.
Reported emission figures for particles have varied a great deal as a result of changes the plants
have undergone to reduce emissions. There are also uncertain measurements due to annual
variations.
Regarding the heavy metals, it has varied when the two plants started reporting the various
components, and therefore estimations have been necessary for the years when reporting have
been insufficient. The reported figures also vary from a year to another due to process technical
conditions, variations in the metal content in the limestone used, and uncertain measurements.
Completeness
Major missing emission components are not likely.
Source specific QA/QC
There is no source specific QA/QC procedure for this sector. See section 1.6 for the description
of the general QA/QC procedure
Lime production
NFR 2A2
Last update: 05.02.16
Description
Emissions of particles, black carbon and HCB from lime production are included in the
Norwegian inventory.
Method
Particles
One plant has reported emission figures for particulate matter to the Norwegian Environment
Agency since 1990. Emission figures from 1990 to 1995 are based on calculations, using emission
factors and production volume. Since 1996, the figures are a result of measurements at the
plant. The plant has installed particle filter.
In the inventory, a particle size distribution suggested by TNO (Institute of environmental and
energy technology 2002) is used. PM10 is 0.4*TSP while PM2.5 is 0.08*TSP.
BC
For the same plant that reports particles, BC emissions have been estimated from a share of TSP
emissions given by IIASA in Kupiainen and Klimont (2004). As a share of TSP, BC emission factor
is 0.2 per cent.
HCB

IIR 2017
121
HCB may unintentionally be formed in the production and extracation of lime in the thermic
process. One plant has reported emisisons in 2010. Emissons for the rest of the timeseries are
estimated based on lime production data. Emissions for two other plants that do not report
emisisons are also estimated based on lime production. The emission factor used is 0.008 mg
HCB per tonne lime from Japan (Toda 2006). It is also assumed that, for this category, the
reported figures include emissions from fuel combustion, therefore emissions from combustion
are not calculated.
Activity data
The activity data is the input of limestone and dolomite, these amounts are annually reported to
the Norwegian Environment Agency.
Uncertainties
The particle distribution used is not specified for the plants, and the particles emitted might
therefore have another distribution than the one suggested from TNO (Institute of
environmental and energy technology 2002).
Completeness
Major missing emission components are not likely.
Source specific QA/QC
There is no source specific QA/QC procedure for this sector. See section 1.6 for the description
of the general QA/QC procedure.
Glass and glassfibre production
NFR 2A3
Last update: 22.12.16
Description
Five plants producing glass, glass wool or glass fibre are included in the emission inventory, with
figures based on emission reports to the Norwegian Environment Agency. PAHs
(benzo(a)pyrene, benzo(b)fluoranthene, benzo(k)fluoranthene and indeno(1,2,3-cd)pyrene) and
dioxin emissions are neither calculated nor measured although glass production might be a
dioxin emissions source.
Method
NOX
The two glass wool producing plants and the one producing glass fibre annually report emission
figures for NOX to the Norwegian Environment Agency. The emission figures are based on
calculations.
NH3
The two glass wool producing plants annually report emission figures for NH3 to the Norwegian
Environment Agency. The emission figures are based on measurements.

IIR 2017
122
Particles
The two plants producing glass wool have reported emission figures to the Norwegian
Environment Agency since 1990. The glass fibre producing plant has reported emissions from
1996; for the period 1990-1995, the 1996 figure is used in the inventory. One glass-producer
with particle emissions reported figures from 1995. Emission figures from 1990 to 1994 were
assumed to be the same as the reported 1995 figure. This plant was closed down in 1999.
TNO (Institute of environmental and energy technology 2002) suggests using a particle size
distribution of the emissions where PM2.5 is 80 per cent of TSP and PM10 is 90 per cent of TSP,
and this size distribution is used in the Norwegian inventory.
BC
Emissions have been estimated from a share of PM2.5 emissions given by IIASA in Kupiainen and
Klimont (2004). BC has been considered to be 0.06 per cent of PM2.5 emissions.
Heavy metals and POPs
Emission of lead has been reported from two glass-producers to the Norwegian Environment
Agency. One of them was closed down in 1999. The emission of lead is due to the lead content
in the raw material used. Emissions of other heavy metals are reported under Energy.
Uncertainties
For the years where reported emission figures for particles do not exist, Statistics Norway has
assumed that emissions are in the same order of magnitude as for the first year of reporting.
This is uncertain and only an estimate, since it does not consider annual changes in raw
materials, production rates, nor possible cleaning devices.
Completeness
Production of glass can be a source for dioxin emissions, but no reported figures are available.
Emission factors are found in literature, but since activity data (production rate) is not available
and it is assumed that the emission factor is dependent on type of glass produced, emissions are
not calculated.
Emissions of particles are also reported from three other glass-producers in Norway, but since
annual emissions are low (less than 1 tonne), they are not included in the inventory.
Source specific QA/QC
There is no source specific QA/QC procedure for this sector. See section 1.6 for the description
of the general QA/QC procedure.
Mining and extraction of stones and minerals
NFR 2A5A
Last update: 14.09.15
Description
Mining and extraction of stones and minerals are done by several plants. Particles are emitted
IIR 2017
123
during these processes.
Method
Particles
Emission figures are reported to the Norwegian Environment Agency. Reported figures exist
from 1992. Emission figures for 1990 and 1991 are assumed by Statistics Norway, in accordance
with the Norwegian Environment Agency, to be the same as reported figures in 1992. An
exception is one plant, which only reported emissions for 1992. For this plant, Statistics Norway
has calculated emissions based on production rates for previous and later years.
It is given for most plants that they use fabric filter or textile fibre to clean their particle
emissions. It is assumed by the Norwegian Environment Agency that the particles emitted are
larger than PM10. Thus, BC has not been considered for this category.
The Norwegian inventory uses the size distribution recommended by TNO (Institute of
environmental and energy technology 2002) for sandpits and rock-crushing plants (Table 4.3).
Uncertainties
For years where reported emission figures do not exist, Statistics Norway has assumed that
emissions are in the same order of size as for the first year of reporting. This is uncertain and a
result of lack of better data. The size of the particles emitted from mining and extraction will
also depend on the type of stone/mineral and production process. The particle size distribution
used in the inventory does not consider these differences.
Completeness
Emission of particles is often a source of heavy metal emissions since particles often contain
heavy metals. Type of metals will however depend on the origin of the particles. Metals might
therefore be emitted during mining and extraction of stones and minerals. There are, however,
no data available for calculating emissions of heavy metals.
Source specific QA/QC
There is no source specific QA/QC procedure for this sector. See section 1.6 for the description
of the general QA/QC procedure.
Construction and demolition
NFR 2A5B
Last update: 10.01.17
Description
Construction and building includes a lot of different activities that will generate particle
emissions.
Method
Particles
Emission factors and activity data are used to estimate the Norwegian emissions.

IIR 2017
124
Emission factors
The emission factors used are shown in Table 4.2.
Table 4.2. Particle emission factors for building and construction. Tonne/hectare/year
Component Tonne/hectare/year
TSP 1.62 PM10 0.8121.52 PM2.5 0.08120.52
Source: EEA (2013)
Statistics Norway assumes that none of the processes used in building and construction will lead
to BC emissions. Hence, BC has not been considered for this activity.
Activity data
The activity data used is the annual area of completed buildings from the building statistics at
Statistics Norway.
Uncertainties
The particle emissions depend on climate conditions as well as building traditions and building
materials. Since the emission factors used are based on surveys in other countries than Norway,
these factors might not be ideal for Norwegian conditions.
Completeness
Building of roads, railways, tunnels and demolition of buildings is also a source of particle
emissions, but no emission factors are found in the literature, and therefore such emissions are
not included in the inventory.
Source specific QA/QC
There is no source specific QA/QC procedure for this sector. See section 1.6 for the description
of the general QA/QC procedure.
Ceramics
NFR 2A6
Last update: 27.10.16
Description
One plant producing bricks reports emission of particulate matter from limestone and dolomite
use to the Norwegian Environment Agency.
Method
Particles
Emissions have been reported to the Norwegian Environment Agency since 2000. Reported figure for 2000 have been used for all years since 1990. The same particle size distribution is used as for production of cement as given in TNO (Institute of environmental and energy technology 2002). PM10 and PM2.5 are assumed to be 85 and 30 per cent of TSP, respectively.
BC

IIR 2017
125
Emissions has been estimated from a share of PM2.5 emissions. Values for bricks production are
given by IIASA in Kupiainen and Klimont (2004). As a share of PM2.5, emission factor is 37.5 per
cent.
Uncertainties
Uncertainty estimates are given in Appendix C.
Completeness
Major missing emission components are not likely.
Source specific QA/QC
There is no source specific QA/QC procedure for this sector. See section 1.6 for the description
of the general QA/QC procedure.
Non-metallurgical Magnesia Production
NFR 2A6
Last update: 27.10.16
Description
One plant whose main activity is producing magnesium oxide and calcium oxide from limestone
and dolomite is included in the emission inventory. The plant was established in 2005.
Method
Particles
Emissions have been reported to the Norwegian Environment Agency for the years 2005-2008
and 2013 and onwards. Linear interpolation has been used for the intervening years. No
information is found regarding the particle size distribution for particles emitted during
production. In lack of other data we used the same distribution as for aluminium production
PM10 and PM2.5 are assumed to be 100 and 43 per cent of TSP, respectively.
BC
Emissions has been estimated from a share of PM2.5 emissions.Values for bricks production are
given by IIASA in Kupiainen and Klimont (2004). As a share of PM2.5, emission factor is 37.5 per
cent.
SO2
Emissions have been reported to the Norwegian Environment Agency since 2006.
Dioxins
Emissions have been reported to the Norwegian Environment Agency for the years 2011, 2013
and onwards.
PCB
Emissions have been measured and reported to the Norwegain Environment Agency for 2010.
An emission factor has been built from these emissions measurements to estimate emissions for

IIR 2017
126
the whole timeseries.
Activity data
The amount of limestone and dolomite used by the plant in their calculation is annually reported
to the Norwegian Environment Agency.
Uncertainties
Uncertainty estimates are given in Appendix C.
The particle distribution used is not specified for the plants, and the particles emitted might
therefore have another distribution than the one suggested.
Completeness
Major missing emission components are not likely.
Source specific QA/QC
There is no source specific QA/QC procedure for this sector. See section 1.6 for the description
of the general QA/QC procedure.
Sandpit and rock-crushing plant
NFR 2A6
Last update: 10.01.17
Method
Particles will be emitted during crushing of rocks and at sandpits. In the inventory, emissions are
estimated based on the production of sand and crushed stone from the production statistics at
Statistics Norway, and emission factors recommended by EEA (2016).
Activity data
The production of sand and crushed stone is annually given by Statistics Norway’s production
statistics.
Emission factors
The emission factors used are shown in Table 4.3.
Table 4.3. Particle emission factors for sandpits and rock-crushing plants. Ratio X1/TSP
Component g/tonne produced
TSP 102 PM10 50 PM2.5 5
1 X is either PM2.5, PM10 or TSP.
Source: EEA (2016)
All particles are assumed to be larger than PM2.5. Thus, no emission of BC has been estimated.
Uncertainties
This emission source is highly uncertain since the emissions will vary from one place to another
depending on the different processes in use, type of raw materials and of course the activity

IIR 2017
127
level. Little information is available in the literature. The emission factors used are only based on
one source and are uncertain. In addition, there is uncertainty regarding the activity data. The
PRODCOM codes used in the production statistics include total production of sand and crushed
stone in Norway, but some of it might not be relevant for these calculations.
Completeness
Emission of particles is often a source of heavy metal emissions since particles often contain
heavy metals. Type of metals will however depend on the origin of the particles. Metals might
therefore be emitted during crushing at sandpits and rock-crushing plants. There are however
no data available for calculating emission of heavy metals.
Source specific QA/QC
There is no source specific QA/QC procedure for this sector. See section 1.6 for the description
of the general QA/QC procedure.
Concrete pumice stone
NFR 2A6
Last update: 27.10.16
Description
Two factories have reported emissions of SO2 and particles from concrete pumice stone
production to the Norwegian Environment Agency until 2004 when one of them was closed
down.. Non-combustion emissions of SO2 originate from the clay used in the production process.
Method
SO2
Emission figures for SO2 are reported to the Norwegian Environment Agency, based on
measurements at the two manufacturing plants in Norway. The plants have installed flue gas
desulphurisation equipment.
Particles
The plants have reported emissions of particles to the Norwegian Environment Agency since
1990. It is assumed that the reported figures include both process and combustion emissions, so
emission calculations from fuel combustion are not done for these two plants. The plants have
installed particle filters.
No information concerning particle size is found in national or international literature, but the
Norwegian Environment Agency assumes that most of the particles emitted from these plants
are smaller than PM10. Statistics Norway has decided to use the same particle size distribution
for production of cement as given in TNO (Institute of environmental and energy technology
2002). PM10 is therefore assumed to be 0.85*TSP and PM2.5 is 0.3*TSP.
BC
Emissions has been estimated from a share of PM2.5 emissions.Values for bricks production are
IIR 2017
128
given by IIASA in Kupiainen and Klimont (2004). As a share of PM2.5, emission factor is 37.5 per
cent.
Uncertainties
The particle size distribution used is not specific for production of concrete pumice stone, but
used due to lack of specific size distribution data for this source. The particle size distribution
can therefore only be seen as an estimate.
Completeness
Particles often contain heavy metals, but type of metals and volumes will depend on the origin
of the particles. Metals might therefore be emitted during production of concrete pumice stone.
Statistics Norway and the Norwegian Environment Agency have, however, no data available for
calculating emissions of heavy metals from this source.
Source specific QA/QC
There is no source specific QA/QC procedure for this sector. See section 1.6 for the description
of the general QA/QC procedure.
Rock wool production
NFR 2A6
Last update: 12.01.17
Description
Three plants in Norway produced rock wool until 2003 when one of them was closed down. In
the inventory, emission figures for NH3, particles and heavy metals are included. Particles
originate from the cutting of the mineral wool and from fuel used in the production. The
emissions of heavy metals are partly due to use of coal/coke, but mainly due to the stone used
in the production. Emissions of dioxins and PAHs (benzo(a)pyrene, benzo(b)fluoranthene,
benzo(k)fluoranthene and indeno(1,2,3-cd)pyrene) are neither reported nor calculated since
emissions of these components are minor or not occurring.
Method
NOX
Emission figures are reported to the Norwegian Environment Agency.
NH3
Emission figures are reported to the Norwegian Environment Agency. Figures exist from 1992. It
is assumed in the inventory that emission figures for 1990 and 1991 are the same as the
reported figure in 1992.
Particles
Emission figures are reported to the Norwegian Environment Agency. Most of the emissions
come from the spin chamber, and the particle size is assumed to be less than 1 m. Particles
emitted from the fabric filter are also assumed to be smaller than 1 m. All emissions are
therefore set to be smaller than PM2.5. All assumptions are made by the Norwegian Environment

IIR 2017
129
Agency in accordance with the industry. It is assumed that the reported figures include both
non-combustion and combustion emissions. Combustion emissions of particles are therefore
not calculated.
BC
Emissions have been estimated from a share of PM2.5 emissions. Values for glass fiber
production are given by IIASA in Kupiainen and Klimont (2004). As a share of PM2.5, emission
factor is 0.06 per cent.
Heavy metals and POPs
Emission figures for Pb, Cd, As and Cr have been reported annually from one of the plants to the
Norwegian Environment Agency since 1999. The figures are based on measurements. It is
assumed that the reported figures include combustion emissions, and emission calculations
from fuel combustion are not done for these heavy metals. Statistics Norway has calculated the
emission figures for missing years (1990-1998) based on reported figures in 1999 and production
rates for previous years. For the two plants not reporting, Statistics Norway calculates emissions
based on derived emission factors from the one plant that reports and production volumes at
each plant.
Activity data
Production volumes of rock wool are annually reported from the plants to the Climate and
Pollution Agency.
Emission factors
BC
Emissions have been estimated from a share of PM2.5 emissions. Value given by IIASA in
Kupiainen and Klimont (2004) for glass production have been used. As a share of PM10, emission
factor is 0.25 per cent.
Heavy metals
A default emission factor is derived for each component (Pb, Cd, As and Cr) based on the
annually reported emission figures and production rates from the one plant reporting. The
derived emission factors are used to calculate emissions from the two other plants (one of these
were closed down in 2003).
Table 4.4. Emission factors for Pb, Cd, As and Cr from production of rock wool.
g/tonne produced rock wool
Component Emission factors (g/tonne produced rock wool)
Lead (Pb) 0.164 Cadmium (Cd) 0.001 Arsenic (As) 0.031 Chromium (Cr) 0.703
Source: Statistics Norway/Norwegian Environment Agency
Uncertainties
Activity data
IIR 2017
130
The activity data is assumed to be of good quality since this is production rates reported from
each plant to the Climate and Pollution Agency.
Emission factors
Several conditions influence the emission of heavy metals, such as production rates and raw
materials, and these factors can vary from one plant to another. To derive emission factors
based on one plant's reported emission figures and production volume and use these factors to
estimate emissions at other plants is therefore quite uncertain.
Completeness
Major missing emission components are not likely.
Source specific QA/QC
There is no source specific QA/QC procedure for this sector. See section 1.6 for the description
of the general QA/QC procedure.
Production of mineral white (plaster)
NFR 2A6
Last update: 11.09.15
Description
Two plants producing mineral white in Norway are included in the inventory with their
emissions of mercury and particles. The mercury content in the raw materials leads to emission
of mercury, and during the production process, particles are emitted.
Method
Particles
Emission figures are reported to the Norwegian Environment Agency. Reported emission figures
exist since 1992 and figures for 1990 and 1991 are assumed by Statistics Norway, in accordance
with the Norwegian Environment Agency, to be the same as the figures reported in 1992. The
particles are purified through a fabric filter, and it is assumed by the Norwegian Environment
Agency that the particles emitted after the filter are smaller than PM10.
According to TNO (Institute of environmental and energy technology 2002), PM2.5 is 30 per cent
of TSP, while PM10 is assumed to be the same as TSP. The Norwegian inventory uses this
distribution.
BC
Emissions are estimated from a share of PM2.5 emissions. As no share for BC was found in the
literature, BC share has been set to be 50 per cent of PM2.5. Indeed, the amount of PM2.5 is
assumed to be equally shared between BC and organic mass (OM).
Heavy metals
The plants have reported emission figures to the Norwegian Environment Agency since 2000.
For one of the plants, historical emissions are based on reported figures for 2000 and

IIR 2017
131
production volumes. For the other plant, emission figures for 1990-1999 are assumed to be the
same as the reported figure for 2000, due to lack of production data for previous years. Annual
emissions are assumed to be low.
Activity data
Production volumes for calculation of historical emissions of mercury for one of the plants are
reported to the Norwegian Environment Agency.
Emission factors
Emission factors for mercury are derived from historical calculations for one plant, based on
reported figures for the first year of reporting and production volumes.
Uncertainties
Historical emissions of mercury for both plants are uncertain. For one plant, the emission figures
are based on a derived emission factor and production volumes, and do not take into account
changes in raw materials and possible cleaning devices. For the other plant, it is assumed, due to
lack of historical production data, that the historical emissions are the same as the reported
figures for 2000. This is just an estimate and does not consider annual changes in raw materials,
production rates, or possible cleaning devices.
The particle size distribution used in the inventory is not specific for the plants. The particles
emitted might therefore have another distribution than the one suggested by TNO, which is
used in the inventory.
Completeness
Major missing emission components are not likely.
Source specific QA/QC
There is no source specific QA/QC procedure for this sector. See section 1.6 for the description
of the general QA/QC procedure.
Construction and repairing of vessels - Sandblasting
NFR 2A6
Last update: 14.09.15
Description
Five plants constructing and repairing vessels are included in the inventory with their particle
emissions. One of the plants was closed down in 2000. Emission of particles is due to the
different processes during construction and repairing of vessels, but most of the particles are
emitted from sandblasting.
Method
Particles
Emission figures are reported to the Norwegian Environment Agency.
For four of the five plants, there are no information regarding cleaning device, but it is assumed
IIR 2017
132
by the Norwegian Environment Agency that they have fabric filter and/or wet washer. For the
last one, particle emissions are purified in cyclones, and the size of the particles emitted is larger
than PM10.
It is difficult to decide particle size of the particles emitted based on the above information. It is
however assumed by the Norwegian Environment Agency that most of the particles are larger
than PM10 and therefore no PM2.5 and PM10 is considered for this category. Thus, no BC emission
has been estimated.
Uncertainties
The size of the particles emitted is uncertain and will depend on the cleaning device used at
each plant. The different activities during construction and repairing can also result in emission
of particles of different sizes.
Completeness
Emission of particles is often a source of heavy metal emissions since particles often contain
heavy metals. Type of metals will however depend on the origin of the particles. Metals might
therefore be emitted during sandblasting and repairing/construction of vessels. There are
however no data available for calculating emissions of heavy metals.
Source specific QA/QC
There is no source specific QA/QC procedure for this sector. See section 1.6 for the description
of the general QA/QC procedure.
Leather preparing
NFR 2A6
Last update: 05.02.15
Method
NH3
NH3 is used to adjust the pH level in the fattening and colouring process in leather preparing.
This means that NH3 is dissolved in an aqueous solution to feed fatty substances to leather. One
plant reports emission figures for NH3 to the Norwegian Environment Agency. Emission figures
are available from 1994. Emissions for the years 1990-1993 are assumed by Statistics Norway
and the Norwegian Environment Agency to be the same as the reported figure for 1994. The
emission of NH3 reported by the plant is equal to the consumption of NH3.
Uncertainties
It is not clear if it is correct to assume that all NH3 consumed is emitted to air. This assumption
may have to be revised.
Completeness
Major missing emission components are not likely.
Source specific QA/QC
There is no source specific QA/QC procedure for this sector. See section 1.6 for the description
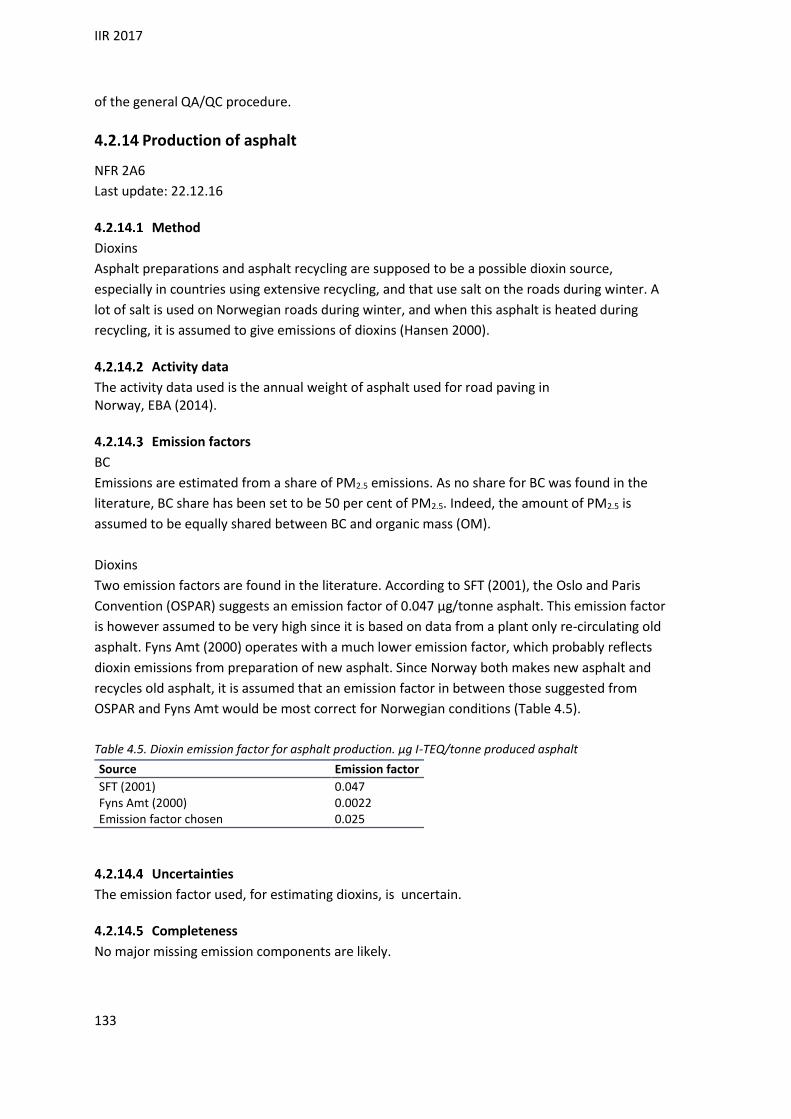
IIR 2017
133
of the general QA/QC procedure.
Production of asphalt
NFR 2A6
Last update: 22.12.16
Method
Dioxins
Asphalt preparations and asphalt recycling are supposed to be a possible dioxin source,
especially in countries using extensive recycling, and that use salt on the roads during winter. A
lot of salt is used on Norwegian roads during winter, and when this asphalt is heated during
recycling, it is assumed to give emissions of dioxins (Hansen 2000).
Activity data
The activity data used is the annual weight of asphalt used for road paving in Norway, EBA (2014).
Emission factors
BC
Emissions are estimated from a share of PM2.5 emissions. As no share for BC was found in the
literature, BC share has been set to be 50 per cent of PM2.5. Indeed, the amount of PM2.5 is
assumed to be equally shared between BC and organic mass (OM).
Dioxins
Two emission factors are found in the literature. According to SFT (2001), the Oslo and Paris
Convention (OSPAR) suggests an emission factor of 0.047 µg/tonne asphalt. This emission factor
is however assumed to be very high since it is based on data from a plant only re-circulating old
asphalt. Fyns Amt (2000) operates with a much lower emission factor, which probably reflects
dioxin emissions from preparation of new asphalt. Since Norway both makes new asphalt and
recycles old asphalt, it is assumed that an emission factor in between those suggested from
OSPAR and Fyns Amt would be most correct for Norwegian conditions (Table 4.5).
Table 4.5. Dioxin emission factor for asphalt production. µg I-TEQ/tonne produced asphalt
Source Emission factor
SFT (2001) 0.047 Fyns Amt (2000) 0.0022 Emission factor chosen 0.025
Uncertainties
The emission factor used, for estimating dioxins, is uncertain.
Completeness
No major missing emission components are likely.
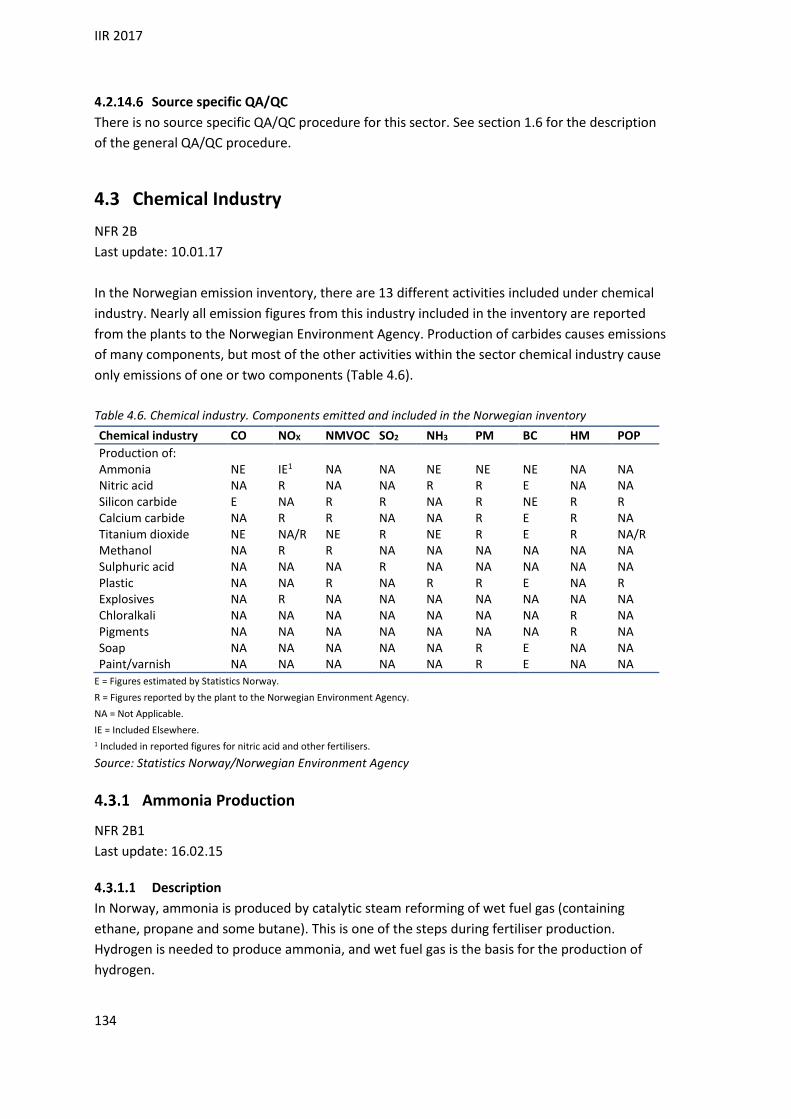
IIR 2017
134
Source specific QA/QC
There is no source specific QA/QC procedure for this sector. See section 1.6 for the description
of the general QA/QC procedure.
4.3 Chemical Industry
NFR 2B
Last update: 10.01.17
In the Norwegian emission inventory, there are 13 different activities included under chemical
industry. Nearly all emission figures from this industry included in the inventory are reported
from the plants to the Norwegian Environment Agency. Production of carbides causes emissions
of many components, but most of the other activities within the sector chemical industry cause
only emissions of one or two components (Table 4.6).
Table 4.6. Chemical industry. Components emitted and included in the Norwegian inventory
Chemical industry CO NOX NMVOC SO2 NH3 PM BC HM POP
Production of: Ammonia NE IE1 NA NA NE NE NE NA NA Nitric acid NA R NA NA R R E NA NA Silicon carbide E NA R R NA R NE R R Calcium carbide NA R R NA NA R E R NA Titanium dioxide NE NA/R NE R NE R E R NA/R Methanol NA R R NA NA NA NA NA NA Sulphuric acid NA NA NA R NA NA NA NA NA Plastic NA NA R NA R R E NA R Explosives NA R NA NA NA NA NA NA NA Chloralkali NA NA NA NA NA NA NA R NA Pigments NA NA NA NA NA NA NA R NA Soap NA NA NA NA NA R E NA NA Paint/varnish NA NA NA NA NA R E NA NA
E = Figures estimated by Statistics Norway.
R = Figures reported by the plant to the Norwegian Environment Agency.
NA = Not Applicable.
IE = Included Elsewhere. 1 Included in reported figures for nitric acid and other fertilisers.
Source: Statistics Norway/Norwegian Environment Agency
Ammonia Production
NFR 2B1
Last update: 16.02.15
Description
In Norway, ammonia is produced by catalytic steam reforming of wet fuel gas (containing
ethane, propane and some butane). This is one of the steps during fertiliser production.
Hydrogen is needed to produce ammonia, and wet fuel gas is the basis for the production of
hydrogen.

IIR 2017
135
Method
NOX
During the production of ammonia there are some non-combustion emissions of NOX. These
emission figures are included in the reported NOX emission from nitric acid production and
production of other fertilisers.
Uncertainties
The uncertainties in the figures reported by the plant are believed to be limited. Uncertainty
estimates are given in Appendix C.
Completeness
Major missing emission components are not likely.
Source specific QA/QC
The plant reports the emissions of NOX to the Norwegian Environment Agency. They examine
the trends as a quality check.
Production of nitric acid
NFR 2B2
Last update: 10.01.17
Description
There are two plants in Norway where nitric acid is produced. Nitric acid is used as a raw
material in the manufacture of nitrogenous-based fertiliser. The production of nitric acid (HNO3)
generates NOX as by-products of high temperature catalytic oxidation of ammonia (NH3). The
production of nitrogenous-based fertiliser also leads to emissions of particles.
Method
NOX
The two plants report the emissions of NOX to the Norwegian Environment Agency.
NH3
Emission figures for NH3 are annually reported to the Norwegian Environment Agency.
Particles
Both plants report emission figures to the Norwegian Environment Agency and have done so
since 1990 and 1992. One of the plants has also reported emissions from combustion, but since
it is only 1 per cent of the non-combustion emissions, these figures are included in the figures
for non-combustion emissions.
In lack of plant specific information regarding particle size distribution of the emitted particles,
Statistics Norway uses the distribution given by TNO (Institute of environmental and energy
technology 2002) for production of nitrogenous-based fertilisers where PM10 is 0.8*TSP and
PM2.5 is 0.6*TSP.

IIR 2017
136
BC
Emissions are estimated from a share of PM2.5 emissions. Tier 1 emission factor for BC applicable
for ‘general’ chemical industry is used, EEA (2013). BC=1,8 per cent of PM2.5..
Uncertainties
Uncertainty estimates for long-range transboundary air pollutants are given in Appendix C.
There is uncertainty regarding the size of the particles emitted since there is no plant specific
information available. The distribution recommended by TNO is used in lack of other data.
Completeness
Major missing emission components are not likely.
Source specific QA/QC
The plants report the production of HNO3 to the Norwegian Environment Agency. They compare
the trends in the production data with the trend in N2O emission and use this as a quality check.
Silicon carbide
NFR 2B5
Last update: 12.01.17
Description
Silicon carbide (SiC) is produced by reduction of quartz (SiO2) with petrol coke as a reducing
agent.
(4.2) SiO2 + 3C SiC + 2CO
CO 2O CO2
In the production of silicon carbide CO are released as by-products from the reaction between
quartz and carbon. Sulphur, NMVOCs, particles, heavy metals and PAHs (benzo(a)pyrene,
benzo(b)fluoranthene, benzo(k)fluoranthene and indeno(1,2,3-cd)pyrene) may also be emitted
during the production process. Sulphur originates from the petrol coke.
Method
NMVOC
Emission figures are reported to the Norwegian Environment Agency by the plants. The
emissions are calculated by multiplying annual production of silicon carbide by an emission
factor. From 2007 and onwards, the emission factor is based on measures made once a year. For
previous years, an average of the measured emissions in 2007 and 2008 is applied.
CO
The emissions of CO are calculated by Statistics Norway from the consumption of petrol coke
and an emission factor in accordance with the IPCC Guidelines (IPCC 1997).
SO2

IIR 2017
137
Emission figures are reported to the Norwegian Environment Agency by the plants. The
emissions are calculated from the consumption of petrol coke in dry weight and the sulphur
content in the coke. It is assumed that 3 per cent of the sulphur is left in the product or as
wastage.
Particles
Emission figures for particles are reported to the Norwegian Environment Agency. Two of the
plants have reported since 1990 while the third has reported since 1991. Emission figures for
1990 for this plant are assumed by Statistics Norway and the Norwegian Environment Agency to
be the same as the reported figure for 1991. For one of the plants, reported figures have not
been used in the inventory for 1990-1993, since the plant means these emission figures are not
representative, but a result of different measurement and calculation methods. For this plant,
reported emission figures for 1994 have been used for 1990-1993.
There is no detailed information about the particle size distribution for the emissions from
silicon carbide production. The Norwegian Environment Agency assumes the emissions have the
same particle size distribution as emissions of particles from production of ferroalloys, where all
particles are expected to be smaller than PM2.5. This is however an uncertain estimate. This
leads to a distribution where TSP=PM10=PM2.5.
Heavy metals
Emission figures have been reported to the Norwegian Environment Agency since 1999/2000.
For Pb, Hg and Cd, historical emissions are based on emission factors derived from reported
emission figures and production rates for the first year of reporting. Using these emission
factors for each plant together with production rates for previous years, historical emissions
have been calculated. Cd is reported from one plant for the years after 1992. The calculations
for Pb and Cd have been corrected for dust regulations, while emissions of mercury are not
affected by these regulations.
Historical emissions of Cu, Cr and As are based on dust emissions for each plant. This has been
recommended by the Norwegian Environment Agency, since historical production rate data lack
for some years and because changes in emissions will be easier to find when installation of dust
control systems reduces the emissions of these metals. Emissions of As are reported to the
Norwegian Environment Agency from one plant. Reported figures exist since 1992, and
emissions in 1990 and 1991 are assumed to be the same as reported figures in 1992.
Emission figures for Cu, Cr and Pb are annually reported for all the three plants. In 1999, the
plants also reported Hg and Cd due to a heavy metal investigation under the leadership of the
Norwegian Environment Agency. After 1999, the plants have not been required to report these
metals due to low emissions. Still, one of the plants have reported Cd and Hg figures for all
following years, whereas another has reported only Cd; for this plant the 1999 figure for Hg has
been used for all later years. For the plant which now has been closed down, the 1999 figures
for both Cd and Hg have been used for all later years when the plant still was operating.

IIR 2017
138
POPs
Emission figures for PAH are reported from the plants to the Norwegian Environment Agency.
Two of the plants have reported emissions since 1991, while the third one has only reported
since 1997. Historical emissions back to 1990 have been calculated based on production rates
and an emission factor derived from the first year of reporting and production rate for that year.
No PAH profile is available for this source, so lacking of other information, the same profile as
for aluminium production is used (Table 4.7). No emissions of dioxins are reported or calculated.
Table 4.7. Distribution of PAH emissions from silicon carbide production. Ratio X1/PAH
Component Distribution of PAH emissions (ratio)
PAH (Norwegian standard) 1 PAH-4 (CLRTAP) 0.15
1 X is either PAH, PAH-6 or PAH-4.
Source: Finstad et al. (2001)
Table 4.8. Distribution of PAH-4 emissions from silicon carbide production. Share of PAH-4
Component Distribution of PAH emissions (ratio)
benzo(a)pyrene 0.2 benzo(b)fluoranthene 0.45 benzo(k)fluoranthene 0.25 indeno(1,2,3-cd)pyrene 0.1
Source: Norwegian Environment Agency (2016): Expert judgement, Oslo, Norway
Activity data
The activity data used by the plants for the calculation of SO2 emissions is the consumption of
petrol coke in dry weight. The activity data used by Statistics Norway for the calculation of CO
emissions is the consumption of petrol coke reported to Statistics Norway. Historical
calculations of particle emissions are based on annual production rates and dust emission
figures reported to the Norwegian Environment Agency.
Emission factors
CO
CO emissions are calculated from the consumption of petrol coke, using a factor of 0.4 tonnes
CO/tonnes petrol coke, as recommended by Rosland (1987).
NMVOC
From 2007 and onwards, the emission factor is based on measurements made once a year. The
emission factors for 2007 are 10.906 tonne NMVOC/kilotonne Sic for one of the plants in
operation and 10.84 tonne NMVOC/kilotonne Sic for the other. For previous years, the emission
factor for the latter plant has been more or less constant whereas the emission factor for the
first plant varies.
Uncertainties
Uncertainty estimates for long-range transboundary air pollutants are given in Appendix C.
Heavy metals
The historical calculations for heavy metals are based on derived emission factors for each plant

IIR 2017
139
and either production or dust data for previous years, and can only be seen as estimates. The
emission figures reported also vary from one year to another, and this is assumed to be, in
addition to differences in raw materials, a result of few and uncertain measurements. For the
one plant that has not reported emission figures for Hg and Cd since 1999, the same emission
figures as those reported in 1999 are used for later years. For the other plant, emissions of Cd
have been reported for all years since 1992. Emission figures for Hg have not been reported
since 1999. The emission figure for 1999 is used for later years. This is also highly uncertain, but
the emission figures are very small and have only marginal impact on the total emissions of
these metals.
Particles The particle size distribution used is not specific for production of silicon carbide, but used due
to lack of specific size distribution data for this source. The particle size distribution can
therefore only be seen as an estimate. For the years where reported emission figures do not
exist, Statistics Norway has assumed that emissions are in the same order as the first year of
reporting. This is uncertain and a result of lack of better data.
Completeness
Major missing emission components are not likely.
Production of calcium carbide
NFR 2B5
Last update: 10.01.17
Description
One plant in Norway was producing calcium carbide until 2003. The production of calcium
carbide generates CO2 emissions when limestone is heated and when petrol coke is used as a
reducing agent. The process can be described through the following equations:
(4.3) CaCO3 CaO + CO2
which takes place when limestone (calcium carbonate) is heated.
and
(4.4) CaO + C (petrol coke) CaC2 + CO
(4.5) CO 2O CO2
where petrol coke is used as a reducing agent to reduce the CaO to calcium carbide.
Some of the carbon from petrol coke will be sequestered in the product, but not permanently.
Thus, this carbon is included in the emission estimate. NMVOC originates from the use of petrol
coke in the production process, and NOX is mainly produced during the high temperature
oxidation of nitrogen in the air. Particles are also emitted during the production process.
Emission of heavy metals is a result of the heavy metal content in the raw materials.
Method
NOX

IIR 2017
140
Emission figures for NOX were annually reported to the Norwegian Environment Agency. The
reported values are based on calculations.
NMVOC
Reported figures were annually reported to the Norwegian Environment Agency, based on
calculations.
Particles
Emission figures for particles were reported from 1992. Figures for 1990 and 1991 are assumed
to be the same as for 1992. It does not exist any detailed information about the particle size
distribution of the emissions from calcium carbide production. The Norwegian Environment
Agency assumes that the emissions are in the same order as emission of particles from
production of ferroalloys, where all particles are expected to be smaller than PM2.5. This is
however an uncertain estimate. A particle size distribution where PM10 and PM2.5 is expected to
be the same as TSP, is used in the Norwegian Inventory.
BC
Emissions are estimated from a share of PM2.5 emissions. Tier 1 emission factor for BC applicable
for ‘general’ chemical industry is used, EEA (2013). BC=1,8 per cent of PM2.5.
Heavy metals and POPs
Emission figures for heavy metals were reported to the Norwegian Environment Agency from
1999. Historical emissions are calculated based on production rates for Pb, Cd and Hg, and
based on particle emissions for As, Cu and Cr.
No emission figures for PAHs (benzo(a)pyrene, benzo(b)fluoranthene, benzo(k)fluoranthene and
indeno(1,2,3-cd)pyrene) or dioxins are available.
Activity data
Particle emissions used in the calculations of As, Cu and Cr have been reported to the Norwegian
Environment Agency.
Uncertainties
Uncertainty estimates for long-range transboundary air pollutants are given in Appendix C.
Heavy metals
Historical emissions are based on a derived emission factor for the first year of reporting (1999)
and calculated with production/particle emission figures for previous years. This is uncertain and
only an estimate in lack of other data.
Particles
The particle size distribution used is not specific for production of calcium carbide, but used due
to lack of specific size distribution data for this source. The particle size distribution can
therefore only be seen as an estimate. For the years where reported emission figures do not
exist, Statistics Norway has assumed that emissions are in the same order of magnitude as for

IIR 2017
141
the first year of reporting. This is uncertain and a result of lack of better data.
Completeness
Major missing emission components are not likely.
Production of titanium dioxide
NFR 2B6
Last update: 10.01.17
Description
One plant in Norway produces titanium dioxide. The ore is crushed and pulverized in mills. The
crushed raw material is separated in various steps. Ilmenite and the by-product magnetite are
cleaned during acid treatment and flotation. The ilmenite concentrate is drained and the water
content is reduced to approximately 3.5 per cent. Emissions of SO2, heavy metals and particles
from the plant are included in the inventory. The particle emissions are a result of the crushing
of the ore in the mills and from the annealing furnace, while the heavy metal emissions are due
to the metal content in the raw material used.
Another plant produces titanium dioxide slag and also pig iron as a by-product. The raw material
is the mineral ilmenite, and coal is used as a reducing agent. SO2 originates from the sulphur in
the reducing agent used, while NOX is produced primarily by the high temperature oxidation of
nitrogen in the air. Heavy metal emissions are due to the metallurgical melting process and the
content of heavy metals in the raw materials used.
Method
SO2
The emission figures for SO2 are based on calculations and are reported annually to the
Norwegian Environment Agency.
NOX
The emission figures for NOX for the plant producing titanium dioxide slag are estimated and
reported to the Norwegian Environment Agency.
Particles
Since 1990, emissions of particles have been reported annually to the Norwegian Environment
Agency. The particles are assumed to be of a size less than PM2.5.
BC
Emissions are estimated from a share of PM2.5 emissions. Tier 1 emission factor for BC applicable
for ‘general’ chemical industry is used, EEA (2013). BC=1,8 per cent of PM2.5.
Heavy metals and POPs
Both plants report emission figures to the Norwegian Environment Agency.
One plant reported emission figures for Pb, Cd and Hg for the period 1990 to 1999. After 1999,
there has not been any reporting, as a result of very small emission figures. No emissions of

IIR 2017
142
persistent organic pollutants are reported or calculated.
The other plant reports emission figures for Pb, Cd, Cr, Cu, As and Hg. Emissions exist from 1990,
1992 or later, depending on type of heavy metal. For dioxins and PAH, reported figures have
only been available from 1999. In lack of production rate data for previous years, it has been
assumed that yearly emissions are the same as in the first year of reporting. PCB emissions have
been measured and reported since 2006. Emissions from 1990 to 2006 are based on reported
emissions from 2006. Emission figures for PAH are reported from the plant to the Norwegian
Environment Agency. No PAH profile is available for this source. The Norwegian Environment
Agency suggests a distribution of the emissions where PAH-4 is 15 per cent of reported PAH
emissions. Emissions of benzo(a)pyrene, benzo(b)fluoranthene, benzo(k)fluoranthene and
indeno(1,2,3-cd)pyrene are estimated using the same PAH-profile as for aluminium production.
Uncertainties
Heavy metals and POPs
Reported emission figures vary from one year to another, partly due to differences in raw
materials, but mainly as a result of uncertain measurements. The reported figures are based on
a limited number of measurements, and the emissions will vary from minute to minute, since
the production of pig-iron is a non-continuous process. For the years where reported emission
figures do not exist, Statistics Norway has assumed that emissions are in the same order as the
first year of reporting. This is uncertain and a result of lack of better data.
Particles
The particle size distribution used is only an assumption, and we can not preclude that the
distribution is different from the one used in the inventory.
Completeness
Major missing emission components are not likely.
Source specific QA/QC
There is no source specific QA/QC procedure for this sector. See section 1.6 for the description
of the general QA/QC procedure.
Production of methanol
NFR 2B10A
Last update: 22.12.16
Description
One plant in Norway produces methanol. Natural gas and oxygen are used in the production of
methanol. The conversion from the raw materials to methanol is done in various steps and on
different locations at the plant. NMVOC are emitted during the production process. Emissions
from flaring of natural gas in connection with production of methanol are now reported under
2B10A, as recommended by UNFCCC’s expert review team.
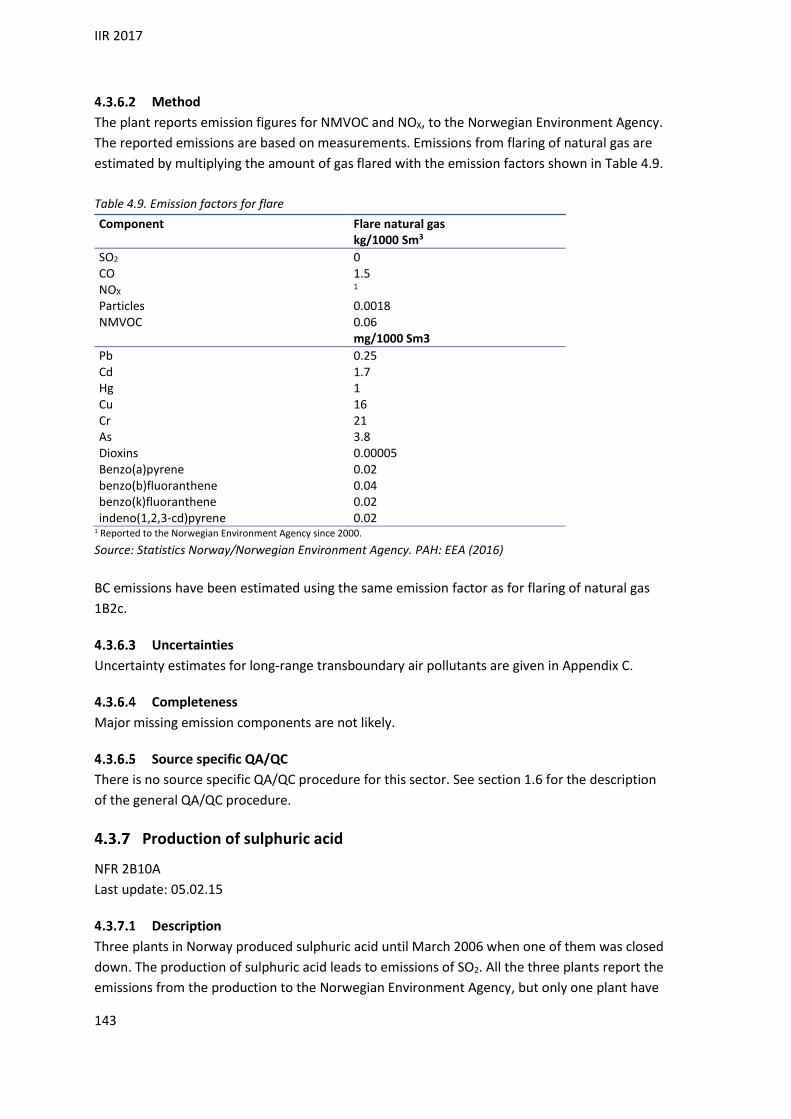
IIR 2017
143
Method
The plant reports emission figures for NMVOC and NOX, to the Norwegian Environment Agency.
The reported emissions are based on measurements. Emissions from flaring of natural gas are
estimated by multiplying the amount of gas flared with the emission factors shown in Table 4.9.
Table 4.9. Emission factors for flare
Component Flare natural gas kg/1000 Sm3
SO2 0 CO 1.5 NOX 1 Particles 0.0018
NMVOC 0.06 mg/1000 Sm3
Pb 0.25 Cd 1.7 Hg 1 Cu 16 Cr 21 As 3.8 Dioxins 0.00005 Benzo(a)pyrene 0.02 benzo(b)fluoranthene 0.04 benzo(k)fluoranthene 0.02 indeno(1,2,3-cd)pyrene 0.02
1 Reported to the Norwegian Environment Agency since 2000.
Source: Statistics Norway/Norwegian Environment Agency. PAH: EEA (2016)
BC emissions have been estimated using the same emission factor as for flaring of natural gas
1B2c.
Uncertainties
Uncertainty estimates for long-range transboundary air pollutants are given in Appendix C.
Completeness
Major missing emission components are not likely.
Source specific QA/QC
There is no source specific QA/QC procedure for this sector. See section 1.6 for the description
of the general QA/QC procedure.
Production of sulphuric acid
NFR 2B10A
Last update: 05.02.15
Description
Three plants in Norway produced sulphuric acid until March 2006 when one of them was closed
down. The production of sulphuric acid leads to emissions of SO2. All the three plants report the
emissions from the production to the Norwegian Environment Agency, but only one plant have
IIR 2017
144
specified that the emissions come from the production of sulphuric acid. For the two other
plants, the emissions have been included in the reported emissions from the plants' main
production (production of nickel and zinc, respectively).
Method
The plant reports annually emission figures for SO2 to the Norwegian Environment Agency. The
reported figures are based on measurements.
Uncertainties
No source specific uncertainty is known.
Completeness
Major missing emission components are not likely.
Source specific QA/QC
There is no source specific QA/QC procedure for this sector. See section 1.6 for the description
of the general QA/QC procedure.
Production of plastic
NFR 2B10A Last update: 10.01.17
Description
Three plants report emissions to the Norwegian Environment Agency under this source
category. One of the plants produces ethylene, one propylene and polyethylene, and the third
plant has vinyl chloride production. Two of the reporting plants were merged up to 2001.
Various components are emitted during the production of plastic. NMVOC emissions are from
leakages in the process.
During the production process of ethylene and vinyl chloride there is an oxide chloride step for
production of ethylene chloride, followed by cracking to vinyl chloride monomer and
hydrochloric acid. Various chloride components are produced during these processes, including
dioxins. However, most of the dioxins end up in the EDC-tar, which is combusted in an own
chloride recycling installation. Particles (PVC-dust) are also emitted during the production of
vinyl chloride.
Emissions from flaring of fuel gas in connection with production of plastic are now reported
under 2B10a.
Method
NH3 and NMVOC
Emission figures are annually reported to the Norwegian Environment Agency. Reported
NMVOC emissions are based on measurements. The emissions of NH3 are regarded as equal to
use. As some of the ammonia is stored in the product, the emissions are probably somewhat
overestimated.

IIR 2017
145
Particles
Emission figures have been reported to the Norwegian Environment Agency since 1992.
Emission figures for 1991 and 1990 are assumed to be the same as reported figures in 1992. The
particle emissions have decreased since 1996 as a result of installation of cleaning devices. The
emissions are purified in cyclones, but there is no available information regarding particle size.
In lack of plant specific information, the distribution TSP=PM10=PM2.5, as in TNO (Institute of
environmental and energy technology 2002), is used in the calculation.
BC
Emissions are estimated from a share of PM2.5 emissions. Tier 1 emission factor for BC applicable
for ‘general’ chemical industry is used, EEA (2013). BC=1,8 per cent of PM2.5.
Dioxins
The plant producing vinyl chloride reports dioxin emission figures. Figures are reported since
1990 except for 1992 and 1994. Emission figures for 1992 and 1994 are based on the reported
data for 1991 and 1993.
HCB
The plant producing vinyl chloride reports HCB emission figures since 1996. Emissions from 1990
to 1995 are based on the 1996 reported emissions.
PCB
PCB emissions have been reported since 2010. Emissions from 1990 to 2010 are based on the
2010 reported emissions.
Uncertainties
It is difficult to measure leakages of NMVOC and therefore the uncertainty is regarded as being
high.
The particle size distribution used is not specific for the plants, and the particles emitted might
therefore have another distribution than the one suggested by TNO.
Completeness
Major missing emission components are not likely.
Source specific QA/QC
There is no source specific QA/QC procedure for this sector. See section 1.6 for the description
of the general QA/QC procedure.
Production of explosives
NFR 2B10A
Last update: 05.02.15
Description
There has been one plant in Norway producing explosives, but the plant was closed down in
IIR 2017
146
2001. Nitric acid was used as a raw material in the manufacture of explosives, and during the
production of nitric acid, NOX was emitted.
Method
NOX
Emission figures were annually reported to the Norwegian Environment Agency, and the figures
were based on calculations.
Uncertainties
No source specific uncertainty is known.
Completeness
Particles
Reported emission figures to the Norwegian Environment Agency exist only for 1997-1999.
Annual emissions were so low that they have not been included in the Norwegian inventory.
Source specific QA/QC
There is no source specific QA/QC procedure for this sector. See section 1.6 for the description
of the general QA/QC procedure.
Chloralkali production
NFR 2B10A
Last update: 05.02.15
Description
One plant in Norway produced chloralkali until 2005. Before 1997, mercury was used in the
chloralkali production and emitted during the process. In 1997, the plant changed its production
process and stopped using mercury, but in the following years there were still some mercury
emissions.
Method
Hg
Emission figures were reported to the Norwegian Environment Agency.
Uncertainties
No source specific uncertainty is known.
Completeness
Major missing emission components are not likely.
Source specific QA/QC
There is no source specific QA/QC procedure for this sector. See section 1.6 for the description
of the general QA/QC procedure.
Production of pigments
NFR 2B10A

IIR 2017
147
Last update: 05.02.15
Description
Two plants are included in the inventory. One plant produces copper oxide for bottom paint and
emits copper to air during the production process. Emissions of Cd and Pb have been reported
since 2002. Emissions for 1990-2001 are set to be the same as the reported figure in 2002. Also
minor amounts of arsenic and chromium are emitted. The other plant produces zinc chromate,
and chromium is emitted.
Method
Emission figures are reported to the Norwegian Environment Agency.
Uncertainties
Reported emission figures for 1990 and 1991 for the plant producing zinc chromate are not
occurring. In the inventory, the same figure as reported for 1992 is used for 1990 and 1991.
Completeness
Major missing emission components are not likely.
Source specific QA/QC
There is no source specific QA/QC procedure for this sector. See section 1.6 for the description
of the general QA/QC procedure.
Production of soap
NFR 2B10A
Last update: 10.01.17
Method
Two plants producing soap have reported emission figures for particles to the Norwegian
Environment Agency. One of the plants has only reported for 1990 and 1991. The plant has after
1991 had a temporary permission without reporting requirements and is therefore not included
after 1991 due to lack of data. The other plant reported figures for 1992-1994. Emissions for
1990 and 1991 are assumed to be the same as reported figure in 1992, while emissions for
1995-1997 are assumed to be the same as reported figure in 1994. Annual emission figures are
low.
The particles have been purified through filters and scrubbers and the Norwegian Environment
Agency assumes the sizes of the particles are smaller than PM2.5. BC emissions are estimated
from a share of PM2.5 emissions. Tier 1 emission factor for BC applicable for ‘general’ chemical
industry is used, EEA (2016). BC=1,8 per cent of PM2.5.
Uncertainties
For the years where reported emission figures do not exist, Statistics Norway has assumed that
emissions are in the same order as reported in one of the other years. This is uncertain and a
result of lack of better data.

IIR 2017
148
Completeness
Major missing emission components are not likely.
Source specific QA/QC
There is no source specific QA/QC procedure for this sector. See section 1.6 for the description
of the general QA/QC procedure.
Paint and varnish production
NFR 2B10A
Last update: 10.01.17
Method
One plant producing paint has reported emission figures for particles to the Norwegian
Environment Agency since 1995, after first getting an emission permit in 1994. Annual emissions
are small. It is assumed by the Norwegian Environment Agency that the particles emitted are
smaller than PM2.5. BC emissions are estimated from a share of PM2.5 emissions. Tier 1 emission
factor for BC applicable for ‘general’ chemical industry is used, EEA (2016). BC=1,8 per cent of
PM2.5.
Uncertainties
No source specific uncertainty is known.
Completeness
Major missing emission components are not likely.
Source specific QA/QC
There is no source specific QA/QC procedure for this sector. See section 1.6 for the description
of the general QA/QC procedure QA/QC procedure
4.4 Metal production
NFR 2C
Last update: 10.01.17
Metal production in Norway includes plants producing iron and steel, ferroalloys, aluminium,
nickel and zinc and also magnesium until spring 2006. Production of anodes is also included in
this chapter. As shown in Table 4.10, most of the figures in the national inventory are from the
plants’ annual reports to the Norwegian Environment Agency.
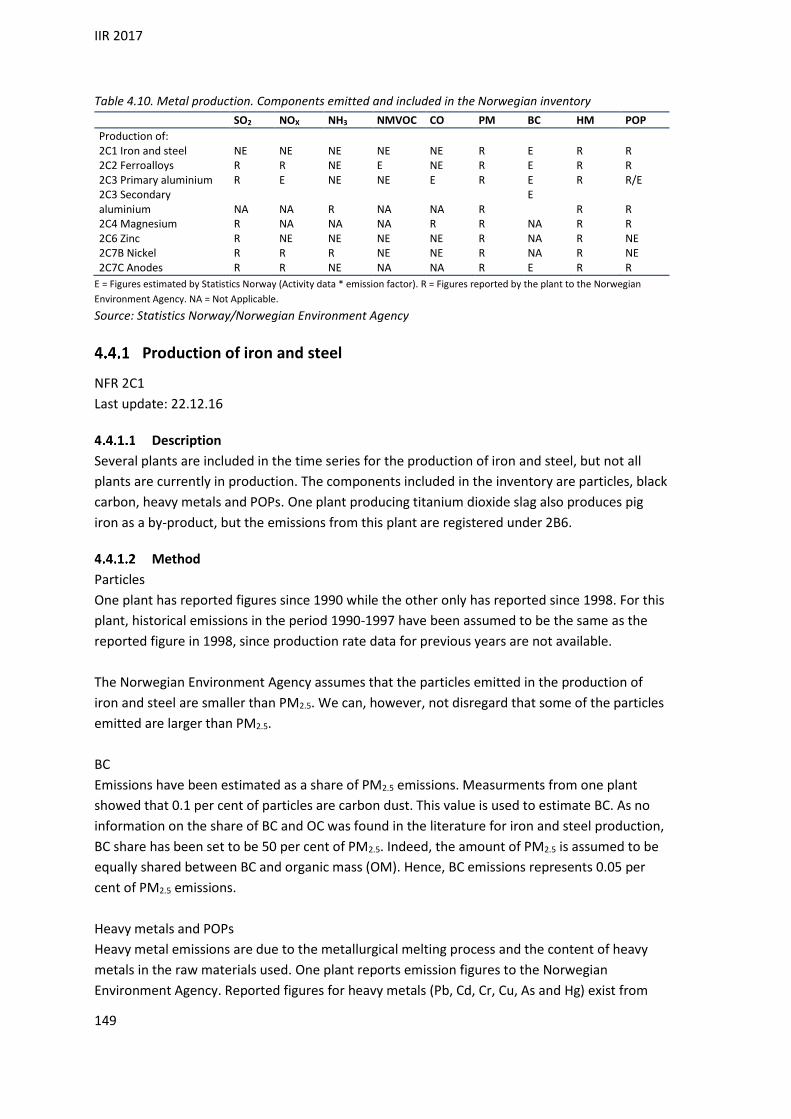
IIR 2017
149
Table 4.10. Metal production. Components emitted and included in the Norwegian inventory
SO2 NOX NH3 NMVOC CO PM BC HM POP
Production of: 2C1 Iron and steel NE NE NE NE NE R E R R 2C2 Ferroalloys R R NE E NE R E R R 2C3 Primary aluminium R E NE NE E R E R R/E 2C3 Secondary aluminium NA NA R NA NA R
E R R
2C4 Magnesium R NA NA NA R R NA R R 2C6 Zinc R NE NE NE NE R NA R NE 2C7B Nickel R R R NE NE R NA R NE 2C7C Anodes R R NE NA NA R E R R
E = Figures estimated by Statistics Norway (Activity data * emission factor). R = Figures reported by the plant to the Norwegian
Environment Agency. NA = Not Applicable.
Source: Statistics Norway/Norwegian Environment Agency
Production of iron and steel
NFR 2C1
Last update: 22.12.16
Description
Several plants are included in the time series for the production of iron and steel, but not all
plants are currently in production. The components included in the inventory are particles, black
carbon, heavy metals and POPs. One plant producing titanium dioxide slag also produces pig
iron as a by-product, but the emissions from this plant are registered under 2B6.
Method
Particles
One plant has reported figures since 1990 while the other only has reported since 1998. For this
plant, historical emissions in the period 1990-1997 have been assumed to be the same as the
reported figure in 1998, since production rate data for previous years are not available.
The Norwegian Environment Agency assumes that the particles emitted in the production of
iron and steel are smaller than PM2.5. We can, however, not disregard that some of the particles
emitted are larger than PM2.5.
BC
Emissions have been estimated as a share of PM2.5 emissions. Measurments from one plant
showed that 0.1 per cent of particles are carbon dust. This value is used to estimate BC. As no
information on the share of BC and OC was found in the literature for iron and steel production,
BC share has been set to be 50 per cent of PM2.5. Indeed, the amount of PM2.5 is assumed to be
equally shared between BC and organic mass (OM). Hence, BC emissions represents 0.05 per
cent of PM2.5 emissions.
Heavy metals and POPs
Heavy metal emissions are due to the metallurgical melting process and the content of heavy
metals in the raw materials used. One plant reports emission figures to the Norwegian
Environment Agency. Reported figures for heavy metals (Pb, Cd, Cr, Cu, As and Hg) exist from
IIR 2017
150
1990, 1992 or later, depending on type of heavy metal. For dioxins and PAH, reported figures
have only been available from 1997 and 1999. Diffuse emissions have been included from one
plant. In lack of production rate data for previous years, it has been assumed that yearly
emissions are the same as in the first year of reporting.
Plants reports HCB emissions to the Norwegian Enironment Agency since 2011. Emissions for
the previous years have been estimated using the emission factor from the EMEP inventory
guidebook (EEA 2013) and the crude steel production.
Plants reported PCB emissions in 2010. Emissions for the other years have been estimated using
the data reported in 2010.
Uncertainties
Uncertainty estimates for long-range transboundary air pollutants are given in Appendix C.
Heavy metals and POPs
Reported emission figures vary from one year to another, partly due to differences in raw
materials, but mainly as a result of uncertain measurements. The reported figures are based on
a limited number of measurements, and the emissions will vary from minute to minute, since
the production of iron and steel is a non-continuous process. For the years where reported
emission figures do not exist, Statistics Norway has assumed that emissions are in the same
order as the first year of reporting. This is uncertain and a result of lack of better data.
Particles
The particle size distribution used is only an assumption, and we can not preclude that the
distribution is different from the one used in the inventory. For the years where reported
emission figures do not exist, Statistics Norway has assumed that emissions are in the same
order of magnitude as for the first year of reporting. This is an uncertain estimate due to lack of
better data.
Completeness
Major missing emission components are not likely.
Source specific QA/QC
Annually reported emission figures are first controlled by the Norwegian Environment Agency
and then by Statistics Norway.
Adjustments and recalculations have been done for years where reported emission figures seem
to be unreasonably high or low compared with previous years. This is applicable when the
variations in the reported emission figures do not have a natural explanation.
Production of ferroalloys
NFR 2C2
Last update: 22.12.16

IIR 2017
151
Description
There were 12 plants producing ferroalloys in Norway in 2014. One plant closed down in 2001,
two plants were closed down during 2003 and two in 2006. One plant was out of production in
2006, but started up again in 2007.
Ferrosilicon, silicon metal, ferromanganese and silicon manganese are now produced in Norway.
Ferrochromium was produced until summer in 2001. Ferrosilicon with 65 to 96 per cent Si and
silicon metal with 98-99 per cent Si is produced. The raw material for silicon is quarts (SiO2). SiO2
is reduced to Si and CO using reducing agents like coal, coke and charcoal.
(4.6) SiO2 SiO Si + CO
The waste gas CO and some SiO burns to form CO2 and SiO2 (silica dust).
Some of the CO generated from coal is sold for energy use to other industries. The amount of
CO gas sold is hence subtracted from the emissions reported under this category and included in
energy use in manufacturing industries and construction (NFR 1A2).
In ferroalloy production, raw ore, carbon materials and slag forming materials are mixed and
heated to high temperatures for reduction and smelting. The carbon materials used are coal,
coke and some biocarbon (charcoal and wood). Electric submerged arc furnaces with graphite
electrodes or consumable Soederberg electrodes are used. The heat is produced by the electric
arcs and by the resistance in the charge materials. The furnaces used in Norway are open, semi-
covered or covered.
The CO stems from the production process. In open or semi-closed furnaces the CO reacts with
air and forms CO2 before it is emitted. This is due to high temperature and access to air in the
process. In a closed furnace the CO does not develop to CO2 as there is no access to air (oxygen)
in the process. The waste gas is then led from the furnace and used as an energy source or
flared, and is reported under the relevant energy sectors. The technical specification of the
furnaces is irrelevant since emissions are calculated using a mass balance or calculated by
multiplying the amount of reducing agents in dry weight with country specific emission factors
Several components are emitted from production of ferroalloys. SO2 originates from the sulphur
in the reducing agent used, while NOX is produced primarily by the high temperature oxidation
of nitrogen in the air. NMVOC emissions originate from the use of coal and coke in the
production processes by producing ferrosilicon and silicon metal. Heavy metals are emitted from
the raw materials (ore) during the metallurgical process, and the particles emitted are mainly
silica dust generated during the production process.
Method
SO2
Each plant annually reports emission figures to the Norwegian Environment Agency. Some of
the sulphur is trapped in the product. For production of ferromanganese and silicon manganese,
98-99 per cent of the sulphur is trapped, while for other ferroalloys it is assumed that about 5

IIR 2017
152
per cent is trapped. The emissions are calculated from the consumption of reducing agents and
electrodes and the content of sulphur in the materials.
NOX
Emissions of NOX originate from production of ferrosilicon and silicon metal. Ferromanganese,
ferrochrome and silicomanganese do not have significant emissions of NOX. Emission figures are
annually reported by each plant to the Norwegian Environment Agency. The reported emissions
are calculated either from the production of metal and metal specific emission factors, see Table
4.13, or on the basis of continuous measurements.
NMVOC
The emissions are estimated by Statistics Norway from the consumption of reducing agents and
an emission factor.
Particles
All plants producing ferroalloys report emission figures to the Norwegian Environment Agency.
Some have reported since 1990, others since 1992. For plants reported since 1992, emission
figures from 1990 and 1991 have been assumed to be the same as reported figures in 1992.
According to the ferroalloy industry, particles emitted are smaller than PM2.5 (Eikeland,
pers.comm.8). This is, however, an assumption, and we can not preclude that some of the
particles might be larger than PM2.5. In the inventory, we have decided to use this distribution
for all particles emitted from the production of ferroalloys. This means that TSP=PM10= PM2.5.
BC
Emissions have been estimated as a share of PM2.5 emissions. Measurments of particles
composition from several plants were used to estimate the dust carbon content. This value was
used to estimate BC. As no information on the share of BC and OC was found in the literature for
ferroalloys production, BC share has been set to be 50 per cent of PM2.5. Indeed, the amount of
PM2.5 is assumed to be equally shared between BC and organic mass (OM).
Heavy metals
Emission figures for heavy metals are reported from all plants producing ferroalloys after the
Norwegian Environment Agency in 1999 imposed larger metallurgical plants to map their
emissions of heavy metals. Most plants have therefore reported figures to the Norwegian
Environment Agency since 1999, but some reported for the first time in 2000 and 2001. An
emission factor has been derived for each plant, based on the emission figure and production
rate for the first year of reporting. These emission factors have been used together with
production rates for each year to calculate the emissions back to 1990 for each plant.
Dioxins
All plants producing ferrosilicon report emission figures for dioxins to the Norwegian
8 Eikeland (2002): Personal information, e-mail dated 29/05 2002. [email protected]
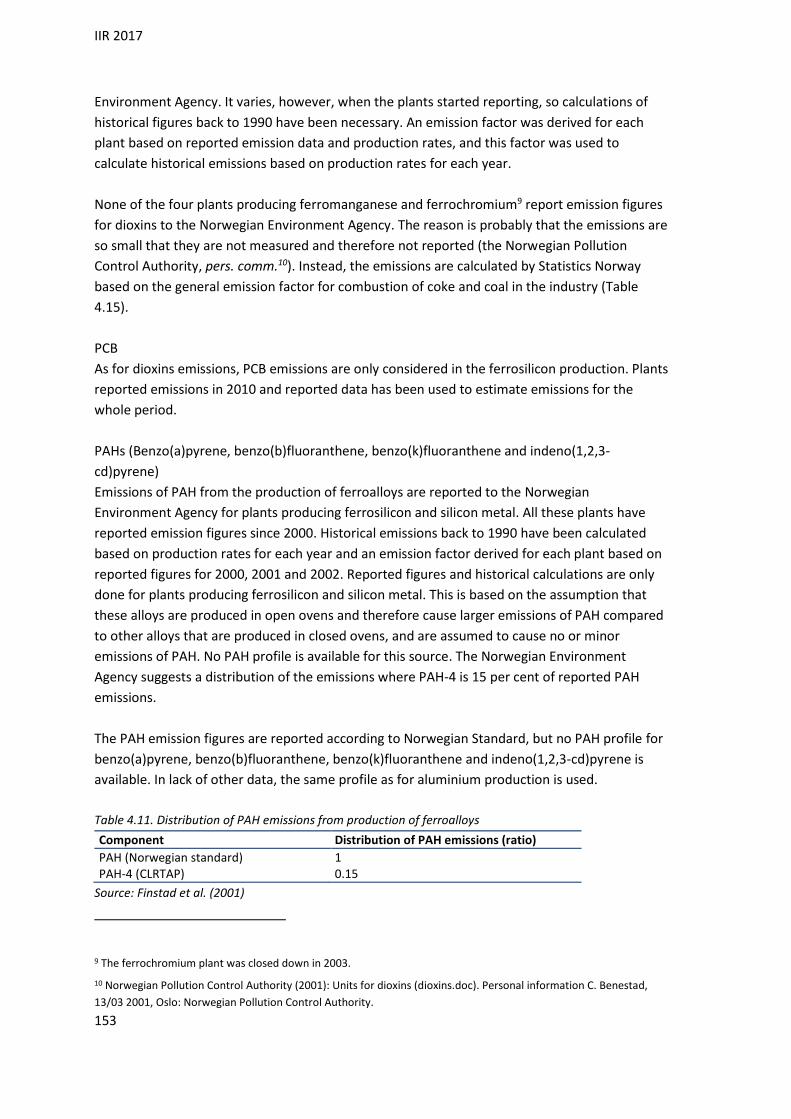
IIR 2017
153
Environment Agency. It varies, however, when the plants started reporting, so calculations of
historical figures back to 1990 have been necessary. An emission factor was derived for each
plant based on reported emission data and production rates, and this factor was used to
calculate historical emissions based on production rates for each year.
None of the four plants producing ferromanganese and ferrochromium9 report emission figures
for dioxins to the Norwegian Environment Agency. The reason is probably that the emissions are
so small that they are not measured and therefore not reported (the Norwegian Pollution
Control Authority, pers. comm.10). Instead, the emissions are calculated by Statistics Norway
based on the general emission factor for combustion of coke and coal in the industry (Table
4.15).
PCB
As for dioxins emissions, PCB emissions are only considered in the ferrosilicon production. Plants
reported emissions in 2010 and reported data has been used to estimate emissions for the
whole period.
PAHs (Benzo(a)pyrene, benzo(b)fluoranthene, benzo(k)fluoranthene and indeno(1,2,3-
cd)pyrene)
Emissions of PAH from the production of ferroalloys are reported to the Norwegian
Environment Agency for plants producing ferrosilicon and silicon metal. All these plants have
reported emission figures since 2000. Historical emissions back to 1990 have been calculated
based on production rates for each year and an emission factor derived for each plant based on
reported figures for 2000, 2001 and 2002. Reported figures and historical calculations are only
done for plants producing ferrosilicon and silicon metal. This is based on the assumption that
these alloys are produced in open ovens and therefore cause larger emissions of PAH compared
to other alloys that are produced in closed ovens, and are assumed to cause no or minor
emissions of PAH. No PAH profile is available for this source. The Norwegian Environment
Agency suggests a distribution of the emissions where PAH-4 is 15 per cent of reported PAH
emissions.
The PAH emission figures are reported according to Norwegian Standard, but no PAH profile for
benzo(a)pyrene, benzo(b)fluoranthene, benzo(k)fluoranthene and indeno(1,2,3-cd)pyrene is
available. In lack of other data, the same profile as for aluminium production is used.
Table 4.11. Distribution of PAH emissions from production of ferroalloys
Component Distribution of PAH emissions (ratio)
PAH (Norwegian standard) 1 PAH-4 (CLRTAP) 0.15
Source: Finstad et al. (2001)
9 The ferrochromium plant was closed down in 2003.
10 Norwegian Pollution Control Authority (2001): Units for dioxins (dioxins.doc). Personal information C. Benestad,
13/03 2001, Oslo: Norwegian Pollution Control Authority.
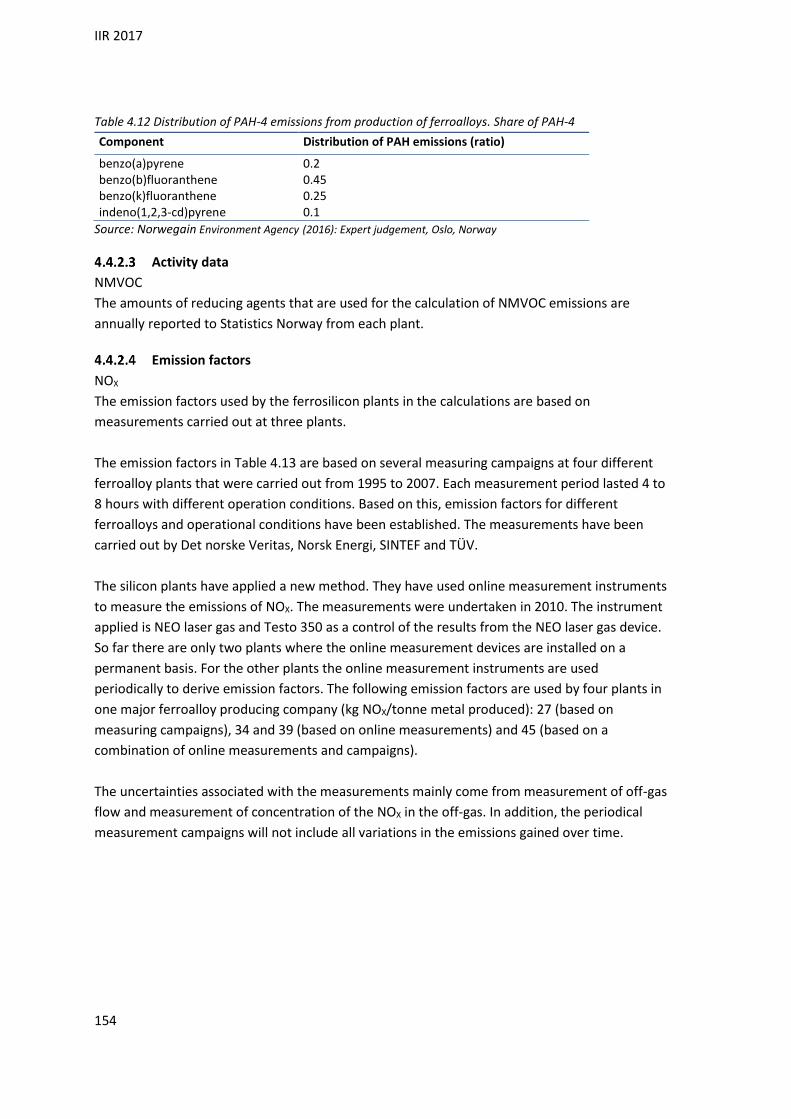
IIR 2017
154
Table 4.12 Distribution of PAH-4 emissions from production of ferroalloys. Share of PAH-4
Component Distribution of PAH emissions (ratio)
benzo(a)pyrene 0.2 benzo(b)fluoranthene 0.45 benzo(k)fluoranthene 0.25 indeno(1,2,3-cd)pyrene 0.1
Source: Norwegain Environment Agency (2016): Expert judgement, Oslo, Norway
Activity data
NMVOC
The amounts of reducing agents that are used for the calculation of NMVOC emissions are
annually reported to Statistics Norway from each plant.
Emission factors
NOX
The emission factors used by the ferrosilicon plants in the calculations are based on
measurements carried out at three plants.
The emission factors in Table 4.13 are based on several measuring campaigns at four different
ferroalloy plants that were carried out from 1995 to 2007. Each measurement period lasted 4 to
8 hours with different operation conditions. Based on this, emission factors for different
ferroalloys and operational conditions have been established. The measurements have been
carried out by Det norske Veritas, Norsk Energi, SINTEF and TÜV.
The silicon plants have applied a new method. They have used online measurement instruments
to measure the emissions of NOX. The measurements were undertaken in 2010. The instrument
applied is NEO laser gas and Testo 350 as a control of the results from the NEO laser gas device.
So far there are only two plants where the online measurement devices are installed on a
permanent basis. For the other plants the online measurement instruments are used
periodically to derive emission factors. The following emission factors are used by four plants in
one major ferroalloy producing company (kg NOX/tonne metal produced): 27 (based on
measuring campaigns), 34 and 39 (based on online measurements) and 45 (based on a
combination of online measurements and campaigns).
The uncertainties associated with the measurements mainly come from measurement of off-gas
flow and measurement of concentration of the NOX in the off-gas. In addition, the periodical
measurement campaigns will not include all variations in the emissions gained over time.

IIR 2017
155
Table 4.13. NOX emission factors for production of ferrosilicon. Kg NOX /tonne metal produced
Normal operations
Dryss -chargering
Dryss- chargering > 750 °C
Source
Ferrosilicon 75 per cent
15.3 7.0 8.3 Measured in 1995 at Rana Metal and the Thamshavn plant 2005
Ferrosilicon 65 per cent
6.0 4.0 5.0 Estimations 1
1 Estimations means that this emission factor is not measured but estimated by the plants based on general process experiences.
NMVOC
Statistics Norway uses an emission factor of 1.7 kg NMVOC/tonne coal or coke (EPA 1986) in the
calculations.
BC
BC is assumed to be 50 per cent of the particles carbon content. Hence, BC emissions represents
3.5 per cent of PM2.5 emissions from ferro-manganese production and 0.23 per cent of PM2.5
from ferro-silicon production.
Dioxins
The emission factors used by the plants in the calculations are given in Table 4.14.
Table 4.14. Emission factors for production of ferroalloys. μg dioxin/tonne metal produced
Normal operations
Dryss -chargering
Dryss- chargering > 750 °C
Source
Silicon metal 3 1.2 0.2 Measured in 1995 at the Fiskaa plant Ferrosilicon 90 per cent 4 1.2 0.2 Estimations1 Ferrosilicon 75 per cent 5 1.2 0.2 Measured in 1995 at Rana Metall Ferrosilicon 65 per cent 5 1.2 0.2 Estimations Si96 3 1.2 0.2 Estimations
1 Estimations means that this emission factor is not measured but estimated by the plants based on general process experiences.
Emission calculations of dioxins for plants not reporting figures to the Norwegian Environment
Agency use an emission factor for combustion of coke and coal in the industry (Table 4.15).
Table 4.15. Emission factor used by Statistics Norway to calculate dioxin emissions from
production of ferro manganese/chromium
Emission factor
Coal and coke 1.6 µg/tonne
Source: Bremmer et al. (1994) and Finstad et al. (2002b)
PAH
The emission factors used by the plants in the calculations are given in Table 4.16.

IIR 2017
156
Table 4.16. Emission factors for production of ferroalloys. g PAH /tonne metal produced
Normal operations
Dryss -chargering
Dryss- chargering > 750 °C
Source
Silicon metal 3 2.6 1.6 Measured in 1995 at the Fiskaa plant Ferrosilicon 90 per cent 2 2 1 Estimations1 Ferrosilicon 75 per cent 1.5 1.3 0.8 Measured in 1995 at Rana Metal and
the Thamshavn plant Ferrosilicon 65 per cent 1 1.3 0.8 Estimations Si96 3 2.6 1.6 Estimations
1 Estimations means that this emission factor is not measured but estimated by the plants based on general process experiences.
Uncertainties
Uncertainty estimates for long-range transboundary air pollutants are given in Appendix C.
Particles
The inventory uses a particle size distribution which is an assumption from the ferroalloy
industry and not based on measurements. We can therefore not preclude that some of the
particles might be larger than PM2.5.
Heavy metals and POPs
Historical emissions are based on derived emission factors for the first year of reporting, and
calculated using production figures for previous years. This is uncertain since the calculation
method does not consider quality changes of the raw materials or changes in the production
profile at each plant that can have big impact on yearly emissions.
Source specific QA/QC
NOX, NMVOC and CO
The reported emission figures for NOX, NMVOC and CO are compared with calculations at
Statistics Norway.
Emission figures for NMVOC are controlled by multiplying the amount of reducing agents with
an emission factor recommended by EPA (1986).
PAH
PAH was first included in the Norwegian Inventory in 2000, and only two plants producing
ferrosilicon and silicon metal reported emission figures to the Norwegian Environment Agency
for the year 1999. In 2004, a specific emission factor for each plant was derived based on the
plants' reported emission figures for 2000, 2001 and 2002 and production volumes,. These
factors were then used to recalculate the plants' historical emissions of PAH. A specific emission
factor for each plant was considered better to use for historical emissions, instead of using a
default emission factor for all plants. The specific emission factors derived for each plant with
the new method were lower than those suggested by Benestad (pers. Comm.), and this caused
approximately 2-12 per cent lower yearly PAH emissions from 1990 to 1999 from this source.

IIR 2017
157
Production of primary aluminium
NFR 2C3
Last update: 10.01.17
Description
There are seven plants in Norway producing aluminium. Both prebaked anode and the
Soederberg production methods are used.
In the Soederberg technology, the anodes are baked in the electrolysis oven, while in the
prebaked technology the anodes are baked in a separate plant. In general, the emissions are
larger from the Soederberg technology than from the prebaked technology. There has been a
shift from Soederberg to prebaked technology. In 1990, 57 per cent of the aluminium
production in Norway was produced with prebaked technology and the share of aluminium
production from prebaked increased to 92 per cent in 2009. Two new plants with prebaked
technology were established in 2002 and two plants using Soederberg technology were closed
down in 2001 and 2003. Since 2007, three plants using Soederberg technology have been closed
down, one in 2007, one in 2008 and one in 2009. There is now only one plant left where
Soederberg technology is used.
Production of aluminium leads to emissions of various components, such as SO2, NOX, heavy
metals and persistent organic pollutants. The emission of SO2 are from the sulphur in the
reducing agents used. NOX is primarily produced by the high temperature oxidation of nitrogen
in the air. All plants also report emissions of particles, heavy metals and PAHs (benzo(a)pyrene,
benzo(b)fluoranthene, benzo(k)fluoranthene and indeno(1,2,3-cd)pyrene). Emissions of heavy
metals are due to the metal content in the raw materials used and the reducing agents.
Method
SO2
The plants report emission figures of SO2 to the Norwegian Environment Agency. The figures are
estimated by each plant based on the amounts of reducing agents used and their sulphur
content. All plants have installed flue gas treatment, like, for example, sea water scrubber.
NOX
NOX emissions are estimated by Statistics Norway from the level of production and an emission
factor derived from measurements at two Norwegian plants. The figure is rather uncertain.
CO
CO emissions are estimated by Statistics Norway from the level of production and an emission
factor from EEA 2016. 120 kg CO/tonn aluminium.
Particles
Emission figures have been reported to the Norwegian Environment Agency since 1990. The
Norwegian Environment Agency assumes that the particles emitted are smaller than PM10.
According to TNO (Institute of environmental and energy technology 2002), PM10 is 97 per cent

IIR 2017
158
of TSP, and PM2.5 is 43 per cent of TSP. The Norwegian inventory uses the particle size
distribution suggested by TNO (Institute of environmental and energy technology 2002).
BC
Emissions are estimated from a share of PM2.5 emissions. Tier 1 emission factor for BC applicable
for aluminium production is used, EEA (2016). BC=2.3 per cent of PM2.5.
Heavy metals
The plants report emission figures to the Norwegian Environment Agency. The first requirement
for reporting came in 1999, so emission figures before that are insufficient. The concentrations
of heavy metals in the air emissions are very low and therefore impossible to measure.
Emissions are therefore calculated at each plant, based on the mass flow.
Dioxins
Since the process uses coal and coke as reducing agents, it is assumed that production of
primary aluminium gives dioxin emissions. Reported figures for dioxins are not available. The
emissions are believed to be so small that reporting is not necessary. Emissions are therefore
calculated based on the combustion factor for coal in the industry.
HCB
Emissions are so small that primay aluminium plants do not report them. Hence, emissions have
been considered negligible and have not been estimated.
PAHs (benzo(a)pyrene, benzo(b)fluoranthene, benzo(k)fluoranthene and indeno(1,2,3-
cd)pyrene)
The reported emission data are assumed to be according to Norwegian standard (NS9815). It is
further assumed by the Norwegian Environment Agency that the emissions of PAH-4 accounts
for 5 -10 per cent of total PAH emissions reported from production of aluminium. Historical
emission figures have been calculated based on changes in production of aluminium after the
Soederberg method.
The PAH profile has been measured at three plants, in addition benzo(a)pyrene,
benzo(b)fluoranthene, benzo(k)fluoranthene and indeno(1,2,3-cd)pyrene have been measured
at some plants for the laste year Based on these profiles it is believed that PAH-4 accounts for
10 per cent of total PAH emissions from production of aluminium from one plant, 7.5 per cent is
used for the other. Emissions of benzo(a)pyrene, benzo(b)fluoranthene, benzo(k)fluoranthene
and indeno(1,2,3-cd)pyrene have been measured in 2016 and in 2001. Based om these
measurements a PAH-profile has been made by Hetland, the Norwegian Environment Agency
(pers. comm)11. The PAH-4 profile used for aluminium production is shown in Table 4.18.
11 Pers. comm, email from Øyvind Hetland, 22. Nov. 2015, Norwegian Environment Agency.

IIR 2017
159
Table 4.17. Distribution of PAH emissions from production of primary aluminium. Ratio
Component Distribution of PAH emissions (ratio)
PAH (Norwegian standard) 1 PAH-4 (CLRTAP) 0.05-0.1
Source: Statistics Norway/Norwegian Environment Agency
Table 4.18. Distribution of PAH-4 emissions from production of primary aluminium. Share of PAH-4
Component Distribution of PAH emissions (ratio)
benzo(a)pyrene 0.2 benzo(b)fluoranthene 0.45 benzo(k)fluoranthene 0.25 indeno(1,2,3-cd)pyrene 0.1
Source: Hetland (2016)
Activity data
NOX
The activity data for the NOX calculation are production figures, which are reported annually
from the plants to the Norwegian Environment Agency.
Dioxins
The calculation of emissions of dioxins is based on consumption of raw materials. The figures are
reported annually from the plants to Statistics Norway.
Emission factors
NOX
Statistics Norway uses the emission factor 0.00071 tonnes NOX/ tonne produced aluminium in
the calculations. This emission factor is assumed by the Norwegian Environment Agency and is
based on measurements.
Dioxins
Emissions of dioxins are calculated based on the consumption of coal and an emission factor
from Bremmer et al. (1994).
Table 4.19. Emission factor used to calculate dioxin emissions from aluminium production.
Emission factor Source
Coal and coke 1.6 µg/tonne Bremmer et al. (1994)
Uncertainties
Uncertainty estimates for long-range transboundary air pollutants are given in Appendix C.
Particles
The particle size distribution are not reported by the plants. Actual emissions are probably
somewhat different from those estimated with the size distribution from TNO (Institute of
environmental and energy technology 2002).
Completeness
Major missing emission components are not likely.

IIR 2017
160
Source specific QA/QC
PAH
In 2014, the Norwegian Environment Agency had audits at all aluminium plants. For the four
plants that have emisisons of PAH, their systems for monitoring emissions of PAH were checked.
Heavy metals
First requirement for reporting of heavy metals was given in 1999, and the reported figures
were that year based on concentration measurements. The concentration of heavy metals in the
air emissions are very low and therefore subject to high degree of uncertainty. The reported
emission figures showed large differences from plant to plant, also in the cases where the raw
materials came from the same supplier. The Norwegian Environment Agency has had a long
discussion with the aluminium industry to find a better method to estimate heavy metals from
aluminium production. In 2001 it was decided that reported figures should be based on
calculations. New calculations have shown that earlier calculations gave too high emissions of
heavy metals. It was therefore recommended by the Norwegian Environment Agency to
recalculate historical reported data based on the new calculation method. Recalculation of
historical data are normally based on production rate data, but due to very low emissions and
relative stable production rates, historical data are set to be the same as the first year of
reporting.
Production of secondary aluminium
NFR 2C3
Last update: 12.01.17
Description
One open mill in Norway is handling secondary aluminium production. Heavy metals and
persistent organic pollutants (dioxins and PAHs , (benzo(a)pyrene, benzo(b)fluoranthene,
benzo(k)fluoranthene and indeno(1,2,3-cd)pyrene)) are emitted in the production of secondary
aluminium due to the remelting process. Particles are also emitted during the production
process. For earlier years there have also been some emissions of NH3 and SF6 from another
plant which closed down in 2001.
Method
NH3
For the years 1993-2001, emissions of NH3 were reported from one plant. This plant closed
down in 2001.
Particles
The plant has reported emission figures to the Norwegian Environment Agency from 1993.
Emission figures for 1990 to 1992 are in the inventory assumed to be the same as the reported
figure in 1993. The following particle size distribution is assumed and used in the Norwegian
inventory; PM10 is 0.8*TSP and PM2.5 is 0.32*TSP (Institute of environmental and energy
technology 2002).
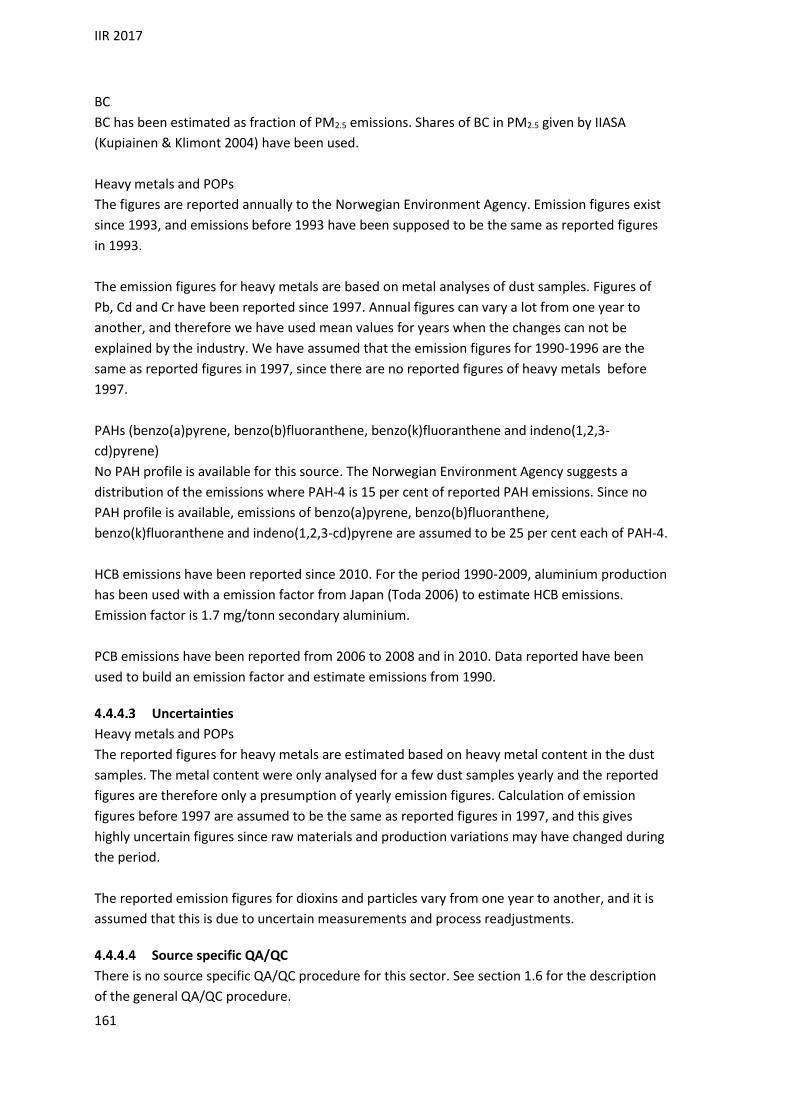
IIR 2017
161
BC
BC has been estimated as fraction of PM2.5 emissions. Shares of BC in PM2.5 given by IIASA
(Kupiainen & Klimont 2004) have been used.
Heavy metals and POPs
The figures are reported annually to the Norwegian Environment Agency. Emission figures exist
since 1993, and emissions before 1993 have been supposed to be the same as reported figures
in 1993.
The emission figures for heavy metals are based on metal analyses of dust samples. Figures of
Pb, Cd and Cr have been reported since 1997. Annual figures can vary a lot from one year to
another, and therefore we have used mean values for years when the changes can not be
explained by the industry. We have assumed that the emission figures for 1990-1996 are the
same as reported figures in 1997, since there are no reported figures of heavy metals before
1997.
PAHs (benzo(a)pyrene, benzo(b)fluoranthene, benzo(k)fluoranthene and indeno(1,2,3-
cd)pyrene)
No PAH profile is available for this source. The Norwegian Environment Agency suggests a
distribution of the emissions where PAH-4 is 15 per cent of reported PAH emissions. Since no
PAH profile is available, emissions of benzo(a)pyrene, benzo(b)fluoranthene,
benzo(k)fluoranthene and indeno(1,2,3-cd)pyrene are assumed to be 25 per cent each of PAH-4.
HCB emissions have been reported since 2010. For the period 1990-2009, aluminium production
has been used with a emission factor from Japan (Toda 2006) to estimate HCB emissions.
Emission factor is 1.7 mg/tonn secondary aluminium.
PCB emissions have been reported from 2006 to 2008 and in 2010. Data reported have been
used to build an emission factor and estimate emissions from 1990.
Uncertainties
Heavy metals and POPs
The reported figures for heavy metals are estimated based on heavy metal content in the dust
samples. The metal content were only analysed for a few dust samples yearly and the reported
figures are therefore only a presumption of yearly emission figures. Calculation of emission
figures before 1997 are assumed to be the same as reported figures in 1997, and this gives
highly uncertain figures since raw materials and production variations may have changed during
the period.
The reported emission figures for dioxins and particles vary from one year to another, and it is
assumed that this is due to uncertain measurements and process readjustments.
Source specific QA/QC
There is no source specific QA/QC procedure for this sector. See section 1.6 for the description
of the general QA/QC procedure.
IIR 2017
162
Production of magnesium
NFR 2C4
Last update: 16.09.15
Description
There has been one magnesium producing plant in Norway. The plant closed down the
production of primary magnesium in 2002, but the production of cast magnesium continued.
During 2006, the production of remelting Mg also stopped. From the mid-1970s, both the
magnesium chloride brine process and the chlorination process were used for magnesium
production. Since 1991, only the chlorination process was in use.
Production of magnesium leads to non-combustion CO emissions. During the calcination of
dolomite (MgCa(CO3)2) to magnesium oxide, CO2 is emitted. During the next step, magnesium
oxide is chlorinated to magnesium chloride, and coke is added to bind the oxygen as CO and
CO2. SO2 is emitted due to the sulphur in the reducing agent used.
Method
CO
Emission figures of CO were reported annually to the Norwegian Environment Agency. These
emissions disappeared when the plant closed down the production of primary magnesium in
2002.
SO2
The SO2 emissions were estimated from the amounts of reducing agent used (coke) and their
sulphur content and reported from the plants to the Norwegian Environment Agency.
Particles
The plant reported emission figures for particles for the first time for the year 1992. Emissions of
particles for 1990 and 1991 are assumed to be larger than the reported figure in 1992, since a
cleaning device was installed in 1992. Statistics Norway has no information that can be used to
estimate emissions in 1990 and 1991, so the inventory uses the reported emission figure for
1992 also for 1990 and 1991. The Norwegian Environment Agency assumes that reported figures
also include emissions from combustion.
No information is found regarding the particle size distribution for particles emitted during
magnesium production. In lack of other data, we use the same distribution as for aluminium
production (PM10 is 97 per cent of TSP, and PM2.5 is 43 per cent of TSP).
Heavy metals and POPs
Emission of heavy metals is due to the metal content in the reducing agent used. Emission data
of Hg, As, Cr and dioxins were reported to the Norwegian Environment Agency. When the plant
closed down the production of primary magnesium in 2002, the emissions of As disappeared.
Reported figures of heavy metals have only been available since 2000. Emission figures are
calculated back to 1990 based on the production rate for each year.

IIR 2017
163
During the chlorination process and the use of coke as a reducing agent, dioxins and HCB are
emitted. Emission figures for dioxins were reported to the Norwegian Environment Agency from
1990 while emissions from HCB have been reported from 1992. For 1990 and 1991, 1992 fiugres
have been considered. As no reports were available in 2004 and 2006, emissions have been
estimated using 2003 and 2005 figures.
Uncertainties
Uncertainty estimates for long-range transboundary air pollutants are given in Appendix C.
Particles
For years where reported emission figures do not exist, Statistics Norway has assumed that
emissions are in the same order as that of the first year of reporting. This is uncertain and a
result of lack of better data. The particle size distribution used is not specific for production of
magnesium, but used due to lack of specific size distribution data for this source. The particle
size distribution can therefore only be seen as an estimate.
Heavy metals
Historical emissions are based on a derived emission factor for the first year of reporting and
calculated with production figures for previous years. This is uncertain and only an estimate
since it does not consider annually changes in raw materials nor possible cleaning devices.
Completeness
Major missing emission components are not likely.
Source specific QA/QC
The latest reported emission data from the plant were compared with previous reported data
and the emissions were compared with the production.
Production of zinc
NFR 2C6
Last update: 05.02.15
Description
One plant in Norway produces zinc. SO2, particles and heavy metals are emitted during the
process. Emission of SO2 originates from the sulphur in the reducing agent used.
Method
SO2
The plant reports emission figures to the Norwegian Environment Agency. The SO2 emissions are
estimated from infrequent measurements combined with calculations.
Particles
Emission figures for particles have been reported since 1991. Emissions for 1990 are assumed to
be the same as the reported figure for 1991. It is assumed that of the particles emitted, 90 per
IIR 2017
164
cent is PM10 and 80 per cent is PM2.5 (Institute of environmental and energy technology 2002)
and this particle size distribution is used in the Norwegian inventory.
Heavy metals and POPs
The plant reports emission figures for Cd, Pb, Hg, Cu, Cr and As. Reported figures exist since
1992, and emissions in 1990 and 1991 are assumed to be the same as reported figures in 1992.
Figures are not reported for PAHs (benzo(a)pyrene, benzo(b)fluoranthene,
benzo(k)fluoranthene and indeno(1,2,3-cd)pyrene) and dioxins.
PCB emissions have been estimated using the emission factor given by EEA (2013). This
emissions factor, which amounts to 0.9 mg/tonn of zinc, is used for the whole period.
Completeness
Major missing emission components are not likely.
Source specific QA/QC
There is no source specific QA/QC procedure for this sector. See section 1.6 for the description
of the general QA/QC procedure.
Production of nickel
NFR 2C7B
Last update: 22.12.16
Description
One plant in Norway produces nickel. During the production of nickel SO2, NOX, NH3, particles
and heavy metals are emitted. CO2 is emitted in the production of nickel, due to the soda from
the production of nickel carbonate and use of coke as a reducing agent, while SO2 is a result of
the sulphur content in the coke used. NOX is produced primarily by the high temperature
oxidation of nitrogen in the air. Emission of heavy metals is due to the metal content in reducing
agent used. Particles are also emitted during the production process. PAHs (benzo(a)pyrene,
benzo(b)fluoranthene, benzo(k)fluoranthene and indeno(1,2,3-cd)pyrene) and dioxins are not
reported or calculated.
Method
SO2
Emission figures of SO2 are reported from the plant to the Norwegian Environment Agency
based on continuous measurements. Flue gas treatment is installed at the plant.
NOX
Emission figures of NOX are annually reported from the plant to the Norwegian Environment
Agency. The emission figures are based on calculations.
NH3
Emission figures based on calculations are annually reported from the plant to the Norwegian
Environment Agency.
IIR 2017
165
Particles
Emission figures for particles have been reported to the Norwegian Environment Agency since
1992. Emissions in 1990 and 1991 are assumed to be the same as the reported figure in 1992.
The emission permit sets requirements to emissions from the melting furnace, transport,
crushing and packing of the raw materials and products. The Norwegian Environment Agency
assumes that the particles emitted are smaller than PM2.5. This means that TSP=PM10=PM2.5 is
used in the inventory.
Heavy metals and POPs
Emission figures for Cu have been reported to the Norwegian Environment Agency since 1990.
Reported figures for Cd, Hg and Pb were available from 1990-1994, but because of low
emissions the plant stopped reporting these metals.
Uncertainties
Uncertainty estimates for long-range transboundary air pollutants are given in Appendix C.
Particles
The particle size distribution used is only an assumption and we can not preclude that the
distribution might be different than the one suggested. The particle size distribution can
therefore only be seen as an estimate.
Completeness
Major missing emission components are not likely.
Source specific QA/QC
There is no source specific QA/QC procedure for this sector. See section 1.6 for the description
of the general QA/QC procedure.
Manufacture of anodes
NFR 2C7C
Last update: 12.01.17
Description
Four plants in Norway produce anodes. Three plants produce prebaked anodes and one plant
produced coal electrodes. These are alternatives to the use of coal and coke as reducing agents
in the production process for aluminium and ferroalloys. The anodes and coal electrodes are
produced from coal and coke. The production of anodes and coal electrodes leads to emissions
of NOX, SO2, particles, BC, PAHs (benzo(a)pyrene, benzo(b)fluoranthene, benzo(k)fluoranthene
and indeno(1,2,3-cd)pyrene) and heavy metals.
Method
SO2 and NOX
Emission figures of SO2 are based on measurements while NOX emissions are calculated by the
plants and reported to the Norwegian Environment Agency.

IIR 2017
166
Particles
Production of anodes leads to emission of particles. One of the plants has reported emissions
since 1990, while the other one has reported since 1992. Emission figures for 1990 and 1991 are
assumed to be the same as the reported figure in 1992 for this plant. The Norwegian
Environment Agency assumes that the particles emitted are smaller than PM10, but also expects
some to be smaller than PM2.5. No information has been found regarding the particle size
distribution, so in lack of other data we use the same distribution profile as used for production
of aluminium where PM10 is 97 per cent of TSP and PM2.5 is 43 per cent of TSP.
BC Emissions have been estimated as a share of PM2.5 emissions. Measurments of particles
composition from one plant were used to estimate the dust carbon content. This value was used
to estimate BC. As no information on the share of BC and OC was found in the literature for
ferroalloys production, BC share has been set to be 50 per cent of PM2.5. Indeed, the amount of
PM2.5 is assumed to be equally shared between BC and organic mass (OM).
As the dust carbon content was measured to be 8 per cent, BC emission have been set to 4 per
cent of PM2.5 emissions.
PAHs (Benzo(a)pyrene, benzo(b)fluoranthene, benzo(k)fluoranthene and indeno(1,2,3-
cd)pyrene)
Emission figures for PAH are based on measurements and reported from both plants to the
Norwegian Environment Agency. One plant has developed a new and better method for
measuring PAH. This method is used for the period 1992 to 2003. The reported figures of PAH
are assumed to be according to the Norwegian standard (NS9815). Measurements from
production of Soederberg paste (at three Norwegians plants) and a PAH-profile of baked anodes
from EPA are used to derive a PAH-profile to find the emission of PAH-OSPAR and PAH-4. Based
on these profiles it is assumed that PAH-4 account for 5 per cent of the total PAH emissions
(Table 4.20). Emissions of benzo(a)pyrene, benzo(b)fluoranthene, benzo(k)fluoranthene and
indeno(1,2,3-cd)pyrene are estimated using the same PAH-profile as for aluminium production,
see Table 4.18
Table 4.20. Distribution of PAH emissions from production of anodes. Ratio
Component Distribution of PAH emissions (ratio)
PAH (Norwegian standard) 1 PAH-4 (CLRTAP) 0.05
Source: Norwegian pollution control authority (SFT 1999a)
Heavy metals
Production of anodes leads to emission of heavy metals due to the metal content in the
reducing agents (coke and coal). Emission figures are based on measurements and are reported
for arsenic and mercury from one plant since 2001, and for lead since 2004. Emission figures
have not been measured or reported before 2001 for As and Hg and before 2004 for Pb and are
therefore not available for previous years. Historical emission figures back to 1990 are assumed
to be the same as reported figures for 2001 for As and Hg and 2004 for Pb.

IIR 2017
167
Uncertainties
Historical calculations of heavy metals from 1990 to 2001 are very uncertain since they are
assumed to be the same as reported figures for the first year of reporting (2001). Annual
changes in production volumes, coke quality and the amount of heavy metals in the reducing
agents are not taken into account, and the historical emissions can only be seen as an estimate
in lack of better data.
Completeness
Major missing emission components are not likely.
Source specific QA/QC
There is no source specific QA/QC procedure for this sector. See section 1.6 for the description
of the general QA/QC procedure.
4.5 Solvents and product use
NFR 2D
Last update: 22.12.16
This chapter describes emissions from solvents and other products. Use of solvents and
products containing solvents result in emissions of non-methane volatile organic compounds
(NMVOC).
In addition to solvents emitting NMVOC, there are other products that emit other volatile
components. Creosote treated materials and tarry jointing paste cause emissions of PAHs
(benzo(a)pyrene, benzo(b)fluoranthene, benzo(k)fluoranthene and indeno(1,2,3-cd)pyrene).
Dioxins are also emitted during road paving with asphalt (2D3B). Emissions of mercury from
mercury-containing products as well as emissions from combustion of tobacco are also included
in the Norwegian inventory.
Solvent losses (NMVOC)
NFR 2D3A, 2D3D, 2D3E, 2D3F, 2D3G, 2D3H, 2D3I.
Last update: 05.02.15
Method
Our general model is a simplified version of the detailed methodology described in chapter 6 of
the EMEP/CORINAIR Guidebook 2007 (EEA 2007). It represents a mass balance per substance,
where emissions are calculated by multiplying relevant activity data with an emission factor. For
better coverage, point sources reported from industries to the Norwegian Environment Agency
and calculated emissions from a side model for cosmetics, are added to the estimates. For a
detailed description of method and activity data, see Holmengen and Kittilsen (2009).
It is assumed that all products are used the same year as they are registered, and substances are
not assumed to accumulate in long-lived products. In other words, it is assumed that all
emissions generated by the use of a given product during its lifetime take place in the same year

IIR 2017
168
as the product is declared to our data source, the Norwegian Product Register. In sum, this leads
to emission estimates that do not fully reflect the actual emissions taking place in a given year.
Emissions that in real life are spread out over several years all appear in the emission estimate
for the year of registration. However, this systematic overestimation for a given year probably
more or less compensates for emissions due to previously accumulated amounts not being
included in the estimate figures.
No official definition of solvents exists, and a list of substances to be included in the inventory
on NMVOC emissions was thus created. The substance list used in the Swedish NMVOC
inventory (Skårman et al. 2006) was used as a basis. This substance list is based on the definition
stated in the UNECE Guidelines12. The list is supplemented by NMVOC reported in the UK’s
National Atmospheric Emissions Inventory (NAEI) (AEA 2007). The resulting list comprises 678
substances. Of these, 355 were found in the Norwegian Product Register for one or more years
in the period 2005-2007.
Cosmetics Cosmetics are not subject to the duty of declaration. The side model is based on a study in 2004,
when the Norwegian Environment Agency calculated the consumption of pharmaceuticals and
cosmetics (SFT 2005). The consumption was calculated for product groups such as shaving
products, hair dye, body lotions and antiperspirants. The consumption in tonnes each year is
calculated by using the relationship between consumption in Norwegian kroner and in tonnes in
2004. Figures on VOC content and emission factors for each product group were taken for the
most part from a study in the Netherlands (IVAM 2005), with some supplements from the
previous Norwegian solvent balance (the previous NMVOC emission model).
Activity data
The data source is the Norwegian Product Register. Any person placing dangerous chemicals on
the Norwegian market for professional or private use has a duty of declaration to the Product
Register, and import, export and manufacturing is reported annually. The only exception is when
the amount of a given product placed on the market by a given importer/producer is less than
100 kg per year.
The information in the data from the Product Register makes it possible to analyse the activity
data on a substance level, distributed over product types (given in UCN codes; (Norwegian
Product Register 2007)), industrial sectors (following standard industrial classification (NACE),
including private households (no NACE), or a combination of both. As a consequence, the
identification of specific substances, products or industrial sectors that have a major influence
on the emissions is greatly facilitated.
12 “Volatile compound (VOC) shall mean any organic compound having at 293.15 degrees K a vapor pressure of 0.01
kPa or more, or having a corresponding volatility under the particular conditions of use."

IIR 2017
169
Cosmetics
The side model for cosmetics is updated each year with data on from the Norwegian Association
of Cosmetics, Toiletries and Fragrance Suppliers (KLF).
Point sources
Data from nine point sources provided by the Norwegian Environment Agency are added to the
emissions estimates. The point sources are reported from the industrial sector “Manufacture of
chemicals and chemical products” (NACE 20). In order to avoid double counting, NMVOC used as
raw materials in this sector are excluded from the emission estimates from the Product Register
data.
Emission factors
Emission factors are specific for combinations of product type and industrial sector. Emission
factors from the Swedish model for estimating NMVOC emissions from solvent and other
product use (Skårman et al. 2006) are used. The emission factors take into account different
application techniques, abating measures and alternative pathways of release (e.g. waste or
water). These country-specific emission factors apply to 12 different industries or activities that
correspond to sub-divisions of the four major emission source categories for solvents used in
international reporting of air pollution (EEA 2007).
It is assumed that the factors developed for Sweden are representative for Norwegian
conditions, as we at present have no reason to believe that product types, patterns of use or
abatement measures differ significantly between the two countries. Some adjustments in the
Swedish emission factors were made when the model was first developed (see Holmengen and
Kittilsen (2009)) and several improvements of single emission factors have been made in the
following years.
In accordance with the Swedish model, emission factors were set to zero for a few products that
are assumed to be completely converted through combustion processes, such as EP-additives,
soldering agents and welding auxiliaries. Quantities that have not been registered to industrial
sector or product type are given emission factor 0.95 (maximum). Emission factors may change
over time, and such changes may be included in this model. However, all emission factors are at
the moment constant for all years.
Uncertainties
Uncertainty in emission factors
The emission factors are more detailed in the new NMVOC model than in the previous model, as
this model can take into account that emissions are different in different sectors and products,
even when the substance is the same. However, for this to be correct, a thorough evaluation of
each area of use is desirable, but not possible within a limited time frame. Thus, the emission
factor is set with general evaluations, which leads to uncertainty.
The emission factors are taken from several different sources, with different level of accuracy.
The uncertainties in emission factors depend on how detailed assessment has been undertaken
when the emission factor was established. Some emission factors are assumed to be unbiased,
IIR 2017
170
while others are set close to the expected maximum of the range of probable emission factors.
This, together with the fact that the parameter range is limited, gives us a non-symmetrical
confidence interval around some of the emission factors. For each emission factor we thus have
two uncertainties; one negative (n) and one positive (p). These are aggregated separately, and
the aggregated uncertainty is thus not necessarily symmetrical.
Uncertainty in activity data
For the activity data, the simplified declarations and the negative figures due to exports lead to
known overestimations, for which the uncertainty to a large extent is known. A more elaborate
problem in calculations of uncertainty is estimating the level of omissions in declaration for
products where the duty of declaration does apply. In addition, while declarations with large,
incorrect consumption figures are routinely identified during the QA/QC procedure, faulty
declarations with small consumption figures will only occasionally be discovered. There is
however no reason to believe that the Product Register data are more uncertain than the data
source used in the previous model (statistics on production and external trade), as similar
QA/QC routines are used for these statistics.
The errors in activity data are not directly quantifiable. Any under-coverage in the Product
Register is not taken into account. Skårman et al. (2006) found that the activity data from the
Swedish Product register had an uncertainty of about 15 per cent. The Norwegian Product
Register is assumed to be comparable to the Swedish, and thus the uncertainty in the activity
data is assumed to be 15 per cent. For some products, simplified declarations give an indication
of maximum and minimum possible amounts. In these cases, the maximum amount is used, and
the positive uncertainty is set to 15 per cent as for other activity data, while the negative
uncertainty is assumed to be the interval between maximum and minimum amount. All activity
data are set to zero if negative.
For a detailed description of the uncertainty analysis, see Holmengen and Kittilsen (2009). The
variance of total emission was estimated from the variance estimates obtained for emission
factors and activity data, using standard formulas for the variance of a sum and the variance of a
product of independent random variables. The aggregated uncertainties in level and trend are
given in Table 4.21 and Table 4.22.
Table 4.21 Uncertainty estimates for level of NMVOC emissions, 2005-2007. Tonnes and per cent
Uncertainty in level
Negative (n) Negative (n) (per cent of total emissions)
Positive (p) Positive (p) (per cent of total emissions)
2005 2 288 4.58 1 437 2.88
2006 1 651 3.70 1 103 2.47
2007 1 299 2.79 1 168 2.51
Source: Holmengen and Kittilsen (2009)

IIR 2017
171
Table 4.22. Uncertainty estimates for trend in NMVOC emissions, 2005-2007. Tonnes
Uncertainty in trend Negative (n) Positive (p) 95% confidence interval for change
2005-2006 2 135 1 067 (-7 366, -4 164)
2006-2007 1 420 947 (407, 2 774)
2005-2007 1 882 1 076 (-5 286, -2 328)
Source: Holmengen and Kittilsen (2009)
Completeness
No major missing emission sources are likely.
Source specific QA/QC
Large between-year discrepancies in the time series of substance quantities are routinely
identified and investigated, in order to correct errors in consumption figures. Large within-year
discrepancies between minimum and maximum quantities in simplified declarations are
routinely identified and investigated, in order to prevent overestimation for substances where
consumption figures are given in intervals. Large within-year discrepancies between totals for
industrial sectors (NACE) and totals for products (UCN) are routinely identified and investigated,
in order to detect erroneous or incomplete industrial sectoral and product type distribution.
Creosote-treated materials
NFR 2D3G
Last update: 02.01.17
Description
Creosote is mainly used in quay materials and conduction poles, but also in fence poles and roof
boards. In Norway there is a requirement that all creosote in use should contain less than 50
mg/kg benzo(a)pyren (Ministry of the Environment 2004). PAH-components will evaporate from
the creosote-treated materials in hot weather. In addition, PAH-components will evaporate
during impregnation. The smallest PAH-components, like naphthalene, are most volatile, but
several components used in wood treatment will not evaporate.
Method
Emissions of PAHs benzo(a)pyrene, benzo(b)fluoranthene, benzo(k)fluoranthene and
indeno(1,2,3-cd)pyrene) are calculated based on the import of creosote oil and emission factors.
For simplicity, it is assumed that all PAH is emitted the same year as the materials are produced.
Activity data
Data on imported amounts of creosote oil are taken from Statistics Norway’s statistics on
external trade.
Emission factors
The emission factor used is taken from Finstad et al. (2001). It is assumed that imported creosot
oil contains on average 55 per cent PAH and that one per cent will evaporate during the lifetime
of the creosot-treated materials. It is assumed that PAH-4 account for 0,018 per cent of the
total PAH emissions. Emissions of benzo(a)pyrene, benzo(b)fluoranthene, benzo(k)fluoranthene

IIR 2017
172
and indeno(1,2,3-cd)pyrene are estimated using the a PAH-profile for creosot oil, Finstad at al
(2001), see Table 4.23.
Table 4.23. Distribution of PAH-4 emissions from creosote oil. Share of PAH-4
Component Distribution of PAH emissions (ratio)
benzo(a)pyrene .. benzo(b)fluoranthene 0.50 benzo(k)fluoranthene 0.50 indeno(1,2,3-cd)pyrene ..
Source: Finstad et al (2001)
Uncertainties
In the inventory it is assumed that all PAH is emitted the same year as the materials are used.
This is however not the case, since PAH will be emitted as long as the creosote-treated materials
are in use. However, most of it is likely to be emitted during the first years.
Completeness
No major missing emission components or sources are likely.
Source specific QA/QC
There is no source specific QA/QC procedure for this sector. See section 1.6 for the description
of the general QA/QC procedure.
Road paving with asphalt
NFR 2D3B
Last update: 02.01.17
Method
The emissions from road paving are being calculated in accordance with a Tier 1 approach (EEA
2013) for NMVOC, TSP, PM10 and PM2.5. Emissions of dioxins from production of asphalt are also
included.
Epollutant = ARproduction * EFpollutatnt
Where:
E pollutant = the emission of the specified pollutant
AR production = the activity rate for the road paving with asphalt
EF pollutant = the emission factor for this pollutant
Dioxins
Asphalt preparations and asphalt recycling are supposed to be a possible dioxin source,
especially in countries using extensive recycling, and that use salt on the roads during winter. A
lot of salt is used on Norwegian roads during winter, and when this asphalt is heated during
recycling, it is assumed to give emissions of dioxins (Hansen 2000).

IIR 2017
173
Activity data
The activity data used is the annual weight of asphalt used for road paving in Norway. EBA, pers.
comm13).
Emission factors
Emissions of NMVOC, TSP, PM10 and PM2.5 from road paving with asphalt are estimated using
Tier 1 emission factors from the 2016 EEA Guidebook.
Table 4.24. Emission factor for road paving with asphalt. g/tonn
NMVOC 16 TSP 14 000 PM10 3 000 PM2.5 400
Source: EEA (2016)
Dioxins
Two emission factors are found in the literature. According to SFT (2001), the Oslo and Paris
Convention (OSPAR) suggests an emission factor of 0.047 µg/tonne asphalt. This emission factor
is however assumed to be very high since it is based on data from a plant only re-circulating old
asphalt. Fyns Amt (2000) operates with a much lower emission factor, which probably reflects
dioxin emissions from preparation of new asphalt. Since Norway both makes new asphalt and
recycles old asphalt, it is assumed that an emission factor in between those suggested from
OSPAR and Fyns Amt would be most correct for Norwegian conditions (Table 4.25).
Table 4.25. Dioxin emission factor for asphalt production. µg I-TEQ/tonne produced asphalt
Source Emission factor
SFT (2001) 0.047 Fyns Amt (2000) 0.0022 Emission factor chosen 0.025
Uncertainties
The activity data used are uncertain. The emission factors used are also uncertain. The annual
emissions are low however, and will not have any impact on the total level of these emissions.
Completeness
No major missing emission components are likely.
Source specific QA/QC
There is no source specific QA/QC procedure for this sector. See section 1.6 for the description
of the general QA/QC procedure.
Other product use
NFR 2G
13 EBA (2014): Expert judgement by Contractors Association - Building and Construction (EBA), Oslo,
Norway

IIR 2017
174
Last update: 05.02.15
Mercury-containing products
NFR 2G
Last update: 05.02.15
Method
Breakage of mercury-containing thermometers, fluorescent tubes, economy bulbs, and various
measuring and analytical instruments lead to emissions of mercury. The emission estimates are
based on an annual report from the Norwegian Environment Agency ("Miljøgifter i produkter").
The sale of mercury-containing thermometers and fluorescent tubes has decreased strongly
since the mid-1990s, and the mercury content in these products has been reduced. A
prohibition against the production, import and export of mercury-containing products entered
into force in 1998, except for some thermometers for professional use, which were prohibited in
2001. Since these products have long operating life times, there will be emissions from these
products for many years. In the calculations, however, it is assumed that the emissions occur the
same year as the product is sold.
For thermometers, it is assumed that all mercury is emitted in hospitals, despite some breakage
of mercury-containing thermometers that occur in households. For fluorescent tubes and
economy bulbs, all emissions are placed in households, although emissions occur in all sectors.
For measuring and analytical instruments, all emissions are placed under research and
development work.
Uncertainties
The emissions are assumed to be emitted the same year as the products are sold. This is not
accurate, since most of these products have long operating life times. It is however impossible
to predict the annual breakage and the mercury content in each of them.
Completeness
No major missing emission components are likely.
Source specific QA/QC
There is no source specific QA/QC procedure for this sector. See section 1.6 for the description
of the general QA/QC procedure.
Tobacco
NFR 2G
Last update: 10.01.17
Method
NOX, NMVOC, CO, NH3, particles, BC, heavy metals and POPs
The emission components included from the combustion of tobacco are NOX, NMVOC, CO, NH3,
particles, heavy metals and POPs (Persistent organic pollutants). Emission figures have been
calculated by multiplying the annual consumption of tobacco with emission factors for each

IIR 2017
175
pollutant. As recommended by the UNFCCC ERT (expert review team), emissions from use of
tobacco are reported under NFR 2G.
Activity data
The total consumption of tobacco in Norway is given by the net import of tobacco from Statistics
Norway's external trade statistics.
Emission factors
Table 4.26 gives emission factors used for tobacco combustion. For NOX, NMVOC and CO the
emission factors are calculated by Statistics Norway, based on values given in Norwegian
Directorate of Health (1990).
Table 4.26. Emission factors used for tobacco combustion
Tobacco (unit/kg tobacco)
Source
NOX (kg) 0.0034652 Statistics Norway, Norwegian Directorate of Health (1990) NMVOC (kg) 0.0048374 Statistics Norway, Norwegian Directorate of Health (1990) CO (kg) 0.1215475 Statistics Norway, Norwegian Directorate of Health (1990) NH3 (kg) 0.00415 EEA (2013) TSP (kg) 0.04 Institute of environmental and energy technology (2002) PM10 (kg) 0.04 Institute of environmental and energy technology (2002) PM2.5 (kg) 0.04 Institute of environmental and energy technology (2002) BC 0.5% of PM2.5 IIASA (Kupiainen & Klimont 2004) Pb (g) 0.00005 Finstad et al. (2001) Cd (g) 0.0001 Finstad et al. (2001) Hg (g) 0.00001 Finstad et al. (2001) As (g) 0.000159 Finstad and Rypdal (2003) Cr (g) 0.000125 Finstad and Rypdal (2003) Cu (g) 0.000354 Finstad and Rypdal (2003) Benzo(a)pyrene (g) 0.000111
Finstad et al. (2001)
Benzo(b)fluoranthene (g)
0.000045 EEA (2016)
Indeno(1,2,3-cd)pyrene (g)
0.000045 EEA (2016)
Indeno(1,2,3-cd)pyrene (g)
0.000045 EEA (2016)
Dioxins (µg) 0.0013 Finstad et al. (2002b)
Uncertainties
The emissions are assumed to be emitted the same year as the products are imported.
Completeness
Tobacco bought tax free abroad and tobacco smuggled are not included in the inventory.
Source specific QA/QC
There is no source specific QA/QC procedure for this sector. See section 1.6 for the description
of the general QA/QC procedure.
4.6 Other production
NFR 2H
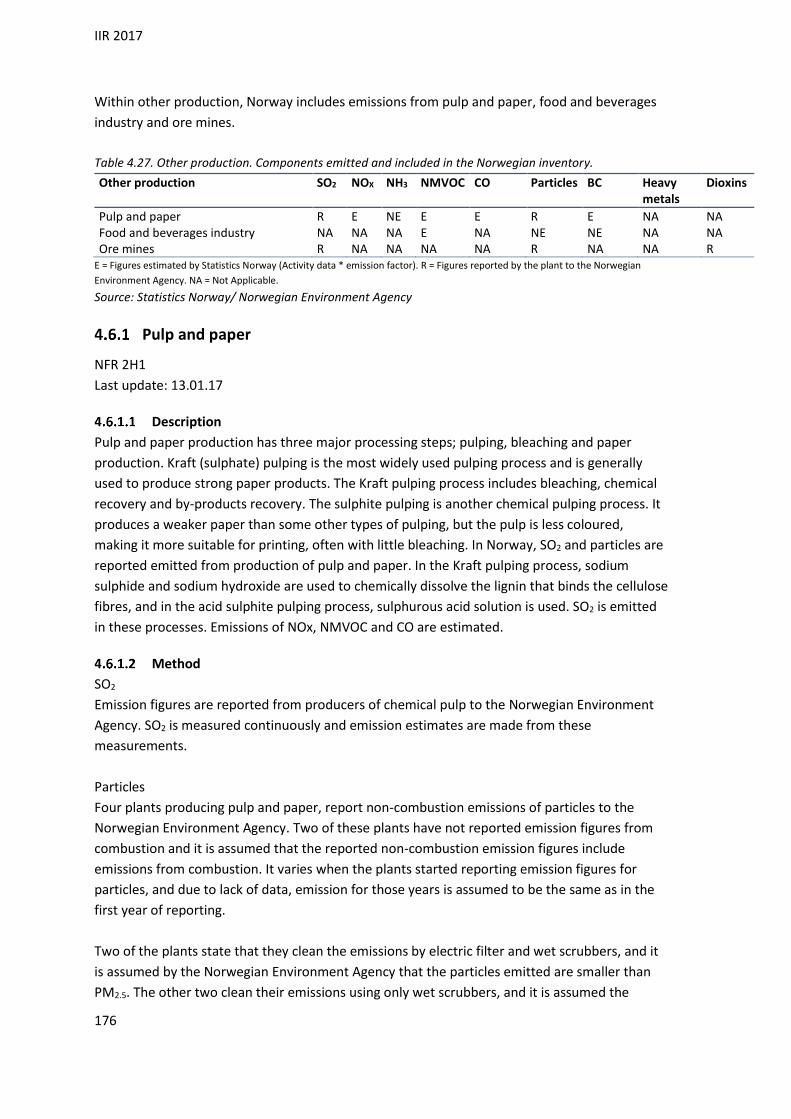
IIR 2017
176
Within other production, Norway includes emissions from pulp and paper, food and beverages
industry and ore mines.
Table 4.27. Other production. Components emitted and included in the Norwegian inventory.
Other production SO2 NOX NH3 NMVOC CO Particles BC Heavy metals
Dioxins
Pulp and paper R E NE E E R E NA NA Food and beverages industry NA NA NA E NA NE NE NA NA Ore mines R NA NA NA NA R NA NA R
E = Figures estimated by Statistics Norway (Activity data * emission factor). R = Figures reported by the plant to the Norwegian
Environment Agency. NA = Not Applicable.
Source: Statistics Norway/ Norwegian Environment Agency
Pulp and paper
NFR 2H1
Last update: 13.01.17
Description
Pulp and paper production has three major processing steps; pulping, bleaching and paper
production. Kraft (sulphate) pulping is the most widely used pulping process and is generally
used to produce strong paper products. The Kraft pulping process includes bleaching, chemical
recovery and by-products recovery. The sulphite pulping is another chemical pulping process. It
produces a weaker paper than some other types of pulping, but the pulp is less coloured,
making it more suitable for printing, often with little bleaching. In Norway, SO2 and particles are
reported emitted from production of pulp and paper. In the Kraft pulping process, sodium
sulphide and sodium hydroxide are used to chemically dissolve the lignin that binds the cellulose
fibres, and in the acid sulphite pulping process, sulphurous acid solution is used. SO2 is emitted
in these processes. Emissions of NOx, NMVOC and CO are estimated.
Method
SO2
Emission figures are reported from producers of chemical pulp to the Norwegian Environment
Agency. SO2 is measured continuously and emission estimates are made from these
measurements.
Particles
Four plants producing pulp and paper, report non-combustion emissions of particles to the
Norwegian Environment Agency. Two of these plants have not reported emission figures from
combustion and it is assumed that the reported non-combustion emission figures include
emissions from combustion. It varies when the plants started reporting emission figures for
particles, and due to lack of data, emission for those years is assumed to be the same as in the
first year of reporting.
Two of the plants state that they clean the emissions by electric filter and wet scrubbers, and it
is assumed by the Norwegian Environment Agency that the particles emitted are smaller than
PM2.5. The other two clean their emissions using only wet scrubbers, and it is assumed the
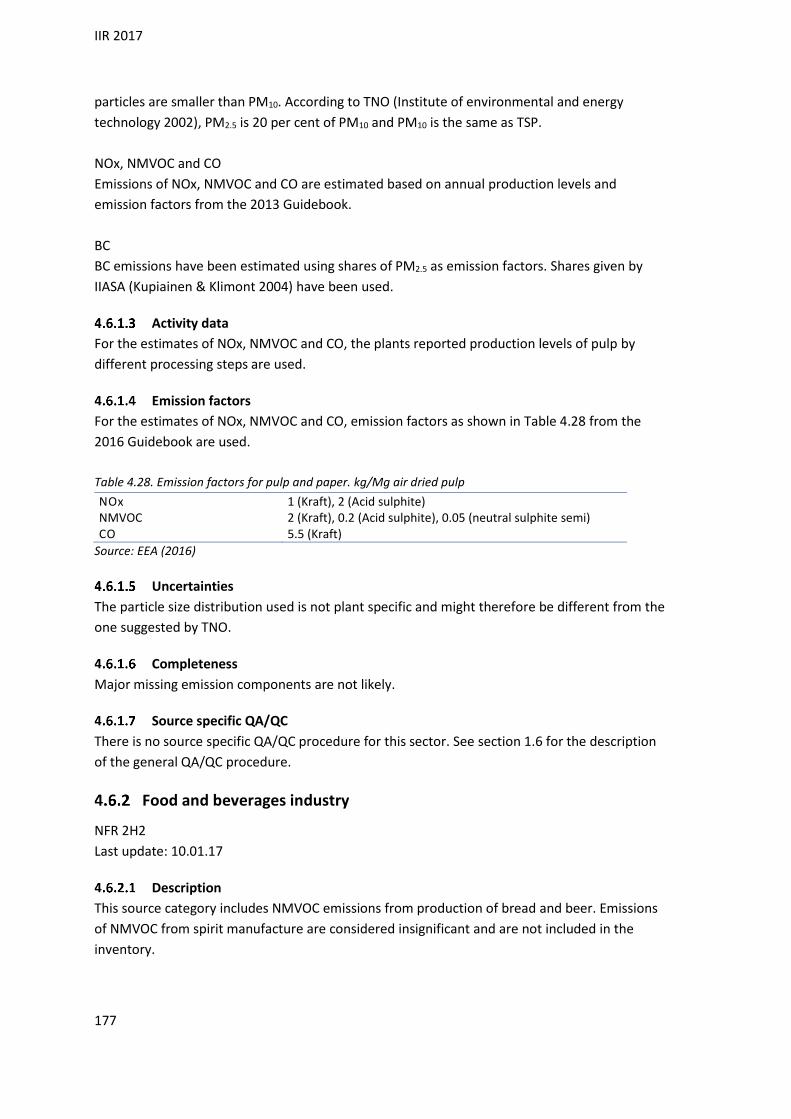
IIR 2017
177
particles are smaller than PM10. According to TNO (Institute of environmental and energy
technology 2002), PM2.5 is 20 per cent of PM10 and PM10 is the same as TSP.
NOx, NMVOC and CO
Emissions of NOx, NMVOC and CO are estimated based on annual production levels and
emission factors from the 2013 Guidebook.
BC
BC emissions have been estimated using shares of PM2.5 as emission factors. Shares given by
IIASA (Kupiainen & Klimont 2004) have been used.
Activity data
For the estimates of NOx, NMVOC and CO, the plants reported production levels of pulp by
different processing steps are used.
Emission factors
For the estimates of NOx, NMVOC and CO, emission factors as shown in Table 4.28 from the
2016 Guidebook are used.
Table 4.28. Emission factors for pulp and paper. kg/Mg air dried pulp
NOx 1 (Kraft), 2 (Acid sulphite) NMVOC 2 (Kraft), 0.2 (Acid sulphite), 0.05 (neutral sulphite semi) CO 5.5 (Kraft)
Source: EEA (2016)
Uncertainties
The particle size distribution used is not plant specific and might therefore be different from the
one suggested by TNO.
Completeness
Major missing emission components are not likely.
Source specific QA/QC
There is no source specific QA/QC procedure for this sector. See section 1.6 for the description
of the general QA/QC procedure.
Food and beverages industry
NFR 2H2
Last update: 10.01.17
Description
This source category includes NMVOC emissions from production of bread and beer. Emissions
of NMVOC from spirit manufacture are considered insignificant and are not included in the
inventory.

IIR 2017
178
Method
NMVOC
Production of bread and beer (and other similar yeast products) involves fermentation
processes that lead to emission of NMVOC (ethanol). Emissions are calculated based on
production volumes and emission factors.
Activity data
Production volumes of bread and beverages are annually reported to Statistics Norway.
Emission factors
The emission factors are taken from EEA (1996).
Table 4.29. NMVOC emission factors from production of bread and beverage
Emission factor Unit
Production of bread 0.0045 tonnes/tonnes produced Production of beverage 0.35 kg/1000 litres
Source: EEA (1996)
Uncertainties
The emission factors used are recommended by EEA (1996) and are not specific for Norwegian
conditions.
Completeness
Major missing emission components are not likely.
Source specific QA/QC
There is no source specific QA/QC procedure for this sector. See section 1.6 for the description
of the general QA/QC procedure.
Ore mines
NFR 2H3
Last update: 05.02.15
Description
Three ore mines are included in the Norwegian Inventory, but one of the mines was closed
down in 1996. Emission figures of SO2, particles and dioxins are included. The treatment of ore
generates emissions of SO2, and particles are also emitted. Dioxin emissions are due to the
thermal process during the pellet production. The ore mine which closed down in 1996, had
large dioxin emissions due to the thermal process during the pellet production.
Method
SO2
The ore mine which was closed down in 1996, reported emission figures for SO2 to the
Norwegian Environment Agency. None of the two other ore mines report any non-combustion
SO2 emissions.
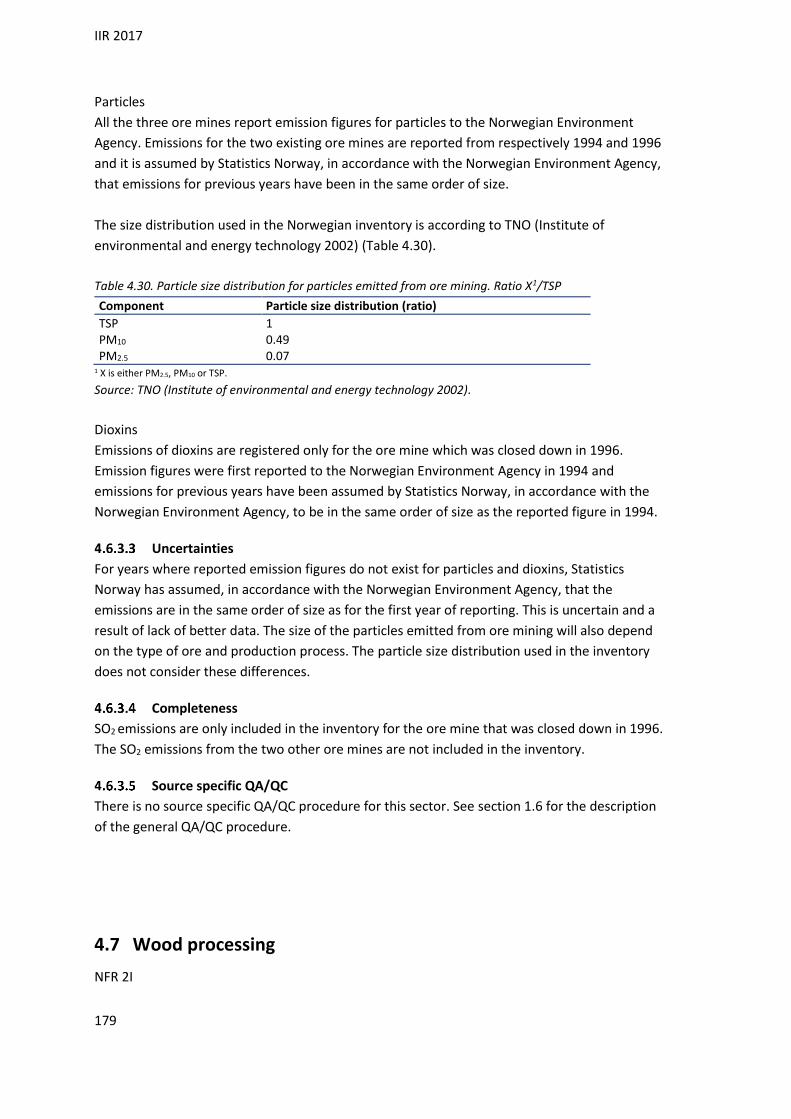
IIR 2017
179
Particles
All the three ore mines report emission figures for particles to the Norwegian Environment
Agency. Emissions for the two existing ore mines are reported from respectively 1994 and 1996
and it is assumed by Statistics Norway, in accordance with the Norwegian Environment Agency,
that emissions for previous years have been in the same order of size.
The size distribution used in the Norwegian inventory is according to TNO (Institute of
environmental and energy technology 2002) (Table 4.30).
Table 4.30. Particle size distribution for particles emitted from ore mining. Ratio X1/TSP
Component Particle size distribution (ratio)
TSP 1 PM10 0.49 PM2.5 0.07
1 X is either PM2.5, PM10 or TSP.
Source: TNO (Institute of environmental and energy technology 2002).
Dioxins
Emissions of dioxins are registered only for the ore mine which was closed down in 1996.
Emission figures were first reported to the Norwegian Environment Agency in 1994 and
emissions for previous years have been assumed by Statistics Norway, in accordance with the
Norwegian Environment Agency, to be in the same order of size as the reported figure in 1994.
Uncertainties
For years where reported emission figures do not exist for particles and dioxins, Statistics
Norway has assumed, in accordance with the Norwegian Environment Agency, that the
emissions are in the same order of size as for the first year of reporting. This is uncertain and a
result of lack of better data. The size of the particles emitted from ore mining will also depend
on the type of ore and production process. The particle size distribution used in the inventory
does not consider these differences.
Completeness
SO2 emissions are only included in the inventory for the ore mine that was closed down in 1996.
The SO2 emissions from the two other ore mines are not included in the inventory.
Source specific QA/QC
There is no source specific QA/QC procedure for this sector. See section 1.6 for the description
of the general QA/QC procedure.
4.7 Wood processing
NFR 2I
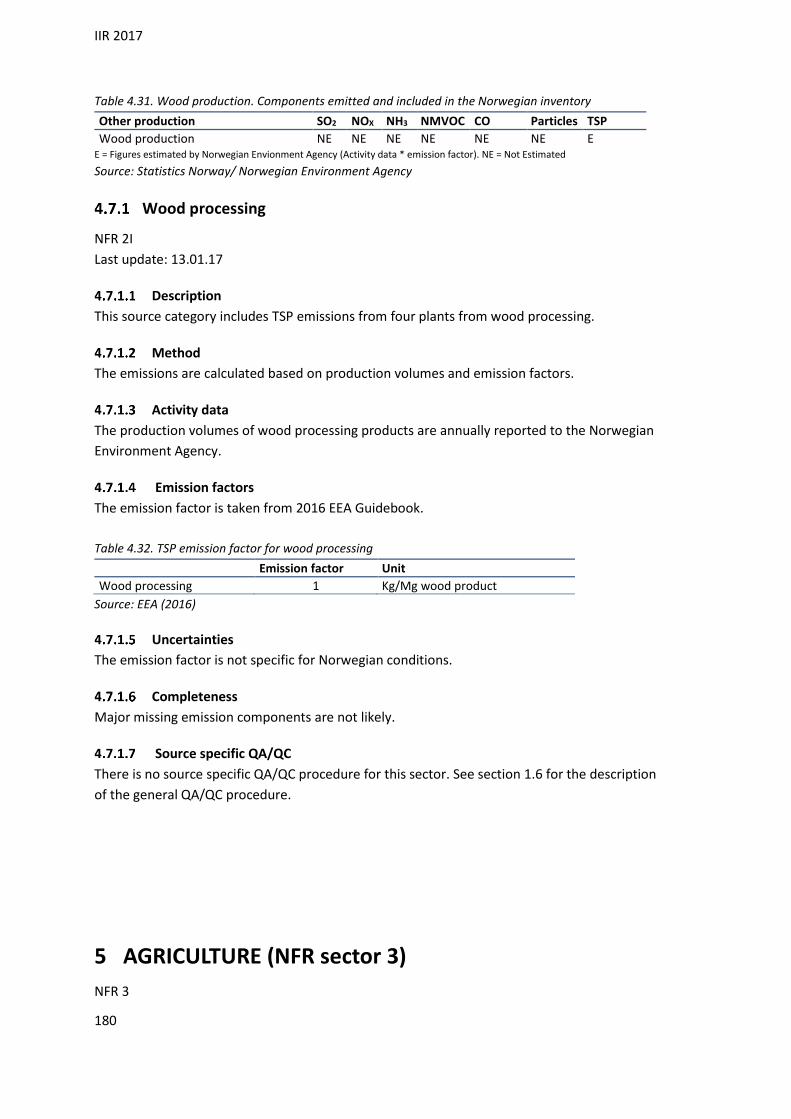
IIR 2017
180
Table 4.31. Wood production. Components emitted and included in the Norwegian inventory
Other production SO2 NOX NH3 NMVOC CO Particles TSP
Wood production NE NE NE NE NE NE E E = Figures estimated by Norwegian Envionment Agency (Activity data * emission factor). NE = Not Estimated
Source: Statistics Norway/ Norwegian Environment Agency
Wood processing
NFR 2I
Last update: 13.01.17
Description
This source category includes TSP emissions from four plants from wood processing.
Method
The emissions are calculated based on production volumes and emission factors.
Activity data
The production volumes of wood processing products are annually reported to the Norwegian
Environment Agency.
Emission factors
The emission factor is taken from 2016 EEA Guidebook.
Table 4.32. TSP emission factor for wood processing
Emission factor Unit
Wood processing 1 Kg/Mg wood product
Source: EEA (2016)
Uncertainties
The emission factor is not specific for Norwegian conditions.
Completeness
Major missing emission components are not likely.
Source specific QA/QC
There is no source specific QA/QC procedure for this sector. See section 1.6 for the description
of the general QA/QC procedure.
5 AGRICULTURE (NFR sector 3)
NFR 3

IIR 2017
181
5.1 Overview
Agriculture is an important contributor to NH3 emissions. Animal manure management, grazing
animals and the use of fertiliser (manure, synthetic fertiliser, sewage sludge and other organic
fertilisers applied to soils) generate emissions of NH3. Another source of NH3 is treatment of
straw using NH3 as a chemical.
Animal manure management and the use of fertiliser (manure, synthetic fertiliser, sewage
sludge and other organic fertilisers applied to soils) also generates emissions of NOX.
Emissions of NMVOC from manure management and from cultivated agricultural soils are also
included in the inventory.
Non-combustion emissions of particles from manure management and agricultural soils are also
calculated. Additionally, there are long-range transboundary air emissions arising from the
burning of agricultural residues.
Table 5.1. Agriculture emissions as per cent of total emissions of the component, 2015
Pollutant Percent of emissions
NOX 4.8 % NMVOC 6.9 % SOX 0.1 % NH3 92.1 % PM2.5 2.8 % PM10 7.9 % TSP 6.9 % BC 1.0 % CO 0.8 % Pb 0.1 % Cd 8.8 % Hg 2.7 % As 0.0 % Cr 0.1 % Cu 0.0 % Diox 0.1 % Benzo(a) pyrene 1.4 % Benzo(b) fluoranthene 1.7 % Benzo(k) fluoranthene 1.5 % Indeno (1,2,3-cd) pyrene 1.7 % PAH-4 1.6 % HCB 0.0 % PCB 0.0 %
Source: Statistics Norway/ Norwegian Environment Agency

IIR 2017
182
Figure 5.1. Trends for the NH3 emissions for agricultural sources. 1000 tonnes NH3. 1990-2015
Source: Statistics Norway/ Norwegian Environment Agency
Figure 5.2: Trends for the NH3 emissions from manure management. 1000 tonnes NH3. 1990-2015
Source: Statistics Norway/ Norwegian Environment Agency
The total emissions of NH3 from agriculture have been relatively stable but with a slight increase
since 1990. Figure 5.1 and Figure 5.2 shows the NH3 trends for the different agriculture sources.
Combustion of straw is a source to many different emission compounds, which all have the
same decreasing trend, primarly due to reduced amount of straw burned since 1990.
More information is given in the trend chapter, section 2.
0
2
4
6
8
10
12
14
16
Manure management
Inorganic N-fertilizers
Animal manure applied to
soils
Grazing animals
Other aggricultural
emissions
0
0,5
1
1,5
2
2,5
Manure management -
Dairy cattle
Manure management -
Non-dairy cattle
Manure management -
Sheep
Manure management -
Swine
Manure management -
Other animals
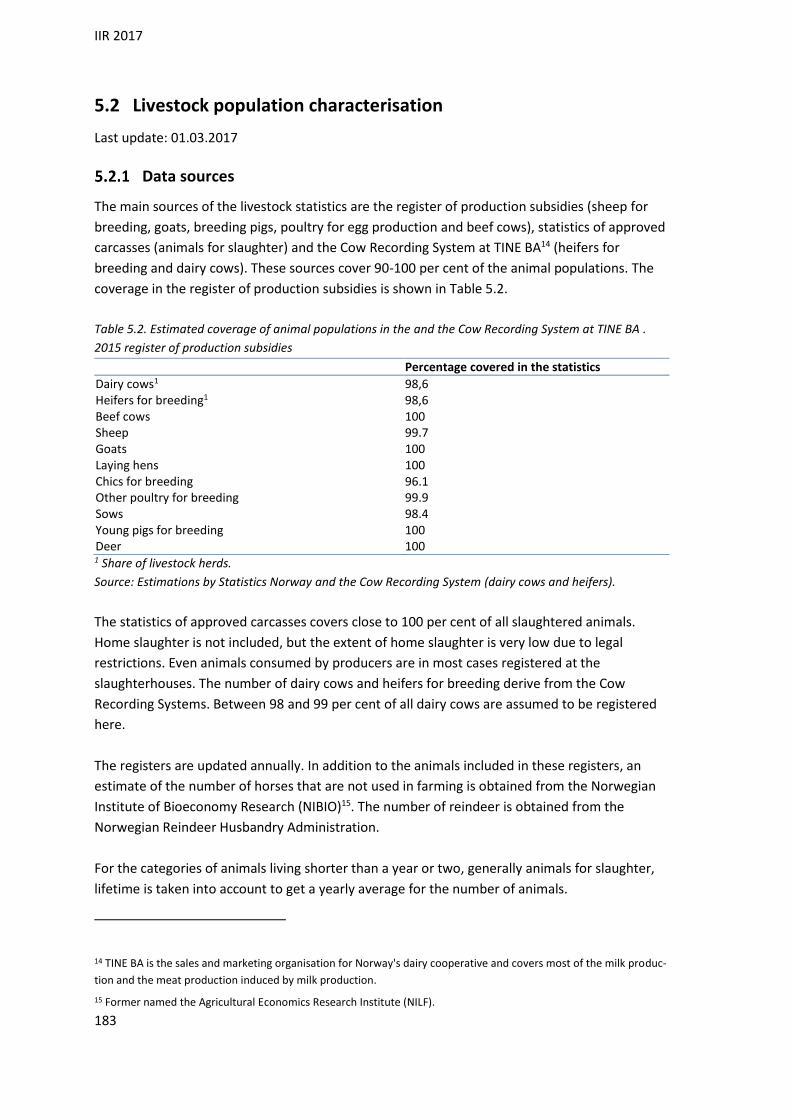
IIR 2017
183
5.2 Livestock population characterisation
Last update: 01.03.2017
Data sources
The main sources of the livestock statistics are the register of production subsidies (sheep for
breeding, goats, breeding pigs, poultry for egg production and beef cows), statistics of approved
carcasses (animals for slaughter) and the Cow Recording System at TINE BA14 (heifers for
breeding and dairy cows). These sources cover 90-100 per cent of the animal populations. The
coverage in the register of production subsidies is shown in Table 5.2.
Table 5.2. Estimated coverage of animal populations in the and the Cow Recording System at TINE BA .
2015 register of production subsidies
Percentage covered in the statistics
Dairy cows1 98,6 Heifers for breeding1 98,6 Beef cows 100 Sheep 99.7 Goats 100 Laying hens 100 Chics for breeding 96.1 Other poultry for breeding 99.9 Sows 98.4 Young pigs for breeding 100 Deer 100 1 Share of livestock herds.
Source: Estimations by Statistics Norway and the Cow Recording System (dairy cows and heifers).
The statistics of approved carcasses covers close to 100 per cent of all slaughtered animals.
Home slaughter is not included, but the extent of home slaughter is very low due to legal
restrictions. Even animals consumed by producers are in most cases registered at the
slaughterhouses. The number of dairy cows and heifers for breeding derive from the Cow
Recording Systems. Between 98 and 99 per cent of all dairy cows are assumed to be registered
here.
The registers are updated annually. In addition to the animals included in these registers, an
estimate of the number of horses that are not used in farming is obtained from the Norwegian
Institute of Bioeconomy Research (NIBIO)15. The number of reindeer is obtained from the
Norwegian Reindeer Husbandry Administration.
For the categories of animals living shorter than a year or two, generally animals for slaughter,
lifetime is taken into account to get a yearly average for the number of animals.
14 TINE BA is the sales and marketing organisation for Norway's dairy cooperative and covers most of the milk produc-
tion and the meat production induced by milk production.
15 Former named the Agricultural Economics Research Institute (NILF).

IIR 2017
184
Method for estimating number of cattle
For dairy cows, additional information from the Cow Recording System concerning annual milk
production and proportion of concentrate in the diet is used (TINE BA Annually). The Cow
Recording System also supplies annual information about slaughter age for heifers and bulls and
data for estimating live weight of dairy cows and heifers for breeding, and also the age of young
cows at their first calving. (Moen, pers. comm.16).
For heifers and bulls for slaughter, animal numbers are based on data from statistics of
approved carcasses which provide data on numbers slaughtered and slaughter weights.
Combined with slaughter age from the Cow Recording System (TINE BA Annually), this gives a
precise estimation of animal life time for each animal slaughtered. One principal draw-back of
this method for estimating animal population is that emissions in all stages of these animals’
lives will be accounted for in the year of slaughter, even though the emissions in the early stages
of the lives of these animals to a large extent took place in the previous year. In a stable
population of animals, this error is automatically adjusted for. Since animal populations are
relatively stable, this error is considered much smaller compared to errors related to estimating
animal year based on animal populations in the register of production subsidies which was
previously used. The data sources used also ensure a better coherence between animal
numbers, life time and weight. Estimated animal years for cattle are given in Table 5.3.
The number of milk cows calving their first time (=heifers for replacement) and their average
age at time of calving is reported by the Cow Recording System (TINE BA Annually) on request
from Statistics Norway. These data date back to 2004. For the years 1990-2003, average fraction
(number of heifers)/(number of milk cows) for the years 2004-2011 is used to estimate number
of heifers based on number of milk cows. Number of heifers for replacement in beef production
is collected from annual reports from Animalia (Norwegian Meat and Poultry Research Center
(www.animalia.no)). Figures exist from 2007. For previous years, the number is estimated with
the same method as for heifers for milk production.
16 Moen, O. (annually): Personal information, email from Oddvar Moen Tine Rådgivning annually.

IIR 2017
185
Table 5.3 Estimated animal years for cattle
Heifers for replacement
Heifers for slaughter
Bulls for slaughter Beef cows1 Dairy cows
1990 311 279 47 020 289 945 8 193 325 896 1995 299 284 47 103 284 237 20 334 310 346 2000 280 121 63 512 285 349 42 324 284 880 2005 255 862 57 619 263 170 54 841 255 663 2006 246 711 58 446 255 963 55 706 250 903 2007 235 282 56 607 247 578 57 609 246 624 2008 240 399 54 831 238 111 60 401 238 550 2009 247 902 53 397 235 689 63 803 235 480 2010 239 839 53 410 230 872 67 110 232 294 2011 239 007 48 778 223 536 68 539 224 721 2012 235 891 42 863 217 050 71 834 229 767 2013 239 386 47 294 220 401 70 969 225 163 2014 244 601 67 624 208 979 73 894 221 032 2015 238 485 63 815 205 073 77 408 217 576
1 Counted animals
Source: Cow Recording System at TINE BA (dairy cows), slaughter statistics and estimations by Statistics
Norway
Method for estimating number of sheep
In the estimations, the sheep population is divided between sheep > one year and sheep < one
year. Data from both the register of production subsidies and slaughter statistics is used in
estimating the number of animals.
Sheep over one year is estimated as the number of sheep registered 1. of January deducted for
the number of sheep slaughtered Jan.-May. The sheep slaughtered later in the year are counted
as living the whole year.
Sheep under one year is estimated as number of sheep under one year registered 1. of January +
number of lambs slaughtered June-December *143/365. Lambs slaughtered before June are
assumed to be registered as sheep under one year the 1. of January. Practically all lambs
slaughtered after June are born in the spring. An expert judgment suggests an average lifetime
of 143 days for slaughtered lambs born in the spring (UMB, pers. comm17 ).
Deviations from FAO statistics
There are some differences between the number of animals used in these calculations and the
FAO statistics. The general reason that animal statistics used in the emission inventory differ
from the statistics delivered to FAO is that the statistics are used for different purposes. Animal
17 UMB (2001): Expert judgement by Department of Animal Science, Ås: Norwegian University of Life Sciences.

IIR 2017
186
statistics used in the inventory has to be categorized so that the categories fit the recommended
methodology and the various emission factors used in the emission estimations. The figures
reported to the FAO are provided by the Norwegian Institute of Bioeconomy Research (NIBIO)18.
NIBIO makes an overall estimation for the agricultural sector, which is the basis for the annual
negotiations for the economic support to the sector. This estimate includes a grouping of all
agricultural activities, comprising area, number of animals and production data. Differences
include:
Different emphasis on the dates for counting, 31.07 and 31.12
NIBIO does not register pigs under 8 weeks, whilst Statistics Norway does. For the
number of animals for slaughter, SN uses the statistics of approved carcasses and
estimates animal years (average population through the year) on basis of this, while
NIBIO uses figures for registered animals at specific dates.
For the number of dairy cows and heifers for replacement, Statistics Norway uses
statistics from the Cow Recording System (TINE BA Annually)
Uncertainties
Activity data
The uncertainty in the data is considered to be within 5 per cent. There is also an uncertainty
related to the fact that some animals are only alive part of the year and how long this part is.
Source specific QA/QC
In 2001, a project was initiated to improve the estimate of the number of animals. This was
completed in 2002. In 2012, a further revision of the numbers of bulls and heifers was
implemented. In 2016, the method for estimating the number of sheep was revised. The revised
data on animal populations form the basis for the emission calculations for all years.
5.3 Nitrogen in animal manure as basis for emission estimates
Access to nitrogen is vital for all plant growth; hence nitrogen is added to the soil from i.a.
animal manure. This causes emissions to air of compounds containing nitrogen at various points.
Of the nitrogen compounds emitted to air from animal manure, N2O, NOX and NH3 are
estimated.
According to the IPPC and LRTAP guidelines, process emissions of nitrogen compounds from use
of animal manure are calculated from the following sources:
1. Manure management systems (N2O, NOX and NH3)
2. Application of manure on soil (N2O, NOX and NH3)
3. Droppings from animals on pastures (N2O and NH3)
4. Leakage of nitrogen through manure management systems and soils (N2O)
18 Former named the Agricultural Economics Research Institute (NILF).

IIR 2017
187
5. Deposition of nitrogen from emissions of NH3 and NOX (N2O)
Though the nitrogen flow is continuously depending on its surroundings (soil characteristics,
temperature, moisture etc.) and the preceding supplies and losses of N, the emission estimates
of each of the sources above are generally done independently of emissions from the other
sources. Figure 5.3 gives an overview of the manure nitrogen flows in the Norwegian
greenhouse gas inventory.
The following decides the amounts of N that are used as the basis for the respective emission
calculations:
The amount of N in manure systems is calculated as total N in manure adjusted for the
N that is dropped on pastures.
N2O emitted during spreading is calculated from the amounts of N in manure storage.
This means that N lost through leaching in manure storage and as N2O, NOX and NH3 in
manure storage and during spreading is not deducted.
NH3 emitted during and after spreading of manure is based on the amounts of N in
manure storage minus N lost as NH3 volatilization in manure storage. NOX emitted
during and after spreading of manure is based on the amounts of N in manure storage,
and not deducting N lost as NH3 or NOX volatilization in manure storage. Losses of N
through leaching and N2O emissions in manure storage are not deducted.
Emissions of N2O and NH3 from pasture are calculated independently of each other, and
are based on the amounts of N estimated in manure dropped during grazing. NOX
emissions from pastures is not estimated.
N2O lost through leaching is based on total N in manure storage and N dropped on
pastures. This means that N emitted as N2O, NOX and NH3 or lost in other ways is not
deducted.
The nitrogen in NH3 and NOX volatilised both during storage, pasture and spreading of
manure is the basis for the calculation of N2O emissions from atmospheric deposition.
How the amounts of N are estimated in the various emission estimates, is described in
more details in the respective chapters below.

IIR 2017
188
1 NMS is the N basis for the N2O and NOX emission estimations, while (NMS - N lost as NH3 in manure storage systems) is the N basis for the
NH3 emission estimations.
Figure 5.3 Overview of the manure nitrogen flows in the Norwegian greenhouse gas inventory
N2O
Total manure N produced = Animal population x N excretion per animal =
NP + NMS
Manure spread on managed soils (NMS)
1Pasture (NP)
N2O
Manure storage systems (NMS)
Deposition of N fromNH3 and NOX missions(NDEP = NH3-N+NOX-N)
N2O
Leaching and run-off from managed soils and pasture
(NP + NMS) * 0,22
N2O
NH3
N2O NH3 NH3
Leaching and run-offfrom MS
N2O
= emissions = N flow= N flow from NH3
and NOX emissions
NOX
NOX
IIR 2017
189
5.4 Emissions from manure management
NFR 3B
Last update:
Description
Manure management in Norway is a source of emissions to air of NH3, NOX, NMVOC and PM.
NH3 emissions from manure management
Description
The dominating pollutant emitted from this source category are NH3 (NFR 3B). Emissions from
cattle are most important in Norway. Emissions of NH3 from manure depend on several factors,
e.g. type of animal, nitrogen content in fodder, manure management, climate, time of spreading
of manure, cultivation practices and characteristics of the soil. In the IPCC default method a NH3
volatilisation fraction of 20 per cent is used for the total N excretion by animals in the country.
However, in the Norwegian emission inventory, yearly updated NH3 volatilisation values are
used, because this is expected to give more correct values for Norway. The estimated national
volatilisation fractions from manure have differed between 19-21 per cent since 1990.
Method
A model is used for calculating the emissions of NH3 from manure management. In Norway, all
animal excreta that are not deposited during grazing are managed as manure. The estimations
are made in accordance with the IPCC tier 2 method (IPCC 2006), using Norwegian values for N
in excreta from different animals according to Table 5.4. The rationale for the Norwegian values
for N in excreta is given in Karlengen et al. (2012). The N-excretion factors for cattle, poultry and
pigs have been scientifically investigated, while the remaining categories have been given by
expert judgements (Karlengen et al. 2012). Based on typical Norwegian feedstock ratios, the
excretion of nitrogen (N) were calculated by subtracting N in growth and products from
assimilated N and P. Comparisons have also been made with emission factors used in other
Nordic countries and IPCC default factors.
The factors for cattle are based on equations using animal weight, production (milking cows),
life time (young cattle) and protein content in the fodder as activity data.
The Nordic feed evaluation system (NorFor) was used to develop the nitrogen factors for cattle.
Excretions of N in the manure were calculated as the difference between their intake, and the
sum of what is excreted in milk, fetus and deposited in the animal itself. The procedure used for
calculating the excretion of feces and N consisted of two steps:
1. Simulations in ”NorFor” were conducted to gain values for the feces/manure
characteristics covering a wide variation of feed characteristics ( N content) and
production intensities (milk yield/meat production).
2. The results from the simulations were used to develop regression equations between
feces/manure characteristics and parameters related to the diet (N content) and animal

IIR 2017
190
characteristics (milk yield, weight, age etc.).
Calculations of N-factors based on these equations have been made back to 1990 for cattle. For
poultry and pigs, N-factors have been estimated for 2011 in Karlengen et al. (2012). The factors
used until this update were estimated in 1988 (Sundstøl & Mroz 1988), and are regarded as still
valid for 1990. A linear interpolation has been used for the years between 1990 and 2011. For
the remaining animal categories the N in excreta are considered constant throughout the time
series. The factors are shown in Table 5.4. The factors for total N are used in the estimations of
N2O emissions, and ammonium N are used in the estimations of NH3 and NOX emissions.
Norwegian values are also used for the fraction of total excretion per species for each
management system (MS) and for pasture. The fractions are updated every year.
Table 5.4. N in excreta from different animals1. 2015. kg/animal/year unless otherwise informed in
footnote
Total N Ammonium N
Dairy cow 129.0 73.5 Beef cow 64.9 36.0 Replacement heifer2 86.6 47.6 Bull for slaughter2 69.8 42.2 Finishing heifer2 67.5 41.1 Young cattle3 43.97 25.59 Horses 50.0 25.0 Sheep < 1 year 7.7 4.3 Sheep > 1 year 11.6 6.38 Goats 13.3 7.9 Pigs for breeding 23.5 15.7 Pigs for slaughtering4 3.2 2.13 Hens 0.670 0.29 Chicks bred for laying hens4 0.046 0.017 Chicks for slaughtering4 0.030 0.011 Ducks, turkeys/ goose for breeding 2.0 0.8 Ducks, turkeys/ goose for slaughtering4 0.4 0.18 Mink 4.3 1.7 Foxes 9.0 3.6 Reindeer 6.0 2.7 Deer 12.0 5.4 1 Includes pasture. 2 Factors for excreted nitrogen apply for the whole life time of animals, and nitrogen is calculated when animals are
slaughtered/replaced. 3 Average factor for all heifers for slaughter and replacement and bulls for slaughter, per animal and year. 4 Per animal. For these categories, life time is less than a year. This means that the number of animals bred in a year is higher than
the number of stalls (pens).
Source: Karlengen et al. (2012) and estimations by Statistics Norway
Ammonia, together with NOX, volatilised from manure storage is part of the estimations of
indirect N2O emissions from atmospheric deposition. A model is used for calculating the
emissions of ammonia from manure management and from spreading of manure. The principle
of the model is illustrated in Figure 5.4.
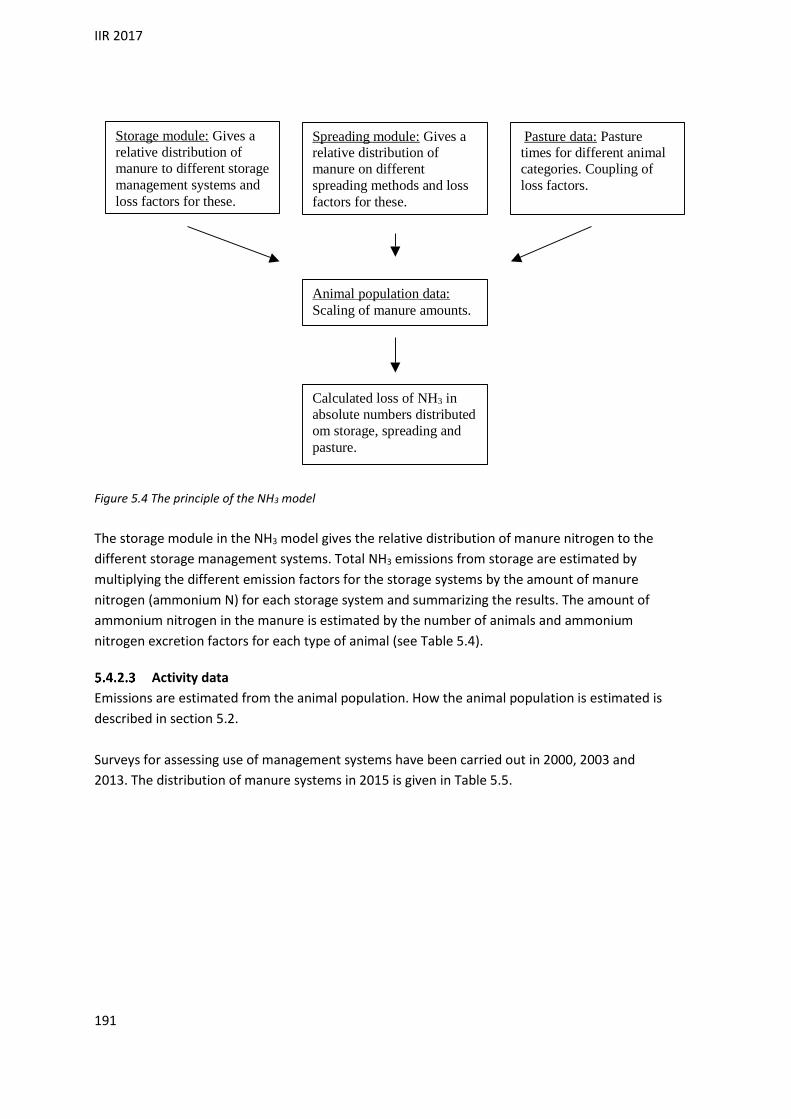
IIR 2017
191
Figure 5.4 The principle of the NH3 model
The storage module in the NH3 model gives the relative distribution of manure nitrogen to the
different storage management systems. Total NH3 emissions from storage are estimated by
multiplying the different emission factors for the storage systems by the amount of manure
nitrogen (ammonium N) for each storage system and summarizing the results. The amount of
ammonium nitrogen in the manure is estimated by the number of animals and ammonium
nitrogen excretion factors for each type of animal (see Table 5.4).
Activity data
Emissions are estimated from the animal population. How the animal population is estimated is
described in section 5.2.
Surveys for assessing use of management systems have been carried out in 2000, 2003 and
2013. The distribution of manure systems in 2015 is given in Table 5.5.
Spreading module: Gives a
relative distribution of
manure on different
spreading methods and loss
factors for these.
Pasture data: Pasture
times for different animal
categories. Coupling of
loss factors.
Storage module: Gives a
relative distribution of
manure to different storage
management systems and
loss factors for these.
Animal population data:
Scaling of manure amounts.
Calculated loss of NH 34 in
absolute numbers distributed
om storage, spreading and
pasture.

IIR 2017
192
Table 5.5 Fraction of total excretion per animal category for each management system and for pasture
(MS) used in the estimations. 2015
In-house slurry pit
Tank without cover
Tank with cover
In-house deep litter
Dry lot Heaps Pasture range and paddock
Dairy cattle 0.60 0.05 0.12 0.02 0.01 0.03 0.17
Other cattle 0.50 0.04 0.10 0.02 0.01 0.02 0.31
Swine 0.63 0.11 0.20 0.02 0.00 0.04 0.00
Poultry 0.03 0.00 0.00 0.00 0.00 0.97 0.00
Sheep 0.29 0.00 0.00 0.07 0.01 0.18 0.45
Goat 0.16 0.00 0.00 0.03 0.02 0.43 0.37
Horse 0.19 0.00 0.00 0.03 0.03 0.51 0.25
Fur bearing animals
0.25 0.00 0.00 0.04 0.03 0.68 0.00
Source: Data for storage systems from Statistics Norway (Statistics Norway et al. 2015), data for pasture
times from (TINE BA Annually) (Dairy cattle, goat), Statistics Norway's Sample Survey 2001 (Statistics
Norway 2002b)
Data on storage systems for other years are not available. Separate estimations of the effects on
emissions of the assumed changes in storage systems since 1990 show that these assumed
changes do not impact significantly. For the intermediate years 2004-2012 between the surveys
of 2003 and 2013, the distribution of management system has been estimated using a linear
interpolation of changes between 2003 and 2013, for each system. The 2013 data on storage
systems will be used in approaching years until newer data becomes available. The surveys on
management systems do not include pasture. Data for pasture times for dairy cattle and dairy
goat are however annually updated in the Cow Recording System, while for the other animals,
data from Sample survey of agriculture and forestry for 2001 at Statistics Norway is used. The
data source for pasture times for dairy cattle in 2015 has however not been updated since 2013.
In the manure surveys of 2000 and 2013, the manure of each management system is distributed
by all combinations of the following regions and productions:
Regions:
South-Eastern Norway
Hedmark and Oppland
Rogaland
Western Norway
Trøndelag
Northern Norway

IIR 2017
193
Production19:
Cattle
Pigs
Sheep
Goats and horses
Poultry
Emission factors
Emission factors vary with production and storage system; in the model there is no variation
between regions. The factors are based on data from Denmark, Germany and Netherlands, since
measurements of NH3-losses in storage rooms have so far not been carried out in Norway. The
factors are shown in Table 5.6.
Table 5.6. Emission factors for various storage systems and productions. Per cent losses of N of ammonium
N
Storage system Manure cellar
for slurry Open manure pit for slurry
Manure pit for slurry with lid
Open flag-stones
Indoor built up/deep litter
Outdoor built up/enclosure
Storage for solid dung and urine
Gutter Gutter Drainage to gutter
Cattle, milking cow: Loss from animal room 5 5 5 5 8 8 5 Loss from storage room 2 9 2 2 15 15 15 Total loss 7 14 7 7 23 23 20 Pigs: Loss from animal room 15 15 15 15 15 15 20 Loss from storage room 4 6 2 2 25 25 30 Total loss 19 21 17 17 40 40 50 Sheep and goats: Loss from animal room 5 5 5 5 8 8 5 Loss from storage room 2 6 2 2 10 10 10 Total loss 7 11 7 7 18 18 15 Poultry: Loss from animal room 12 10 12 12 25 25 25 Loss from storage room 15 15 15 15 25 25 25 Total loss 27 25 27 27 50 50 50 Other animals: Loss from animal room 5 NO NO NO 15 15 15 Loss from storage room 10 NO NO NO 15 15 15 Total loss 15 NO NO NO 30 30 30
Source: Morken et al. (2005)
The factors are combined with activity data from the Statistics Norway survey of different
19 The grouping of animals are different in the two surveys. Cattle is one category in the 2000 survey and three
categories in the 2013 survey. Goats are grouped with sheep in the 2000 survey, but with horses in the 2013 survey.
Horses are grouped with other animals in the 2000 survey. Fur bearing animals are not included in the 2013 survey,
but added to the horse/goat category. All manure from fur bearing animals are considered to be stored in heaps.

IIR 2017
194
storage systems in 2000 (Gundersen & Rognstad 2001), the Sample survey of agriculture and
forestry 2003 (Statistics Norway 2004) and Use of inorganic and organic fertilisers in agriculture
2013 (Statistics Norway et al. 2015), and emission factors for NH3 emissions from storage of
manure and stalled animals are calculated for production and region (Table 5.7). To estimate
losses, these emission factors are in turn multiplied with the amount of manure (based on
number of animals and N-factors per animal, Table 5.4). The changes in storage systems from
2003 to 2013 have been linearly interpolated in the intermediate years. From 1990-2002 and
from 2013, the number of animals is the only activity data that differs from year to year.
Table 5.7. Average emission factors for the manure storage systems used, distributed on type of animal
production and region. 2015. Per cent of ammonium N
South-Eastern Norway
Hedmark/ Oppland
Rogaland Western Norway
Trøndelag Northern Norway
Cattle 10.3 9.4 7.8 7.6 7.8 7.8 Pigs 23.5 21.9 19.2 19.1 20.2 19.2 Sheep 13.3 12.6 8.9 10.7 11.3 11.9 Poultry 50.0 48.5 49.1 49.9 48.9 50.0 Goats, horses and fur-bearing animals
29.4 27.6 29.8 24.7 29.7 19.2
Source: Statistics Norway, NH3-model estimations.
Uncertainties
Uncertainty estimates are provided in Appendix C.
Activity data
Emissions are estimated from the animal population. The data for the number of animals are
considered to be known within 5 per cent.
For the emissions of NH3 from manure management, Norwegian data for N in excreta are used.
The nitrogen excretion factors are uncertain, but the range is considered to be within 15 per
cent (Rypdal 1999). The uncertainty has not been estimated for the revised nitrogen excretion
factors from Karlengen et al. (2012), and in the key category analysis the uncertainty estimate
for the country specific nitrogen excretion factors from 1999 is still used as the best available
estimate. This can be considered as a conservative estimate of the uncertainty since it is
expected that the new nitrogen excretion factors have a lower uncertainty. The uncertainty is
connected to differences in excretion between farms in different parts of the country, the fact
that the survey farms may not have been representative, general measurement uncertainty and
the fact that fodder and fodder practices have changed since the factors were determined.
There is also an uncertainty connected to the division between different storage systems for
manure, which is considered to be within 10 per cent, and the division between storage and
pasture, which is considered to be within 15 per cent.
Emission factors
Ammonia emissions from agriculture are estimated based on national conditions. There are
uncertainties in several parameters as fraction of manure left on pastures, amount of manure,
conditions of storage, conditions of spreading and climate conditions. An uncertainty analysis for

IIR 2017
195
the revised NH3 model, which has been in use since 2003, has not been performed. However,
the revision of the model is believed to have reduced the uncertainty. Also the new estimations
of nitrogen excretion from animals (Karlengen et al. 2012) are believed to have reduced
uncertainty further.
NOX emissions from manure management
Description
Emissions from NOX from animal manure is included in the inventory in the 2017 submission.
The amounts of N from NOX emissions from manure management systems, spreading of manure
and droppings on pastures are however small, being about 5 per cent of the N in NH3 emissions
from the same sources.
Method
In Norway, all animal excreta that are not deposited during grazing are managed as manure.
Norwegian values for N in excreta from different animals according to Table 5.4 are used. How
these are estimated is described in section 5.4.2.2. Norwegian values are also used for the
fraction of total excretion per species for each management system (MS) and for pasture. The
fractions are updated every year.
NOX volatilised from manure storage is part of the estimations of indirect N2O emissions from
atmospheric deposition.
Activity data
Emissions are estimated from the animal population. How the animal population is estimated is
described in section 5.2.
Surveys for assessing use of management systems have been carried out in 2000, 2003 and
2013. The distribution of manure systems used in the 2015 inventory is given in Table 5.8.
Norway has developed calculation models for estimating N2O and NH3 emissions. The basic data
from the 2013 Manure Survey is however treated a little differently in the two models, and
different manure storage categories are used. For estimating NOX emissions, the setup for the
N2O estimations was more suitable to use than the NH3 model. This means that the NOX
estimations are in better coherence with the calculations for the N2O emissions than with the
NH3 calculations regarding the use of the data from the manure surveys. This also explains the
differences between table Table 5.8 and Table 5.5.
Table 5.8 Fraction of total excretion per specie for each management system and for pasture (MS) used in
the estimations of NOX. 2015
Pit storage below animal
confine-ment
Liquid / slurry
without cover
Liquid / slurry with cover
Solid storage
Cattle and
swine deep
bedding
Dry lot
Pasture range and
paddock
Poultry manure
Dairy cattle 0.01 0.15 0.68 0.00 0.00 0.00 0.17
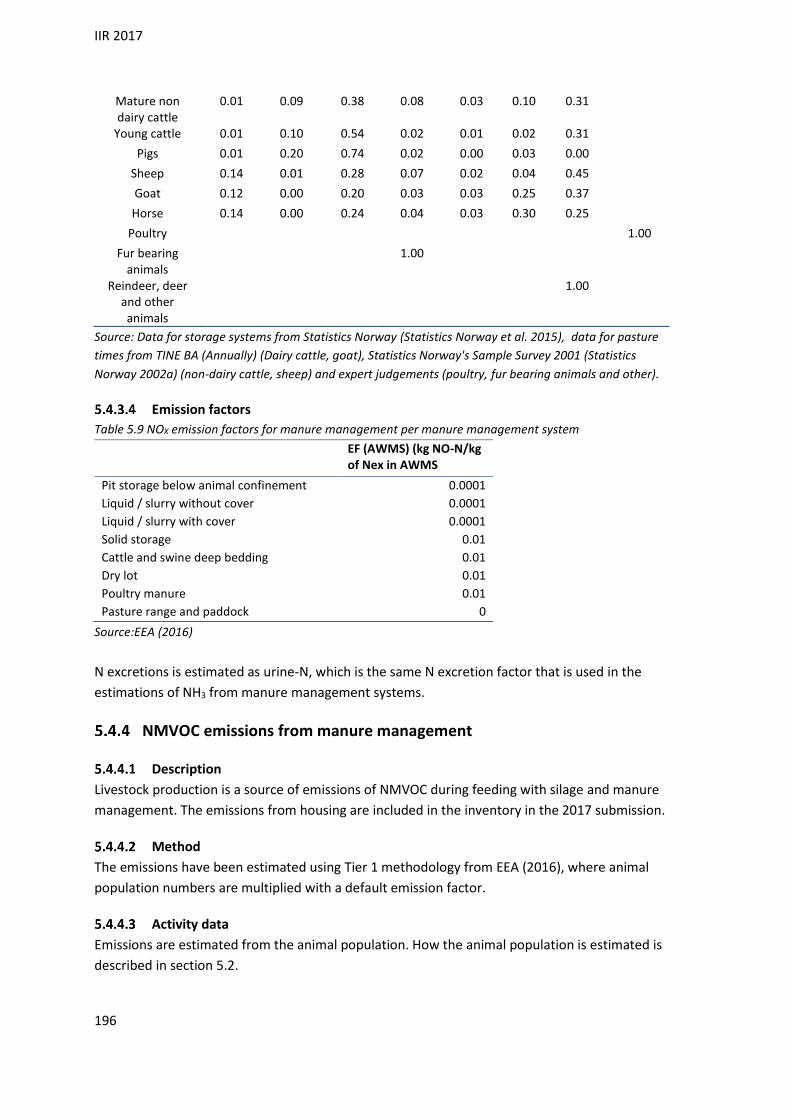
IIR 2017
196
Mature non dairy cattle
0.01 0.09 0.38 0.08 0.03 0.10 0.31
Young cattle 0.01 0.10 0.54 0.02 0.01 0.02 0.31
Pigs 0.01 0.20 0.74 0.02 0.00 0.03 0.00
Sheep 0.14 0.01 0.28 0.07 0.02 0.04 0.45
Goat 0.12 0.00 0.20 0.03 0.03 0.25 0.37
Horse 0.14 0.00 0.24 0.04 0.03 0.30 0.25
Poultry
1.00
Fur bearing animals
1.00
Reindeer, deer and other animals
1.00
Source: Data for storage systems from Statistics Norway (Statistics Norway et al. 2015), data for pasture
times from TINE BA (Annually) (Dairy cattle, goat), Statistics Norway's Sample Survey 2001 (Statistics
Norway 2002a) (non-dairy cattle, sheep) and expert judgements (poultry, fur bearing animals and other).
Emission factors
Table 5.9 NOX emission factors for manure management per manure management system
EF (AWMS) (kg NO-N/kg of Nex in AWMS
Pit storage below animal confinement 0.0001
Liquid / slurry without cover 0.0001
Liquid / slurry with cover 0.0001
Solid storage 0.01
Cattle and swine deep bedding 0.01
Dry lot 0.01
Poultry manure 0.01
Pasture range and paddock 0
Source:EEA (2016)
N excretions is estimated as urine-N, which is the same N excretion factor that is used in the
estimations of NH3 from manure management systems.
NMVOC emissions from manure management
Description
Livestock production is a source of emissions of NMVOC during feeding with silage and manure
management. The emissions from housing are included in the inventory in the 2017 submission.
Method
The emissions have been estimated using Tier 1 methodology from EEA (2016), where animal
population numbers are multiplied with a default emission factor.
Activity data
Emissions are estimated from the animal population. How the animal population is estimated is
described in section 5.2.

IIR 2017
197
Emission factors
Emission factors are taken from EEA (2016), see Table 5.10 Default Tier 1 EF for NMVOCTable
5.10.
Table 5.10 Default Tier 1 EF for NMVOC
EF, with silage feeding
EF, without silage feeding
Livestock NMVOC, kg AAP-1. a-1
Dairy cattle 17.937 8.047 Non-dairy cattle1 8.902 3.602 Sheep 0.279 0.169 'Swine' (Fattening pigs2) - 0.551 'Swine (Sows) - 1.704 Goats 0.624 0.542 Horses 6.028 5 4.275 Laying hens (laying hens and parents)
- 0.165
Broilers (broilers and parents) - 0.108 Turkeys3 - 0.489 Other poultry (ducks, geese)3 - 0.489 Other animals (Fur animals) - 1.941 Other animals (Reindeer4) - 0.045
(1) Includes young cattle, beef cattle and suckling cows (2) Includes piglets from 8 kg to slaughtering (3) Based on data for turkeys (4) Assume 100% grazing
(5) EMEP/EEA factor is 7.781, but has been reduced to 6.028 which is mean value between the factors with and
without silage because silage for horses normally is dryer than other silage
Source: EEA (2016) and expert judgement by Dag Austbø (see note 5)
The share of silage in fodder intake is registered for dairy cows in the Cow recording system, see
Table 5.11.
Table 5.11 Silage fodder intake, dairy cows, and estimated emission factor, dairy cows.
Silage fodder, average share of daily intake
Estmimated NMVOC, kg AAP-1. a-1
1990 38.1 11.8
1991 38.1 11.8
1992 38.1 11.8
1993 38.1 11.8
1994 40.4 12.0
1995 39.6 12.0
1996 40.0 12.0
1997 40.0 12.0
1998 41.2 12.1
1999 41.4 12.1
2000 41.6 12.2
2001 42.7 12.3
2002 42.2 12.2
2003 43.3 12.3

IIR 2017
198
2004 42.9 12.3
2005 43.6 12.4
2006 43.2 12.3
2007 43.9 12.4
2008 44.4 12.4
2009 44.8 12.5
2010 45.6 12.6
2011 45.3 12.5
2012 45.1 12.5
2013 45.3 12.5
2014 45.3 12.5
Source: Cow recording system (TINE BA Annually)
Amounts of silage fodder is not registered systematically for the other ruminants, and the share
of silage in fodder intake is therefore based on expert judgments for these groups of animals.
Table 5.12 Silage as share of total feed intake and estimated emission factor for NMVOC emission per
animal, other ruminants
Livestock Silage fodder, average share of daily intake
Estimated average EF, NMVOC, kg AAP-1. a-1
Growing cattle and mature non dairy cattle
50 1 6.25
Sheep 33 2 0.21
Goats 40 3 0.57
Horses 33 4 4.85 2 Expert judgement Finn Avdem, Nortura. July 2016 3 Judgement by Statistics Norway. November 2016. 4 Expert judgement Dag Austbø, Norwegian University of Life Sciences. June 2016
Source: EEA (2016)
PM emissions from manure management
Method
Tier 1 methodolgy from EEA guidebook 2013 p. 16-17.
Activity data
Emissions are estimated from the animal population. How the animal population is estimated is
described in section 5.2.
Emission factors
Default Tier 1 emission factors are used, see Table 5.13.
Table 5.13 Default Tier 1 estimates of EF for particle emissions from animal husbandry (housing)
EF,TSP EF, PM10 EF, PM2,5 Source
Livestock kg AAP-1. a-1 kg AAP-1. a-1 kg AAP-1. a-1
Dairy cows 1.38 0.63 0.41 EEA (2016)
Other cattle 0.59 0.27 0.18 EEA (2016)
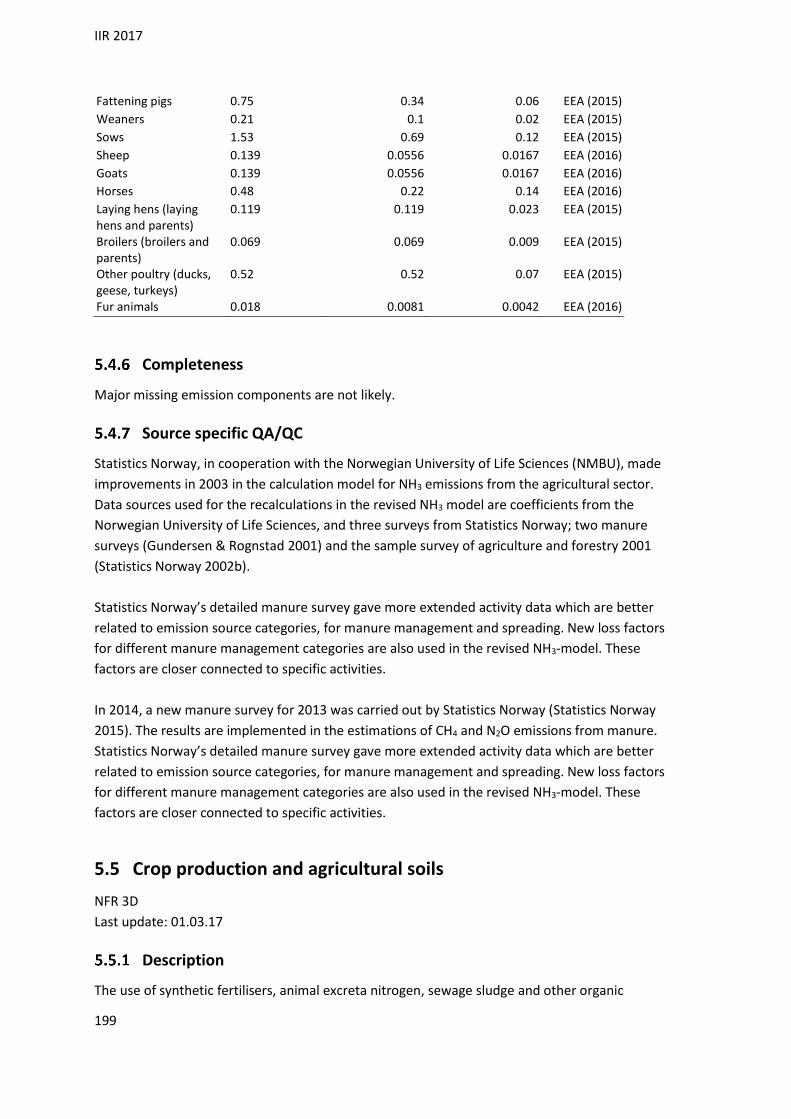
IIR 2017
199
Fattening pigs 0.75 0.34 0.06 EEA (2015)
Weaners 0.21 0.1 0.02 EEA (2015)
Sows 1.53 0.69 0.12 EEA (2015)
Sheep 0.139 0.0556 0.0167 EEA (2016)
Goats 0.139 0.0556 0.0167 EEA (2016)
Horses 0.48 0.22 0.14 EEA (2016)
Laying hens (laying hens and parents)
0.119 0.119 0.023 EEA (2015)
Broilers (broilers and parents)
0.069 0.069 0.009 EEA (2015)
Other poultry (ducks, geese, turkeys)
0.52 0.52 0.07 EEA (2015)
Fur animals 0.018 0.0081 0.0042 EEA (2016)
Completeness
Major missing emission components are not likely.
Source specific QA/QC
Statistics Norway, in cooperation with the Norwegian University of Life Sciences (NMBU), made
improvements in 2003 in the calculation model for NH3 emissions from the agricultural sector.
Data sources used for the recalculations in the revised NH3 model are coefficients from the
Norwegian University of Life Sciences, and three surveys from Statistics Norway; two manure
surveys (Gundersen & Rognstad 2001) and the sample survey of agriculture and forestry 2001
(Statistics Norway 2002b).
Statistics Norway’s detailed manure survey gave more extended activity data which are better
related to emission source categories, for manure management and spreading. New loss factors
for different manure management categories are also used in the revised NH3-model. These
factors are closer connected to specific activities.
In 2014, a new manure survey for 2013 was carried out by Statistics Norway (Statistics Norway
2015). The results are implemented in the estimations of CH4 and N2O emissions from manure.
Statistics Norway’s detailed manure survey gave more extended activity data which are better
related to emission source categories, for manure management and spreading. New loss factors
for different manure management categories are also used in the revised NH3-model. These
factors are closer connected to specific activities.
5.5 Crop production and agricultural soils
NFR 3D
Last update: 01.03.17
Description
The use of synthetic fertilisers, animal excreta nitrogen, sewage sludge and other organic

IIR 2017
200
fertilisers applied to soils, and droppings on pastures result in emissions of NH3. Agricultural
activities are also a source of NOX, NMVOC and non-combustion emissions of particles.
NH3 emissions from agricultural soils
Method
NH3 emissions from use of inorganic N-fertilizers
NFR 3Da1
The calculations of NH3 emissions from the use of synthetic fertiliser are based on the amounts
of nitrogen supplied and emission factors for the percentage of nitrogen emitted as NH3 during
spreading. More information about the calculation of fracGASF is given in Miljødirektoratet (2016)
Annex IX, section 3.3. The amount of nitrogen supplied is estimated based on data for total
annual amount of fertiliser sold in Norway and its nitrogen content, corrected for the amount of
synthetic fertiliser applied in forest. The resulting amount is expected to be the amount applied
on agricultural fields.
NH3 emissions from animal manure applied to soils
NFR 3Da2a
In Norway, all animal excreta that are not deposited during grazing are used as manure and
applied to soils. Further, it is assumed that animals do not emit N2O themselves, NH3 emissions
in storage, and N2O emissions in storage and manure application are all estimated individually
and the emission estimates are based on the same nitrogen pool.
NH3 emissions from spreading of manure depend on several factors, e.g. climate and time of
spreading of manure, type of cultivation and cultivation practices and characteristics of the soil.
In the IPCC default method, a NH3 volatilisation fraction of 20 per cent is used for the total N
excretion by animals in the country. However, in the Norwegian emission inventory, yearly
updated national ammonia volatilisation values are used, because this is considered to give
more correct values for Norway. The estimated national volatilization fractions have differed
between 18-20 per cent since 1990.
Emissions of ammonia are calculated for spreading of manure on cultivated fields and meadow.
The total amount of manure nitrogen that is spread is estimated by the number of animals and
nitrogen excretion factors for each type of animal, and is thereafter distributed on different
spreading methods based on national data. The nitrogen basis for the estimated amounts of
nitrogen that volatilises as NH3 during spreading has been corrected for the amount of nitrogen
in the NH3 that volatilises during storage, unlike the method used in the N2O estimations. N lost
as N2O and leaching during storage is however not deduced from the N basis. Total emissions
from spreading are estimated by emission factors for each different spreading methods used
multiplied by the amount of manure nitrogen spread with the respective method.
NH3 emissions from sewage sludge applied to soils
NFR 3Da2b
To calculate NH3 emissions from sewage sludge used as fertiliser, the fraction of N in manure

IIR 2017
201
lost as NH3 is used (fracGASM). The loss equals to total N in sewage sludge multiplied by fracGASM.
NH3 emissions from other organic fertilisers applied to soils
NFR 3Da2c
Emissions of NH3 from other organic fertilisers applied to soils are estimated by multiplying
estimated amounts of N in organic fertilisers with the fracGASM-factor. The annual amount of
nitrogen in other organic fertilisers applied in agriculture during the period 1990-2013 was
assessed in 2014 (Aquateam COWI AS 2014). Other organic fertilisers comprise three main
categories; biomanure and other biological residues from biogas plants, compost from
composting plants and other commercial organic fertiliser products sold. This was a practically
non-existent source of nitrogen before 2000. Since then, it has varied very much over the years.
In 2013, the nitrogen from this source contributed to about 25 per cent of the nitrogen in the
sewage sludge applied. A new assessment has to take place to get figures for 2014 and later.
NH3 emissions from urine and dung deposited by grazing animals
NFR 3Da3
Animal population data, data for pasture times, and factors for the nitrogen amount in excreta
for different animal categories give the nitrogen amounts for the animal categories on pastures.
The amount of animal manure dropped on pastures is given by estimations of total N in manure
excreted from animals and data for pasture times (Table 5.5). It is assumed that the share of
time the animals spend on pastures corresponds to the share of total N produced that is
dropped during grazing. The emissions are calculated by the estimated amount of N deposited
during grazing multiplied with specific emission factors by animal category (see Table 5.19) are
used.
Activity data
NH3 emissions from use of synthetic fertiliser
The Norwegian Food Safety Authority calculates a total value for annual consumption of
synthetic fertilisers in Norway based on sales figures. These data are corrected for the amount
of fertiliser used in forests, which is provided by the Norwegian Institute of Bioeconomy
Research.
For the calculation of the emission of NH3 we need a specification of the use of different types of
synthetic fertiliser since the NH3 emission factor vary between different types. This is given by
the Norwegian Food Safety Authority for the years from 2000. Due to lack of data for the years
before 2000, we have to assume that the percentual distribution between the usage of different
fertiliser types is the same as in 1994 for these years.
Animal manure applied to soil and pasture
There are several sources of activity data on spreading of manure. The main sources are the
manure survey in 2000 and in 2013 by Statistics Norway and Statistics Norway et al. (2015)
various sample surveys of agriculture and forestry 1990-2007 and the animal population.
Table 5.14 shows the estimated changes in emissions after implementing the data from the
2013 survey.

IIR 2017
202
Table 5.14. Estimated NH3-emissions from manure management, pasture and application of manure in
2013, based on old and new survey data. Tonnes NH3
Based on survey data from 2000 and 2003
Based on survey data from 2013
Total 22 084 21 093 Manure storage 6 015 6 483
Pasture 919 938
Application of manure 15 150 13 673
Source: Statistics Norway, emission statistics
The survey of 2013 (Statistics Norway et al. 2015) shows that the changes in practices for
manure handling from 2003 to 2013 had lowered the NH3 emissions in 2013 by about 5 per cent,
all other factors remaining equal. There was however a distribution of emissions from storage
systems to application. The first increased about 8 per cent, while the latter decreased
approximately 10 per cent.
Animal population is updated annually. The animal population estimation methodology is
described in section 6.2. Data from the manure survey do only exist for 2000 and 2013, while
the data from the sample surveys have been updated for several, but not all, years. The manner
of spreading the manure also affects the NH3 emission estimates.
Data for time on pasture and share of animals on pasture are collected from the Sample Survey
in Statistics Norway 2001 and from TINE BA (TINE BA is the sales and marketing organisation for
Norway's dairy cooperative and covers most of the milk production). The data from TINE BA
comprises pasture data for goats and milking cows and are updated annually. All other pasture
data are from the Statistics Norway Sample survey 2001. The parameters used in the
calculations and their sources are shown in Table 5.15.
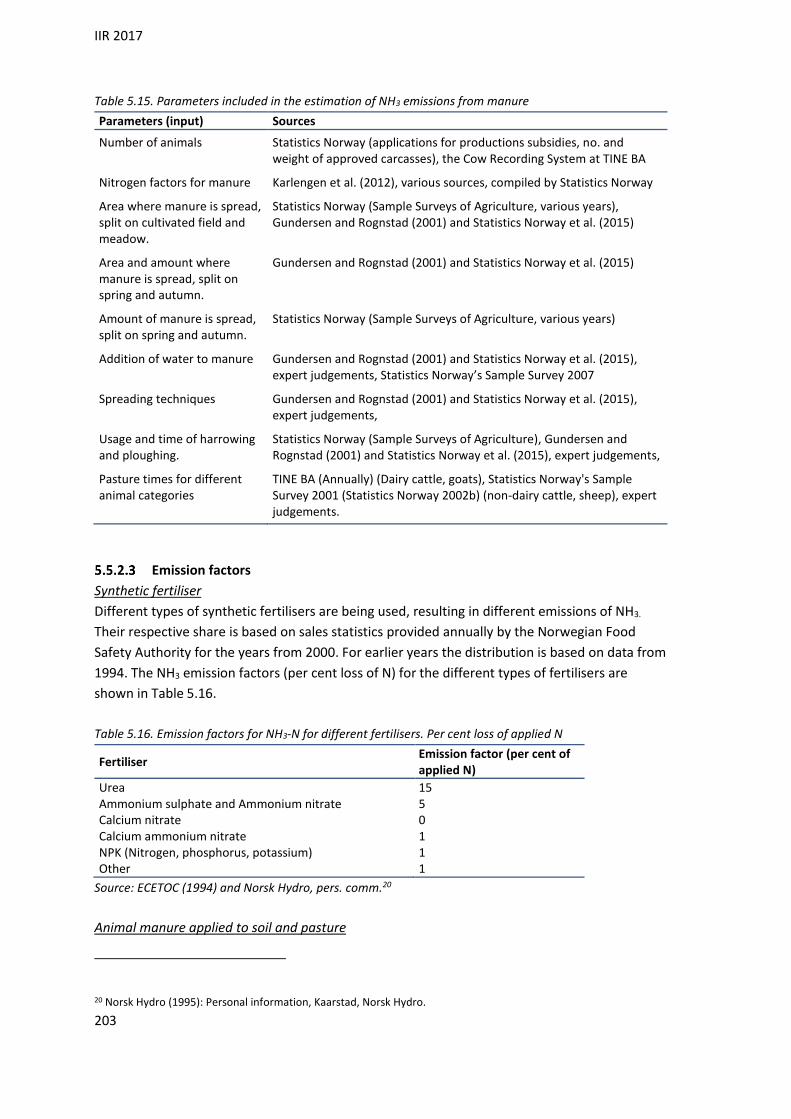
IIR 2017
203
Table 5.15. Parameters included in the estimation of NH3 emissions from manure
Parameters (input) Sources
Number of animals Statistics Norway (applications for productions subsidies, no. and weight of approved carcasses), the Cow Recording System at TINE BA
Nitrogen factors for manure Karlengen et al. (2012), various sources, compiled by Statistics Norway
Area where manure is spread, split on cultivated field and meadow.
Statistics Norway (Sample Surveys of Agriculture, various years), Gundersen and Rognstad (2001) and Statistics Norway et al. (2015)
Area and amount where manure is spread, split on spring and autumn.
Gundersen and Rognstad (2001) and Statistics Norway et al. (2015)
Amount of manure is spread, split on spring and autumn.
Statistics Norway (Sample Surveys of Agriculture, various years)
Addition of water to manure Gundersen and Rognstad (2001) and Statistics Norway et al. (2015), expert judgements, Statistics Norway’s Sample Survey 2007
Spreading techniques Gundersen and Rognstad (2001) and Statistics Norway et al. (2015), expert judgements,
Usage and time of harrowing and ploughing.
Statistics Norway (Sample Surveys of Agriculture), Gundersen and Rognstad (2001) and Statistics Norway et al. (2015), expert judgements,
Pasture times for different animal categories
TINE BA (Annually) (Dairy cattle, goats), Statistics Norway's Sample Survey 2001 (Statistics Norway 2002b) (non-dairy cattle, sheep), expert judgements.
Emission factors
Synthetic fertiliser
Different types of synthetic fertilisers are being used, resulting in different emissions of NH3.
Their respective share is based on sales statistics provided annually by the Norwegian Food
Safety Authority for the years from 2000. For earlier years the distribution is based on data from
1994. The NH3 emission factors (per cent loss of N) for the different types of fertilisers are
shown in Table 5.16.
Table 5.16. Emission factors for NH3-N for different fertilisers. Per cent loss of applied N
Fertiliser Emission factor (per cent of applied N)
Urea 15 Ammonium sulphate and Ammonium nitrate 5 Calcium nitrate 0 Calcium ammonium nitrate 1 NPK (Nitrogen, phosphorus, potassium) 1 Other 1
Source: ECETOC (1994) and Norsk Hydro, pers. comm.20
Animal manure applied to soil and pasture
20 Norsk Hydro (1995): Personal information, Kaarstad, Norsk Hydro.

IIR 2017
204
Emission factors for spreading of stored manure vary with spreading method (Gundersen &
Rognstad 2001), water content (Statistics Norway 2007), type and time of treatment of soil
(Gundersen & Rognstad 2001), time of year of spreading (Gundersen & Rognstad
2001);Gundersen 2015, (Statistics Norway 2007), cultivation, and region. The basic factors used
are shown in Table 5.17.
Table 5.17. Emission factors for NH3-N for various methods of spreading of manure. Per cent of ammonium
N
Western and northern Norway
Southern and eastern Norway
Spring Summer Autumn Spring Summer Autumn
Meadow Surface spreading 0.5 0.6 0.4 0.5 0.6 0.4 Injection 0.1 0.1 0.05 0.1 0.1 0.05 Water mixing 0.3 0.3 0.2 0.3 0.3 0.2 Dry manure 0.04 0.1 0.1 0.04 0.1 0.1 Open fields
Method Time before down-moulding
Type of down-moulding
Surface spreading 0-4 hrs plow 0.2 0.2 0.15 0.3 Surface spreading + 4 hrs plow 0.5 0.35 0.4 0.4 Surface spreading 0-4 hrs harrow 0.4 0.35 0.35 0.35 Surface spreading + 4 hrs harrow 0.5 0.45 0.45 0.45 Water mixing 0-4 hrs plow 0.1 0.1 0.1 0.15 Water mixing + 4 hrs plow 0.25 0.2 0.2 0.25 Water mixing 0-4 hrs harrow 0.2 0.2 0.2 0.2 Water mixing + 4 hrs harrow 0.3 0.25 0.25 0.25 Dry manure 0.04 0.1 0.04 0.1
Source: Morken and Nesheim (2004).
Table 5.18. Average NH3 emission factors for cultivated fields and meadows after time of spreading and
region. 2015. Per cent of ammonium N
South-Eastern
Norway Hedmark/Oppland Rogaland Western Norway Trøndelag Northern Norway
Field Meadow Field Meadow Field Meadow Field Meadow Field Meadow Field Meadow
Spring 15.6 40.0 20.4 42.3 4.0 38.0 4.0 43.2 20.8 42.4 7.4 42.6 Autumn 17.4 28.9 20.0 30.7 10.0 27.4 10.0 31.4 24.6 30.8 12.9 31.0
Source: Statistics Norway, NH3-model estimations
The factors in Table 5.17 are combined with the activity data in the Sample survey of agriculture
and forestry 2007 (Statistics Norway 2007) and a time series on mixture of water in manure, and
emission factors for NH3 emissions from spreading of manure distributed to meadow and
cultivated fields, time of season and region are calculated (see Table 5.18). These factors are in
turn connected to activity data that are updated in the years since 1990, i.e. number of animals
(amount of manure), time of spreading and type of cultivation of the areas where the manure is
spread.
The emission factors used for the calculation of the NH3 emissions from grazing animals are
shown in Table 5.19. These are the same as the emission factors used in Germany (Dämmgen et

IIR 2017
205
al. 2002) and Denmark (Hutchings et al. 2001).
Table 5.19. NH3 emission factors from droppings from grazing animals on pasture. Per cent of ammonium
N applied
N-loss/N applied
Cattle 7.5 Sheep and goats (from 2013 sheep only)1 4.1 Reindeer 4.1 Other animals (from 2013 including goat)1 7.5
1 Goats are grouped with sheep in the 2000 survey, and with horses in the 2013 survey.
Source: Dämmgen et al. (2002), Hutchings et al. (2001)
NOX emissions from agricultural soil
NFR 3Da1
Method
The sum of all nitrogen applied to soil has been multiplied with the default tier 1 emission factor
to estimate the nitric oxide emission from crop production. Thereafter the amount of NO is
translated to amount of NO2.
Activity data
Total N from the following sources are included:
Synthetic fertilizers
Animal manure spread
Sewage sludge
Other organic fertilisers
Synthetic fertiliser
The Norwegian Food Safety Authority calculates a total value for annual consumption of
synthetic fertilisers in Norway based on sales figures. These data are corrected for the amount
of fertiliser used in forests, which is provided by the Norwegian Institute of Bioeconomy
Research.
Animal manure spread
In Norway, all animal excreta that are not deposited during grazing are used as manure and
applied to soils. The total amount of N in manure used as fertiliser is equivalent to total N
excreted from the animals deducted for the amount dropped during grazing. How the amount of
nitrogen in animal manure are calculated is described further in section 5.4.2.3.
Sewage sludge applied to soils
Statistics Norway (waste water statistics) annually gives values for the amount of sewage sludge,
and the fraction of the sewage sludge that are applied on fields. The N-content in the sludge is
given in Statistics Norway (2001), and the same value of 2.82 per cent is used for all years.
Other organic fertilisers applied to soils

IIR 2017
206
How the amount of nitrogen in other organic fertiliser are estimated is described further in
section 5.5.2.1.4.
Emission factors
Tier 1 default emission factor for NO emissions from agricultural soils has been used, see Table
5.20.
Table 5.20. Tier 1 default emission factor for NO emissions from agricultural soils
Pollutant Value Unit
NO 0.026 kg kg-1 fertilizer-N applied
Source: EEA (2015B)
NMVOC emissions from agricultural soils
NFR 3Da1
Method
The tier 1 methodology has been used, multiplying cultivated area in Norway with the default
emission factor from EEA.
Activity data
The activity data used are fully cultivated area given by Statistics Norway.
Emission factors
The recommend average emission factor of 0.86 kg NMVOC per ha from EEA (2016) is used.
There are great variations in NMVOC emissions, dependent on crop, temperatures, yield etc.
The average factor is based on a 50-50 distibution between grass and cropland. In Norway,
about two thirds of the agricultural land is grassland. This may indicate an underestimation, but
lower average temperatures compared to the average for the whole EMEP area has the
opposite effect.
Particle emissions from farm-level agricultural operations
NFR 3Dc
Agriculture is responsible for various types of non-combustion emissions of particles. This is for
example dust from crops that are harvested, soil dust from work with agricultural machines,
wood particles from felling of trees etc.
Method
The tier 1 methodology described in EEA (2016) is used. The area of crop land in Norway is
multiplied with tier 1 emission factors, which gives emissions per area unit.
Activity data
The area of crop land (open fields and gardens) is used since these emissions are mainly from
combine harvesting and soil cultivation (EEA 2016). The emissions may therefore be slightly
overestimated since parts of the cropland is not plowed or harrowed every year.

IIR 2017
207
Emission factors
Table 5.21. Tier 1 emission factors for emissions of particles from farm-level agricultural operations. kg/ha
Pollutant Value (kg ha-1)
PM10 1.56 PM2.5 0.06 TSP 1.56
Source: EEA (2016)
Uncertainties
Activity data
There are several types of activity data entering the calculation scheme:
Sales of nitrogen fertiliser: The data are based on sales figures during one year (The Norwegian
Food Safety Authority). The uncertainty in the sales figures is within 5 per cent (Rypdal & Zhang
2000). In addition, there is a possible additional error due to the fact that sales do not
necessarily equal consumption in a particular year, due to storage. The share of the various
types of nitrogen fertiliser is assumed to be the same as in an investigation in 1994, and the
error connected to this approach has probably increased over the years. The effect for the
uncertainty in activity data due to these two factors has not been quantified, but it is assumed
that it can be more important than the uncertainty in the sales figures.
Amount of nitrogen in manure: The figures are generated for each animal type, by multiplying
the number of animals with a nitrogen excretion factor. The nitrogen excretion factors are
uncertain. The range is considered to be within 15 per cent (Rypdal 1999). The uncertainty is
connected to differences in excreted N between farms in different parts of the country, that the
survey farms may not have been representative, general measurement uncertainty and the fact
that fodder and feeding practices have changed since the factors were determined. This
uncertainty was substantially reduced in 2013 when the nitrogen factors were assessed in a
research project (Karlengen et al. 2012).
The uncertainty connected to the estimate of the amount of manure is higher than for the
amount of synthetic fertiliser used.
Fate of manure: There is significant uncertainty connected to the allocation of manure between
what is used as fertiliser and droppings on pastures.
Atmospheric deposition of agricultural NH3 emissions: The data are based on national figures for
NH3 emission from agriculture. These are within 30 per cent (Rypdal 1999).
Emission factors
NH3
The uncertainty in the estimate of NH3 emissions from use of fertiliser is assessed to be about
20 per cent (Rypdal & Zhang 2001). This uncertainty could be lower if better data on fertiliser
composition were obtained. The uncertainty is higher for animal manure (30 per cent (Rypdal
& Zhang 2001)). This is due to uncertainties in several parameters (fraction of manure left on
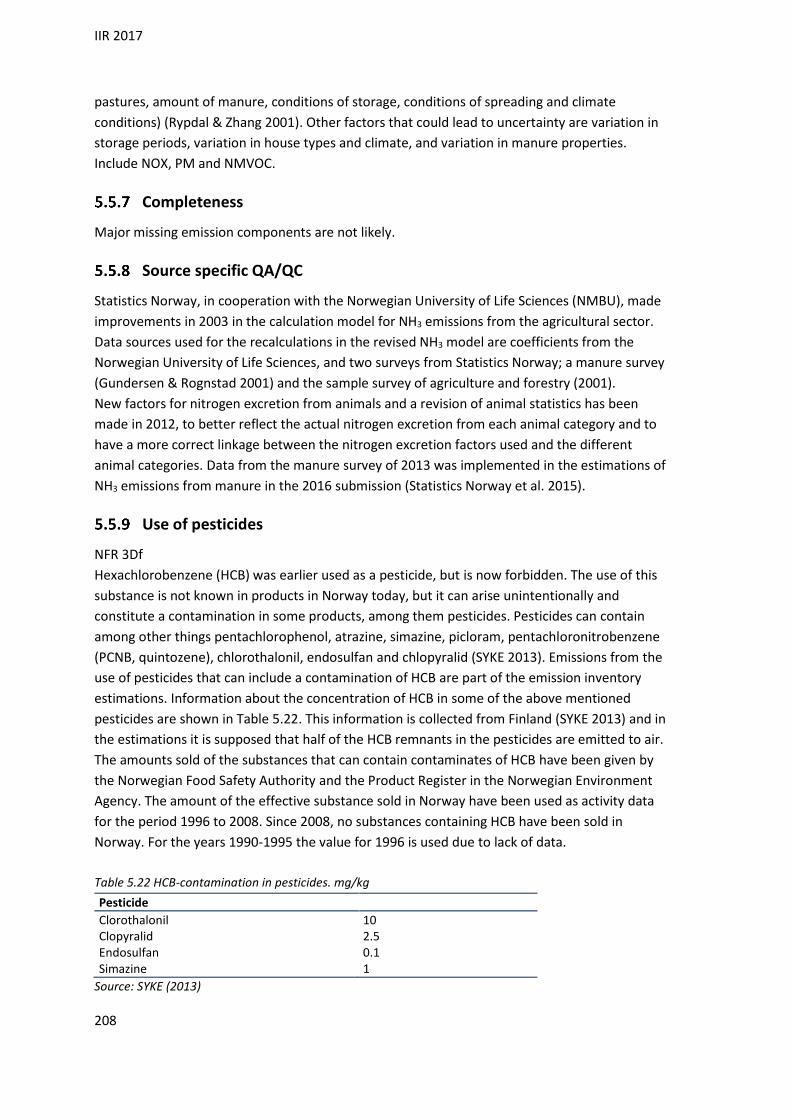
IIR 2017
208
pastures, amount of manure, conditions of storage, conditions of spreading and climate
conditions) (Rypdal & Zhang 2001). Other factors that could lead to uncertainty are variation in
storage periods, variation in house types and climate, and variation in manure properties.
Include NOX, PM and NMVOC.
Completeness
Major missing emission components are not likely.
Source specific QA/QC
Statistics Norway, in cooperation with the Norwegian University of Life Sciences (NMBU), made
improvements in 2003 in the calculation model for NH3 emissions from the agricultural sector.
Data sources used for the recalculations in the revised NH3 model are coefficients from the
Norwegian University of Life Sciences, and two surveys from Statistics Norway; a manure survey
(Gundersen & Rognstad 2001) and the sample survey of agriculture and forestry (2001).
New factors for nitrogen excretion from animals and a revision of animal statistics has been
made in 2012, to better reflect the actual nitrogen excretion from each animal category and to
have a more correct linkage between the nitrogen excretion factors used and the different
animal categories. Data from the manure survey of 2013 was implemented in the estimations of
NH3 emissions from manure in the 2016 submission (Statistics Norway et al. 2015).
Use of pesticides
NFR 3Df
Hexachlorobenzene (HCB) was earlier used as a pesticide, but is now forbidden. The use of this
substance is not known in products in Norway today, but it can arise unintentionally and
constitute a contamination in some products, among them pesticides. Pesticides can contain
among other things pentachlorophenol, atrazine, simazine, picloram, pentachloronitrobenzene
(PCNB, quintozene), chlorothalonil, endosulfan and chlopyralid (SYKE 2013). Emissions from the
use of pesticides that can include a contamination of HCB are part of the emission inventory
estimations. Information about the concentration of HCB in some of the above mentioned
pesticides are shown in Table 5.22. This information is collected from Finland (SYKE 2013) and in
the estimations it is supposed that half of the HCB remnants in the pesticides are emitted to air.
The amounts sold of the substances that can contain contaminates of HCB have been given by
the Norwegian Food Safety Authority and the Product Register in the Norwegian Environment
Agency. The amount of the effective substance sold in Norway have been used as activity data
for the period 1996 to 2008. Since 2008, no substances containing HCB have been sold in
Norway. For the years 1990-1995 the value for 1996 is used due to lack of data.
Table 5.22 HCB-contamination in pesticides. mg/kg
Pesticide
Clorothalonil 10 Clopyralid 2.5 Endosulfan 0.1 Simazine 1
Source: SYKE (2013)

IIR 2017
209
Uncertainties
No uncertainty analysis has been made for this source.
Completeness
Major missing emission components are not likely.
Source specific QA/QC
There is no source specific QA/QC procedure for this sector. See section 1.6 for the description
of the general QA/QC procedure.
5.6 Field burning of agricultural wastes
NFR 3F
Last update: 29.02.16
Description
Burning of agricultural residues gives emissions of a large range of standard combustion
products. Emissions of NOX, CO, NH3, NMVOC, SO2, particles and the heavy metals Pb, Cd, Hg,
As, Cu and Cr, and benzo(a)pyrene, benzo(b)fluoranthene, benzo(k)fluoranthene and
indeno(1,2,3-cd)pyrene (PAH-4) and dioxins are included in the inventory.
Method
The emissions from the burning of crop residues are being calculated in accordance with a Tier 1
approach (EEA 2009):
EPollutant = ARresidue_burnt * EFPollutant
EPollutant = emission (E) of pollutant
ARresidue_burnt = activity rate (AR), mass of residue burnt (dry matter)
EFPollutant = emission factor (EF) for pollutant
Activity data
The annual amount of crop residue burned on the fields is calculated based on crop production
data for cereals and rapeseed from Statistics Norway, and estimates of the fraction burned
made by the Norwegian Crop Research Institute and Statistics Norway. The fraction of crop
residue burned on field was updated in 2012 by the Norwegian Agricultural Authorities21. This
reduced the fraction for 2011 from 7.5 to 4 per cent. For cereals a water content of 15 per cent
is used (IPCC 1997). The activity data are consistent with the data used in the estimations of N2O
from crop residues.
21 Johan Kollerud, Norwegian Agricultural Authorities, unpublished material 2012.

IIR 2017
210
Emission factors
Table 5.23. Emission factors for agricultural residue burning.
Components Emission factors Unit Source
Precursors
NOX 2.3 kg/ tonnes crop residue (d.m.) burned (EEA 2016)
CO 66.7 kg/ tonnes crop residue (d.m.) burned (EEA 2016)
SO2 0.5 kg/ tonnes crop residue (d.m.) burned (EEA 2016)
NMVOC 5 kg/ tonnes crop residue (d.m.) burned (EEA 2016)
NH3 2.4 kg /tonnes crop residue (d.m.) burned (EEA 2016)
Heavy metals
Pb 0.11 g/ tonnes crop residue (d.m.) burned (EEA 2016)
Hg 0.14 g/ tonnes crop residue (d.m.) burned (EEA 2016)
Cd 0.88 g/ tonnes crop residue (d.m.) burned (EEA 2016)
As 0.0064 g/ tonnes crop residue (d.m.) burned (EEA 2016)
Cr 0.08 g/tonnes crop residue (d.m.) burned (EEA 2016)
Cu 0.073 g/ tonnes crop residue (d.m.) burned (EEA 2013; EPA 2002)
Particles
TSP 5.8 kg/ tonnes crop residue (d.m.) burned (EEA 2016)
PM10 5.7 kg/ tonnes crop residue (d.m.) burned (EEA 2016)
(EEA 2016)
PM2.5 5.4 kg/ tonnes crop residue (d.m.) burned (EEA 2016)
BC
13 % of PM2.5 GAINS model (IIASA)
benzo(a)pyrene 0,39266 g/ tonnes crop residue (d.m.) burned
(Jenkins et al. 1996)
benzo(b)fluoranthene 1,09678 g/ tonnes crop residue (d.m.) burned
(Jenkins et al. 1996)
benzo(k)fluoranthene 0,46806 g/ tonnes crop residue (d.m.) burned
(Jenkins et al. 1996)
indeno(1,2,3_cd)pyrene 0,33582 g/ tonnes crop residue (d.m.) burned
(Jenkins et al. 1996)
Dioxins 0.5 iμg I-TEQ/tonnes crop residue (d.m.) burned
(EEA 2016)
PCB 2.7 μg/tonnes crop residue (d.m.) burned
(Nielsen et al. 2015), (EEA 2013)
Heavy metals and POPs
For heavy metals default emission factors from the EMEP/EEA emission inventory guidebook are
used (EEA (2016)). The emissions of benzo(a)pyrene, benzo(b)fluoranthene,
benzo(k)fluoranthene and indeno(1,2,3-cd)pyrene (PAH-4) are calculated based on emission

IIR 2017
211
factors from Jenkins et al. (1996).
Uncertainties
Uncertainty estimates for long-range transboundary air pollutants are given in Appendix C.
Completeness
The main emission components from burning of agricultural residues are considered to be
covered in the emission calculations.
Source specific QA/QC
In 2002, the emissions of NOX, CO, Pb, Hg, Cd, and dioxins from agricultural residual burning
were included in the Norwegian inventory, and in 2003, the emissions of particles, As, Cr and Cu
were added. In 2011, also emissions of SO2, NMVOC and NH3 were included in the inventory. In
2016, a project to split PAH-4 emissions on individual PAHs; benzo(a)pyrene,
benzo(b)fluoranthene, benzo(k)fluoranthene and indeno(1,2,3-cd)pyrene has been performed.
The time series were included but it should be noted that the figures for the earlier years have a
higher uncertainty than the more recent years.
5.7 Other agricultural emission sources
NFR 3I
Last update: 09.03.15
Description
Straw treated with NH3 to be utilised as fodder is a source of NH3 emissions in Norway.
NH3 emissions from treatment of straw
Method
Emissions of NH3 from treatment of straw depend only on the amount of NH3 used. The total
amount of NH3 used for treatment of straw in Norway is multiplied with the share of the NH3
that is not integrated in the straw.
Activity data
The amount of NH3 used per year is obtained from the Budget Committee for Agriculture22. The
area of cultivated fields is annually updated from Statistics Norway’s agriculture statistics.
Emission factor
It is estimated that 65 per cent of the NH3 applied is not integrated with the straw, and is
therefore emitted after the treatment (Morken 2003). The same estimation is being used in
22 NILF (2010): Totalkalkylen for jordbruket. http://www.nilf.no/Totalkalkylen/Bm/2009/BMposter/BM_R_220B.shtml

IIR 2017
212
Denmark.
Uncertainties
Uncertainty in the estimate of emissions from NH3 treatment of straw is rather low (5 per cent)
(Rypdal & Zhang 2001).
Completeness
Major missing emission components are not likely.
Source specific QA/QC
There is no source specific QA/QC procedure for this sector. See section 1.6 for the description
of the general QA/QC procedure.

IIR 2017
213
6 WASTE (NFR sector 5)
NFR 5
6.1 Overview
This sector includes solid waste disposal on land (5A), other biological treatment of waste (5B),
waste incineration (5C), waste water handling (5D), and other waste (5E).
Emissions from waste incineration included in sector 5C are emissions from flaring, except
flaring from energy sectors (included in NFR 1 energy), and emissions from cremation and
hospital waste (until 2005). The main emissions from Waste Incineration are included in the
energy sector (1A) since most of incineration of municipal, industrial and medical waste in
Norway is now done with energy recovery. The source sector 5E Other Waste covers emissions
from municipal sewage sludge applied to parks etc., emissions from accidental car fires, building
fires, and emissions from recovering processes in the waste trade.
Figure 6.1. Trends for the emissions for most of long-range transboundary air pollutants from waste,
relative to 1990
Source: Statistics Norway/ Norwegian Environment Agency
Figure 6.1 shows the trends for the emissions for most of the long-range transboundary air
pollutants from waste, relative to 1990. With the exception of NH3 and NOx, the emissions of all
pollutants have decreased since 1990.
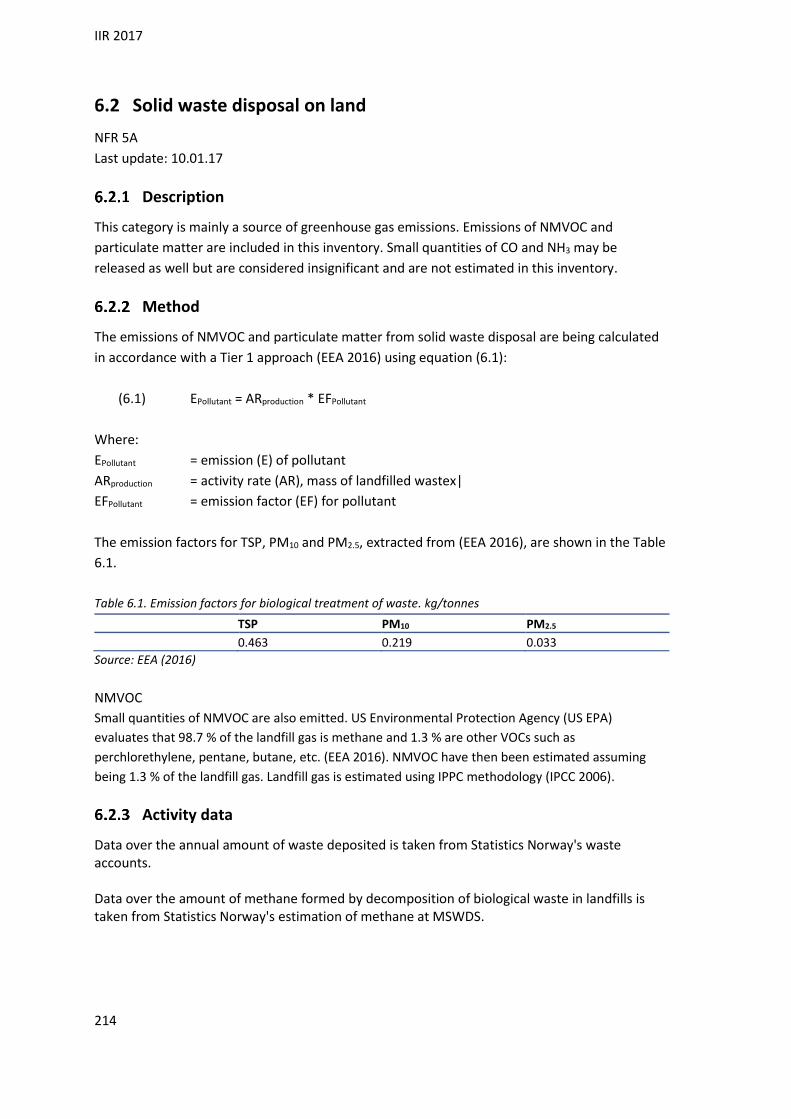
IIR 2017
214
6.2 Solid waste disposal on land
NFR 5A
Last update: 10.01.17
Description
This category is mainly a source of greenhouse gas emissions. Emissions of NMVOC and
particulate matter are included in this inventory. Small quantities of CO and NH3 may be
released as well but are considered insignificant and are not estimated in this inventory.
Method
The emissions of NMVOC and particulate matter from solid waste disposal are being calculated
in accordance with a Tier 1 approach (EEA 2016) using equation (6.1):
(6.1) EPollutant = ARproduction * EFPollutant
Where:
EPollutant = emission (E) of pollutant
ARproduction = activity rate (AR), mass of landfilled wastex|
EFPollutant = emission factor (EF) for pollutant
The emission factors for TSP, PM10 and PM2.5, extracted from (EEA 2016), are shown in the Table
6.1.
Table 6.1. Emission factors for biological treatment of waste. kg/tonnes
TSP PM10 PM2.5
0.463 0.219 0.033
Source: EEA (2016)
NMVOC
Small quantities of NMVOC are also emitted. US Environmental Protection Agency (US EPA)
evaluates that 98.7 % of the landfill gas is methane and 1.3 % are other VOCs such as
perchlorethylene, pentane, butane, etc. (EEA 2016). NMVOC have then been estimated assuming
being 1.3 % of the landfill gas. Landfill gas is estimated using IPPC methodology (IPCC 2006).
Activity data
Data over the annual amount of waste deposited is taken from Statistics Norway's waste accounts. Data over the amount of methane formed by decomposition of biological waste in landfills is taken from Statistics Norway's estimation of methane at MSWDS.

IIR 2017
215
6.3 Compost production
NFR 5B
Last update: 19.02.16
Description
This category covers emissions from the biological treatment of waste: composting. Emissions of
NH3 and CO from home composting and emissions of NH3 from industrial composting are
included in the inventory. This source category is not considered to be significant in Norway in
terms of long-range transboundary air pollutants. It can also be a source of NMVOC emissions
which are not estimated in the Norwegian inventory.
Methodological issues
Emissions of NH3 from composting of municipal waste have been calculated according to the Tier 2 default methodological guidance given by the 2016 Guidebook (EEA 2016).
Activity data
All Norwegian waste treatment plants are obligated to statutory registration and reporting of all waste entering and leaving the plants. All waste streams are weighed, categorized with a waste type and a type of treatment. Data is available for all years since 1995 and for the year 1992. Activity data for the year 1992 and since 1995 are collected from Statistics Norway’s, waste statistics. For the years 1990 and 1991, activity data for 1992 are used, while AD for 1993 and 1994 are estimated by linear interpolation of activity data from 1992 and 1995. Home composting Emissions from home composting of garden waste and vegetable waste are also included in this inventory. The activity data for this category is available from Statistics Norway for the years 2009-2012. The amount of organic waste from households composted in the period 1990-2008 has been estimated assuming that 3 per cent of all households compost their garden and vegetable food waste (Lystad 2005). The average value of the period 2009-2012, 2.6 per cent, has been used for the following period.
Emission factors
Emissions from composting, will depend on both the composition of waste composted, amount and type of supporting material (such as wood chips and peat) used, temperature, moisture content and aeration during the process. Table 6.2 gives default factors for CO and NH3 emissions from biological treatment for Tier 2 method used for the estimation of Norwegian emissions. Table 6.2. Composting emission factors. kg/tonnes
CO NH3
Compost production NE 0.24
Home composting 0.56 0.66
Source: EEA (2016)

IIR 2017
216
6.4 Waste incineration
NFR 1A1a, 1A2d and 5C
Last update: 10.01.17
Description
In this chapter, the focus will be on waste from flaring, except flaring from energy sectors, and
emissions from cremation and hospital waste until 2005. Since 2006, hospital wastes are
incinerated in incerators for municipal wastes and are included in the energy sector.
Emissions from waste incineration in district heating plants are reported under energy (NFR
1A1a), as the energy is utilised, and therefore described in section 3.2.2. In 2015, there were 17
waste incineration plants where household waste was incinerated. In addition, some
incineration plants burn waste other than household waste, mainly wooden waste, paper,
pasteboard and cardboard. These emissions are reported and described under energy. Waste,
other than household waste, is also used as energy source in some manufacturing industries.
These emissions are reported and described in the relevant subsectors under 1A2. Flaring off-
shore and in refineries is included under sector 1B2c, Flaring in chemical industry is included
under sector 2B5.
In Norway, the open burning of private yard waste is under different restrictions according to
the respective municipality. These restrictions involve what can be burned, but also the
quantity, how, when and where. In some municipalities, a complete ban is imposed. There is no
registration of private waste burning and activity data on this subject are difficult to estimate.
Citizens are generally encouraged to compost their yard waste or to dispose of it through one of
the many waste disposal/recycling sites. Emissions from open burning of waste are not
estimated.
PCB containing material are sendt abroad, mostly to Sweden, to be destroyed. There is no
incineration of PCB in Norway.
Method
Emissions from flaring of landfill gas are estimated by multiplying the amount of gas flared with
the emission factors shown in Table 6.3. Emissions from flaring of biogas from industrial waste
water treatment plants are estimated. Emissions have been estimated by multiplying the
amount of gas flared with the emission factors shown in Table 6.3.
Emissions from cremation and hospital waste are estimated by emission factors multiplied with
activity data. For hospital waste, the emissions of lead, cadmium and mercury used in the model
are reported to the Norwegian Environment Agency. Emissions of arsenic, chromium and copper
have only been reported by two hospitals to the Norwegian Environment Agency for the year
1999. A country specific emission factor has been estimated for each component. This factor is
based on the ratio between reported emission figures for 1999 and the quantities of waste
burned in 1999. This factor is then multiplied with the amount of waste burned at other
hospitals for the years 1995 to 2005. Around 1995, more control device systems were installed

IIR 2017
217
at waste incineration plants as a result of stricter emission requirements. It is assumed that this
also applied to incineration of hospital waste. For the years before 1995, it is assumed that the
emissions were higher. The emission standards for particulate matter from waste incineration
changed from 100 to 30 mg/Nm3. It was assumed that emissions of lead, cadmium, copper and
chromium followed the same pattern as particulate matter. It is believed however, that arsenic
and mercury has similar properties and it has thus been assumed that emissions of arsenic have
been reduced in the same way as mercury. Emissions of mercury were regulated from 0.1 to
0.05 mg/Nm3 from 1994 to 1995. It is therefore assumed that emissions of arsenic before 1995
were twice as large as after 1995. Emissions of particulate matter were reported for all hospitals
for the period 1990-1999. Since 2000, emissions from hospitals incinerators have been
estimated based on EF and the amount of waste incinerated. Since 2006, all hospital waste has
been incinerated at waste incineration plants.
Activity data
Landfill gas
Information on the amount flared is given by the operators of landfills to the Norwegian
Environment Agency. Emissions from landfill gas flared is included in 5C. Emissions from landfill
gas used for district heating and used in other sectors are reported in the relevant subsectors
under 1A1 and 1A4.
Biogas
The amount of biogas flared at some industrial waste water treatment plants are reported to
the Norwegian Environment Agency for all years since 1991.
Natural gas
The amount of natural gas flared by the production of methanol is reported under 2B5.
Hospital waste
The amount of hospital waste was reported to Statistics Norway by some hospital incinerators.
The hospital incinerators have gradually been closed down, mainly due to new emission limits.
Since 2006, no hospital incinerators have been in operation. Nowadays, hospital waste is
incinerated in incinerators for municipal waste and emissions are included under 1A1a.
Cremation
Incineration of human bodies is a common practice that is performed on an increasing part of
the deceased. The number of cremated bodies is gathered by the Ministry of Culture and
published in Statistics Norway’s Statistical Yearbook.

IIR 2017
218
Emission factors
Table 6.3 presents emissions factors for the waste incineration sector.
Table 6.3. Emission factors for flare of landfill gas, cremation and hospital waste incineration
Component Flare landfill gas and biogas kg/tonnes
Cremation Tonnes/body
Cremation Tonnes/body CS EF1 2007->
Hospital waste Tonnes/tonnes
SO2 0.02 0.000113 0.0014 CO 0.04 0.00014 0.0028 NOX 0.17 0.000825 0.0014 Particles PM10 0.14 0.0000347 3.15504E-06 0.0005 TSP 0.00003856 3.506E-06 0.0005 PM2.5 0.000031 2.81862E-06 0.0005 BC 7% of
PM2.5 50 % of PM2.5 50 % of PM2.5 18% of TSP
OC 36 % of PM2.5 36 % of PM2.5 NMVOC 0 0.000013 0.0007
g/tonne kg/body mg/tonne
Pb NA 0.00003003 2.73042E-06 Plant-specific emission factors
Cd NA 0.00000503 4.57344E-07 Plant-specific emission factors
Hg NA 0.00149 5.59943E-05 Reported Cu NA 0.00001243 1.13018E-06 2594.6* Cr NA 0.00001356 1.23292E-06 1272.4* As NA 0.00001361 1.23747E-06 4705.6 Dioxins NA 2.7E-11** 0.29685*** PCB NA 4.1E-07 0.39* HCB NA 1.5E-07 2.6* benzo(a)pyrene NA 1.32E-08 0.004179 benzo(b)fluoranthene 7.21E-09 0.035821 benzo(k)fluoranthene NA 6.44E-09 .. indeno(1,2,3_cd)pyrene NA 6.99E-09 ..
NA=Not Applicable. 1 Country specific emission factor based on measurements of Hg and TSP for the years 2013-2015. EFs for all HM are redused as
much as TSP (91%). The new emission factors are used for all years since 2007. * Country specific emission factor used for the years after 1995. Emission factors for the years 1990 to 1994 can be given on request.
** Emissions factor is given in kg I-TEQ/body
*** Emissions factor is given in mg I-TEQ/tonne
Source: EEA (2016), Kupiainen and Klimont (2004) and Danish IIR (Aarhus University, 2016)
BC emissions have been estimated using shares of PM2.5 as emission factors. Shares given by
IIASA (Kupiainen & Klimont 2004) have been used. For cremation, as no share for BC was found
in the literature for the use of natural gas in navigation, BC share has been set to be 50 per cent
of PM2.5. Indeed, the amount of PM2.5 is assumed to be equally shared between BC and organic
mass (OM).
Uncertainties
Uncertainty estimates for long-range transboundary air pollutants are given in Appendix C.
Activity data
No data on amounts of hospital waste have been reported since 1999. The amount of hospital
waste the subsequent years may vary from the data reported in 1998 and 1999. Since 2006, no
IIR 2017
219
hospital incinerators have been in operation.
Emission factors
The composition of the hospital waste could be different from the waste the emission factors
are based on. In that case, the calculated emissions will be incorrect. Combustion engineering
and processes also influence the emissions. These uncertainties have not been calculated.
Source specific QA/QC
There is no source specific QA/QC procedure for this sector. See section 1.6 for the description
of the general QA/QC procedure.
6.5 Waste water handling
NFR 5D
Last update: 11.01.17
Description
This category covers emissions from the biological treatment of waste water and latrines. This
source category is not considered to be significant on the Norwegian level in terms of long-range
transboundary air pollutants.
Emissions of NMVOC are estimated in the Norwegian inventory. Emission factors for all other
pollutants are not available and may be assumed negligible in most cases.
Method
The emissions of NMVOC from waste water treatment are being calculated in accordance with a
Tier 1 approach (EEA 2016) using equation (6.2):
(6.2) EPollutant = ARproduction * EFPollutant
Where:
EPollutant = emission (E) of pollutant
ARproduction = activity rate (AR), amount of waste water
EFPollutant = emission factor (EF) for pollutant
The emission factors for NMVOC is given in EEA (2016). The emission factors used is 15 mg
NMVOC/m3 waste water.
Activity data
Domestic waste water Total amount of waste water handled by all waste water treatment plants in the country is
taken from Statistics Norway's municipal water supply for the years after 2009. For the years
1990 to 2008, the amount of waste water is estimated based on the part of the population
connected to treatment plants, using equation (6.3).

IIR 2017
220
(6.3) Waste water = Population x NRPEOPLE x EF
Where:
NRPEOPLE : share of people connected to treatment plants
EF : emission factor (average household consumption per person per year)
Norwegian population data are extracted from Statistics Norway's population statistics. Data for
the number of people in Norway connected to waste water treatment plants are extracted from
Statistics Norway’s waste water statistics. Data for the average household consumption per
person per year (2002-2008) are extracted from Statistics Norway’s statistics on municipal water
supply. Varies between 70-76 m3 water/inhabitant/year. The number for 2001 have been used
for all years 1990-2001.
Industrial waste water
The amount water released into recipient is reported by industries to the Norwegian
Environment Agency (pulp and paper industry, chemical industry and food processing
industries).
6.6 Other emission sources from the waste sector
NFR 5E
Last update: 18.02.16
Description
This category is a catch all for the waste sector. In the Norwegian inventory, emissions from
sewage sludge applied on fields other than agricultural soils, accidental car fires, house fires and
emissions from recovering processes in the waste trade are included in this category.
Method
Sewage sludge applied on fields
NH3
Emissions of NH3 are calculated for sewage sludge applied on fields other than agricultural soils.
To calculate NH3 emissions from sewage sludge, the fraction of N in manure lost as NH3 is used
(fracGASM). The loss equals to total N in sewage sludge multiplied by fracGASM. See section
5.5.2.1.3.
Car and house fires
Particles, heavy metals and POPs
Emissions of particles, heavy metals, PAHs (benzo(a)pyrene, benzo(b)fluoranthene,
benzo(k)fluoranthene and indeno(1,2,3-cd)pyrene) and dioxins are calculated for car fires and
house fires. In addition, SO2, NOx, NMVOC and CO are calculated for car fires. Emissions are
calculated by multiplying the annual number of car and house fires with emission factors. Four
IIR 2017
221
types of buildings are separated with different emission factors: detached houses, undetached
houses, apartment buildings and industrial buildings.
Waste trade
NH3, particles, heavy metals and POPs
Emissions from recovering processes in the waste trade include emissions of NH3, particles,
heavy metals (As, Cd, Cr, Cu, Hg, Pb), and PAHs (benzo(a)pyrene, benzo(b)fluoranthene,
benzo(k)fluoranthene and indeno(1,2,3-cd)pyrene ). The emission figures are reported annually
by the actual plants to the Norwegian Environment Agency.
Activity data
Sewage sludge applied on fields
Statistics Norway’s waste water statistics annually gives values for the amount of sewage sludge
and the fraction of the sewage sludge that is applied on fields.
Car and house fires
Data on the number of car and house fires are provided annually by the Directorate for Civil
Protection and Emergency Planning. These figures only include fires reported to the fire service.
Emission factors
Sewage sludge applied on fields
The N-content in the sludge is given in Statistics Norway (2001), and the same value of 2.82 per
cent is used for all years.
Car fires
The emission factor for particles is given by EPA (2002). EPA recommends the factor of 0.9
kg/car for combustion of wrecked cars without car tyres, and a factor for combustion of car
tyres of 1.4 kg/car. This results in an overall emission factor of 2.3 kg/car. The emission factor for
dioxins emissions from car fires is found in Hansen (2000). Emissions factors for heavy metal and
PAHs from car fires is found in the Danish IIR (Aarhus University, 2016). Emission factors for
mercury from car fires is found in the French IIR (CITEPA 2016). No data are available for HCB
and PCBs. NH3 is assumed not to be emitted. It is difficult to estimate the amount of material
burned in a car fire. It is assumed that the average weight of a car is 1383 kg, average weight
loss is assumed to be 18,2 per cent or 252 kg (CITEPA 2016). Emissions from vehicle fires are
calculated by multiplying the mass of vehicle fires with selected emission factors. Emission
factors are not available for different vehicle types, whereas it is assumed that all the different
vehicle types leads to similar emissions.
House fires
It is difficult to estimate the amount of material burned in a house fire. In Finstad et al. (2002b) a
calculation was made that has been used to scale the chosen emission factors, to reflect how
much of the building that is lost in a fire. This scaling calculation is based on the amount of
damage estimated in monetary value, and value on how much of the building and the furniture
that is burned. The emission factors used for particles in the inventory are given by scaling the

IIR 2017
222
emission factors used for combustion of fuelwood in the households (Haakonsen and Kvingedal
2001). The emission factors for heavy metals are given by scaling the emission factors for
combustion of wood waste in the industry (EPA 2002). For dioxins, OSPAR (Norwegian pollution
control authority 2001) gives the emission factor of 170 µg I-TEQ per tonne burned material.
Emissions factors for PAHs is found in Danish IIR (Aarhus University 2016).The scaled emission
factors used for the different building types are given in Table 6.4.
Table 6.4. Emission factors used for car fires and house fires, unit/fire
Car Detached house
Undetached house
Apartment building
Industrial building
SO2 (tonnes) 0.0013 NE NE NE NE NOx (tonnes) 0.0005 NE NE NE NE NMVOC (tonnes) 0.0021 NE NE NE NE CO (tonnes) 0.016 NE NE NE NE TSP (tonnes) 0.0023 0.14382 0.06162 0.04378 0.02723 PM10 (tonnes) 0.0023 0.14382 0.06162 0.04378 0.02723 PM2.5 (tonnes) 0.0023 0.14382 0.06162 0.04378 0.02723 BC NE 9 % of PM2.5 9 % of PM2.5 9 % of PM2.5 9 % of PM2.5 Pb (kg) 0.206 0.00042 0.00018 0.00013 8E-05 Cd (kg) 0.0004 0.00085 0.00036 0.00026 0.00016 Hg (kg) 0.0001 0.000087 0.000037 0.000026 0.000016 As (kg) 6.5E-05 0.00135 0.00058 0.00041 0.00025 Cr (kg) 0.00096 0.00129 0.00055 0.00039 0.00024 Cu (kg) 0.0067 0.00299 0.00128 0.00091 0.00057 benzo(a)pyrene (kg) 0.0037 0.008 0.0064 0.0037 0.0096 benzo(b)fluoranthene (kg)
0.0041 0.0126 0.0101 0.0059 0.0152
benzo(k)fluoranthene (kg)
0.0041 0.0044 0.0036 0.0021 0.0054
indeno(1,2,3_cd)pyrene (kg)
0.0059 0.0086 0.0069 0.004 0.0104
Dioxins (mg) 0.048 1.43817 0.61621 0.43779 0.27234
Source: Statistics Norway, Danish IIR (Aarhus University, 2016) and French IIR (2016)
Uncertainties
Uncertainty estimates for long-range transboundary air pollutants are given in Appendix C.
Source specific QA/QC
There is no source specific QA/QC procedure for this sector. See section 1.6 for the description
of the general QA/QC procedure.

IIR 2017
223
7 Other and Natural emissions
There is no long-range transboundary air pollution reported for Norway as Other or Natural
emissions.

IIR 2017
224
8 Recalculations and Improvements
8.1 Recalculations
Overall description of the recalculations for the long-range
transboundary air pollutants
As part of the continual process of improving the emission estimates, the Norwegian emission
inventory has been recalculated. The process involves correcting discovered errors and utilising
new or improved information where this has become available. The entire time series, at
present 1990-2014, are recalculated when the method for a certain source category is revised.
The figures in the inventory are therefore, as far as possible, consistent through the whole time
series.
The most important recalculations in the 2017 submission are:
1. Emissions from road traffic have been updated due to revised emission factors. NMVOC and CO has decreased throughout the period. NOx has decreased for most years, but increased for 2011-2014.
2. NMVOC og NOX from agriculture (3B manure management systems and 3D agricultural soils) have been included in the emission inventory according to EMEP guidelines 2013.
3. Emissions of PM2,5, PM10 and TSP from agriculture have been revised according to EMEP guidelines 2016. Emissions from agricultural operations previously defined under source 3I are now defined under source 3D Agricultural soils. Emissions of PM from 3B (manure management systems) are included for the first time.
4. Emissions of CO from production of aluminium have been included for all years 1990-2014. This has led to an increase in emissions of CO by 13.9 to 57.8 per cent.
5. PAH-4 have been split into benzo(a)pyren, benzo(b)fluoranthen, benzo(k)fluoranthen and indeno(1,2,3_cd)pyrene. Emission factors used for estimation of emissions of benzo(a)pyren, benzo(b)fluoranthen, benzo(k)fluoranthen and indeno(1,2,3_cd)pyrene are taken from EEA Guidebook 2013 and 2016, Finstad et al (2001) and Danish IIR (Aarhus University 2016). The PAH profile has been measured at some aluminum producing plants. This has also led to updated distribution of PAH-4 emissions from aluminum production.
6. Emissions of SO2, NOx, NH3, NMVOC, CO and heavy metals from car fires have been included. This has led to increased emissions. The increase for 2014 in emission of lead, chromium and copper were 153, 0.7 and 5 kg respectively.
In combination with some minor changes from other sources, the recalculations have caused
several changes in the emission figures, see
Table 8.6, Table 8.7 and Table 8.8.
Specific description of the recalculations
Energy
Energy figures for the last year in the previous submission (2013) have been extensively revised,

IIR 2017
225
because the energy figures for 2013 used in the previous submission were preliminary. There
will always be some changes in the energy figures for the last year, e.g. some figures on energy
use in manufacturing industries will be adjusted, which will lead to adjustments in other sectors,
as total use of oil products in the energy accounts sum up to national sales of petroleum
products. Now the final figures for energy use are available and are used in the emission
calculations. Changes in emission figures caused by such revisions will not be commented on
specifically under each NFR code.
1A1a Public electricity and heat production
Consistency. For one plant, there are minor changes in SO2 figures 2011-2014, due to replacement of previously used 2010 figures with reported figures for the actual years.
Revised activity data. Minor changes due to revisions in figures on waste combustion 2012-2014.
Revised activity data. For one plant reported As emissions for the years 1997, 1999 and 2011 to 2014 have replaced the reported figures from 2004 which was used earlier. These changes have led to a small increase in 1997, and decreases for all other years.
1A2a Iron and steel
Correction of error. Small reductions in emissions of SO2 and NOx from one plant in 2013 due to an error in the previous calculations.
1A2c Chemicals
Correction of error. Small reductions in emissions of NOx from one plant in 2011 due to an error in the previous calculations.
1A2f Other manufacturing
Reported emissions of Pb from glass production are assumed to include both process and combustion emissions. Combustion emissions of lead from glass production have been removed.
1A3B_ Road transport
Revised emission factors. A revised version of the Handbook of Emission Factors
(HBEFA) has been taken into use. The new version contains updated hot emission
factors for several emission components for the years 1990-2014. As a consequence of
the update, the NOx emissions from passenger cars (1A3bi) are higher, especially Euro-5
and Euro-6 diesel vehicles. The emissions of NMVOC and CO from road transport are
lower as a consequence of the update. Emission factors for mopeds are also used for
snow scooters. Thus, the revision also affects source categories 1A4b-ii and 1A4c-ii.
1A3bvii Road transport: Automobile road abrasion
Correction of error. Minor changes in emissions of cadmium, particulates and PAH in 2014 due to errors in the previous calculation.
1A3d National navigation
Accuracy. The emission factor for NOx was updated for the years 2008-2014, and this resulted in an important increase in emissions from national navigation. The previously

IIR 2017
226
used emission factors overestimated the effect of economic incentives to reduce emissions. The economic incentives to reduce NOx-emissions from ships started in 2008, therefore it was decided to keep the “old” emission factor for 2007 and update the emission factors for the years 2008 and onwards. The update was based on reported figures of energy use and NOx-emissions from as good as all relevant ships for a period of three months in 2016. The emission factor obtained is assumed to be of high quality. A linear interpolation was chosen to estimate emission factors for the years between 2007 and 2016. The changes also affect emissions from fishing (1A4c-iii).
1A4bii and 1A4cii Residential and Agriculture/forestry/fishing – Off-road vehicles
Revised emission factors: Changes for road transport (see 1A3b above) also affects emissions from snow scooters reported in several categories under 1A4.
1A4ciii Fishing
Accuracy: Changes in NOx emission factors for navigation also affects fishing. See 1A3d above.
1A5a Other stationary (including military)
Consistency. Military use of natural gas in 2009 has been reallocated from boiler to ship, in accordance with the practice for other years. This causes emission reductions in 1A5a.
1A5b Other, Mobile (including military, land based and recreational boats)
Consistency. Military use of natural gas in 2009 has been reallocated from boiler to ship, in accordance with the practice for other years. This causes emission increases in 1A5b.
1B2ai Oil and natural gas: Transport
Revised emission data. Increase in NMVOC emissions 2013 due to revised reported figure from one field.
Revised emission data. Higher NMVOC emissions 2014 due to revised reported figures from many fields.
Reallocation. 78 tonnes NMVOC reallocated from 1B2c to 1B2ai 2010-2014.
1B2av Oil and natural gas: Distribution of oil products
Revised emission data. Minor changes in emissions of NMVOC 2013-2014 due to revisions in reported emission data.
1B2c Oil and natural gas: Venting and flaring (oil, gas, combined oil and gas)
Revised emission data. Reported emission figures for NMVOC from two fields have been adjusted somewhat downwards for 2014.
Reallocation. 78 tonnes NMVOC reallocated from 1B2c to 1B2ai 2010-2014.
Industrial processes
2A3 Glass production
Correction of errors. Reported emission of As have been removed for the years 1990-1992 (43 kg) and 2005-2014 (0,05 kg).
2A5b Construction and demolition

IIR 2017
227
Revised emission factor. Emission factor from Guidebook 2016 have replaced earlier used emission factors for estimation of emissions of particulate matter from sand pits and rock-crushing plants and for building and construction. Resulted in a decrease of PM2.5 emissions of about 0.7 to 1.7 per cent.
2A6 Other mineral products
Correction of error. For one plant, reported emission figures on SO2 2011-2014 replace previous zero registrations. Small figures 2011-2012, for 2013 and 2014 respectively 100 and 162 tonnes.
2A6 Other process use of carbonates
Revised emission data. For one plant, reported emission figures on Cd and Cr for 2014 replace previous registrations. Emissions of Cd decreases by 0.03 kg and emissions of Cr decreases by 18.8 kg
Revised emission factors. Emission factors for particulate matter from Guidebook 2013 replace previously used factors. This causes emission reductions in the order of 1 000 – 4 300 tonnes for TSP and 200 – 700 tonnes for PM10, whereas emissions of PM2.5 have risen by 100 - 400 tonnes.
2B2 Nitric Acid Production
Addition. Emissions of BC have been included for all years. Emissions of BC have increased by 0.1 to 0.3 per cent.
2B5 Calcium carbide
Addition. Emissions of BC have been included for all years. Emissions of BC have increased by 0.1 per cent or less.
2B6 Titanium dioxide production
Addition. Emissions of BC have been included for all years. Emissions of BC have increased by 0.1 per cent or less.
2B6 Production of plastic
Addition. Emissions of BC have been included for all years. Emissions of BC have increased by less than 0.1 per cent.
2B10A Ethylene dichloride and vinyl chloride monomer
Correction of error. Emission increase for HCB in 2005, due to the replacement of an erroneous figure. (1.1 gram has been replaced by 11 gram).
2B10 Chemical industry: Production of soap and panit and varnish production
Addition. Emissions of BC have been included for all years. Emissions of BC have increased by less than 0.1 per cent .
2C2 Ferroalloys production
Revised activity data. For three plants, revision of activity data used in the calculations has caused emission changes of NMVOC and dioxins 1990-2011 and 2013-2014.
2C3 Aluminium production

IIR 2017
228
Addition. Emissions of CO have been included for all years 1990-2014. Emissions of CO have increased by 13.9 to 57.8 per cent.
Revised activity data. Revision of activity data used in the calculations has caused minor emission changes for NOx in 2010, 2013 and 2014.
Revised emission factor. The PAH profile has been measured at some aluminum producing plants. This has also led to updated distribution of PAH-4 emissions from aluminum production. Emissions of PAH-4 from aluminium production have been reduced by 1 to 16 tonnes. Largest reduction before 2005.
Addition. Emissions of BC have been included for all years 1990-2014. Emissions of BC have increased by 0.2 to 0.6 per cent.
2H2 Food and beverages industry
Revised emission factor. Emission factor from Guidebook 2016 have replaced earlier used emission factors used estimation of NMVOC emissions from production of bread and beer. Resulted in an increase of emissions of about 0.1 to 0.6 per cent.
2G Tobacco
Addition. Emissions of NH4, from use of tobacco have been included for all years 1990-2014.
Correction of error. Emissions of Hg have been reduced. The emission factor has been changed from 0.0001 g/kg tobacco to 0.00001 g/kg tobacco.
Correction of error. Emissions factors for Cu was earlier by a mistake used for estimation of emissions of Cr, and the emission factor for Cr was earlier by a mistake used for estimation of emissions of Cu. This mistake is now corrected. Emissions of Cr have decreased for all years (0.5 to 1.2 kg) and emissions of Cu have increased for all years (0.6 to 1.3 kg).
2H1 Pulp and paper industry
Addition. Emissions of NOx, NMVOC and CO from production of pulp and paper have been included for all years 1990-2014.
2I Wood processing
Addition. Emissions of TSP from wood processing have been included for all years 1990-2014.
Agriculture
3B and 3D NH3 emissions from manure management and agricultural soils
Correction of error and revised activity data in the livestock population characterisation
Changes in activity data
Number of milk cows:
The figures for the years 2009-2014 have been revised. This has given a substantially higher
numbers of cows, particularly for 2014 (see Table 8.1).

IIR 2017
229
Table 8.1. Number of milk cows in the 2016 and the 2017 submissions
2017
submission
2016
submission
Increase Increase,
per cent
2009 235 480 210 554 24 927 11.8
2010 232 294 209 094 23 200 11.1
2011 224 721 201 165 23 557 11.7
2012 229 767 203 592 26 175 12.9
2013 225 163 196 085 29 078 14.8
2014 221 032 177 759 43 272 24.3
Source: The cow recording system at TINE AS
Statistics Norway and the Cow recording system at TINE AS have assessed the data sources and
data needs, and have established a cooperation to ensure that the correct data is used in the
future.
Number of heifers for replacement
Also these figures have been revised. Table 8.2 shows the adjustment from the previous time
series.
Table 8.2. Number of heifers
2017
submission
2016
submission
Increase Increase,
per cent
1990 143 904 151 025 -7 121 -4.7
1991 142 210 149 240 -7 029 -4.7
1992 141 906 148 908 -7 001 -4.7
1993 140 179 147 085 -6 906 -4.7
1994 137 906 144 680 -6 774 -4.7
1995 138 359 145 140 -6 781 -4.7
1996 140 351 147 216 -6 865 -4.7
1997 137 684 144 394 -6 710 -4.6
1998 135 775 142 372 -6 597 -4.6
1999 137 441 144 100 -6 659 -4.6
2000 129 500 135 725 -6 224 -4.6
2001 127 008 133 092 -6 085 -4.6
2002 124 347 130 297 -5 949 -4.6
2003 123 763 129 668 -5 905 -4.6
2004 117 946 122 011 -4 065 -3.3
2005 118 090 123 006 -4 916 -4.0
2006 114 306 118 408 -4 101 -3.5
2007 109 011 112 974 -3 963 -3.5
2008 110 954 110 954 0 0.0
2009 114 416 109 286 5 131 4.7
2010 111 122 109 150 1 973 1.8
2011 110 311 108 516 1 796 1.7
2012 108 455 106 679 1 777 1.7
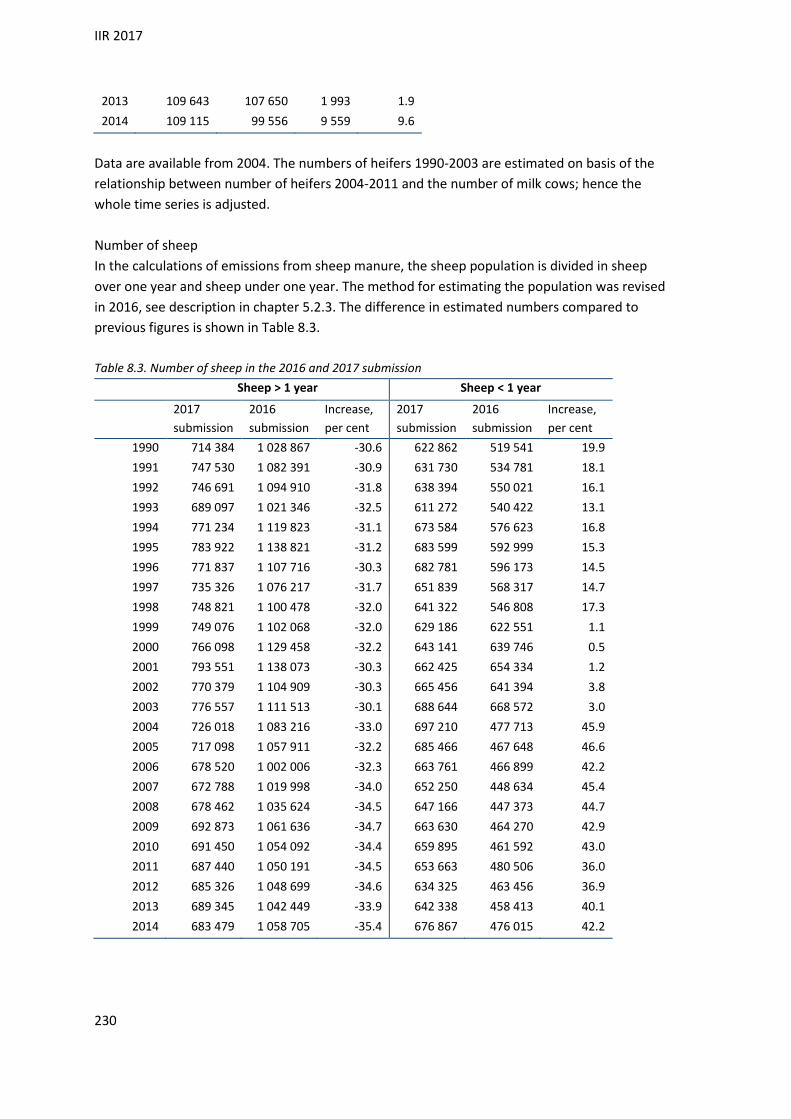
IIR 2017
230
2013 109 643 107 650 1 993 1.9
2014 109 115 99 556 9 559 9.6
Data are available from 2004. The numbers of heifers 1990-2003 are estimated on basis of the
relationship between number of heifers 2004-2011 and the number of milk cows; hence the
whole time series is adjusted.
Number of sheep
In the calculations of emissions from sheep manure, the sheep population is divided in sheep
over one year and sheep under one year. The method for estimating the population was revised
in 2016, see description in chapter 5.2.3. The difference in estimated numbers compared to
previous figures is shown in Table 8.3.
Table 8.3. Number of sheep in the 2016 and 2017 submission
Sheep > 1 year Sheep < 1 year
2017
submission
2016
submission
Increase,
per cent
2017
submission
2016
submission
Increase,
per cent
1990 714 384 1 028 867 -30.6 622 862 519 541 19.9
1991 747 530 1 082 391 -30.9 631 730 534 781 18.1
1992 746 691 1 094 910 -31.8 638 394 550 021 16.1
1993 689 097 1 021 346 -32.5 611 272 540 422 13.1
1994 771 234 1 119 823 -31.1 673 584 576 623 16.8
1995 783 922 1 138 821 -31.2 683 599 592 999 15.3
1996 771 837 1 107 716 -30.3 682 781 596 173 14.5
1997 735 326 1 076 217 -31.7 651 839 568 317 14.7
1998 748 821 1 100 478 -32.0 641 322 546 808 17.3
1999 749 076 1 102 068 -32.0 629 186 622 551 1.1
2000 766 098 1 129 458 -32.2 643 141 639 746 0.5
2001 793 551 1 138 073 -30.3 662 425 654 334 1.2
2002 770 379 1 104 909 -30.3 665 456 641 394 3.8
2003 776 557 1 111 513 -30.1 688 644 668 572 3.0
2004 726 018 1 083 216 -33.0 697 210 477 713 45.9
2005 717 098 1 057 911 -32.2 685 466 467 648 46.6
2006 678 520 1 002 006 -32.3 663 761 466 899 42.2
2007 672 788 1 019 998 -34.0 652 250 448 634 45.4
2008 678 462 1 035 624 -34.5 647 166 447 373 44.7
2009 692 873 1 061 636 -34.7 663 630 464 270 42.9
2010 691 450 1 054 092 -34.4 659 895 461 592 43.0
2011 687 440 1 050 191 -34.5 653 663 480 506 36.0
2012 685 326 1 048 699 -34.6 634 325 463 456 36.9
2013 689 345 1 042 449 -33.9 642 338 458 413 40.1
2014 683 479 1 058 705 -35.4 676 867 476 015 42.2

IIR 2017
231
Changes in emissions
Milk cows
About one quarter of total NH3 emissions in 2014 was caused by storing and spreading of
manure from milk cows. An increase in estimated number of cows of almost 25 per cent in 2014
means that the correction in number of milk cows alone led to an increase in estimated NH3
emissions of about 6 per cent. The estimated increase in the other years the number of cows
was adjusted, was substantially lower.
Heifer for replacement
About 6 per cent of total NH3 emissions in 2014 were caused by storing and spreading of
manure from heifer for replacement. An increase in estimated number of heifer of almost 10
per cent in 2014 means that the correction in number of heifers alone led to an increase in
estimated NH3 emissions of about 0,6 per cent.
Sheep
About 8 per cent of total NH3 emissions in 2014 were caused by storing and spreading of
manure from sheep. Number of sheep under one year increased about 40 per cent in 2014,
while the number over one year went down about 35 per cent. The total emissions from sheep
decreased due to this revision. The emissions of NH3 were about 0.4 per cent lower compared
to what the emissions would have been with the animal figures used in the 2016 submissions.
Emissions in the years before 2004 decreased slightly more due to the revision of number of
sheep.
Slaughter age for bulls
The slaughter age for bulls was reduced 2004-2014 with 0.4-0.8 months. In 2014 the reduction
was 0.75 months. The emissions was reduced with 37 tonnes NH3, corresponding 0.14 percent
of the total emission in 2014.
3B and 3D NOX and NMVOC emissions from manure management and agricultural soils
Addition. NOX and NMVOC emissions are included in the emission estimates from
agriculture for the first time. For the year 2015, the emissions from agriculture made out
4.2 and 7.3 per cent of total national emissions. Sources and methods are described in
chapter 5.4.3, 5.4.4, 5.5.3 and 5.5.4.
3B and 3D Particulate matter (PM10, PM2.5 and TSP) from manure management and agricultural
soils
Addition and revised emission factors and activity data. There are three changes in the
estimations of particulate emissions from agriculture:
o Emissions from animal manure are included in the emission estimates for the first time.
o The emission factors from agricultural operations are changed and increased substantially.
o Activity data for emissions from agricultural operations is changed from grain area to open fields and gardens
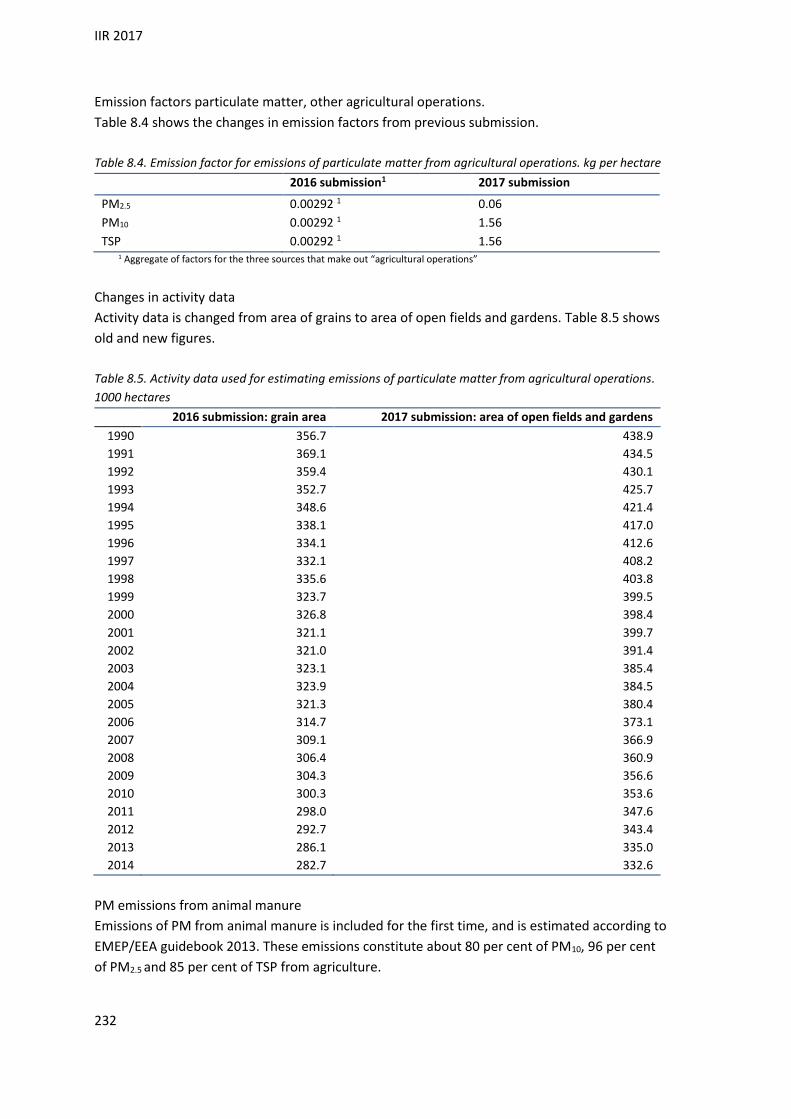
IIR 2017
232
Emission factors particulate matter, other agricultural operations.
Table 8.4 shows the changes in emission factors from previous submission.
Table 8.4. Emission factor for emissions of particulate matter from agricultural operations. kg per hectare
2016 submission1 2017 submission
PM2.5 0.00292 1 0.06
PM10 0.00292 1 1.56
TSP 0.00292 1 1.56 1 Aggregate of factors for the three sources that make out “agricultural operations”
Changes in activity data
Activity data is changed from area of grains to area of open fields and gardens. Table 8.5 shows
old and new figures.
Table 8.5. Activity data used for estimating emissions of particulate matter from agricultural operations.
1000 hectares
2016 submission: grain area 2017 submission: area of open fields and gardens
1990 356.7 438.9
1991 369.1 434.5
1992 359.4 430.1
1993 352.7 425.7
1994 348.6 421.4
1995 338.1 417.0
1996 334.1 412.6
1997 332.1 408.2
1998 335.6 403.8
1999 323.7 399.5
2000 326.8 398.4
2001 321.1 399.7
2002 321.0 391.4
2003 323.1 385.4
2004 323.9 384.5
2005 321.3 380.4
2006 314.7 373.1
2007 309.1 366.9
2008 306.4 360.9
2009 304.3 356.6
2010 300.3 353.6
2011 298.0 347.6
2012 292.7 343.4
2013 286.1 335.0
2014 282.7 332.6
PM emissions from animal manure
Emissions of PM from animal manure is included for the first time, and is estimated according to
EMEP/EEA guidebook 2013. These emissions constitute about 80 per cent of PM10, 96 per cent
of PM2.5 and 85 per cent of TSP from agriculture.

IIR 2017
233
Waste
5A Managed Waste Disposal sites
Addition. Emissions of NMVOC and particulate matter have been included for all years. NMVOC emissions from managed waste disposal sites represent more than 99 per cent of the total NMVOC of the waste treatment sector(NFR 5). Particulate matter emissions from managed waste disposal sites represent between 0,4 and 1 per cent of total particulate matter emissions from of the waste treatment sector (NFR 5) during the whole period.
5B1 Home composting of garden and vegetable food waste
Addition. Emissions of CO and NH3 have been included for all years. CO emissions from composting represents between 11 and 27 per cent of total CO emissions from the waste treatment sector during the whole period. NH3 represents between 5 and 32 per cent of total CO emissions from the waste treatment sector during the whole period.
5C1BIII Clinical waste incineration
Correction of emission factor. HCB emission factor for all years after 1995 has been corrected. HCB emissions of HCB for burning of hospital waste have increased by 31 per cent for all years 1995 to 2005.
Correction of emission factor. PCB emission factor for the years 1990 to 1994 has been corrected. PCB emissions for burning of hospital waste have decreased by 31 per cent for all years 1990 to 1994.
5C1 Cremation
Correction of emission factor. Hg and particulate matter emission factors has been corrected for all years. Emission factor from Guidebook 2016 has been used for the years 1990-2006. Since 2007, country specific emission factor based on measurements have been used. Hg emissions have decreased by 70 per cent for the period 1990-2006 and by 99 per cent after 2007. Particulate matter ustlipp have been multiplied by around 1000 for the period 1990-2006 and by around 100 after 2007.
5D Domestic Wastewater
Addition. Emissions of NMVOC have been included for all years 1990-2014 (3-5 tonnes). NMVOC emissions from waste treatment have increased by mellom 0.3 to 1.1 per cent during the period.
5 E Other Waste
Correction of emission factor. House fires. The emission factor for Hg for all years has been corrected. By a mistake the emission factor for Cd was earlier used. Emissions of Hg have been reduced by around 40 per cent for the period.
Addition of emission. Car fires. Emissions of SO2, NOX, NMVOC, CO, Pb, Cd, Hg, As, Cr, Cu and PAHs (benzo(a)pyren, benzo(b)fluoranthen, benzo(k)fluoranthen and indeno(1,2,3_cd)pyrene) have been included for all years. Total emissions of lead have increased by 0,2 to 5,3 per cent due to this inclusion. Minor increases for the other components.
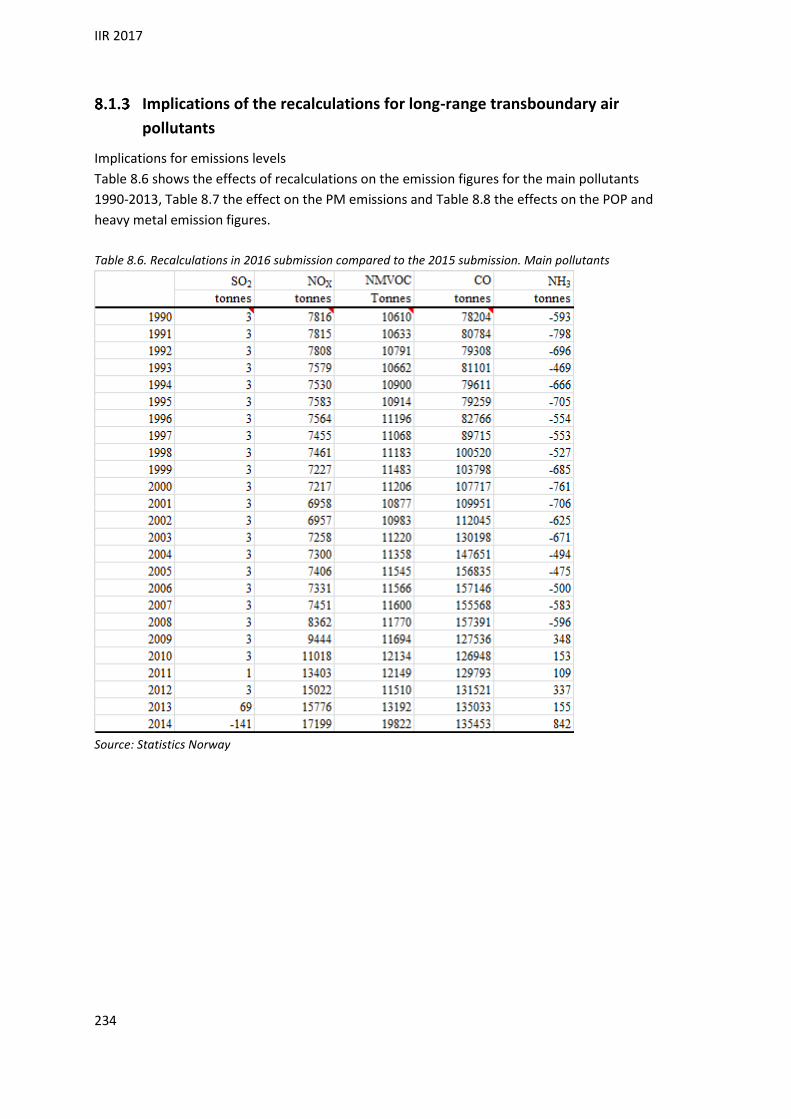
IIR 2017
234
Implications of the recalculations for long-range transboundary air
pollutants
Implications for emissions levels
Table 8.6 shows the effects of recalculations on the emission figures for the main pollutants
1990-2013, Table 8.7 the effect on the PM emissions and Table 8.8 the effects on the POP and
heavy metal emission figures.
Table 8.6. Recalculations in 2016 submission compared to the 2015 submission. Main pollutants
Source: Statistics Norway
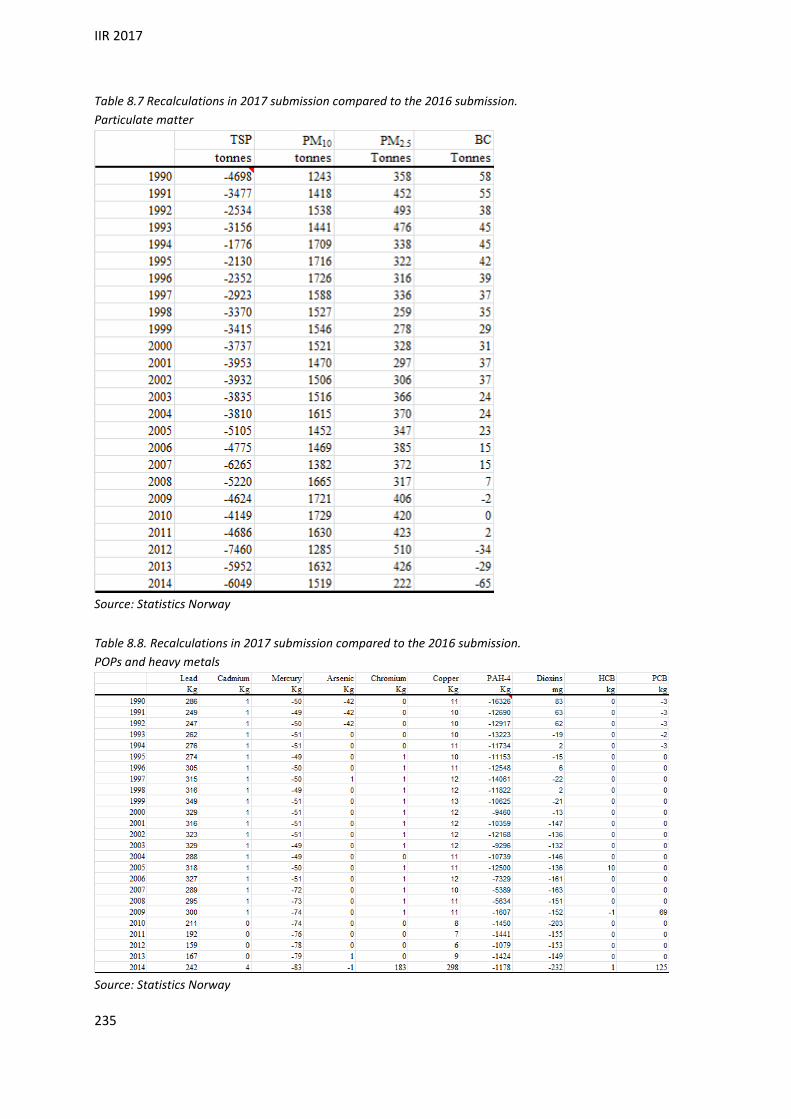
IIR 2017
235
Table 8.7 Recalculations in 2017 submission compared to the 2016 submission.
Particulate matter
Source: Statistics Norway
Table 8.8. Recalculations in 2017 submission compared to the 2016 submission.
POPs and heavy metals
Source: Statistics Norway
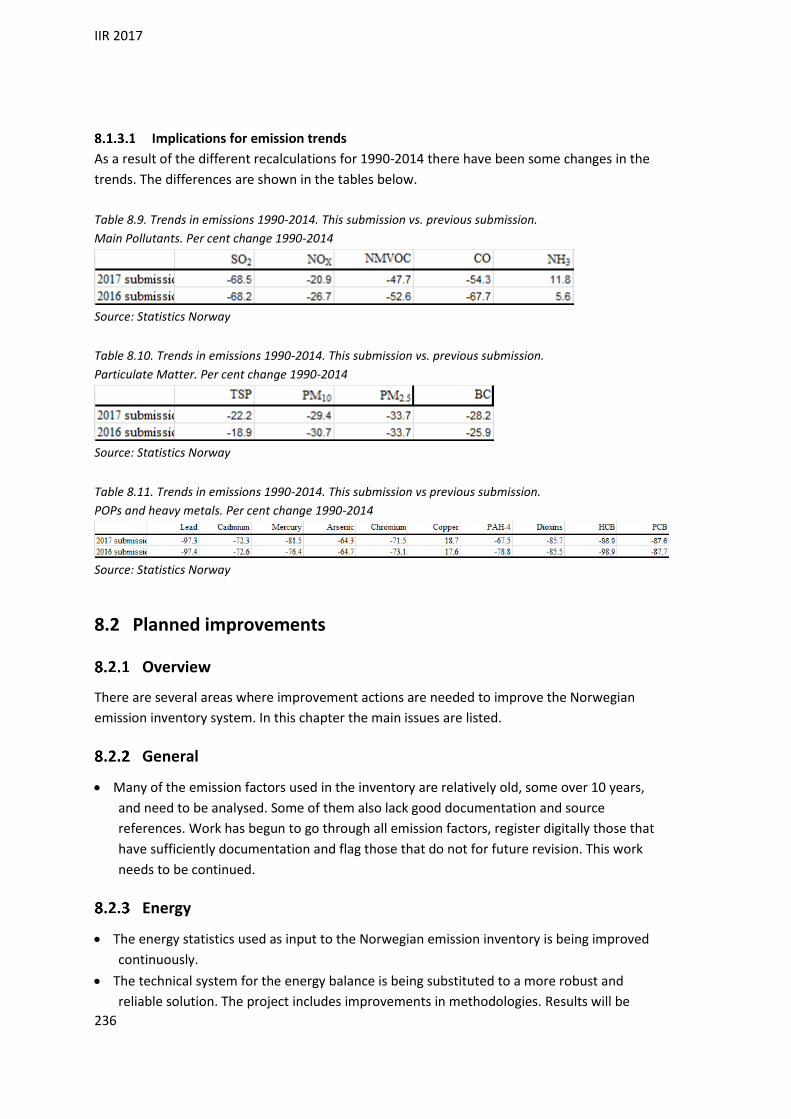
IIR 2017
236
Implications for emission trends
As a result of the different recalculations for 1990-2014 there have been some changes in the
trends. The differences are shown in the tables below.
Table 8.9. Trends in emissions 1990-2014. This submission vs. previous submission.
Main Pollutants. Per cent change 1990-2014
Source: Statistics Norway
Table 8.10. Trends in emissions 1990-2014. This submission vs. previous submission.
Particulate Matter. Per cent change 1990-2014
Source: Statistics Norway
Table 8.11. Trends in emissions 1990-2014. This submission vs previous submission.
POPs and heavy metals. Per cent change 1990-2014
Source: Statistics Norway
8.2 Planned improvements
Overview
There are several areas where improvement actions are needed to improve the Norwegian
emission inventory system. In this chapter the main issues are listed.
General
Many of the emission factors used in the inventory are relatively old, some over 10 years,
and need to be analysed. Some of them also lack good documentation and source
references. Work has begun to go through all emission factors, register digitally those that
have sufficiently documentation and flag those that do not for future revision. This work
needs to be continued.
Energy
The energy statistics used as input to the Norwegian emission inventory is being improved
continuously.
The technical system for the energy balance is being substituted to a more robust and
reliable solution. The project includes improvements in methodologies. Results will be

IIR 2017
237
published in may 2017 and incorporated in the next emission inventory. This may lead to
reallocations of fuel use with resulting changes in emissions.
The methodology for estimating emissions of NOx from energy use in ships will be updated
and improved in 2017.
Industrial processes and product use
The general improvements described in the section 8.2.2 are relevant for this sector.
For the next round of reporting, we intend to use updated EFs for TSP, PM10 and PM2.5 for
2A5B (construction and demolition).
For the next round of reporting, we intend to include emissions of CO and NH3 from 2B1
(ammonia production).
For the next round of reporting, we intend to use updated EF for PCB for 2C6 (zinc
production).
Agriculture
Norway uses a country-specific model to calculate NH3 emissions from manure
management. The model calculates emissions at county level and is complicated to update.
There is a need to review the model to make it better fit the requirements for inventory
reporting purposes, and to be able to keep the time series updated and consistent. There is
also a need to review the emission factors used in the model.
Waste
No improvement has been planned for the waste sector.
IIR 2017
238
9 Projections
9.1 Introduction
This chapter describes in some detail the projections of greenhouse gas emissions and long-
range transboundary air pollutants in Norway up to 2030. In line with international reporting
guidelines under the Framework Convention on Climate Change these projections are based on
an extension of measures and policies implemented by the 4th quarter of 2014.23 The base year
for the projections is 2012. After the projections were made, the methodology for calculating
historical emissions has been changed, and hence the emissions have changed. The
methodology changes affected mainly emissions of greenhouse gases, but also some changes
were done to other emissions. The two major changes performed for projected CLRTAP gases is
the NOX emission factor for diesel motors off shore and off road vehicles. Both have decreased
the NOX emission level. In Table 9.1 emissions for 1990 and 2011-2013 updated with the effect
of changed methodology. Only the effects of the new emissions factors for off road vehicles are
taken into account in the projections in Table 9.1. See description of recalculation in this IIR.
New projections will be published during this spring.
9.2 The baseline scenario
In the baseline scenario, the development of NOX emissions is highly dependent on emissions
from oil and gas production, which in 2013 constitute of 32 per cent of total Norwegian
emissions. Strong growth in the sector has led to an increase in NOX emissions. In shipping and
road traffic, the two other main contributors to NOX emissions, activity growth has to a larger
extent than in oil and gas production, been counteracted by implementation of abatement
technology. This is also the case for SO2 and NMVOC. In the projections, oil and gas production is
anticipated to increase until 2015, and is then stabilised on that level up to 2020 and thereafter
decrease to 2030. Emissions of NOX from transport are estimated to continue to be reduced.
Table 9.1 shows projected emissions of NOX, NMVOCs, NH3 and SO2. The estimates are based on
the same assumptions as for the greenhouse gases. Included in the NOX projections are the
effect of the first and second agreement of NOX reduction between the Ministry of Climate and
Environment and the industry for the period 2008-2017. The aim of the first and second
agreement is to reduce NOX emissions by 34 kilotons.
23 The projections were presented in the National Budget 2015.
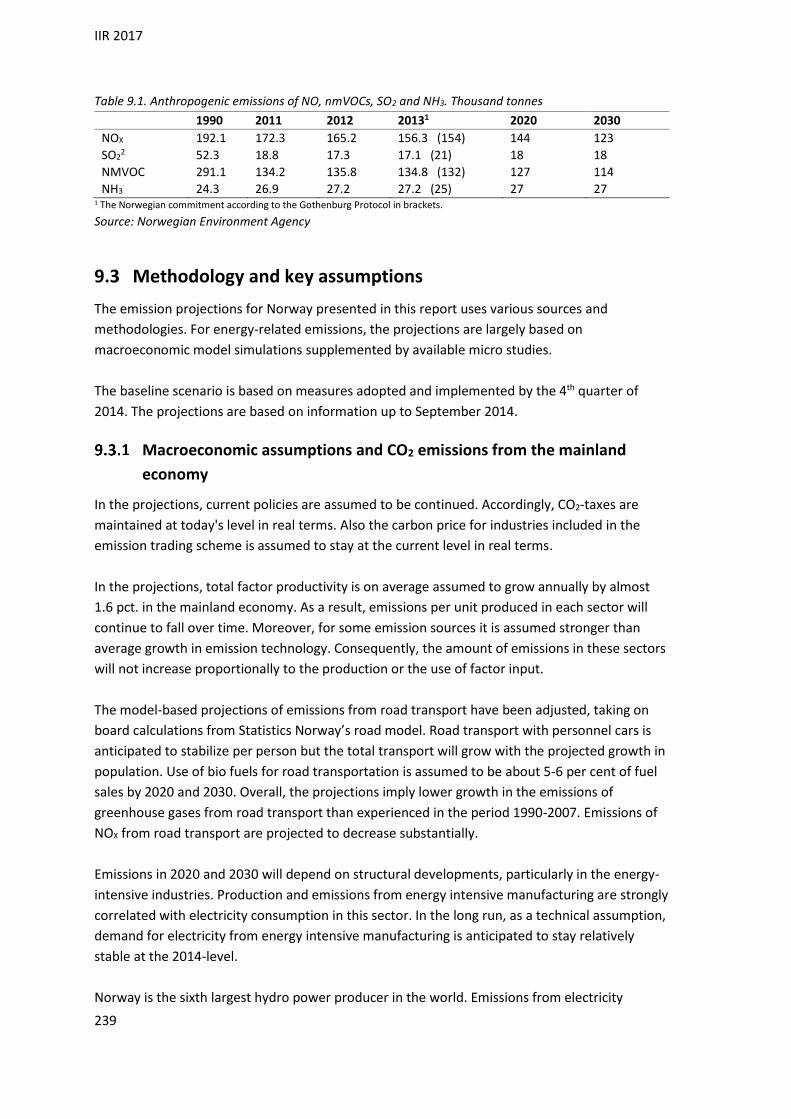
IIR 2017
239
Table 9.1. Anthropogenic emissions of NO, nmVOCs, SO2 and NH3. Thousand tonnes
1990 2011 2012 20131 2020 2030
NOX 192.1 172.3 165.2 156.3 (154) 144 123
SO22 52.3 18.8 17.3 17.1 (21) 18 18
NMVOC 291.1 134.2 135.8 134.8 (132) 127 114
NH3 24.3 26.9 27.2 27.2 (25) 27 27 1 The Norwegian commitment according to the Gothenburg Protocol in brackets.
Source: Norwegian Environment Agency
9.3 Methodology and key assumptions
The emission projections for Norway presented in this report uses various sources and
methodologies. For energy-related emissions, the projections are largely based on
macroeconomic model simulations supplemented by available micro studies.
The baseline scenario is based on measures adopted and implemented by the 4th quarter of
2014. The projections are based on information up to September 2014.
Macroeconomic assumptions and CO2 emissions from the mainland
economy
In the projections, current policies are assumed to be continued. Accordingly, CO2-taxes are
maintained at today's level in real terms. Also the carbon price for industries included in the
emission trading scheme is assumed to stay at the current level in real terms.
In the projections, total factor productivity is on average assumed to grow annually by almost
1.6 pct. in the mainland economy. As a result, emissions per unit produced in each sector will
continue to fall over time. Moreover, for some emission sources it is assumed stronger than
average growth in emission technology. Consequently, the amount of emissions in these sectors
will not increase proportionally to the production or the use of factor input.
The model-based projections of emissions from road transport have been adjusted, taking on
board calculations from Statistics Norway’s road model. Road transport with personnel cars is
anticipated to stabilize per person but the total transport will grow with the projected growth in
population. Use of bio fuels for road transportation is assumed to be about 5-6 per cent of fuel
sales by 2020 and 2030. Overall, the projections imply lower growth in the emissions of
greenhouse gases from road transport than experienced in the period 1990-2007. Emissions of
NOX from road transport are projected to decrease substantially.
Emissions in 2020 and 2030 will depend on structural developments, particularly in the energy-
intensive industries. Production and emissions from energy intensive manufacturing are strongly
correlated with electricity consumption in this sector. In the long run, as a technical assumption,
demand for electricity from energy intensive manufacturing is anticipated to stay relatively
stable at the 2014-level.
Norway is the sixth largest hydro power producer in the world. Emissions from electricity

IIR 2017
240
production are small in Norway, as about 95 per cent (2011) of the supply of electricity
originates from hydro power. In the projections, the production of renewables (e.g. hydro and
wind power) is exogenously determined.
Table 9.2 lists key macroeconomic assumptions underpinning the Norwegian emission
projections. In the baseline scenario, average annual GDP growth is estimated at 1.9 per cent in
2012-2020 and at 2.1 per cent in 2020-2030. Growth in the mainland economy, i.e. total GDP
excluding petroleum activities and ocean transport, is estimated at 2.4 per cent in 2012-2030.
Table 9.2 Key macroeconomic assumptions
2012 2020 2030 Billion 2012 NOK Annual average growth rate
Gross domestic product 2 965 1.9 2.1
- Petroleum activities and ocean transport 670 0.0 -0.9
- Mainland Norway 2 295 2.4 2.4
Manufacturing 201 2.6 1.6
Consumption 1 176 3.2 4.1
Gross fixed capital formation 660 2.4 0.3
- Petroleum activities and ocean transport 182 1.9 -2.3
- Mainland Norway 478 2.7 1.3
Population in 1000 5 051 1.1 0.9
Number of persons employed in 1000 2 684 1.0 0.3
Level
Oil price (2015-NOK) 685 545 545
EU-ETS price (2014-NOK) 55 60 90
Electricity price (NOK/KWh 2014-NOK) 0.26 0.27 0.41
Net domestic energy use
Annual average growth rate
- Petroleum products (PJ) 278.71 1.4 0.2
- Electricity (TWh) 118.7 1.1 0.3 1 Including energy-sectors and excluding sea transport in international waters.
Sources: Statistics Norway and Ministry of Finance.

IIR 2017
241
10 Reporting on gridded emissions and LPS
Last update: 18.02.15
10.1 Gridded emissions
Information about the geographical distribution of emissions is useful for modelling and control
purposes. The spatial distribution of emissions introduces another dimension (axis) to the
general model.
EMEP grid squares
Emissions by EMEP 0.1° x0.1° grid square are reported to the UNECE and used in models of long-
range air pollution. The emissions are allocated to grid squares as follows:
Emissions from large point sources are allocated directly to the appropriate squares
Emissions at sea from national sea traffic are allocated to squares on the basis of a AIS-data
analysis.
The remaining emissions are allocated to squares according to the following :
When figures for the activity used to calculate emissions are available directly at
geographical level, these figures are used. Examples are fuel combustion in manufacturing
industries and emissions from animals.
When the activity at the geographical level is unknown, the national emissions are
allocated indirectly using surrogate statistical data. For example, fuel combustion in service
industries is allocated using employment figures. In a number of cases the activity is known
directly at the intermediate level (county), but allocation within counties uses surrogate
data.
Scope
Gridded emissions were last reported in 2012 for the years 1990, 1995, 2000, 2005, and 2010, at
the EMEP 50km × 50km grid. Gridded emissions were reported on G-NFR sources. Gridded
emissions of the following components are reported: NOX, NMVOC, SOX, NH3, PM2.5, PM10, and
CO. In addition, gridded emissions of Pb, CD, Hg, dioxins, PAH-4, and HCB were reported in 2014
for the emission years 2005 and 2010 at the EMEP 50km × 50km grid, see chapter 10.1.3.
Gridded emissions on the EMEP 0.1° x0.1° will be reported in 2017 for the years 1990, 1995,
2000, 2005, 2010 and 2015 for the following pollutants: NOX, NMVOC, SOX, NH3, TSP, PM2.5,
PM10, CO, As, Cd, Cr, Cu, Hg, Pb, Dioxins, HCB, PCB, BC, benzo(a)pyrene, benzo(b)fluoranthene,
benzo(k)fluoranthene and Indeno(1,2,3-cd)pyrene.
Recent improvements
In 2012, emissions were reported using a 50 km x 50 km grid. In 2017, emissions will be reported
using a 0.1° x 0.1°grid.

IIR 2017
242
Planned improvements
In the next reporting, the Norwegian Environment Agency plans to reduce incertainty in the
methodologies used to allocate emissions on the grid.
10.2 LPS
Large point sources were last reported in 2012 for the emission years 2005 and 2010. Emission
were reported for a total of 89 LPS for 2005 and 76 LPS in 2010. In 2017, will LSP be reported
according to the new guidelines.
LPS data will be reported for NOX, NMVOC, SOX, NH3, TSP, PM2.5, PM10, CO, As, Cd, Cr, Cu, Hg, Pb,
Dioxins, HCB, PCB, BC, benzo(a)pyrene, benzo(b)fluoranthene, benzo(k)fluoranthene and
Indeno(1,2,3-cd)pyrene, where emissions exceed the reporting limits included in the 2014
reporting guidelines.
IIR 2017
243
References
In this inventory, SFT is a former Norwegian abbreviation for the Norwegian Environment
Agency. Former names are the Climate and Pollution Agency (Klif) 2010-2013, and the
Norwegian Pollution Control Authority (SFT) until 2010.
Aarhus University (2016): Annual Danish Informative Inventory Report to UNECE,
Scientific Report from DCE – Danish Centre for Environment and Energy No.
183, http://dce2.au.dk/pub/SR183.pdf
Aasestad, K. (2013): Emissions of black carbon and organic carbon in Norway 1990-
2011 Statistics Norway
Aasestad, K. (2014): Anslag på utslipp til luft av HCB i Norge 1990-2011.
Dokumentasjon av metode og resultater. (Estimations of emissions to air of HCB
in Norway 1990-2011. Documentation of methodoloy and results). 2014/18:
Statistics Norway
Aasestad, K. (2016): Utslipp til luft av PCB i Norge 1990-2014: SSB
AEA (2007): UK's national atmospheric inventory
Aker Engineering (1992): Direct hydrocarbon gas emissions from production and riser
platforms: Aker Engineering
Andrijewski, M., Bar, M., Baranski, A., Bartczak, A. & Borysiewicz, M. (2004): National
implementation plan for the Stockholm Convention. Warsaw
Aquateam COWI AS (2014): Forbruk av annen organisk gjødsel for å beregne utslipp av
N2O fra jordbruket. Commissioned report by Norwegian Environment Agency
(Miljødirektoratet), Report nr: 14041. Project nr: O-14110. 29 pp
Bakken, J., Husdal, G., Henriksen, T. S. & Langørgen, Ø. (2008): Verification of scaling
laws for calculating NOX emissions from offshore flares - Extended version,
SINTEF Technical Report TR F6619: SINTEF
Bang, J. (1993): Utslipp fra dieseldrevne anleggsmaskiner, arbeidsredskaper, traktorer og
lokomotiver (Emissions from diesel-powered construction machinery, tools,
tractors and locomotives). Oslo: National institute of technology
Bang, J. (1996): Utslipp av NMVOC fra fritidsbåter og bensindrevne motorredskaper
(Emissions of NMVOC from leisure craft and gasoline-powered equipment).
Oslo: National institute of technology
Bjørketun, U. & Nilsson, G. (2007): Skaderisker för motorcyklister. Linköping: VTI
Bremmer, H. J., Troost, L. M., Kuipers, G., de Koning, J. & Sein, A. A. (1994): Emission
of dioxins in the Netherlands, Report 770501018. 185 pp
Bremnes Nielsen, J. & Stenersen, D. (2009): Analysis of NOx emission factor for ships,
2009: Marintek. 22 pp
Bremnes Nielsen, J. & Stenersen, D. (2010): Emission factors for CH4, NOx, particulates
and black carbon for domestic shipping in Norway. Trondheim: Marintek. 35 pp
Brock, C. A., Döpelheuer, A., Petzol, A. & Schröder, F. (1999): In situ observations and
model calculations of black carbon emissions by aircraft at cruise altitude.
Journal of Geophysical Research, 104(D18): 22,171–22,181
Bækken, T. (1993): Miljøvirkninger av vegtrafikkens asfalt og dekkslitasje. Oslo:
Norwegian institute of water research
CITEPA (2016): IIR-OMINEA
Climate and Pollution Agency (2011): Klimakvoter for 2008–2012: Climate and Pollution

IIR 2017
244
Agency. Available at: http://www.klif.no/Tema/Klima-og-ozon/CO2-
kvoter/Klimakvoter-for-2008/
Cooper, D. (2004): HCB, PCB, PCDD and PCDF emissions from ships. Stockholm:
Swedish EPA
Daasvatn, L., Flugsrud, K., Høie, H., Rypdal, K. & Sandmo, T. (1992): Modell for
beregning av nasjonale utslipp til luft. Dokumentasjon (Model for calculation of
national air emissions. Documentation), Interne notater 92/17: Statistics Norway
(SSB-Statistisk sentralbyrå)
Daasvatn, L., Flugsrud, K., Hunnes, O. K. & Rypdal, K. (1994): Beregning av
regionaliserte utslipp til luft. Beskrivelse av modell og metoder for estimering
(Calculation of emissions to air on a regional basis. Description of a model and
estimation methods), Notater 94/16: Statistics Norway (SSB-Statistisk
sentralbyrå)
Dämmgen, U., Lüttich, M., Döhler, H., Eurich-Menden, B. & Osterburg, B. (2002):
GAS-EM – a procedure to calculate gaseous emissions from agriculture.
Landbauforsch Völkenrode, 52: 19-42
Döpelheuer, A. & Lecht, M. (1998). Influence of engine performance on emission
characteristics. RTO AVT Symposium on "Gas Turbine Engine Combustion,
Emissions and Alternative Fuels". NATO research and technology organization.
RTO Meeting proceedings. 14.
EBA (2014): Expert judgement by Contractors Association - Building and Construction
(EBA), Oslo, Norway.
ECETOC (1994): Ammonia Emissions to Air in Western Europe, Technical report No.
62. Brussels, Belgium: ECETOC-European Centre for Ecotoxicology and
Toxicology of Chemicals. 210 pp
EEA (1996): EMEP/Corinair. The atmospheric emission inventory guidebook. First
edition. Copenhagen: European environmental agency
EEA (2001): EMEP/CORINAIR Atmospheric Emission Inventory Guidebook - 3rd
edition, Technical report No 30: EEA-European Environment Agency
EEA (2007): EMEP/CORINAIR Atmospheric Emission Inventory Guidebook - 2007,
Technical report No 16/2007: EEA-European Environment Agency
EEA (2009): EMEP/EEA air pollutant emission inventory guidebook - 2009, Technical
report No 9/2009: EEA-European Environment Agency
EEA (2013): EMEP-EEA air pollutant emission inventory guidebook,
http://www.eea.europa.eu/publications/emep-eea-guidebook-2013 (aviation
factors in section 1.A.3.a Aviation annex.zip).
EEA (2015): EMEP/EEA emission inventory guidebook 2013 Update July 2015. 3.B
Manure management
EEA (2016): EMEP-EEA air pollutant emission inventory guidebook,
http://www.eea.europa.eu/publications/emep-eea-guidebook-2016: EEA
EPA (1986): Ferro-alloy industry particulate emissions: Source category report: U.S.
environmental protection agency
EPA (1998): Locating and estimating air emissions from sources of polycyclic organic
matter, EPA-454/R-98-014: U.S. Environmental Protection Agency
EPA (2002): Compilation of air pollutant emission factors. Fifth edition: U.S.
environmental protection agency
Finstad, A., Haakonsen, G., Kvingedal, E. & Rypdal, K. (2001): Utslipp til luft av noen
miljøgifter i Norge - Dokumentasjon av metode og resultater (Emissions of some
hazardous chemicals to air in Norway - Documentation of methodology and
results), Report 2001/17: Statistics Norway (SSB-Statistisk sentralbyrå). 64 pp

IIR 2017
245
Finstad, A., Flugsrud, K. & Rypdal, K. (2002a): Utslipp til luft fra norsk luftfart 1989-
2000 (Emissions to Air from Norwegian Air Traffic 1989-2000), Reports
2002/08: Statistics Norway (SSB-Statistisk sentralbyrå). 32 pp
Finstad, A., Haakonsen, G. & Rypdal, K. (2002b): Utslipp til luft av dioksiner i Norge -
Dokumentasjon av metode og resultater (Emissions to air of dioxins in Norway -
Documentation of methodology and results), Report 2002/7: Statistics Norway (SSB-
Statistisk sentralbyrå)
Finstad, A., Haakonsen, G. & Rypdal, K. (2003): Utslipp til luft av partikler i Norge -
Dokumentasjon av metode og resultater (Emissions to air of particles in Norway -
Documentation of methodology and results), Report 2003/15: Statistics Norway
(SSB-Statistisk sentralbyrå). 45 pp
Finstad, A. & Rypdal, K. (2003): Utslipp til luft av kobber, krom og arsen i Norge -
Dokumentasjon av metode og resultater: Statistics Norway
Flugsrud, K., Hoem, B. & Aasestad, K. (2010): Utslipp til luft av NOx fra innenriks
sjøfart og fiske: Statistics Norway
Fyns Amt (2000): Estimert beregning for årlig dioxinemission på 8 anlæg i Fyns Amt
(Estimated calculation for yearly dioxin emissions on 8 plants in Fyns Amt),
Report 15.420: dk-TEKNIK Fredericia
Gundersen, G. I. & Rognstad, O. (2001): Lagring og bruk av husdyrgjødsel (Storage and
use of manure), Reports 2001_39: Statistics Norway (SSB-Statistisk sentralbyrå)
Haakonsen, G., Holtskog, S., Kvingedal, E., Rypdal, K. & Tornsjø, B. (2000):
Verification of the Norwegian emission inventory. Comparing emission intensity
values with similar countries. Oslo: Statens forurensningstilsyn og Statistisk
sentralbyrå
Haakonsen, G. & Kvingedal, E. (2001): Utslipp til luft fra vedfyring i Norge.
Utslippsfaktorer,
ildstedsbestand og fyringsvaner (Emissions to air from combustion of wood in Norway),
Report 2001/36: Statistics Norway (SSB-Statistisk sentralbyrå). 51 pp
Hansen, E. (2000): Substance flow analysis for dioxins in Denmark, Environmental
project No 570 2000: Danish environmental protection agency, Danish ministry of
the environment
Hedalen, T. (1994): Vegslitasje - partikkelstørrelsesfordeling. Trondheim: Institute of
social research in industry (SINTEF), Bergteknikk
Hedalen, T. & Myran, T. (1994): Vegstøvdepot i Trondheim -
partikkelstørrelsesfordeling, kjemisk og mineralogisk sammensetning.
Trondheim: Institute of social research in industry (SINTEF), Bergteknikk
Hetland, Ø. (2016): Expert judgement by Norwegain Environment Agency, Oslo,
Norway.
Hohle, E. E., (ed.) (2005): Bioenergi. Miljø, teknikk og marked. Brandbu: Energigården
Holmengen, N. & Kittilsen, M. O. (2009): Estimating emissions of NMVOC from
solvent and other product use. Revised model, Reports 2009/14: Statistics Norway
(SSB-Statistisk sentralbyrå). 77 pp
Holmengen, N. & Fedoryshyn, N. (2015): Utslipp fra veitrafikken i Norge.
Dokumentasjon av beregningsmetoder, data og resultater. (Emissions from road
traffic in Norway. Documentation of estimation methodologies, data and results).
Statistics Norway
Hutchings, N. J., Sommer, S. G., Andersen, J. M. & Asman, W. A. H. (2001): A detailed
ammonia emission inventory for Denmark. Atmospheric Environment, 35 (11):
1959-1968
INFRAS (2009): Handbook emission factors for road transport (HBEFA). Available at:

IIR 2017
246
http://www.hbefa.net/
INFRAS (2010): Handbook emission factors for road transport (HBEFA), Version 3.1:
INFRAS
Institute of environmental and energy technology (2002): CEPMEIP Database. Available
at: www.mep.tno.nl
Institute of transport economics (1993): Norske reisevaner. Dokumentasjonsrapport for
den landsomfattende reisevaneundersøkelsen 1991-92. Oslo: Institute of transport
economics
IPCC (1997): Greenhouse gas inventory. Reference manual. Revised 1996. IPCC
guidelines for national greenhouse gas inventories. London: Intergovernmental
panel on climate change
IPCC (2006): 2006 IPCC Guidelines for National Greenhouse Gas Inventories: Prepared
by the National Greenhouse Gas Inventories Programme, Eggleston H.S., Buendia
L., Miwa K., Ngara T. and Tanabe K. (eds). Published: IGES, Japan
IVAM (2005): VOC emissions from cosmetics and cleaning agents. Amsterdam, the
Netherlands: IVAM research and consultancy on sustainability
Jenkins, B. M., Jones, A. D., Turn, S. Q. & Williams, R. B. (1996): Particle
concentrations, gas-particle partitioning, and species intercorrelations for
polycyclic aromatic hydrocarbons (PAH) emitted during biomass burning.
Atmospheric Environment, 30 (No. 22): 3825-3835
Johansen, K. & Amundsen, F. H. (2000): Piggdekkundersøkelsen 2000. Modell for
piggdekkbruk: Norwegian public roads administration
Karlengen, I. J., Svihus, B., Kjos, N. P. & Harstad, O. M. (2012): Husdyrgjødsel;
oppdatering av mengder gjødsel og utskillelse av nitrogen, fosfor og kalium.
Sluttrapport. (Manure; an update of amounts of manure and excretion of nitrogen,
phosphorus and potassium. Final report). Ås: Departement of Animal and
Aquacultural Sciences, Norwegian University of Life Sciences (Institutt for
husdyr- og akvakulturvitenskap, NMBU-Norges miljø- og biovitenskapelige
universitet)
Karlsson, E. & Finborud, E. (2012): Utredning av utslippsfaktorer for NOx for
forbrenningsmotorer på offshoreinstallasjoner, DNV Report 13HLG9F-1. Oslo:
DNV- Det Norske Veritas
Kupiainen, K. & Klimont, Z. (2004): Primary Emissions of Submicron and Carbonaceous
Particles in Europe and the Potential for their Control: IIASA. 122 pp
Kupiainen, K. & Klimont, Z. (2007): Primary emissions of fine carbonaceous particles in
Europe. Atmospheric Environment, 41(10)
Langøren, Ø. & Malvik, B. (2010): Utredning av mulige utslipp til luft av PCB, HCB og
dioksiner fra termiske prosesser offshore: SINTEF
Larssen, S. (1985): Støv fra asfaltveier. Karakterisering av luftbåret veistøv. Fase 1:
Målinger i Oslo, våren 1985. Kjeller: Norwegian institute for air research (NILU).
Lystad, H. (2005): Hjemmekompostering i kommunal regi – NRF medlemsundersøkelse.
NRF - Samarbeidsforum for avfallshåndtering
McEwen, J. D. N. & Johnson, M. R. (2011): Black Carbon Particulate Matter Emission
Factors for Buoyancy Driven Associated Gas Flares. Journal of the Air & Waste
Management Association submitted
Ministry of the Environment (2004): Forskrift om begrensning i bruk av helse- og
miljøfarlige kjemikalier og andre produkter (produktforskriften). (Regulations
relating to restrictions on the manufacture, import, export, sale and use of
chemicals and other products hazardous to health and the environment (Product
regulations)): Ministry of the Environment (Miljøverndepartementet)
IIR 2017
247
Morken, J. (2003): Evaluering av ammoniakkutslippsmodellen (Evaluation of the
ammonia emission model). Internal Note. Department of Agricultural
Engineering. Norwegian University of Life Sciences (NMBU-Norges miljø- og
biovitenskapelige universitet)
Morken, J. & Nesheim, L. (2004): Utnytting og tap av næringsstoff i husdyrgjødsel -
framtidige utfordingar. Grønn kunnskap, 8 (3): 51-64
Morken, J., Linjordet, R. & Bøen, A. (2005): Norwegian ammonia emissions - present
state and perspective. In Kuczynski, T., Dämmgen, U., Webb, J. & Myczko, A.
(eds) Emissions from European agriculture, pp. 181-191. Netherlands:
Wageningen Academic Publishers
National institute of technology (1991): Tiltak 11. Reduksjon av VOC-utslipp fra
totaktsmotorer. . Oslo: National institute of technology
NEA (2015): Greenhouse Gas Emissions 1990-2013. Annexes to NIR 2015., Report M-
423: Norwegian Environment Agency
NEA (2016): National Inventory Report
Nielsen, Plejdrup, Winther, Mikkelsen, H., Nielsen, Gyldenkærne, Fauser, Albrektsen,
Hjelgaard, Bruun, et al. (2015): ANNUAL DANISH INFORMATIVE
INVENTORY REPORT TO UNECE. 488 pp
Nielsen, O.-K., Lyck, E., Mikkelsen, M. H., Hoffmann, L., Gyldenkærne, S., Winther,
M., Nielsen, M., Fauser, P., Thomsen, M., Plejdrup, M. S., et al. (2010):
Denmark’s National Inventory Report 2010. Emission Inventories 1990-2008 -
Submitted under the United Nations Framework Convention on Climate Change
and the Kyoto Protocol, NERI Technical Report No 784. Aarhus University,
Denmark: National Environmental Research Institute of Denmark (DMU-
Danmarks Miljøundersøgelser). 1178 pp
Norsk Energi (2003): Vurdering av utslippsfaktorer for beregning av NOX-utslipp med
mer fra stasjonær forbrenning i Norge: Norsk Energi
Norsk Energi (2006): NOX-utslipp i forbindelse med eventuell NOX-avgift Norsk Energi
Norwegian Directorate of Health (1990): Retningslinjer for inneluftkvalitet (Guidelines
for indoor air quality), Helsedirektoratets utredningsserie 6/90: Norwegian
Directorate of Health (Helsedirektoratet). 113 pp
Norwegian Product Register (2007): Produktdeklarering - skjema og veiledning: Vedlegg
med kodesystem UCN (Guidelines for declaration of chemical products: Appendix
on UCN codes): Norwegian Environment Agency (Miljødirektoratet). Available
at: http://www.miljodirektoratet.no/no/Tjenester-og-
verktoy/Skjema/Produktdeklarering/ (accessed: 2007)
Norwegian public roads administration (1995a): Undersøkelse av vegvedlikehold og
kjøreforhold - vinteren 1994/1995. Del I: Samlet fremstilling og analyser av
undersøkelsene i perioden 1990 - 94: Norwegian public roads administration
Norwegian public roads administration (1995b): Undersøkelse av vegvedlikehold og
kjøreforhold - vinteren 1994/1995. Del II: Statistikkhefte for undersøkelsene i
perioden 1990 - 94: Norwegian public roads administration
Norwegian public roads administration (1996): Veg-grepsprosjektet; Delprosjekt 5.15:
Samfunnsøkonomiske konsekvenser; Dokumentasjon av beregningsmodell
Norwegian public roads administration
Norwegian public roads administration (1997): Veg-grepsprosjektet: Samlerapport;
Konklusjoner, forslag til ny veg-grepspolitikk og resultater Norwegian public
roads administration
Norwegian public roads administration (1998): Undersøkelse av vegvedlikehold og
kjøreforhold - vinteren 1997/98 Landssammenstilling Norwegian public roads

IIR 2017
248
administration
OLF (1991): OLF Environmental Programme. Report Phase I - Part A - Emissions to air.
Stavanger: Norwegian Oil Industry Association (OLF-Oljeindustriens
landsforening)
OLF (2009): Veiledning til den Årlige Utslippsrapporteringen: Norwegian Oil Industry
Association (OLF-Oljeindustriens landsforening). 80 pp
Parma, Z., Vosta, J., Horejs, J., Pacyna, J. M. & Thomas, D. (1995): Atmospheric
emission inventory guidelines for persistent organic pollutants (POPs). Prague
Rosland, A. (1987): Utslipps-koeffisienter. Oversikt over koeffsienter for utslipp til luft
og metoder for å beregne disse: Norwegian Pollution Control Authority (SFT-
Statens forurensingstilsyn)
Rypdal, K. & Mykkelbost, T. (1997): Utslippsfaktorer for miljøgifter (Emission factors
for hazardous chemicals), Internal notes 25.06.1997: Statistics Norway (SSB-
Statistisk sentralbyrå)
Rypdal, K. (1999): Evaluation of uncertainty in the Norwegian emission inventory, SFT-
report 99:01. TA-1609/99: Norwegian Pollution Control Authority (SFT-Statens
forurensingstilsyn), Statistics Norway (SSB-Statistisk sentralbyrå). 58 pp
Rypdal, K. & Zhang, L.-C. (2000): Uncertainties in the Norwegian greenhouse Gas
Emission Inventory, Reports 2000/13: Statistics Norway (SSB-Statistisk
sentralbyrå). 44 pp
Rypdal, K. & Zhang, L.-C. (2001): Uncertainties in Emissions of Long-Range Air
Pollutants, Reports 2001/37: Statistics Norway (SSB-Statistisk sentralbyrå). 49 pp
Sagen, J. (1987): Energiundersøkelsen 1985. Energibruk i privat og offentlig
tjenesteyting (Energy survey 1985. Energy use in private and public services):
Statistics Norway
SFT (1993): Emissions from road traffic in Norway – Methods for estimation, input data
and emisson estimates. Authors: Bang, J., Figenbaum, E., Flugsrud, K., Larssen,
S., Rypdal, K., Torp, C., SFT report 93:12. Oslo: Norwegian Pollution Control
Authority (SFT-Statens forurensingstilsyn)
SFT (1996): Utslipp ved håndtering av kommunalt avfall (Emissions from municipal
waste management). Authors: Sandgren J., Heie, A. and Sverud, T., SFT-report
96:16. TA-1366/96. Oslo: Norwegian Pollution Control Authority (SFT-Statens
forurensingstilsyn)
SFT (1999a): PAH-utslipp til sjø og luft fra aluminiumsverkene på Lista, Karmøy og
Mosjøen (PAH emissions to sea and air from the aluminium works at Lista,
Karmøy and Mosjøen), Note. Oslo: Norwegian Pollution Control Authority (SFT-
Statens forurensingstilsyn)
SFT (1999b): Utslipp fra veitrafikk i Norge. Dokumentasjon av beregningsmetode, data
og resultater (Emissions from road traffic in Norway - Method for estimation,
input data and emission estimates). Authors: Bang, J., Flugsrud, K., Haakonsen,
G., Holtskog, S., Larssen, S., Maldum, K.O., Rypdal, K. and A. Skedsmo, SFT-
report 99:04 (Updated SFT report 93:12). TA-1622/99. Oslo: Norwegian
Pollution Control Authority (SFT-Statens forurensingstilsyn)
SFT (2001): Harmonized quantfication and reporting procedures (HARP-HAZ
Prototype), Report 1789/2001. Oslo: Norwegian Pollution Control Authority
(SFT-Statens forurensingstilsyn)
SFT (2005): Kartlegging av omsetning av enkelte miljøskadelige stoffer i legemidler og
kosmetikk (Survey of turnover of some environmentally hazardous substances in
pharmaceuticals and cosmetics), TA-2128/05. Oslo: Norwegian Pollution Control
Authority (SFT-Statens forurensingstilsyn)

IIR 2017
249
SINTEF (2013): Particle emission factors for wood stove firing in Norway : the
"BLACKOut" project. Commissioned report by Norwegian Climate and Pollution
Agency (Klif-Klima- og forurensningsdirektoratet): SINTEF Energy Research. 66
pp
Skullerud, H. (2014): Method for estimation of emissions from air traffic (in Norwegian).
Unpublished document Statistics Norway
Skårman, T., Danielsson, H., Henningsson, E. & Östmann, M. (2006): Revised Method
for Estimating Emissions of NMVOC from Solvent and Other Product Use in
Sweden. Commissioned report by the Swedish Environmental Protection Agency,
SMED Report No 75 2006: SMED Report No 75 2006
Statistics Norway (2001): Natural resources and the environment 2001, Statistical
Analyses 47: Statistics Norway (SSB-Statistisk sentralbyrå). 293 pp
Statistics Norway (2002a): Sample survey of agriculture and forestry 2001: Statistics
Norway (SSB-Statistisk sentralbyrå)
Statistics Norway (2002b): Sample survey of agriculture and forestry 2001. Available at:
http://www.ssb.no/lu_en/arkiv/
Statistics Norway (2004): Sample survey of agriculture and forestry 2003: Statistics
Norway (SSB-Statistisk sentralbyrå)
Statistics Norway (2007): Sample survey of agriculture and forestry 2006: Statistics
Norway (SSB-Statistisk sentralbyrå)
Statistics Norway (2009): Standard Industrial Classification (SIC2007), internet version.
Available at:
http://www3.ssb.no/stabas/ItemsFrames.asp?ID=5552001&Language=en&Versio
nLevel=ClassVersion
Statistics Norway (2010a): Registered distances covered by vehicles 2009. Available at:
http://www.ssb.no/english/subjects/10/12/20/klreg_en/
Statistics Norway (2010b): Road goods transport. Available at:
http://www.ssb.no/english/subjects/10/12/20/lbunasj_en/
Statistics Norway, Gundersen, G. I. & Heldal, J. (2015): Bruk av gjødselressurser i
jordbruket 2013. Metodebeskrivelse og resultater fra en utvalgsbasert
undersøkelse (Use of inorganic and organic fertilisers in agriculture 2013). 84 pp
Statistics Norway (Annually-a): Air transport: Statistics Norway (SSB-Statistisk
sentralbyrå). Available at: http://www.ssb.no/en/transport-og-
reiseliv/statistikker/flytrafikk
Statistics Norway (Annually-b): Sales of petroleum products: Statistics Norway (SSB-
Statistisk sentralbyrå). Available at: http://www.ssb.no/en/energi-og-
industri/statistikker/petroleumsalg/aar?fane=arkiv
Sternbeck, J., Sjödin, Å. & Andrèasson, K. (2001): Spridning av metaller från vägtrafik.
Stockholm: IVL Swedish environmental research institute
Stockholms luft- och bulleranalys (1998a): Metallemission från trafiken i Stockholm -
Slitasje av bromsbelägg. Stockholm: Stockholms luft- och bulleranalys
Stockholms luft- och bulleranalys (1998b): Metallemission från trafiken i Stockholm -
Slitasje av
bromsbelägg (Metal emissions from the traffic in Stockholm- Brake wear), Report 2:98.
Stockholm: Stockholms luft- och bulleranalys
Sundstøl, F. & Mroz, Z. (1988): Utskillelse av nitrogen og fosfor i gjødsel og urin fra
husdyr i Norge (Nitrogen and phosphorus in manure and urine from domestic
animals in Norway), Report no. 4 from the project "Agricultural policy and
environmental management". Ås: Agricultural University of Norway (Norges
landbrukshøgskole)

IIR 2017
250
Swedish environmental protection agency (2011): National inventory report 2011
Sweden - Annexes: Swedish environmental protection agency
SYKE (2013): Air pollutant emissions in Finland 1980–2011. Informative inventory
report.: Finnish Environment Institute (SYKE).
TINE BA (Annually): Nøkkeltall fra Kukontrollen: TINE
TNO (2008): Road traffic tyre wear. Emission estimates for diffuse sources: Netherlands
Emission Inventory
Toda, E. (2006): POPs and heavy metals emission inventory of Japan.: Ministry of the
Environment.
Tornsjø, B. (2001): Utslipp til luft fra innenriks sjøfart, fiske og annen sjøtrafikk mellom
norske havner. Oslo: Statistics Norway
Vaaje, T. (2006): Piggdekk eller piggfritt? Hvilke valg gjør norske bilister i 2006?
Sollerud: Gjensidige
van den Brink, R. M. M. (1996): Deeltjesemissie door wegverkeer; emissiefactoren,
deeltjesgrootteverdeling en chemische samenstelling (Particulate emissions from
road traffic: emission factors, size distribution and chemical composition).
Bilthoven: National institute of public health and enviromental protection (RIVM)
Vågane, L. & Rideng, A. (2010): Transportytelser i Norge 1946-2009. Oslo: Institute of
transport economics
Winther, M. & Nielsen, O.-K. (2006): Fuel use and emissions from non-road machinery
in Denmark from 1985-2004 - and projections from 2005-2030, Environmental
project no. 1092 2006: National environmental research institute, Danish ministry
of the environment
IIR 2017
251
Appendix A
Tier 1 Key Category Analysis- Norway – 2017 submission
Methodology
The submission includes tier 1 key category analysis for the years 1990 and 2015 for the
components SO2, NOX, NH3, NMVOC, CO, TSP, PM10, PM2.5, Pb, Hg, Cd, dioxins, PAH, HCB and
PCB.
The same procedure has been performed for 1990 and 2015. The emissions are analysed using
the NFR14 sources (from the NFR 2014-2 reporting template) for both years. For each
component the sources have been sorted according to their share of emissions, and the
percentage of emissions of the component has been calculated. Sources are assigned as key
until 95% of total emissions are covered.
For convenience, the analysis was performed with a few exceptions from the NFR14:
Gasoline evaporation (1 A 3 b v) is included in 1 A 3 b i-iv
These exceptions do not change the ranking of the other categories, but they may affect which
categories are included at the margin.
The result tables 1-18 are sorted by share of total emissions in 2015 for each component
separately. Key categories in 1990 which were not key in 2015 are placed at the bottom of each
table.
When a source has become key in 2015, this may either mean that the emissions from this
source have increased, or that it has decreased less than other sources. The key category
analysis does not give information about the magnitude of emissions from each source, and can
thus not be used to evaluate trends in emission levels for any given source.
Results
74 per cent of the 93 sources with emissions in 2015 were key to at least one component. This
means that 24 sources have emissions, but are not key category for any component. This is
especially prominent within the solvents and agriculture categories.
Some sources are key category to a wide range of components. This is the case in particular for
public electricity and heat production (1 A 1 a), manufacture of solid fuels and other energy
industries (1 A 1 c), road traffic (1 A 3 B i-iii), national navigation (1 A 3 d ii), residential plants (1
A 4 b i), ferroalloys production (2 C 2), aluminium production (2 C 3) and field burning of
agricultural residue (3 F). The latter is not key to any primary gases, except CO, but key to
particulates and a range of heavy metals and POPs.
Iron and steel production (2 C 1) is key category only to POPs and heavy metals.
Looking at the three most dominant sources of emissions for each component in 2015, it
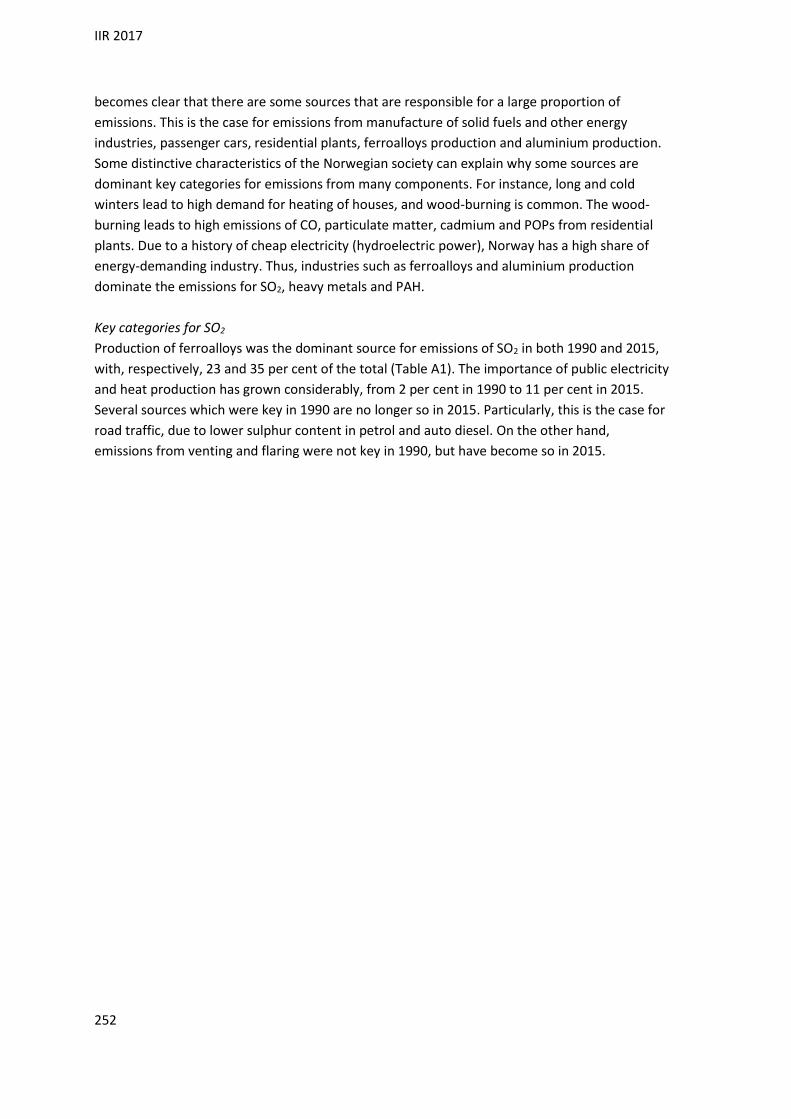
IIR 2017
252
becomes clear that there are some sources that are responsible for a large proportion of
emissions. This is the case for emissions from manufacture of solid fuels and other energy
industries, passenger cars, residential plants, ferroalloys production and aluminium production.
Some distinctive characteristics of the Norwegian society can explain why some sources are
dominant key categories for emissions from many components. For instance, long and cold
winters lead to high demand for heating of houses, and wood-burning is common. The wood-
burning leads to high emissions of CO, particulate matter, cadmium and POPs from residential
plants. Due to a history of cheap electricity (hydroelectric power), Norway has a high share of
energy-demanding industry. Thus, industries such as ferroalloys and aluminium production
dominate the emissions for SO2, heavy metals and PAH.
Key categories for SO2
Production of ferroalloys was the dominant source for emissions of SO2 in both 1990 and 2015,
with, respectively, 23 and 35 per cent of the total (Table A1). The importance of public electricity
and heat production has grown considerably, from 2 per cent in 1990 to 11 per cent in 2015.
Several sources which were key in 1990 are no longer so in 2015. Particularly, this is the case for
road traffic, due to lower sulphur content in petrol and auto diesel. On the other hand,
emissions from venting and flaring were not key in 1990, but have become so in 2015.

IIR 2017
253
Table A1. Key categories for SO2 emissions, 1990 and 2015. Key categories are given in bold italic.
Source 1990 2015
2C2 Ferroalloys production 23.0 % 34.5 % 1A1a Public electricity and heat production 2.1 % 11.2 % 2C3 Aluminium production 8.2 % 7.8 % 2C7c Other metal production 0.9 % 5.9 % 1B2aiv Fugitive emissions oil: Refining / storage 6.9 % 5.6 % 2B5 Carbide production 8.5 % 4.4 % 1A3dii National navigation (shipping) 8.0 % 3.9 % 2A1 Cement production 1.1 % 3.4 % 1A1b Petroleum refining 0.7 % 3.4 % 1A1c Manufacture of solid fuels and other energy industries 0.8 % 3.4 % 1A4ciii Agriculture/Forestry/Fishing: National fishing 3.6 % 2.6 % 1A4bi Residential: Stationary 2.5 % 1.9 % 1A2c Stationary combustion in manufacturing industries and
construction: Chemicals 1.6 % 1.9 %
1A4ai Commercial/institutional: Stationary 1.9 % 1.7 % 1A2f Stationary combustion in manufacturing industries and
construction: Non-metallic minerals 1.7 % 1.6 %
1B2c Venting and flaring (oil, gas, combined oil and gas) 0.1 % 1.3 % 2A6 Other mineral products 0.5 % 1.0 % 2H1 Pulp and Paper 3.6 % 0.6 % 1A3biii Road transport: Heavy duty vehicles and buses 3.4 % 0.1 % 1A2gviii Stationary Combustion in manufacturing industries and
construction: Other 3.1 % 0.7 %
1A2e Stationary combustion in manufacturing industries and construction: Food processing, beverages and tobacco
2.5 % 0.5 %
2B10a Chemical industry: Other 2.4 % 0.0 % 1A2d Stationary combustion in manufacturing industries and
construction: Pulp, Paper and Print 2.3 % 0.9 %
1A3bi Road transport: Passenger cars 2.2 % 0.1 % 2B6 Titanium dioxide production 1.0 % 0.0 % 1A2gvii Mobile Combustion in manufacturing industries and
construction: 0.9 % 0.1 %
1A4cii Agriculture/Forestry/Fishing: Off-road vehicles and other machinery
0.9 % 0.0 %
1A3bii Road transport: Light duty vehicles 0.7 % 0.1 % 2H3 Other industrial processes 1.1 % .
Key categories for NOX
Manufacture of solid fuels and other energy industries was the most import emission source of
NOx in 2015, with a little less than a third of the emissions (Table A2). In 1990, Road transport:
Passenger cars was the dominant source, and the three road transport groups together were
responsible for one third of the emissions. In 2015, this share was reduced to one fifth. The
actual emissions were, however, more than halved in the period, partly due to an increased
share of cars with catalysts. Some new sources have become key categories since 1990. This is
the case for commercial/institutional mobile combustion and civil aviation (domestic and
international).

IIR 2017
254
Table A2. Key categories for NOX emissions, 1990 and 2015. Key categories are given in bold italic.
Source 1990 2015
1A1c Manufacture of solid fuels and other energy industries 12,4 % 31,0 % 1A3dii National navigation (shipping) 15,2 % 11,8 % 1A3bi Road transport: Passenger cars 17,8 % 8,3 % 1A3biii Road transport: Heavy duty vehicles and buses 12,2 % 8,2 % 1A4ciii Agriculture/Forestry/Fishing: National fishing 11,3 % 8,0 % 2C2 Ferroalloys production 4,7 % 5,5 % 1A3bii Road transport: Light duty vehicles 2,5 % 3,3 % 3DA1 Inorganic N-fertilizers (includes also urea application) 2,2 % 2,7 % 1A2gvii Mobile Combustion in manufacturing industries and
construction: 3,5 % 2,4 %
3DA2a Animal manure applied to soils 1,2 % 1,8 % 1A4aii Commercial/institutional: Mobile 0,5 % 1,7 % 1A1a Public electricity and heat production 0,7 % 1,3 % 1A5b Other, Mobile (including military, land based and recreational
boats) 1,5 % 1,2 %
1A4cii Agriculture/Forestry/Fishing: Off-road vehicles and other machinery
1,9 % 1,2 %
1A3ai(i) 1 A 3 a i (i) International Aviation (LTO) 0,2 % 1,2 % 1A3aii(i) Domestic aviation LTO (civil) 0,4 % 1,2 % 1A2f Stationary combustion in manufacturing industries and
construction: Non-metallic minerals 1,7 % 1,0 %
2B2 Nitric acid production 1,2 % 0,8 % 1A4bii Residential: Household and gardening (mobile) 0,6 % 0,8 % 1A4bi Residential: Stationary 1,0 % 0,8 % 1B2aiv Fugitive emissions oil: Refining / storage 0,6 % 0,8 % 1A2c Stationary combustion in manufacturing industries and
construction: Chemicals 0,8 % 0,6 %
1A1b Petroleum refining 0,8 % 0,4 % 1A3c Railways 0,7 % 0,5 % 1A2d Stationary combustion in manufacturing industries and
construction: Pulp, Paper and Print 0,7 % 0,2 %
Key categories for NH3
There has been little change in the key categories for NH3 from 1990 to 2015 (Table A3).
Agricultural sources are dominant. However, field burning of agricultural residue, which was a
key category in 1990, was no longer so in 2015. For passenger cars and sewage sludge applied to
soils and other waste, there has been an opposite development – these were key categories
only in 2015.

IIR 2017
255
Table A3. Key categories for NH3 emissions, 1990 and 2015. Key categories are given in bold italic.
Source 1990 2015
3DA2a Animal manure applied to soils 52,5 % 52,4 % 3DA1 Inorganic N-fertilizers (includes also urea application) 5,4 % 7,9 % 3B1a Manure management - Dairy cattle 6,2 % 5,2 % 3B1b Manure management - Non-dairy cattle 3,5 % 4,3 % 3B3 Manure management - Swine 4,4 % 4,2 % 3DA3 Urine and dung deposited by grazing animals 4,3 % 3,6 % 1A3bi Road transport: Passenger cars 0,7 % 3,0 % 3B4gi Manure mangement - Laying hens 1,9 % 2,8 % 3DA2b Sewage sludge applied to soils 0,6 % 2,3 % 2B2 Nitric acid production 2,0 % 2,2 % 3B2 Manure management - Sheep 2,7 % 2,1 % 3B4e Manure management - Horses 0,8 % 1,7 % 3B4gii Manure mangement - Broilers 1,2 % 1,7 % 5E Other waste 0,5 % 1,3 % 3I Agriculture other 7,4 % 1,2 % 3F Field burning of agricultural residue 4,1 % 0,4 %
Key categories for NMVOC
NMVOC emissions are spread on a wide range of sources. Offshore loading of oil is the dominant
emission source (Table A4), but due to increased use of emission reducing technology, this
source has become less dominant during the period from 1990 to 2015. These emissions were
responsible for 39 per cent of the total in 1990, but only 21 per cent in 2015. In 2015, solvents
were the second most important source for NMVOC. Due to decreases in emissions from other
sources, particularly oil loading, the share is higher than in 1990, although the actual emissions
have been reduced. NMVOC emissions from passenger cars was the second largest emission
source in 1990, but this source’s share of total emissions was reduced from 18 per cent in 1990
to 3 per cent in 2015.

IIR 2017
256
Table A4. Key categories for NMVOC emissions, 1990 and 2015. Key categories are given in bold italic.
Source 1990 2015
1B2ai Fugitive emissions oil: Exploration, production, transport 38,7 % 21,2 % 2D3i Other solvent use 11,1 % 16,6 % 2D3a Domestic solvent use including fungicides . 8,7 % 1A4bii Residential: Household and gardening (mobile) 3,6 % 7,3 % 1B2c Venting and flaring (oil, gas, combined oil and gas) 1,1 % 6,8 % 1B2aiv Fugitive emissions oil: Refining / storage 3,1 % 4,9 % 1A4bi Residential: Stationary 2,4 % 4,5 % 2D3d Coating applications 4,3 % 4,4 % 1A3bi Road transport: Passenger cars 17,8 % 3,0 % 1B2av Distribution of oil products 3,4 % 2,8 % 3B1b Manure management - Non-dairy cattle 1,4 % 2,3 % 3B1a Manure management - Dairy cattle 1,3 % 1,8 % 1A1c Manufacture of solid fuels and other energy industries 0,4 % 1,7 % 1B2b Fugitive emissions from natural gas (exploration, production,
processing, transmission, storage, distribution and other) 0,4 % 1,5 %
1A1a Public electricity and heat production 0,1 % 1,3 % 1A3biv Road transport: Mopeds & motorcycles 0,7 % 1,1 % 2C2 Ferroalloys production 0,5 % 0,9 % 2H2 Food and beverages industry 0,5 % 0,8 % 3B4gii Manure mangement - Broilers 0,2 % 0,8 % 1A3dii National navigation (shipping) 0,6 % 0,7 % 5A Solid waste disposal on land 0,4 % 0,5 % 3B4gi Manure mangement - Laying hens 0,2 % 0,5 % 3DA1 Inorganic N-fertilizers (includes also urea application) 0,3 % 0,5 % 1B1a Fugitive emission from solid fuels: Coal mining and handling 0,4 % 0,4 % 2D3e Degreasing 0,4 % 0,3 % 1A3bii Road transport: Light duty vehicles 1,6 % 0,2 % 2D3g Chemical products 0,9 % 0,2 % 1A4cii Agriculture/Forestry/Fishing: Off-road vehicles and other
machinery 0,7 % 0,3 %
1A3biii Road transport: Heavy duty vehicles and buses 0,7 % 0,3 % 2D3f Dry cleaning 0,5 % 0,1 %
Key categories for CO
Aluminium production was the most important emission source for CO in 2015. This share grew
from 13 per cent in 1990 to 38 per cent in 2015. In 1990, passenger cars was the dominant
source, with 42 per cent of the total CO emissions; this share was reduced to only 8 per cent in
2015 (Table A5). Emissions from combustion in households, primarily of fire wood, increased its
emission share from 18 per cent in 1990 to 24 per cent in 2015, although the actual emissions
were reduced by 40 per cent. Emission reductions from some sources have caused that several
minor sources have become key categories in 2015, even though their actual emissions may
have been reduced.

IIR 2017
257
Table A5. Key categories for CO emissions, 1990 and 2015. Key categories are given in bold italic.
Source 1990 2015
2C3 Aluminium production 12,7 % 38,2 % 1A4bi Residential: Stationary 18,5 % 24,3 % 1A4bii Residential: Household and gardening (mobile) 4,8 % 10,7 % 1A3bi Road transport: Passenger cars 42,1 % 7,9 % 1A1c Manufacture of solid fuels and other energy industries 0,6 % 2,7 % 2B5 Carbide production 4,9 % 2,3 % 1A1a Public electricity and heat production 0,1 % 2,1 % 1A3biv Road transport: Mopeds & motorcycles 0,8 % 2,0 % 1A4cii Agriculture/Forestry/Fishing: Off-road vehicles and other
machinery 1,0 % 1,2 %
1A3biii Road transport: Heavy duty vehicles and buses 0,7 % 1,0 % 1A2gviii Stationary Combustion in manufacturing industries and
construction: Other 0,5 % 0,8 %
3F Field burning of agricultural residue 3,3 % 0,8 % 1A3bii Road transport: Light duty vehicles 5,4 % 0,8 % 1A4ciii Agriculture/Forestry/Fishing: National fishing 0,4 % 0,7 % 2C4 Magnesium production 2,4 % .
Key categories for particulates
The dominant emission source for particulates of all sizes both in 1990 and 2015 is burning of
fuel wood in small stoves in households (Tables A6-A8). For PM2.5, more than half of the
emissions came from this source in both 1990 and 2015. The importance of the different other
emission sources vary some what between the different PM fractions, but other mineral
products is important for TSP and PM10 and ferroalloys production for both PM10 and PM2.5.

IIR 2017
258
Table A6. Key categories for TSP emissions, 1990 and 2015. Key categories are given in bold italic.
Source 1990 2015
1A4bi Residential: Stationary 32,7 % 31,7 % 2A6 Other mineral products 6,3 % 10,0 % 2D3b Road paving with asphalt 5,1 % 9,1 % 1A3bvi Road transport: Automobile tyre and brake wear 4,3 % 8,3 % 1A3bvii Road transport: Automobile road abrasion 11,0 % 8,2 % 2C2 Ferroalloys production 5,7 % 3,6 % 1A1a Public electricity and heat production 0,7 % 2,6 % 2A5b Construction and demolition 1,6 % 2,6 % 2C3 Aluminium production 3,6 % 2,3 % 1A1c Manufacture of solid fuels and other energy industries 0,7 % 2,1 % 1A3dii National navigation (shipping) 1,9 % 1,6 % 3B4gii Manure mangement - Broilers 0,5 % 1,4 % 1A2c Stationary combustion in manufacturing industries and
construction: Chemicals 0,3 % 1,2 %
1A4ciii Agriculture/Forestry/Fishing: National fishing 1,1 % 1,1 % 1A2gviii Stationary Combustion in manufacturing industries and
construction: Other 1,6 % 1,0 %
1B2c Venting and flaring (oil, gas, combined oil and gas) 1,6 % 1,0 % 3B4gi Manure mangement - Laying hens 0,5 % 1,0 % 3DC Farm-level agricultural operations including storage, handling
and transport of agricultural products 1,0 % 1,0 %
3B3 Manure management - Swine 0,6 % 0,8 % 2B2 Nitric acid production 1,9 % 0,8 % 1A4bii Residential: Household and gardening (mobile) 0,5 % 0,7 % 3B1b Manure management - Non-dairy cattle 0,6 % 0,7 % 1A3bi Road transport: Passenger cars 0,4 % 0,6 % 3B4giv Manure management - Other poultry 0,2 % 0,6 % 3B1a Manure management - Dairy cattle 0,7 % 0,6 % 3F Field burning of agricultural residue 3,4 % 0,5 % 1A3bii Road transport: Light duty vehicles 0,7 % 0,5 % 2B5 Carbide production 2,0 % 0,1 % 1A3biii Road transport: Heavy duty vehicles and buses 1,5 % 0,4 % 1A4cii Agriculture/Forestry/Fishing: Off-road vehicles and other
machinery 1,1 % 0,4 %
2H3 Other industrial processes 0,8 % 0,0 % 2H1 Pulp and Paper 0,6 % 0,1 % 1A2gvii Mobile Combustion in manufacturing industries and
construction: 0,4 % 0,2 %

IIR 2017
259
Table A7. Key categories for PM10 emissions, 1990 and 2015. Key categories are given in bold italic.
Source 1990 2015
1A4bi Residential: Stationary 41,9 % 44,4 % 2A6 Other mineral products 4,2 % 7,1 % 2C2 Ferroalloys production 7,5 % 5,1 % 1A3bvii Road transport: Automobile road abrasion 4,3 % 3,5 % 1A1a Public electricity and heat production 0,7 % 3,4 % 2C3 Aluminium production 4,6 % 3,1 % 1A1c Manufacture of solid fuels and other energy industries 0,9 % 3,0 % 2D3b Road paving with asphalt 1,4 % 2,8 % 1A3dii National navigation (shipping) 2,5 % 2,2 % 3B4gii Manure mangement - Broilers 0,7 % 2,0 % 2A5b Construction and demolition 1,1 % 1,8 % 1A4ciii Agriculture/Forestry/Fishing: National fishing 1,5 % 1,5 % 1A2c Stationary combustion in manufacturing industries and
construction: Chemicals 0,3 % 1,5 %
1A3bvi Road transport: Automobile tyre and brake wear 0,7 % 1,5 % 3B4gi Manure mangement - Laying hens 0,7 % 1,4 % 3DC Farm-level agricultural operations including storage, handling
and transport of agricultural products 1,3 % 1,4 %
1B2c Venting and flaring (oil, gas, combined oil and gas) 2,0 % 1,4 % 1A2gviii Stationary Combustion in manufacturing industries and
construction: Other 1,9 % 1,3 %
1A4bii Residential: Household and gardening (mobile) 0,7 % 1,0 % 2B2 Nitric acid production 2,0 % 0,9 % 1A3bi Road transport: Passenger cars 0,5 % 0,9 % 3B4giv Manure management - Other poultry 0,2 % 0,8 % 3F Field burning of agricultural residue 4,4 % 0,7 % 1A3bii Road transport: Light duty vehicles 0,9 % 0,7 % 1A4ai Commercial/institutional: Stationary 0,1 % 0,6 % 1A4cii Agriculture/Forestry/Fishing: Off-road vehicles and other
machinery 1,4 % 0,6 %
1A3biii Road transport: Heavy duty vehicles and buses 2,0 % 0,5 % 2B5 Carbide production 2,7 % 0,1 % 2H1 Pulp and Paper 0,7 % 0,1 % 2H3 Other industrial processes 0,5 % 0,0 % 1A2gvii Mobile Combustion in manufacturing industries and
construction: 0,5 % 0,2 %
2G Other product use 0,4 % 0,3 % 1A2d Stationary combustion in manufacturing industries and
construction: Pulp, Paper and Print 0,4 % 0,2 %
5E Other waste 0,4 % 0,4 %

IIR 2017
260
Table A8. Key categories for PM2.5 emissions, 1990 and 2015. Key categories are given in bold italic.
Source 1990 2015
1A4bi Residential: Stationary 51,0 % 56,9 % 2C2 Ferroalloys production 9,4 % 6,8 % 1A1a Public electricity and heat production 0,4 % 4,1 % 1A1c Manufacture of solid fuels and other energy industries 1,1 % 3,8 % 1A3dii National navigation (shipping) 3,0 % 2,8 % 1A4ciii Agriculture/Forestry/Fishing: National fishing 1,7 % 1,9 % 1A2c Stationary combustion in manufacturing industries and
construction: Chemicals 0,3 % 1,9 %
2C3 Aluminium production 2,5 % 1,8 % 1A2gviii Stationary Combustion in manufacturing industries and
construction: Other 2,3 % 1,8 %
1B2c Venting and flaring (oil, gas, combined oil and gas) 2,0 % 1,7 % 1A3bvi Road transport: Automobile tyre and brake wear 0,6 % 1,4 % 1A4bii Residential: Household and gardening (mobile) 0,9 % 1,3 % 1A3bi Road transport: Passenger cars 0,6 % 1,1 % 2A6 Other mineral products 0,7 % 1,0 % 3F Field burning of agricultural residue 5,2 % 0,9 % 2B2 Nitric acid production 1,8 % 0,9 % 1A3bii Road transport: Light duty vehicles 1,1 % 0,9 % 1A3bvii Road transport: Automobile road abrasion 0,9 % 0,8 % 1A4ai Commercial/institutional: Stationary 0,1 % 0,7 % 1A4cii Agriculture/Forestry/Fishing: Off-road vehicles and other
machinery 1,6 % 0,7 %
1A3biii Road transport: Heavy duty vehicles and buses 2,4 % 0,7 % 2D3b Road paving with asphalt 0,2 % 0,5 % 5E Other waste 0,5 % 0,5 % 2G Other product use 0,6 % 0,4 % 2B5 Carbide production 3,3 % 0,2 % 1A2gvii Mobile Combustion in manufacturing industries and
construction: 0,6 % 0,3 %
2H1 Pulp and Paper 0,5 % 0,0 % 1A2D Stationary combustion in manufacturing industries and
construction: Pulp, Paper and Print 0,5 % 0,2 %
Key categories for lead (Pb)
There has been a dramatic change in dominant sources for emissions of lead from 1990 to 2015
(Table A9). In 1990, road traffic, particularly passenger cars, was by far the most important
source, with 90 per cent of total lead emissions, due to high lead content in petrol. In 2015,
petrol no longer contained significant amounts of lead, and other sources had become
dominant. The most significant emission source in 2015 was automobile tyre and brake wear,
with 30 per cent of the emissions. Iron and steel production was the second most important
source in 2015, with 18 per cent of the total emissions. Due to the reduced importance of road
traffic, far more sources were key in 2015 than in 1990.

IIR 2017
261
Table A9. Key categories for Pb emissions, 1990 and 2015. Key categories are given in bold italic.
Source 1990 2015
1A3bvi Road transport: Automobile tyre and brake wear 0,6 % 30,4 % 2C1 Iron and steel production 1,3 % 18,1 % 1A3aii(i) Domestic aviation LTO (civil) 0,3 % 7,4 % 1A2c Stationary combustion in manufacturing industries and
construction: Chemicals 0,0 % 7,2 %
1A2f Stationary combustion in manufacturing industries and construction: Non-metallic minerals
0,1 % 4,3 %
2C7c Other metal production 0,1 % 4,3 % 2C3 Aluminium production 0,3 % 3,6 % 2C2 Ferroalloys production 0,7 % 2,9 % 1A2d Stationary combustion in manufacturing industries and
construction: Pulp, Paper and Print 0,1 % 2,6 %
1A4ai Commercial/institutional: Stationary 0,0 % 2,4 % 1A3bi Road transport: Passenger cars 82,3 % 2,3 % 5E Other waste 0,2 % 2,1 % 2B6 Titanium dioxide production 0,1 % 1,8 % 1A3biii Road transport: Heavy duty vehicles and buses 0,6 % 1,8 % 1A4bi Residential: Stationary 0,1 % 1,1 % 2B5 Carbide production 0,3 % 0,9 % 1A3bii Road transport: Light duty vehicles 6,1 % 0,9 % 1A1a Public electricity and heat production 1,1 % 0,9 % 1A3dii National navigation (shipping) 0,1 % 0,7 % 1A4bii Residential: Household and gardening (mobile) 3,0 % 0,1 % 1A3biv Road transport: Mopeds & motorcycles 0,9 % 0,0 % 2A3 Glass production 0,8 % 0,0 %
Key categories for mercury (Hg)
Mercury emissions stem from a wide variety of sources (Table A10). In 1990, ferroalloys
production and other product use (emissions from thermometers, fluorescent tubes and other
instruments) dominated, with more than half of the total emissions. In 2015, ferroalloys
production was still the largest contributor, but the share was reduced from 35 per cent in 1990
to 10 per cent in 2015.

IIR 2017
262
Table A10. Key categories for Hg emissions, 1990 and 2015. Key categories are given in bold italic.
Source 1990 2015
2C2 Ferroalloys production 35,2 % 10,0 % 1A1c Manufacture of solid fuels and other energy industries 0,7 % 9,6 % 1A3dii National navigation (shipping) 2,8 % 8,0 % 1A4ciii Agriculture/Forestry/Fishing: National fishing 1,7 % 7,0 % 1A4bi Residential: Stationary 2,2 % 6,3 % 1A1a Public electricity and heat production 6,9 % 6,2 % 1A4ai Commercial/institutional: Stationary 1,0 % 5,7 % 2G Other product use 20,0 % 5,2 % 1A2d Stationary combustion in manufacturing industries and
construction: Pulp, Paper and Print 1,7 % 4,6 %
2C7c Other metal production . 4,0 % 1A3bi Road transport: Passenger cars 0,9 % 3,7 % 1A2c Stationary combustion in manufacturing industries and
construction: Chemicals 0,8 % 3,5 %
2C1 Iron and steel production 7,0 % 2,8 % 3F Field burning of agricultural residue 4,0 % 2,7 % 1A2f Stationary combustion in manufacturing industries and
construction: Non-metallic minerals 0,7 % 2,6 %
2A6 Other mineral products 0,4 % 1,9 % 1A3ai(i) 1 A 3 a i (i) International Aviation (LTO) 0,1 % 1,8 % 1A3aii(i) Domestic aviation LTO (civil) 0,2 % 1,7 % 1A2gviii Stationary Combustion in manufacturing industries and
construction: Other 1,6 % 1,7 %
2A1 Cement production 1,8 % 1,6 % 1A3bvi Road transport: Automobile tyre and brake wear 0,2 % 1,5 % 2B6 Titanium dioxide production 0,2 % 1,3 % 1A5b Other, Mobile (including military, land based and recreational
boats) 0,3 % 1,0 %
1A3biii Road transport: Heavy duty vehicles and buses 0,1 % 1,0 % 2B10a Chemical industry: Other 5,0 % 0,2 % 5C1bv Cremation 1,5 % 0,4 % 1A2e Stationary combustion in manufacturing industries and
construction: Food processing, beverages and tobacco 1,1 % 0,9 %
Key categories for cadmium (Cd)
Whereas field burning of agricultural residues was the most important emission source for
cadmium in 1990, combustion in households, particularly of fire wood, dominated in 2015
(Table A11). Metal production was responsible for more than one third of the emissions in 1990,
but its share was reduced significantly in 2015. More minor sources were key in 2015 than in
1990.

IIR 2017
263
Table A11. Key categories for Cd emissions, 1990 and 2015. Key categories are given in bold italic.
Source 1990 2015
1A4bi Residential: Stationary 7,0 % 21,5 % 1A1a Public electricity and heat production 6,3 % 9,3 % 1A2c Stationary combustion in manufacturing industries and
construction: Chemicals 0,4 % 9,0 %
3F Field burning of agricultural residue 23,6 % 8,8 % 1A3bvii Road transport: Automobile road abrasion 3,4 % 6,3 % 2C3 Aluminium production 6,1 % 4,8 % 2C2 Ferroalloys production 16,9 % 4,6 % 1A2d Stationary combustion in manufacturing industries and
construction: Pulp, Paper and Print 8,1 % 4,6 %
1A2gviii Stationary Combustion in manufacturing industries and construction: Other
2,5 % 4,5 %
2C6 Zinc production 10,2 % 4,0 % 1A3bi Road transport: Passenger cars 1,1 % 3,9 % 1A4ai Commercial/institutional: Stationary 0,3 % 2,6 % 1A1c Manufacture of solid fuels and other energy industries 0,4 % 2,6 % 1A2f Stationary combustion in manufacturing industries and
construction: Non-metallic minerals 1,4 % 2,3 %
1A3biii Road transport: Heavy duty vehicles and buses 0,4 % 2,1 % 2C1 Iron and steel production 3,1 % 1,4 % 1A3bii Road transport: Light duty vehicles 0,1 % 1,1 % 1A3dii National navigation (shipping) 0,9 % 0,9 % 1A4ciii Agriculture/Forestry/Fishing: National fishing 0,4 % 0,7 % 5E Other waste 0,1 % 0,6 % 2B5 Carbide production 5,9 % 0,1 %
Key categories for dioxins
In 1990, other industrial processes, i.e. ore mines, and magnesium production were the largest
sources of dioxin emissions (Table A12). The enterprises responsible for these emissions have
been shut down since 1990, and thus other sources have become dominant. In 2015, residential
plants were responsible for one third of the dioxin emissions in Norway. Most of these
emissions came from use of fire wood. Since the major emission sources in 1990 have
disappeared, several minor sources have become key in 2015.
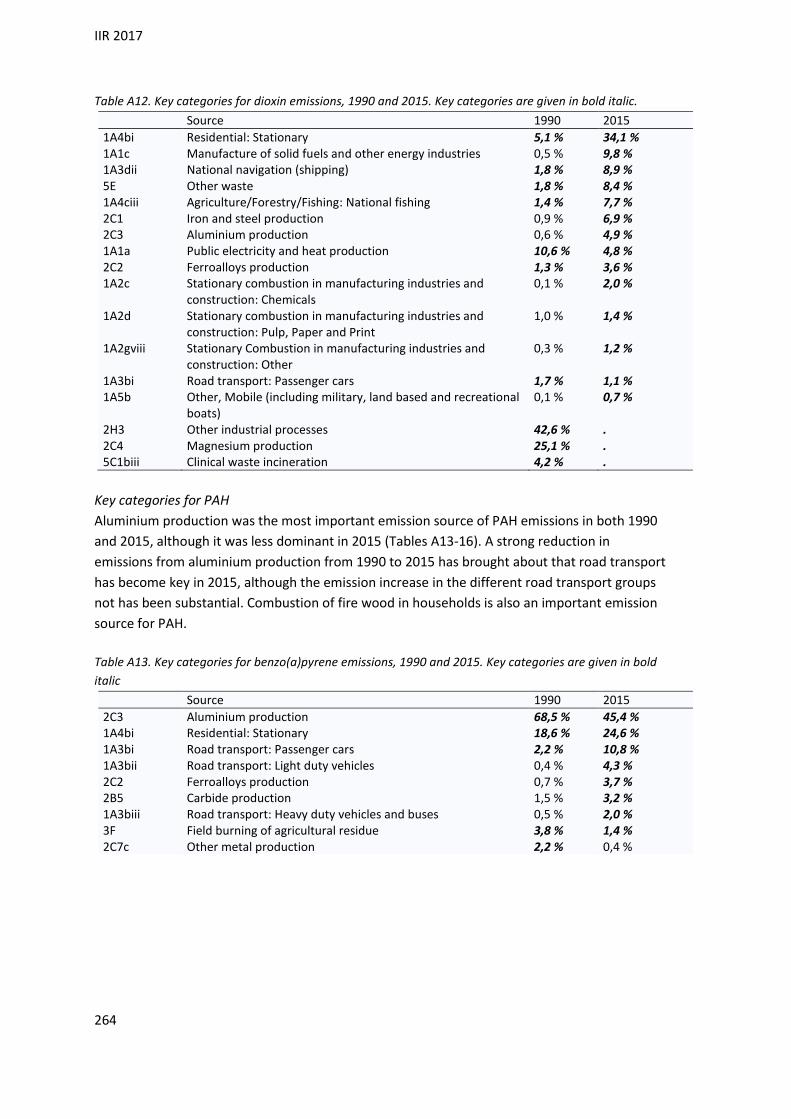
IIR 2017
264
Table A12. Key categories for dioxin emissions, 1990 and 2015. Key categories are given in bold italic.
Source 1990 2015
1A4bi Residential: Stationary 5,1 % 34,1 % 1A1c Manufacture of solid fuels and other energy industries 0,5 % 9,8 % 1A3dii National navigation (shipping) 1,8 % 8,9 % 5E Other waste 1,8 % 8,4 % 1A4ciii Agriculture/Forestry/Fishing: National fishing 1,4 % 7,7 % 2C1 Iron and steel production 0,9 % 6,9 % 2C3 Aluminium production 0,6 % 4,9 % 1A1a Public electricity and heat production 10,6 % 4,8 % 2C2 Ferroalloys production 1,3 % 3,6 % 1A2c Stationary combustion in manufacturing industries and
construction: Chemicals 0,1 % 2,0 %
1A2d Stationary combustion in manufacturing industries and construction: Pulp, Paper and Print
1,0 % 1,4 %
1A2gviii Stationary Combustion in manufacturing industries and construction: Other
0,3 % 1,2 %
1A3bi Road transport: Passenger cars 1,7 % 1,1 % 1A5b Other, Mobile (including military, land based and recreational
boats) 0,1 % 0,7 %
2H3 Other industrial processes 42,6 % . 2C4 Magnesium production 25,1 % . 5C1biii Clinical waste incineration 4,2 % .
Key categories for PAH
Aluminium production was the most important emission source of PAH emissions in both 1990
and 2015, although it was less dominant in 2015 (Tables A13-16). A strong reduction in
emissions from aluminium production from 1990 to 2015 has brought about that road transport
has become key in 2015, although the emission increase in the different road transport groups
not has been substantial. Combustion of fire wood in households is also an important emission
source for PAH.
Table A13. Key categories for benzo(a)pyrene emissions, 1990 and 2015. Key categories are given in bold
italic
Source 1990 2015
2C3 Aluminium production 68,5 % 45,4 % 1A4bi Residential: Stationary 18,6 % 24,6 % 1A3bi Road transport: Passenger cars 2,2 % 10,8 % 1A3bii Road transport: Light duty vehicles 0,4 % 4,3 % 2C2 Ferroalloys production 0,7 % 3,7 % 2B5 Carbide production 1,5 % 3,2 % 1A3biii Road transport: Heavy duty vehicles and buses 0,5 % 2,0 % 3F Field burning of agricultural residue 3,8 % 1,4 % 2C7c Other metal production 2,2 % 0,4 %

IIR 2017
265
Table A14. Key categories for benzo(b)fluoranthene emissions, 1990 and 2015. Key categories are given in
bold italic.
Source 1990 2015
2C3 Aluminium production 70,7 % 45,5 % 1A4bi Residential: Stationary 13,4 % 17,3 % 1A3bvi Road transport: Automobile tyre and brake wear 1,8 % 8,6 % 1A3biii Road transport: Heavy duty vehicles and buses 1,5 % 5,7 % 1A3bi Road transport: Passenger cars 1,2 % 5,6 % 2C2 Ferroalloys production 0,7 % 3,9 % 2B5 Carbide production 1,6 % 3,3 % 1A3bii Road transport: Light duty vehicles 0,2 % 2,2 % 3F Field burning of agricultural residue 4,9 % 1,8 % 1A2f Stationary combustion in manufacturing industries and
construction: Non-metallic minerals 0,2 % 1,3 %
2C7c Other metal production 2,3 % 0,4 %
Table A15. Key categories for benzo(k)fluoranthene emissions, 1990 and 2015. Key categories are given in
bold italic.
Source 1990 2015
2C3 Aluminium production 77,7 % 52,9 % 1A3biii Road transport: Heavy duty vehicles and buses 3,3 % 13,1 % 1A3bi Road transport: Passenger cars 1,6 % 8,8 % 1A4bi Residential: Stationary 6,7 % 8,6 % 2C2 Ferroalloys production 0,8 % 4,4 % 2B5 Carbide production 1,7 % 3,8 % 1A3bii Road transport: Light duty vehicles 0,3 % 3,6 % 3F Field burning of agricultural residue 4,1 % 1,5 % 2C7c Other metal production 2,5 % 0,5 %
Table A16. Key categories for indeno(1,2,3_cd)pyrene emissions, 1990 and 2015. Key categories are given
in bold italic.
Source 1990 2015
2C3 Aluminium production 57,8 % 34,5 % 1A4bi Residential: Stationary 22,7 % 25,2 % 1A3bi Road transport: Passenger cars 4,6 % 15,2 % 1A3bii Road transport: Light duty vehicles 0,8 % 5,8 % 1A3biii Road transport: Heavy duty vehicles and buses 1,4 % 4,6 % 2C2 Ferroalloys production 0,6 % 2,7 % 2B5 Carbide production 1,3 % 2,3 % 5E Other waste 1,4 % 2,2 % 1A3dii National navigation (shipping) 0,9 % 1,8 % 1A4ciii Agriculture/Forestry/Fishing: National fishing 0,9 % 1,8 % 3F Field burning of agricultural residue 5,5 % 1,7 % 2C7c Other metal production 1,9 % 0,3 %
Key categories for HCB
In 1990, magnesium production was by far the largest source for HCB emissions, with almost 99
per cent of the total (Table A13). This production had ceased to exist in 2015, and road traffic
had become the dominant source. The three groups of road transport were together
responsible for more than half of the emissions. Aluminium production was the second most

IIR 2017
266
important source in 2015. However, HCB emissions in Norway are now negligible.
Table A17. Key categories for HCB emissions, 1990 and 2015. Key categories are given in bold italic.
Source 1990 2015
1A3bi Road transport: Passenger cars 0,0 % 35,0 % 2C3 Aluminium production 0,1 % 13,1 % 1A3bii Road transport: Light duty vehicles 0,0 % 12,0 % 2B10a Chemical industry: Other 0,0 % 9,3 % 1A1a Public electricity and heat production 0,6 % 7,7 % 1A4bi Residential: Stationary 0,1 % 5,9 % 1A3biii Road transport: Heavy duty vehicles and buses 0,0 % 5,1 % 1A3dii National navigation (shipping) 0,0 % 2,4 % 1A4ciii Agriculture/Forestry/Fishing: National fishing 0,0 % 1,9 % 1A1c Manufacture of solid fuels and other energy industries 0,0 % 1,3 % 1A2gviii Stationary Combustion in manufacturing industries and
construction: Other 0,0 % 1,2 %
2C1 Iron and steel production 0,0 % 1,2 % 2C4 Magnesium production 98,8 % .
Key categories for PCB
Road traffic is by far the most important source for emissions of PCB. There has, however, been
a strong shift between the different road traffic groups. In 1990, most of the emissions came
from passenger cars, whereas heavy duty vehicles and buses were dominant in 2015 (Table
A18).
Table A17. Key categories for PCB emissions, 1990 and 2015. Key categories are given in bold italic.
Source 1990 2015
1A3biii Road transport: Heavy duty vehicles and buses 6,1 % 82,3 % 5E Other waste 1,5 % 4,4 % 1B2c Venting and flaring (oil, gas, combined oil and gas) 2,6 % 4,3 % 1A3bi Road transport: Passenger cars 79,1 % 4,3 % 1A3bii Road transport: Light duty vehicles 5,9 % 2,0 % 1A4bii Residential: Household and gardening (mobile) 2,9 % 0,0 %

IIR 2017
267
Appendix B
Emission factors used in the estimations of emissions from
combustion
In the calculations, the numbers are used with the highest available accuracy. In this tables
though, they are only shown rounded off, which in some cases can lead to the result that the
exceptions looks the same as the general factors. The tables include the emission factors used
for estimating the acidifying pollutants, heavy metals and persistent organic pollutants. Due to
practical reasons, also the emission factors used for the Norwegian greenhouse gas inventory
are included in the tables.
For road traffic, this general view of the emission factors only includes last year's factors and not
all time series.
In the tables for stationary combustion, dotted cells indicate combinations of fuel and source
without consumption.
A description of the sector codes used in the tables is given in Appendix D.
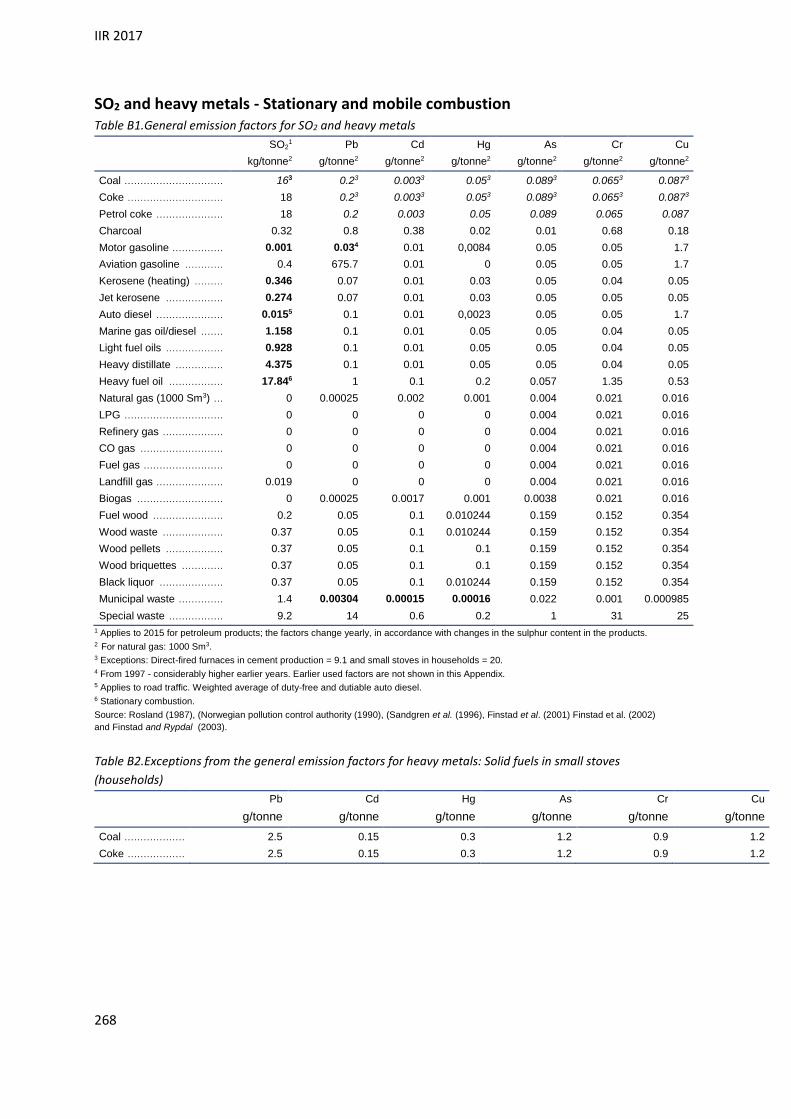
IIR 2017
268
SO2 and heavy metals - Stationary and mobile combustion Table B1.General emission factors for SO2 and heavy metals
SO21 Pb Cd Hg As Cr Cu
kg/tonne2 g/tonne2 g/tonne2 g/tonne2 g/tonne2 g/tonne2 g/tonne2
Coal ............................... 163 0.23 0.0033 0.053 0.0893 0.0653 0.0873
Coke .............................. 18 0.23 0.0033 0.053 0.0893 0.0653 0.0873
Petrol coke ..................... 18 0.2 0.003 0.05 0.089 0.065 0.087
Charcoal 0.32 0.8 0.38 0.02 0.01 0.68 0.18
Motor gasoline ................ 0.001 0.034 0.01 0,0084 0.05 0.05 1.7
Aviation gasoline ............ 0.4 675.7 0.01 0 0.05 0.05 1.7
Kerosene (heating) ......... 0.346 0.07 0.01 0.03 0.05 0.04 0.05
Jet kerosene .................. 0.274 0.07 0.01 0.03 0.05 0.05 0.05
Auto diesel ..................... 0.0155 0.1 0.01 0,0023 0.05 0.05 1.7
Marine gas oil/diesel ....... 1.158 0.1 0.01 0.05 0.05 0.04 0.05
Light fuel oils .................. 0.928 0.1 0.01 0.05 0.05 0.04 0.05
Heavy distillate ............... 4.375 0.1 0.01 0.05 0.05 0.04 0.05
Heavy fuel oil ................. 17.846 1 0.1 0.2 0.057 1.35 0.53
Natural gas (1000 Sm3) ... 0 0.00025 0.002 0.001 0.004 0.021 0.016
LPG ............................... 0 0 0 0 0.004 0.021 0.016
Refinery gas ................... 0 0 0 0 0.004 0.021 0.016
CO gas .......................... 0 0 0 0 0.004 0.021 0.016
Fuel gas ......................... 0 0 0 0 0.004 0.021 0.016
Landfill gas ..................... 0.019 0 0 0 0.004 0.021 0.016
Biogas ........................... 0 0.00025 0.0017 0.001 0.0038 0.021 0.016
Fuel wood ...................... 0.2 0.05 0.1 0.010244 0.159 0.152 0.354
Wood waste ................... 0.37 0.05 0.1 0.010244 0.159 0.152 0.354
Wood pellets .................. 0.37 0.05 0.1 0.1 0.159 0.152 0.354
Wood briquettes ............. 0.37 0.05 0.1 0.1 0.159 0.152 0.354
Black liquor .................... 0.37 0.05 0.1 0.010244 0.159 0.152 0.354
Municipal waste .............. 1.4 0.00304 0.00015 0.00016 0.022 0.001 0.000985
Special waste ................. 9.2 14 0.6 0.2 1 31 25
1 Applies to 2015 for petroleum products; the factors change yearly, in accordance with changes in the sulphur content in the products. 2 For natural gas: 1000 Sm3. 3 Exceptions: Direct-fired furnaces in cement production = 9.1 and small stoves in households = 20. 4 From 1997 - considerably higher earlier years. Earlier used factors are not shown in this Appendix. 5 Applies to road traffic. Weighted average of duty-free and dutiable auto diesel. 6 Stationary combustion.
Source: Rosland (1987), (Norwegian pollution control authority (1990), (Sandgren et al. (1996), Finstad et al. (2001) Finstad et al. (2002)
and Finstad and Rypdal (2003).
Table B2.Exceptions from the general emission factors for heavy metals: Solid fuels in small stoves
(households)
Pb Cd Hg As Cr Cu
g/tonne g/tonne g/tonne g/tonne g/tonne g/tonne
Coal ................... 2.5 0.15 0.3 1.2 0.9 1.2
Coke .................. 2.5 0.15 0.3 1.2 0.9 1.2

IIR 2017
269
Table B3.Time series for variable emission factors for SO2 (kg/tonne)
Years V11
Motor
gasoline
V13
Kerosene
(heating)
V14
Jet
kerosene
V15
Auto diesel
V17
Marine
gas
oil/diesel
V18
Light
fuel oils
V19
Heavy
distillate
V20
Heavy
fuel oil
(LS-oil)
V20
Heavy
fuel oil
(NS-oil)
General General General General M.1A3B.1
Passenger
cars
M.1A3B.2
Light duty
vehicles
M.1A3B.3
Heavy
duty
vehicles
General General General General General
1980 1 0.2 0.2 6.6 . . . 6.6 6.6 15 19 46
1987 0.7 0.4 0.4 4.4 . . . 4.4 4.4 9 19 44
1989 0.6 0.4 0.4 3.4 . . . 3.4 3.4 7.6 18.2 40
1990 0.6 0.3 0.3 3.2 . . . 3.2 3.2 6 17 39.4
1991 0.6 0.38 0.38 2.8 . . . 2.8 2.8 4.6 16.8 43.6
1992 0.6 0.32 0.32 2.6 . . . 2.6 2.6 4.4 16.4 42.6
1993 0.6 0.42 0.42 2.2 . . . 2.2 2.2 4.4 16.2 45.8
1994 0.6 0.36 0.36 1.4 . . . 1.4 1.4 4.2 14.2 44.8
1995 0.24 0.46 0.46 1.4 . . . 1.4 1.4 4.6 11.8 43.4
1996 0.22 0.46 0.5 1.2 . . . 1.2 1.2 3.8 12.6 46.6
1997 0.16 0.46 0.46 1.2 . . . 1.2 1.2 3.8 12.6 47.2
1998 0.16 0.42 0.42 0.8 . . . 1.8 1.8 4.2 12.4 42.8
1999 0.22 0.32 0.32 0.6 . . . 1.6 1.6 4.4 12.8 39
2000 0.18 0.36 0.36 1.4 0.1174 0.1174 0.1174 1.8 1.8 4.6 14.4 31
2001 0.18 0.46 0.46 0.8 0.0885 0.0885 0.0885 1.8 1.8 4.8 13.2 44.4
2002 0.2 0.32 0.32 0.6 0.0708 0.0708 0.0708 1.6 1.2 4.8 12 43.8
2003 0.1 0.3 0.3 0.8 0.0748 0.0748 0.0748 2 0.8 4.6 14 44.2
2004 0.06 0.3 0.3 0.8 0.0748 0.0748 0.0748 1.8 0.8 5 14.2 44.2
2005 0.01 0.28 0.28 0.8 0.0278 0.0278 0.0278 1.8 0.8 4.6 13.6 39.2
2006 0.01 0.27 0.27 1.38 0.0393 0.0393 0.0393 2 1.38 4.44 10.4 26.2
2007 0.01 0.296 0.296 0.73 0.0244 0.0244 0.0244 1.53 0.73 4.17 17.8 20
2008 0.01 0.286 0.286 0.786 0.0285 0.0285 0.0285 1.562 0.986 3.098 17.5 28.5
2009 0.01 0.302 0.371 0.016 0.016 0.016 0.016 1.069 0.949 4.31 17.4 27.8
2010 0.01 0.324 0.294 0.015 0.015 0.015 0.015 1.184 0.978 4.31 17.5 28
2011 0.01 0.334 0.296 0.015 0.015 0.015 0.015 1.196 0.984 4.32 17.8 28.4
2012 0.01 0.326 0.294 0.015 0.015 0.015 0.015 1.038 0.658 4.295 17.5 27.4
2013 0.009 0.298 0.252 0.014 0.014 0.014 0.014 1.026 0.642 3.957 15.4 26.4
2014 0.01 0.342 0.252 0.014 0.014 0.014 0.014 1.054 0.648 4.263 15.5 27.0
2015 0.01 0.346 0.274 0.015 0.015 0.015 0.015 1.158 0.928 4.375 17.8 28.6
Table B4.Time series for variable emission factors for heavy metals, stationary combustion. g/tonne
1990-1991 1992-
Sector Source Fuel Pb Cd Hg Pb Cd Hg
General S.03 V51 0.0085 0.00047 0.00035 0.00304 0.00015 0.00016
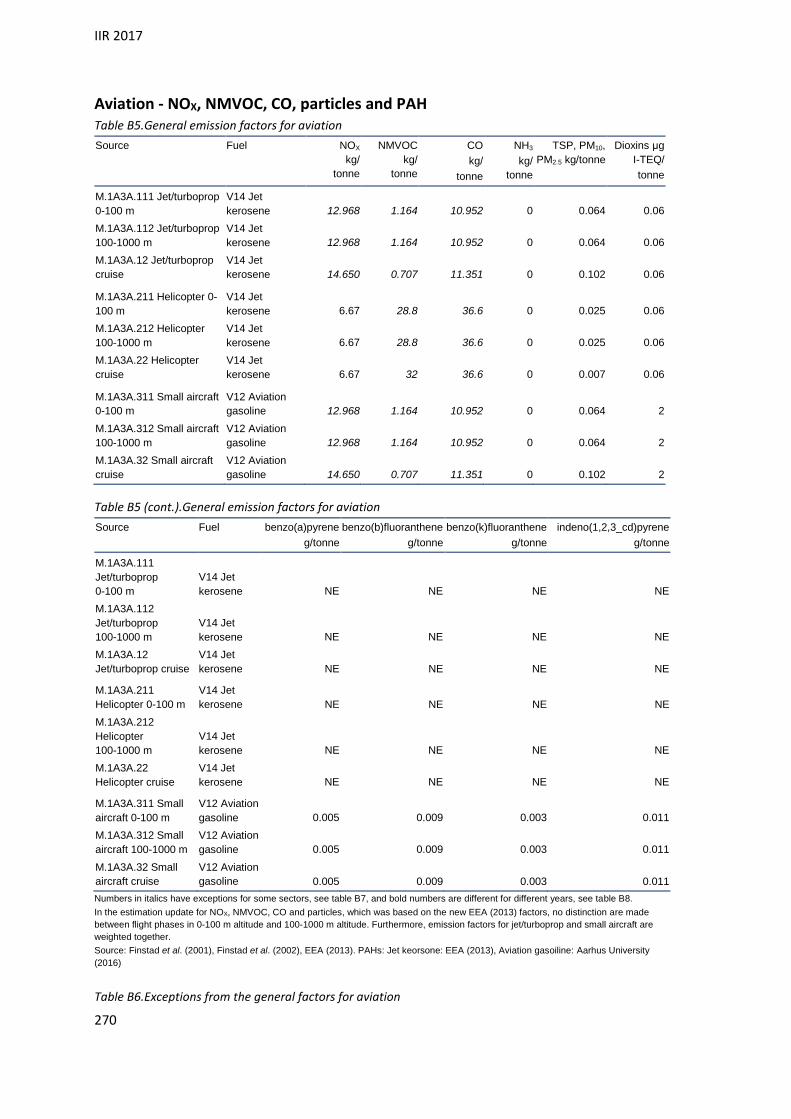
IIR 2017
270
Aviation - NOX, NMVOC, CO, particles and PAH Table B5.General emission factors for aviation
Source Fuel NOX
kg/
tonne
NMVOC
kg/
tonne
CO
kg/
tonne
NH3
kg/
tonne
TSP, PM10,
PM2.5 kg/tonne
Dioxins μg
I-TEQ/
tonne
M.1A3A.111 Jet/turboprop
0-100 m
V14 Jet
kerosene 12.968 1.164 10.952 0 0.064 0.06
M.1A3A.112 Jet/turboprop
100-1000 m
V14 Jet
kerosene 12.968 1.164 10.952 0 0.064 0.06
M.1A3A.12 Jet/turboprop
cruise
V14 Jet
kerosene 14.650 0.707 11.351 0 0.102 0.06
M.1A3A.211 Helicopter 0-
100 m
V14 Jet
kerosene 6.67 28.8 36.6 0 0.025 0.06
M.1A3A.212 Helicopter
100-1000 m
V14 Jet
kerosene 6.67 28.8 36.6 0 0.025 0.06
M.1A3A.22 Helicopter
cruise
V14 Jet
kerosene 6.67 32 36.6 0 0.007 0.06
M.1A3A.311 Small aircraft
0-100 m
V12 Aviation
gasoline 12.968 1.164 10.952 0 0.064 2
M.1A3A.312 Small aircraft
100-1000 m
V12 Aviation
gasoline 12.968 1.164 10.952 0 0.064 2
M.1A3A.32 Small aircraft
cruise
V12 Aviation
gasoline 14.650 0.707 11.351 0 0.102 2
Table B5 (cont.).General emission factors for aviation
Source Fuel benzo(a)pyrene
g/tonne
benzo(b)fluoranthene
g/tonne
benzo(k)fluoranthene
g/tonne
indeno(1,2,3_cd)pyrene
g/tonne
M.1A3A.111
Jet/turboprop
0-100 m
V14 Jet
kerosene NE NE NE NE
M.1A3A.112
Jet/turboprop
100-1000 m
V14 Jet
kerosene NE NE NE NE
M.1A3A.12
Jet/turboprop cruise
V14 Jet
kerosene NE NE NE NE
M.1A3A.211
Helicopter 0-100 m
V14 Jet
kerosene NE NE NE NE
M.1A3A.212
Helicopter
100-1000 m
V14 Jet
kerosene NE NE NE NE
M.1A3A.22
Helicopter cruise
V14 Jet
kerosene NE NE NE NE
M.1A3A.311 Small
aircraft 0-100 m
V12 Aviation
gasoline 0.005 0.009 0.003 0.011
M.1A3A.312 Small
aircraft 100-1000 m
V12 Aviation
gasoline 0.005 0.009 0.003 0.011
M.1A3A.32 Small
aircraft cruise
V12 Aviation
gasoline 0.005 0.009 0.003 0.011
Numbers in italics have exceptions for some sectors, see table B7, and bold numbers are different for different years, see table B8.
In the estimation update for NOX, NMVOC, CO and particles, which was based on the new EEA (2013) factors, no distinction are made
between flight phases in 0-100 m altitude and 100-1000 m altitude. Furthermore, emission factors for jet/turboprop and small aircraft are
weighted together.
Source: Finstad et al. (2001), Finstad et al. (2002), EEA (2013). PAHs: Jet keorsone: EEA (2013), Aviation gasoiline: Aarhus University
(2016)
Table B6.Exceptions from the general factors for aviation

IIR 2017
271
Component Emission
factor
Fuel Source Sectors
NOX 13.51 V14 Jet kerosene M.1A3A.111, M1A3A.211 248422
NOX 13.29 V14 Jet kerosene M.1A3A.112, M1A3A.212 248422
NOX 11.7 V14 Jet kerosene M.1A3A.12, M.1A3A.22 248422
NMVOC 7.43 V14 Jet kerosene M.1A3A.111, M1A3A.211 248422
NMVOC 7.36 V14 Jet kerosene M.1A3A.112, M1A3A.212 248422
NMVOC 4.3 V14 Jet kerosene M.1A3A.12, M.1A3A.22 248422
CO 23.67 V14 Jet kerosene M.1A3A.111, M1A3A.211 248422
CO 23.15 V14 Jet kerosene M.1A3A.112, M1A3A.212 248422
CO 20.9 V14 Jet kerosene M.1A3A.12, M.1A3A.22 248422
NOX 12.559 V12, 14 Aviation gasoline, jet kerosene M.1A3A.11x, M1A3A.31x 235100.2N
NOX 13.857 V12, 14 Aviation gasoline, jet kerosene M.1A3A.12, M1A3A.32 235100.2N
NMVOC 0.810 V12, 14 Aviation gasoline, jet kerosene M.1A3A.11x, M1A3A.31x 235100.2N
NMVOC 0.246 V12, 14 Aviation gasoline, jet kerosene M.1A3A.12, M1A3A.32 235100.2N
CO 9.903 V12, 14 Aviation gasoline, jet kerosene M.1A3A.11x, M1A3A.31x 235100.2N
CO 2.547 V12, 14 Aviation gasoline, jet kerosene M.1A3A.12, M1A3A.32 235100.2N
TSP, PM10, PM2.5 0.074 V12, 14 Aviation gasoline, jet kerosene M.1A3A.11x, M1A3A.31x 235100.2N
TSP, PM10, PM2.5 0.142 V12, 14 Aviation gasoline, jet kerosene M.1A3A.12, M1A3A.32 235100.2N
Table B7.Time series for variable emission factors for aviation. Factors for 1989, 1995, 2000 and 2012 are
calculated as given in the table. Factors for 1990-1994, 1996-1999 and 2001-2011 are calculated by linear
interpolation. Factors after 2012 are kept constant. In the 2012 calculation source M.1A3A.111 and
M.1A3A.112 are weighted together.
General 235100.2N 665100.2
Component Year
M.1A3A.111
(LTO 0-100 m)
M.1A3A.112
(LTO 100-1000 m)
M.1A3A.12
(cruise)
M.1A3A.111
(LTO 0-100 m)
M.1A3A.112
(LTO 100-1000 m)
M.1A3A.12
(cruise)
NOX 1989 6.772 13.049 12.119 7.762 14.958 12.755
1995 9.296 17.913 11.001 7.745 14.924 11.989
2000 7.579 14.605 14.032 7.327 14.884 11.750
2012 12.968 12.968 14.650 12.559 12.559 13.857
NMVOC 1989 0.775 0.127 0.554 0.365 0.060 0.675
1995 7.725 1.265 0.963 0.773 0.127 3.369
2000 1.576 0.258 0.507 1.293 0.221 0.366
2012 1.164 1.164 0.707 0.810 0.810 0.246
CO 1989 19.768 2.145 6.947 14.173 1.538 4.191
1995 27.204 2.952 12.147 15.118 1.640 8.459
2000 21.239 2.305 7.808 16.925 2.659 3.866
2012 10.952 10.952 11.351 9.903 9.903 2.547
TSP, PM10,
PM2.5
1989 0.039 0.039 0.094 0.048 0.048 0.658
1995 0.056 0.056 0.102 0.075 0.075 1.325
2000 0.057 0.057 0.155 0.075 0.075 1.325
2012 0.064 0.064 0.102 0.074 0.074 0.142
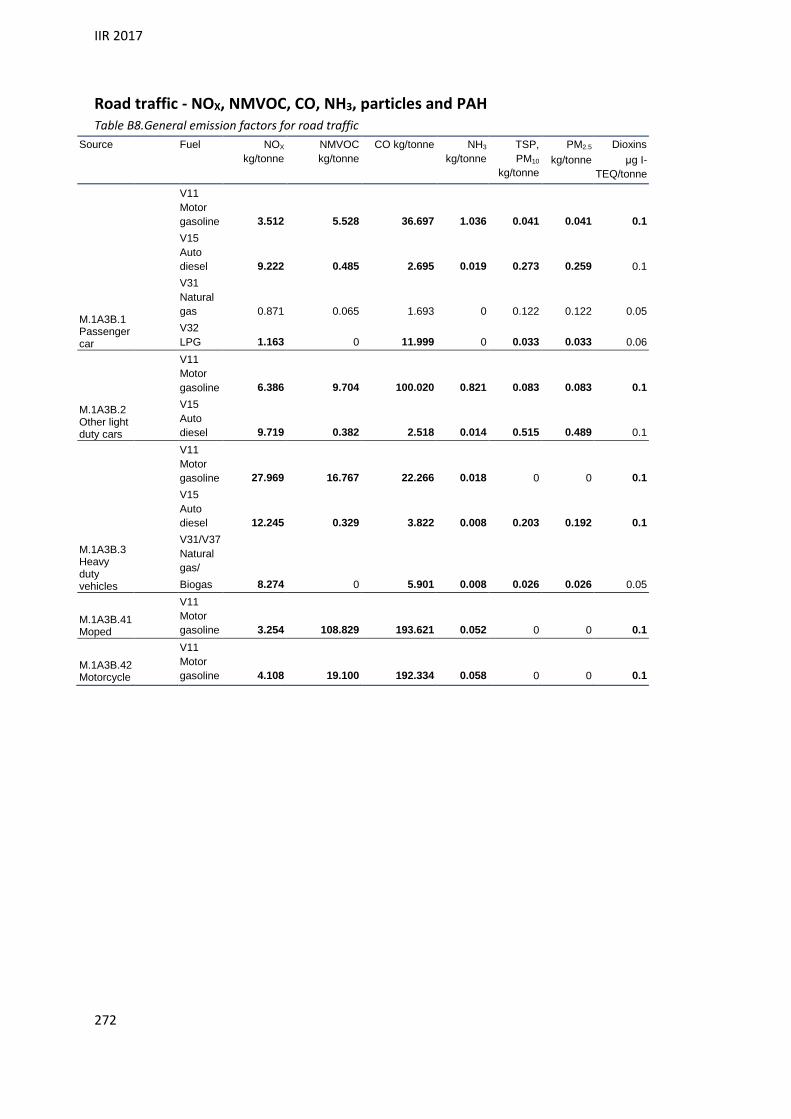
IIR 2017
272
Road traffic - NOX, NMVOC, CO, NH3, particles and PAH Table B8.General emission factors for road traffic
Source Fuel NOX
kg/tonne
NMVOC
kg/tonne
CO kg/tonne NH3
kg/tonne
TSP,
PM10
kg/tonne
PM2.5
kg/tonne
Dioxins
μg I-
TEQ/tonne
M.1A3B.1 Passenger car
V11
Motor
gasoline 3.512 5.528 36.697 1.036 0.041 0.041 0.1
V15
Auto
diesel 9.222 0.485 2.695 0.019 0.273 0.259 0.1
V31
Natural
gas 0.871 0.065 1.693 0 0.122 0.122 0.05
V32
LPG 1.163 0 11.999 0 0.033 0.033 0.06
M.1A3B.2 Other light duty cars
V11
Motor
gasoline 6.386 9.704 100.020 0.821 0.083 0.083 0.1
V15
Auto
diesel 9.719 0.382 2.518 0.014 0.515 0.489 0.1
M.1A3B.3 Heavy duty vehicles
V11
Motor
gasoline 27.969 16.767 22.266 0.018 0 0 0.1
V15
Auto
diesel 12.245 0.329 3.822 0.008 0.203 0.192 0.1
V31/V37
Natural
gas/
Biogas 8.274 0 5.901 0.008 0.026 0.026 0.05
M.1A3B.41 Moped
V11
Motor
gasoline 3.254 108.829 193.621 0.052 0 0 0.1
M.1A3B.42 Motorcycle
V11
Motor
gasoline 4.108 19.100 192.334 0.058 0 0 0.1
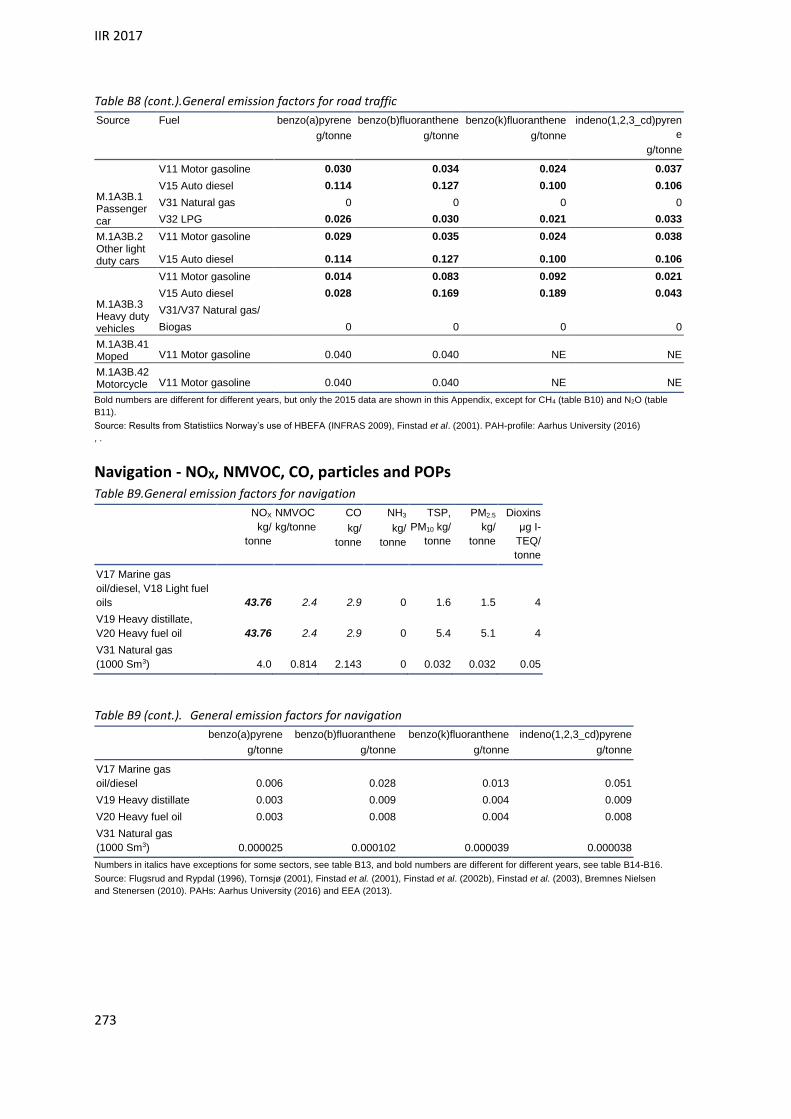
IIR 2017
273
Table B8 (cont.).General emission factors for road traffic
Source Fuel benzo(a)pyrene
g/tonne
benzo(b)fluoranthene
g/tonne
benzo(k)fluoranthene
g/tonne
indeno(1,2,3_cd)pyren
e
g/tonne
M.1A3B.1 Passenger car
V11 Motor gasoline 0.030 0.034 0.024 0.037
V15 Auto diesel 0.114 0.127 0.100 0.106
V31 Natural gas 0 0 0 0
V32 LPG 0.026 0.030 0.021 0.033
M.1A3B.2 Other light duty cars
V11 Motor gasoline 0.029 0.035 0.024 0.038
V15 Auto diesel 0.114 0.127 0.100 0.106
M.1A3B.3 Heavy duty vehicles
V11 Motor gasoline 0.014 0.083 0.092 0.021
V15 Auto diesel 0.028 0.169 0.189 0.043
V31/V37 Natural gas/
Biogas 0 0 0 0
M.1A3B.41 Moped V11 Motor gasoline 0.040 0.040 NE NE
M.1A3B.42 Motorcycle V11 Motor gasoline 0.040 0.040 NE NE
Bold numbers are different for different years, but only the 2015 data are shown in this Appendix, except for CH4 (table B10) and N2O (table
B11).
Source: Results from Statistiics Norway’s use of HBEFA (INFRAS 2009), Finstad et al. (2001). PAH-profile: Aarhus University (2016)
, .
Navigation - NOX, NMVOC, CO, particles and POPs Table B9.General emission factors for navigation
NOX
kg/
tonne
NMVOC
kg/tonne
CO
kg/
tonne
NH3
kg/
tonne
TSP,
PM10 kg/
tonne
PM2.5
kg/
tonne
Dioxins
μg I-
TEQ/
tonne
V17 Marine gas
oil/diesel, V18 Light fuel
oils 43.76 2.4 2.9 0 1.6 1.5 4
V19 Heavy distillate,
V20 Heavy fuel oil 43.76 2.4 2.9 0 5.4 5.1 4
V31 Natural gas
(1000 Sm3) 4.0 0.814 2.143 0 0.032 0.032 0.05
Table B9 (cont.). General emission factors for navigation
benzo(a)pyrene
g/tonne
benzo(b)fluoranthene
g/tonne
benzo(k)fluoranthene
g/tonne
indeno(1,2,3_cd)pyrene
g/tonne
V17 Marine gas
oil/diesel 0.006 0.028 0.013 0.051
V19 Heavy distillate 0.003 0.009 0.004 0.009
V20 Heavy fuel oil 0.003 0.008 0.004 0.008
V31 Natural gas
(1000 Sm3) 0.000025 0.000102 0.000039 0.000038
Numbers in italics have exceptions for some sectors, see table B13, and bold numbers are different for different years, see table B14-B16.
Source: Flugsrud and Rypdal (1996), Tornsjø (2001), Finstad et al. (2001), Finstad et al. (2002b), Finstad et al. (2003), Bremnes Nielsen
and Stenersen (2010). PAHs: Aarhus University (2016) and EEA (2013).

IIR 2017
274
Table B10.Exceptions from the general factors for navigation
Component Emission
factor
(kg/tonne)
Fuel Sector
NOX 36.60 V17, 19, 20
Marine gas oil/diesel, light fuel oils, heavy distillate,
heavy fuel oil 230310.N
NOX 54 V17, 20
Marine gas oil/diesel, light fuel oils, heavy distillate,
Heavy fuel oil 230600.1 -230600.3
NOX 46.58 V17, 19, 20
Marine gas oil/diesel, light fuel oils, heavy distillate,
heavy fuel oil 248422
NMVOC 1.4
V17, 18, 19,
20
Marine gas oil/diesel, light fuel oils, heavy distillate,
heavy fuel oil 230310.N
NMVOC 2.3 V17, 19, 20
Marine gas oil/diesel, light fuel oils, heavy distillate,
heavy fuel oil 248422
NMVOC 5 V17 Marine gas oil/diesel, light fuel oils 230600.1 -230600.3
NMVOC 5 V19, 20 Heavy distillate, heavy fuel oil 230600.1 -230600.3
CO 7.9
V17, 18, 19,
20
Marine gas oil/diesel, light fuel oils, heavy distillate,
heavy fuel oil 230310.N
CO 1.6
V17, 18, 19,
20
Marine gas oil/diesel, light fuel oils, heavy distillate,
heavy fuel oil 230600.1
CO 7 V17, 19, 20
Marine gas oil/diesel, light fuel oils, heavy distillate,
heavy fuel oil 230600.1 -230600.3
CO 2.3 V17, 19, 20
Marine gas oil/diesel, light fuel oils, heavy distillate,
heavy fuel oil 248422
Table B11.Time series for variable emission factors for navigation. NOX
Sector Fuel 1990-
1999
1990 1991 1992 1993 1994 1995 1996 1997 1998 1999
General V17-20 56.85 56.80 56.89 56.77 56.82 56.68 57.23 57.47 57.41 56.82
2000 2004 2005 2006 2007 2008 2009 2010 2011 2012 2013 2014 2015
General V17-20 57.82 56.51 55.90 55.55 54.61 53.25 51.90 50.54 49.18 47.83
46.47
45.11 43.76
230310.
N
V17,
19, 20 52.11 52.12 51.69 51.58 51.48 50.93 49.90 47.41 45.17 43.64
43.36
40.94
37.97
36.60
248422
V17,
19, 20 50.17 49.82 48.95 48.74 48.52 48.31 48.09 47.88 47.66 47.44
47.23
47.01
46.80
46.58
Source: Flugsrud et al. (2010)

IIR 2017
275
Table B12.Time series for variable emission factors for navigation. NMVOC and CO
Sector Fuel NMVOC CO
1980-1990 1980-1997 1980-1998 1991- 1998- 1999- 1980-1997 1998-
General
V17-
20 3.1 2.9
230310.N
V17-
20 1.5 1.4
230600.1
V17-
20 2 1.6
230600.1,230910 V19,20 6.4 5
230600.1,230910 V 20
248422
V17-
20 2.2 2.3
Other mobile sources including railways - NOX, NMVOC, CO, NH3, particles and
POPs Table B13.General emission factors for other mobile sources
NOX
kg/
tonne
NMVOC
kg/
tonne
CO
kg/
tonne
NH3
kg/
Tonne
TSP,
PM10
kg/
tonne
PM2.5
kg/
tonne
Dioxins
μg I-
TEQ/
tonne
M.1A3C
Railway
V01 Coal
V15 Auto
diesel
3
47
1.1
4
3
11
0
0.007
1.6/1.14
3.8
0.82
3.8
1.6
0.1
M.1A3E.21
Small boats 2
stroke
V11 Motor
gasoline 6 240 415 0 8 8 0.1
M.1A3E.22
Small boats 4
stroke
V11 Motor
gasoline 12 40 1 000 0 1 1 0.1
V15 Auto
diesel 54 27 25 0 4 4 0.1
M.1A3E.31
Motorized
equipment 2
stroke
V11 Motor
gasoline 21 500 700 0 8 8 0.1
M.1A3E.32
Motorized
equipment 4t
V11 Motor
gasoline 10 110 1 200 0 1 1 0.1
V15 Auto
diesel 13.0 1.0 6.1 0.008 0.2 0.2 0.1
V18 Light
fuel oils 50 6 15 0.005 7.1 6.75 0.1

IIR 2017
276
Other mobile sources including railways - NOX, NMVOC, CO, NH3, particles and
POPs Table B13 (cont.). General emission factors for other mobile sources
benzo(a)pyrene
g/tonne
benzo(b)fluoranthene
g/tonne
benzo(k)fluoranthene
g/tonne
indeno(1,2,3_cd)pyrene
g/tonne
M.1A3C
Railway
V01 Coal
V15 Auto
diesel
0.007
0.030
0.01
0.050
0.004
0
0.003
0
M.1A3E.21
Small boats 2
stroke
V11 Motor
gasoline 0.040 0.040 0 0
M.1A3E.22
Small boats 4
stroke
V11 Motor
gasoline 0.040 0.040 0 0
V15 Auto
diesel 0.030 0.050 0 0
M.1A3E.31
Motorized
equipment 2
stroke
V11 Motor
gasoline 0.040 0.040 0 0
M.1A3E.32
Motorized
equipment 4t
V11 Motor
gasoline 0.040 0.040 0 0
V15 Auto
diesel 0.030 0.050 0 0
V18 Light
fuel oils 0.030 0.050 0 0
M.1A3E.1 Snow scooter has the same emission factors as M.1A3B.41 Moped, see table B9.
Bold numbers are different for different years, but only 2015 figures are presented here. 1Before 1995 the emission factor was 1.3.
Numbers in italics have exceptions for some sectors, see table B18–B19.
Sources: Bang (1993), Bang et al. (1999), Finstad et al. (2001), Finstad et al. (2002b), Finstad et al. (2003), Winther and Nielsen (2006),
EEA (2013).
Table B14.Exceptions from the general factors for greenhouse gases and precursors for other mobile
sources

IIR 2017
277
Component Emission
factor
(kg/tonne)
Fuel Source Sectors
NOX 15.1 V15 Auto diesel
M.1A3E.32 Motorized equipment 4
stroke
230100-
230210
NOX 54 V18 Light fuel oils
M.1A3E.32 Motorized equipment 4
stroke 230100
NOX 52 V18 Light fuel oils
M.1A3E.32 Motorized equipment 4
stroke 230210
NOX 47 V18 Light fuel oils
M.1A3E.32 Motorized equipment 4
stroke
230710-
230892,
234910
NOX 48 V18 Light fuel oils
M.1A3E.32 Motorized equipment 4
stroke
232360,
248422
NOX 46 V18 Light fuel oils
M.1A3E.32 Motorized equipment 4
stroke
234110-
234120
NMVOC 1.8 V15 Auto diesel
M.1A3E.32 Motorized equipment 4
stroke
230100-
230200
NMVOC 7.2 V18 Light fuel oils
M.1A3E.32 Motorized equipment 4
stroke 230100
NMVOC 5.7 V18 Light fuel oils
M.1A3E.32 Motorized equipment 4
stroke 230210
NMVOC 4 V18 Light fuel oils
M.1A3E.32 Motorized equipment 4
stroke
230710-
230892,234910
NMVOC 4.8 V18 Light fuel oils
M.1A3E.32 Motorized equipment 4
stroke
232360,
248422
NMVOC 3.8 V18 Light fuel oils
M.1A3E.32 Motorized equipment 4
stroke
234110-
234120
CO 10.0 V15 Auto diesel
M.1A3E.32 Motorized equipment 4
stroke
230100-
230210
CO 25 V18 Light fuel oils
M.1A3E.32 Motorized equipment 4
stroke 230100
CO 20 V18 Light fuel oils
M.1A3E.32 Motorized equipment 4
stroke 230210
CO 11 V18 Light fuel oils
M.1A3E.32 Motorized equipment 4
stroke
230710-
230892,
234910
CO 17 V18 Light fuel oils
M.1A3E.32 Motorized equipment 4
stroke
234110-
234120
CO 18 V18 Light fuel oils
M.1A3E.32 Motorized equipment 4
stroke 248422
Bold numbers are different for different years, time series for NOx are presented in table B20.
Table B15.Exceptions from the general factors for other pollutants for other mobile sources

IIR 2017
278
Component Emission
factor
(kg/tonne)
Fuel Source Sectors
TSP, PM10 1.7 V15 Auto diesel
M.1A3E.32 Motorized equipment 4
stroke 230100-230210
TSP, PM10 3.8 V18 Light fuel oils
M.1A3E.32 Motorized equipment 4
stroke
230710-230892,
234910
TSP, PM10 4.2 V18 Light fuel oils
M.1A3E.32 Motorized equipment 4
stroke 232360
TSP, PM10 5.3 V18
Light fuel oils M.1A3E.32 Motorized equipment 4
stroke 234110-234120
TSP, PM10 5.4 V18
Light fuel oils M.1A3E.32 Motorized equipment 4
stroke 248422
PM2.5 1.6 V15 Auto diesel
M.1A3E.32 Motorized equipment 4
stroke 230100-230210
PM2.5 3.61 V18
Light fuel oils M.1A3E.32 Motorized equipment 4
stroke
230710-230892,
234910
PM2.5 3.99 V18
Light fuel oils M.1A3E.32 Motorized equipment 4
stroke 232360
PM2.5 5.04 V18
Light fuel oils M.1A3E.32 Motorized equipment 4
stroke 234110-234120
PM2.5 5.13 V18
Light fuel oils M.1A3E.32 Motorized equipment 4
stroke 248422
Bold numbers are different for different years, but only 2015 figures are presented here.
Table B16.Time series for NOX emission factors for use of auto diesel in motorized equipment 4t
Sector 1990 1991 1992 1993 1994 1995 1996 1997 1998 1999 2000 2001 2002 2003 2004
General 46.3 46.4 46.4 46.4 46.5 46.6 46.7 46.8 46.0 43.9 41.9 40.2 37.8 35.0 31.8
230100-
230210 27.1 27.0 26.7 26.5 26.4 26.4 26.5 26.6 26.6 26.5 26.4 26.2 25.8 25.4 24.9
Sector 2005 2006 2007 2008 2009 2010 2011 2012 2013 2014 2015
General 28.6 24.8 21.6 19.8 18.5 17.1 16.1 15.3 14.5 13.5 13.0
230100-
230210 24.1 23.3 22.3 21.3 20.3 19.3 18.3 17.5 16.8 15.9 15.1
Source: Winther and Nielsen (2006). Data for 2005 and later are extrapolations.
Table B17.Time series for variable emission factors for other mobile sources
Fuel Component 1980-1990 1991 1992 1993 1994 1995 1996 1997-
V11 Gasoline Dioxins 1.32 1.11 0.95 0.69 0.25 0.23 0.11 0.1
NOX - Stationary combustion Table B18.General emission factors. kg NOX/tonne fuel

IIR 2017
279
Source V01
Coal
V02
Coke
V03
Petrol
coke
V41
Fuel
wood
V42
Wood
waste
V43
Black
liquor
V44
Wood
pellets
V45
Wood
bri-
quettes
V04
Char-
coal
V31
Natural
gas
(1000
Sm3)
V33
Refinery
gas
S.01
Direct-
fired
furnaces 16 20 20 . . . . . 2.68 5.95 5.4
S.02 Gas
turbines . . . . . . . . . 6.27 .
S.03
Boilers .. 3 3 3.4 . 0.9 0.9 1.3 1.3 . 2.55 3
S.04
Small
stoves ... 3 3 . 0.988 . . 1.1 . 1.4 . .
S.1B2C
Flares ... . . . . . . . . . 12 7
V34
Blast
furnace
gas
V36
Landfill
gas
V35
Fuel gas
V32
LPG
V13
Kerosene
(heating)
V17
Marine
gas oil/
diesel
V18
Light
fuel oils
V19
Heavy
distillate
V20
Heavy
fuel oil
V51
Municipal
waste
V52
Special
waste
S.01
Direct-
fired
furnaces 5.4 . 5.4 . . 70 . 5 5 . 5
S.02 Gas
turbines . . . . . 16 . . . . .
S.03
Boilers 3 0.01 3 2.3 3 2.5 2.5 2.5 4.2 1.365 4.2
S.04
Small
stoves . . . 2.3 2.5 . 2.5 2.5 . . .
S.1B2C
Flares . 0.17 . . . . . . . . .
Numbers in italics have exceptions for some sectors, see table B27, and bold numbers are different for different years, see table B28.
Source: Rosland (1987). Fuel wood factor based on data from annual surveys on use of fuel wood in households.
Table B19.Exceptions from the general factors for NOX. Stationary combustion. kg NOX /tonne fuel
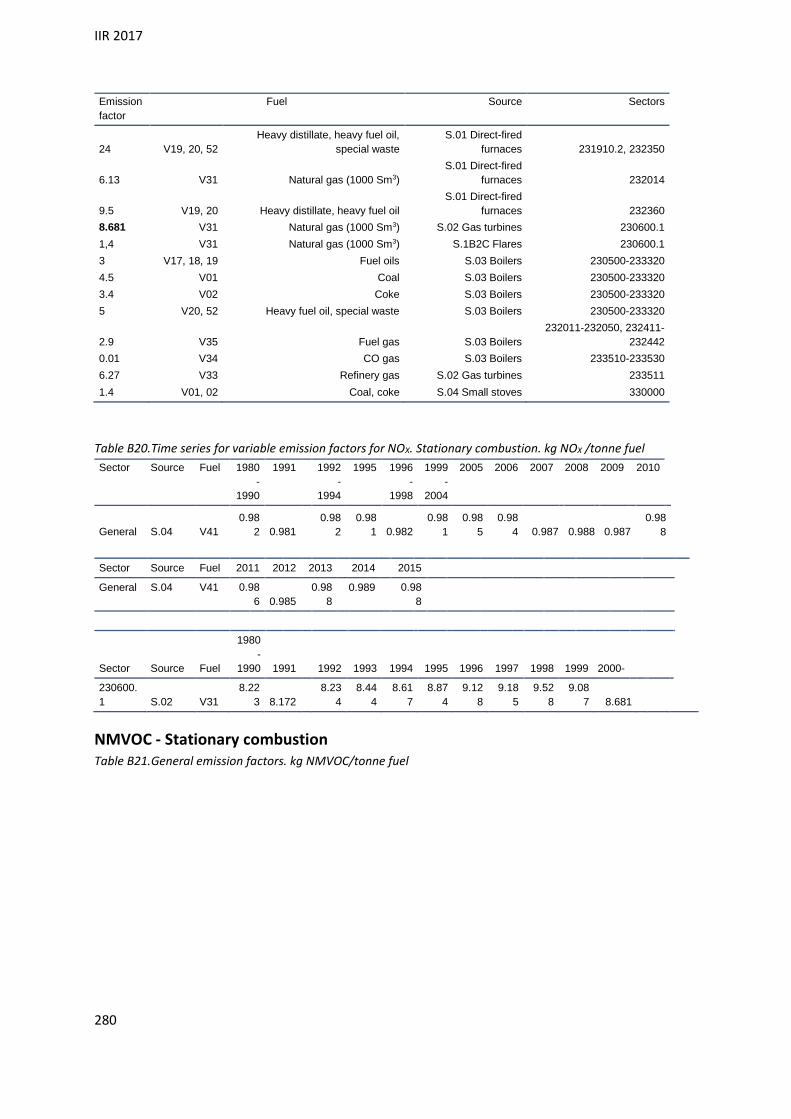
IIR 2017
280
Emission
factor
Fuel Source Sectors
24 V19, 20, 52
Heavy distillate, heavy fuel oil,
special waste
S.01 Direct-fired
furnaces 231910.2, 232350
6.13 V31 Natural gas (1000 Sm3)
S.01 Direct-fired
furnaces 232014
9.5 V19, 20 Heavy distillate, heavy fuel oil
S.01 Direct-fired
furnaces 232360
8.681 V31 Natural gas (1000 Sm3) S.02 Gas turbines 230600.1
1,4 V31 Natural gas (1000 Sm3) S.1B2C Flares 230600.1
3 V17, 18, 19 Fuel oils S.03 Boilers 230500-233320
4.5 V01 Coal S.03 Boilers 230500-233320
3.4 V02 Coke S.03 Boilers 230500-233320
5 V20, 52 Heavy fuel oil, special waste S.03 Boilers 230500-233320
2.9 V35 Fuel gas S.03 Boilers
232011-232050, 232411-
232442
0.01 V34 CO gas S.03 Boilers 233510-233530
6.27 V33 Refinery gas S.02 Gas turbines 233511
1.4 V01, 02 Coal, coke S.04 Small stoves 330000
Table B20.Time series for variable emission factors for NOX. Stationary combustion. kg NOX /tonne fuel
Sector Source Fuel 1980
-
1990
1991 1992
-
1994
1995 1996
-
1998
1999
-
2004
2005 2006 2007 2008 2009 2010
General S.04 V41
0.98
2 0.981
0.98
2
0.98
1 0.982
0.98
1
0.98
5
0.98
4 0.987 0.988 0.987
0.98
8
Sector Source Fuel 2011 2012 2013 2014 2015
General S.04 V41 0.98
6 0.985
0.98
8
0.989
0.98
8
Sector Source Fuel
1980
-
1990 1991
1992 1993 1994 1995 1996 1997 1998 1999 2000-
230600.
1 S.02 V31
8.22
3 8.172
8.23
4
8.44
4
8.61
7
8.87
4
9.12
8
9.18
5
9.52
8
9.08
7 8.681
NMVOC - Stationary combustion Table B21.General emission factors. kg NMVOC/tonne fuel
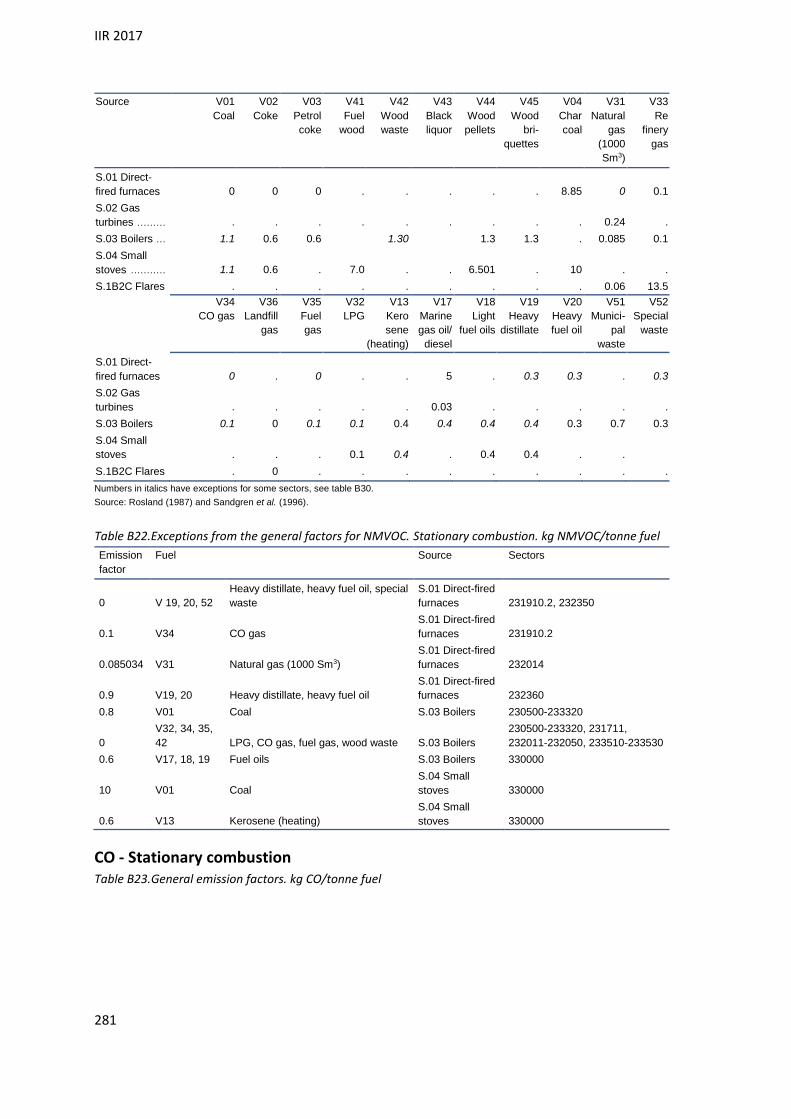
IIR 2017
281
Source V01
Coal
V02
Coke
V03
Petrol
coke
V41
Fuel
wood
V42
Wood
waste
V43
Black
liquor
V44
Wood
pellets
V45
Wood
bri-
quettes
V04
Char
coal
V31
Natural
gas
(1000
Sm3)
V33
Re
finery
gas
S.01 Direct-
fired furnaces 0 0 0 . . . . . 8.85 0 0.1
S.02 Gas
turbines ......... . . . . . . . . . 0.24 .
S.03 Boilers ... 1.1 0.6 0.6 1.30 1.3 1.3 . 0.085 0.1
S.04 Small
stoves ........... 1.1 0.6 . 7.0 . . 6.501 . 10 . .
S.1B2C Flares . . . . . . . . . 0.06 13.5
V34
CO gas
V36
Landfill
gas
V35
Fuel
gas
V32
LPG
V13
Kero
sene
(heating)
V17
Marine
gas oil/
diesel
V18
Light
fuel oils
V19
Heavy
distillate
V20
Heavy
fuel oil
V51
Munici-
pal
waste
V52
Special
waste
S.01 Direct-
fired furnaces 0 . 0 . . 5 . 0.3 0.3 . 0.3
S.02 Gas
turbines . . . . . 0.03 . . . . .
S.03 Boilers 0.1 0 0.1 0.1 0.4 0.4 0.4 0.4 0.3 0.7 0.3
S.04 Small
stoves . . . 0.1 0.4 . 0.4 0.4 . .
S.1B2C Flares . 0 . . . . . . . . .
Numbers in italics have exceptions for some sectors, see table B30.
Source: Rosland (1987) and Sandgren et al. (1996).
Table B22.Exceptions from the general factors for NMVOC. Stationary combustion. kg NMVOC/tonne fuel
Emission
factor
Fuel Source Sectors
0 V 19, 20, 52 Heavy distillate, heavy fuel oil, special
waste S.01 Direct-fired
furnaces 231910.2, 232350
0.1 V34 CO gas S.01 Direct-fired
furnaces 231910.2
0.085034 V31 Natural gas (1000 Sm3) S.01 Direct-fired
furnaces 232014
0.9 V19, 20 Heavy distillate, heavy fuel oil S.01 Direct-fired
furnaces 232360 0.8 V01 Coal S.03 Boilers 230500-233320
0 V32, 34, 35,
42 LPG, CO gas, fuel gas, wood waste S.03 Boilers 230500-233320, 231711,
232011-232050, 233510-233530 0.6 V17, 18, 19 Fuel oils S.03 Boilers 330000
10 V01 Coal S.04 Small
stoves 330000
0.6 V13 Kerosene (heating) S.04 Small
stoves 330000
CO - Stationary combustion Table B23.General emission factors. kg CO/tonne fuel
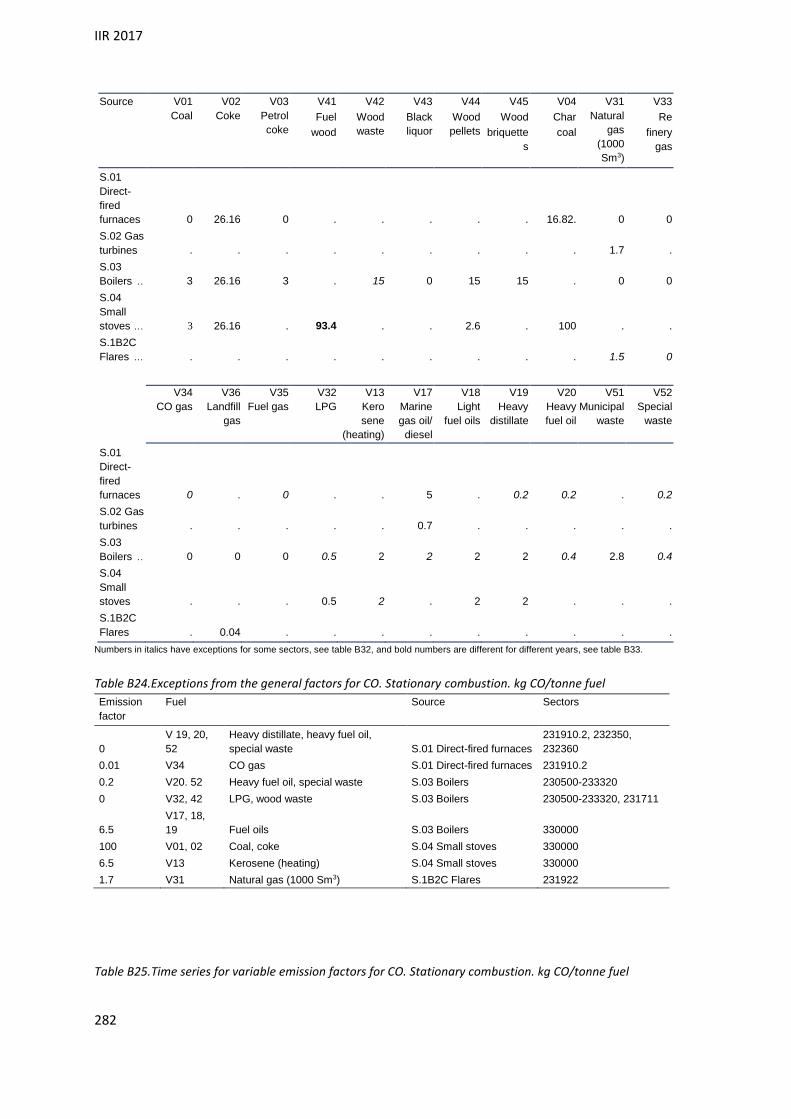
IIR 2017
282
Source V01
Coal
V02
Coke
V03
Petrol
coke
V41
Fuel
wood
V42
Wood
waste
V43
Black
liquor
V44
Wood
pellets
V45
Wood
briquette
s
V04
Char
coal
V31
Natural
gas
(1000
Sm3)
V33
Re
finery
gas
S.01
Direct-
fired
furnaces 0 26.16 0 . . . . . 16.82. 0 0
S.02 Gas
turbines . . . . . . . . . 1.7 .
S.03
Boilers .. 3 26.16 3 . 15 0 15 15 . 0 0
S.04
Small
stoves ... 3 26.16 . 93.4 . . 2.6 . 100 . .
S.1B2C
Flares ... . . . . . . . . . 1.5 0
V34
CO gas
V36
Landfill
gas
V35
Fuel gas
V32
LPG
V13
Kero
sene
(heating)
V17
Marine
gas oil/
diesel
V18
Light
fuel oils
V19
Heavy
distillate
V20
Heavy
fuel oil
V51
Municipal
waste
V52
Special
waste
S.01
Direct-
fired
furnaces 0 . 0 . . 5 . 0.2 0.2 . 0.2
S.02 Gas
turbines . . . . . 0.7 . . . . .
S.03
Boilers .. 0 0 0 0.5 2 2 2 2 0.4 2.8 0.4
S.04
Small
stoves . . . 0.5 2 . 2 2 . . .
S.1B2C
Flares . 0.04 . . . . . . . . .
Numbers in italics have exceptions for some sectors, see table B32, and bold numbers are different for different years, see table B33.
Table B24.Exceptions from the general factors for CO. Stationary combustion. kg CO/tonne fuel
Emission
factor
Fuel Source Sectors
0 V 19, 20,
52 Heavy distillate, heavy fuel oil,
special waste S.01 Direct-fired furnaces 231910.2, 232350,
232360 0.01 V34 CO gas S.01 Direct-fired furnaces 231910.2 0.2 V20. 52 Heavy fuel oil, special waste S.03 Boilers 230500-233320 0 V32, 42 LPG, wood waste S.03 Boilers 230500-233320, 231711
6.5 V17, 18,
19 Fuel oils S.03 Boilers 330000 100 V01, 02 Coal, coke S.04 Small stoves 330000 6.5 V13 Kerosene (heating) S.04 Small stoves 330000 1.7 V31 Natural gas (1000 Sm3) S.1B2C Flares 231922
Table B25.Time series for variable emission factors for CO. Stationary combustion. kg CO/tonne fuel

IIR 2017
283
Sector Source Fuel
1980-
1997 1998 1999 2000 2001 2002 2003 2004 2005 2006 2007 2008 2009
General S.04 V41 149.1 148.4 146.3 142.6 137.6 131.0 122.2 111.5 115.5 111.9 110.6 107.9 105.0
Sector Source Fuel 2010 2011 2012 2013 2014 2015
General S.04 V41 103.3 101.2 99.2 96.1 96.7 93.4
NH3 - Stationary combustion Table B26.General emission factors. kg NH3/tonne fuel
Source V01
Coal
V02
Coke
V03
Petrol
coke
V41
Fuel
wood
V42
Wood
waste
V43
Black
liquor
V44
Wood
pellets
V45
Wood
bri-
quettes
V04
Char-
coal
V31
Natural
gas
(1000
Sm3)
V33
Re-
finery
gas
V34
CO
gas
V36
Land-
fill gas
V35
Fuel
gas
V32
LPG
V13
Kero-
sene
(heating)
V17
Marine
gas
oil/
diesel
V18
Light
fuel
oils
V19
Heavy
dis-
tillate
V20
Heavy
fuel oil
V51
Munici-
pal
waste
V52
Special
waste
S.04
Small
stoves . . . 0.066 . . 0.066 . 0 . . . . . . . . . . . . .
All other
sources 0 0 0 . 0 0 0 0 1.09 0 0 0 0 0 0 0 0 0 0 0 0 0
Particulate matter - Stationary combustion Table B27.General emission factors. kg particle component/tonne fuel

IIR 2017
284
Com-
ponent
Source V01
Coal
V02
Coke
V03 Petrol
coke
V41 Fuel
wood
V42 Wood
waste
V43 Black
liquor
V44 Wood
pellets
V45 Wood
briquettes
V04 Char
coal
V31
Natural gas
(1000 Sm3)
V33
Refinery
gas
TSP ...
S.01
Direct-fired
furnaces 1.6 1.6 1.6 . . . . . 4.43. 0.122 0.144
TSP ...
S.02 Gas
turbines . . . . . . . . . 0.122 .
TSP ...
S.03
Boilers 1.6 1.6 1.6 . 2.69 0 2.69 2.69 . 0.122 0.144
TSP ...
S.04 Small
stoves 4.2 2.85 3.5 17.16 . . 1.1 . 2.4 . .
TSP ...
S.1B2C
Flares . . . . . . . . . 0.002 0.144
PM10 ..
S.01
Direct-fired
furnaces 1.14 1.14 1.14 . . . . . 4.22 0.122 0.144
PM10 ..
S.02 Gas
turbines . . . . . . . . . 0.122 .
PM10 ..
S.03
Boilers 1.14 1.14 1.14 . 2.52 0 2.52 2.52 . 0.122 0.144
PM10 ..
S.04 Small
stoves 2.8 1.71 2.1 16.82 . . 1.1 . 2.4 . .
PM10 ..
S.1B2C
Flares . . . . . . . . . 0.002 0.144
PM2.5 .
S.01
Direct-fired
furnaces 0.82 0.82 0.82 . . . . . 4.13 0.122 0.144
PM2.5 .
S.02 Gas
turbines . . . . . . . . . 0.122 .
PM2.5 .
S.03
Boilers 0.82 0.82 0.82 . 2,52 0 2.52 2.52 . 0.122 0.144
PM2.5 .
S.04 Small
stoves 0.86 0.86 1.5 16.31 . . 1.1 . 2.4 . .
PM2.5 .
S.1B2C
Flares . . . . . . . . . 0.002 0.144
V34 CO
gas
V36
Landfill
gas
V35
Fuel gas
V32
LPG
V13
Kerosene
(heating)
V17
Marine gas
oil/ diesel
V18
Light fuel
oils
V19 Heavy
distillate
V20
Heavy
fuel oil
V51
Municipal
waste
V52
Special
waste
TSP ...
S.01
Direct-fired
furnaces 0.144 . 0.144 . . 0.286 . * * . 5.68
TSP ...
S.02 Gas
turbines . . . . . 0.286 . . . . .
TSP ...
S.03
Boilers 0.144 0.144 0.144 0.136 0.296 0.286 0.286 * * 0.05 5.68
TSP ...
S.04 Small
stoves . . . 0.136 0.3 . 0.3 . . . .
TSP ...
S.1B2C
Flares . 0.144 . . . . . . . . .
PM10 ..
S.01
Direct-fired
furnaces 0.144 . 0.144 . . 0.143 . * * . 4.87
PM10 ..
S.02 Gas
turbines . . . . . 0.143 . . . . .
PM10 ..
S.03
Boilers 0.144 0.144 0.144 0.136 0.148 0.143 0.15 * * 0.05 4.87
PM10 ..
S.04 Small
stoves . . . 0.136 0.16 . 0.155 . . . .
PM10 ..
S.1B2C
Flares . 0.144 . . . . . . . . .
PM2.5 .
S.01
Direct-fired
furnaces 0.144 . 0.144 . . 0.036 . * * . 3.2

IIR 2017
285
PM2.5 .
S.02 Gas
turbines . . . . . 0.036 . . . . .
PM2.5 .
S.03
Boilers 0.144 0.144 0.144 0.136 0.037 0.12 0.12 * * 0.05 3.2
PM2.5 .
S.04 Small
stoves . . . 0.136 0.12 . 0.119 . . . .
PM2.5 .
S.1B2C
Flares . 0.144 . . . . . . . . .
Numbers in italics have exceptions for some sectors, see table B37, and bold numbers are different for different years, see table B38.
* General emission factors for all sources for heavy distillate and heavy fuel oil are given in table B36 for all years.
Source: Finstad et al. (2003). Fuel wood factor based on data from annual surveys on use of fuel wood in households
Table B28.General particle emission factors for heavy distillate and heavy fuel oil for all sources. Factors
dependent on sulphur content. kg particle component /tonne fuel
Fuel Com-po-
nent
1990 1991 1992 1993 1994 1995 1996-1997 1998 1999 2000-
V19
TSP 0.803 0.714 0.701 0.701 0.688 0.714 0.663 0.688 0.701 0.714
PM10 0.690 0.614 0.603 0.603 0.592 0.614 0.570 0.592 0.603 0.614
PM2.5 0.450 0.400 0.393 0.393 0.385 0.400 0.371 0.385 0.393 0.400
V20
TSP 1.350 1.339 1.316 1.304 1.190 1.053 1.098 1.087 1.110 1.201
PM10 1.161 1.151 1.131 1.121 1.023 0.905 0.944 0.934 0.954 1.033
PM2.5 0.761 0.754 0.741 0.735 0.671 0.593 0.619 0.613 0.625 0.677
Source: Finstad et al. (2003).
Table B29.Exceptions from the general factors for particles. Stationary combustion
Emission factor
(kg TSP/tonne)
Emission factor
(kg PM10/tonne)
Emission factor
(kg PM2.5/tonne)
Fuel Source Sectors
4.06 2.4 1.4 V52 Special waste S.01 Direct-fired furnaces 230500-233320
5.45 3.54 1.45 V01 Coal S.01 Direct-fired furnaces 233530
4.2 2.8 0.86 V01 Coal S.03 Boilers 230100
. 0.143 (V18) 0.036 (V17, 18) V17, 18 Light fuel oils S.03 Boilers 230500-233320
4.06 2.4 1.4 V52 Special waste S.03 Boilers 230500-233320
5.45 3.54 1.45 V01 Coal S.03 Boilers 233530
0.5 0.5 0.5 V51 Municipal waste S.03 Boilers 253800
0.3 0.155 0.119 V13 Kerosene (heating) S.04 Small stoves 330000
Table B30.Time series for variable emission factors for particles. Stationary combustion. kg particle
component /tonne fuel
Componen
t
Sourc
e
Fuel 1990 1991 1992 1993 1994 1995 1996 1997 1998 1999 2000 2001
TSP ........ S.04 V41 22.24 22.24 22.24 22.25 22.26 22.25 22.26 22.27 22.24 22.05 21.68 21.22
PM10 ....... S.04 V41 21.80 21.80 21.80 21.80 21.81 21.81 21.81 21.83 21.79 21.61 21.25 20.79
PM2.5 ...... S.04 V41 21.13 21.13 21.13 21.14 21.15 21.14 21.15 21.16 21.12 20.95 20.60 20.16
2002 2003 2004 2005 2006 2007 2008 2009 2010 2011 2012 2013
TSP ........ S.04 V41 20.62 19.82 18.85 19.10 18.80 18.66 18.41 18.16 17.96 17.78 17.65 17.33
PM10 ....... S.04 V41 20.21 19.42 18.47 18.72 18.42 18.29 18.04 17.79 17.60 17.43 17.29 16.98
PM2.5 ...... S.04 V41 19.59 18.83 17.91 18.15 17.86 17.73 17.49 17.25 17.06 16.89 16.77 16.46
2014 2015
TSP S.04 V41 17.35 17.16
PM10 S.04 V41 17.00 16.82
PM2.5 S.04 V41 16.48 16.31
IIR 2017
286
POPs (Persistent Organic Pollutants) - Stationary combustion Table B31.General emission factors for PAH

IIR 2017
287
Compo-
nent Source
V01
Coal
V02
Coke
V03
Petrol
coke
V41
Fuel
wood
V42
Wood
waste
V43
Black
liquor
V44
Wood
pellets
V45
Wood
briquettes
V04
Charcoa
l
V31
Natural gas
(1000 Sm3)
V33
Refinery
gas
benzo(a
)pyrene
g/tonne
S.01
Direct-
fired
furnaces 0.00002
0.0000
2
0.0000
2 . . . . . 0.007 0.00002 0.00003
benzo(
a)pyre
ne
g/tonn
e .......
S.02
Gas
turbines . . . . . . . . . 0.00002 .
benzo(
a)pyre
ne
g/tonn
e ....... S.03
Boilers 0.007 0.007 0.007 . 0.0001 0.0001 0.0001 0.0001 . 0.00002 0.00003
benzo(
a)pyre
ne
g/tonn
e .......
S.04
Small
stoves 2.81 2.85 3.5 0.312 . . 2.091 2.091. 3.5695 . .
benzo(b
)fluorant
hene
g/tonne
S.01
Direct-
fired
furnaces 0.001 0.001 0.001 . . . . . 0.010 0.00003 0.00004
benzo(b
)fluorant
hene
g/tonne
S.02
Gas
turbines . . . . . . . . . 0.00003 .
benzo(b
)fluorant
hene
g/tonne
S.03
Boilers 0.010 0.010 0.010 . 0.0075 0.0075 0.0075 0.0075 . 0.00003 0.00004
benzo(b
)fluorant
hene
g/tonne
S.04
Small
stoves 4.777 4.845 5.95 0.492 . . 1.918 1.918 3.2745 . .
benzo(k)
fluoranth
ene
g/tonne
S.01
Direct-
fired
furnaces 0.0008 0.0008 0.001 . . . . . 0.004 0.00003 0.00004
benzo(k)
fluoranth
ene
g/tonne
S.02
Gas
turbines . . . . . . . . . 0.00003 .
benzo(k)
fluoranth
ene
g/tonne
S.03
Boilers 0.004 0.004 0.004 . 0.0075 0.0075 0.0075 0.0075 . 0.00003 0.00004
benzo(k)
fluoranth
ene
g/tonne
S.04
Small
stoves 3.653 2.85 3.5 0.115 . . 0.726 0.726. 1.239 . .
indeno(1
,2,3_cd)
pyrene
g/tonne
S.01
Direct-
fired
furnaces 0.00003
0.0000
3
0.0000
4 . . . . . 0.003 0.00003 0.00004
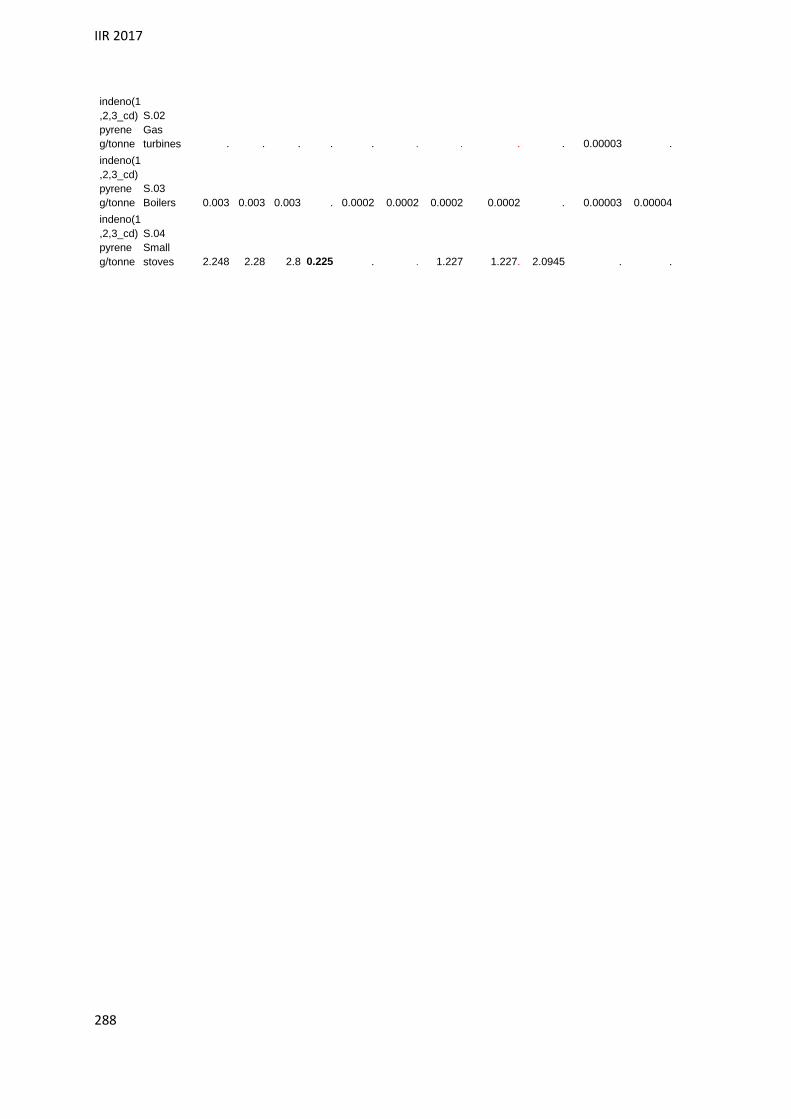
IIR 2017
288
indeno(1
,2,3_cd)
pyrene
g/tonne
S.02
Gas
turbines . . . . . . . . . 0.00003 .
indeno(1
,2,3_cd)
pyrene
g/tonne
S.03
Boilers 0.003 0.003 0.003 . 0.0002 0.0002 0.0002 0.0002 . 0.00003 0.00004
indeno(1
,2,3_cd)
pyrene
g/tonne
S.04
Small
stoves 2.248 2.28 2.8 0.225 . . 1.227 1.227. 2.0945 . .

IIR 2017
289
Table B31 (cont.). General emission factors for PAH
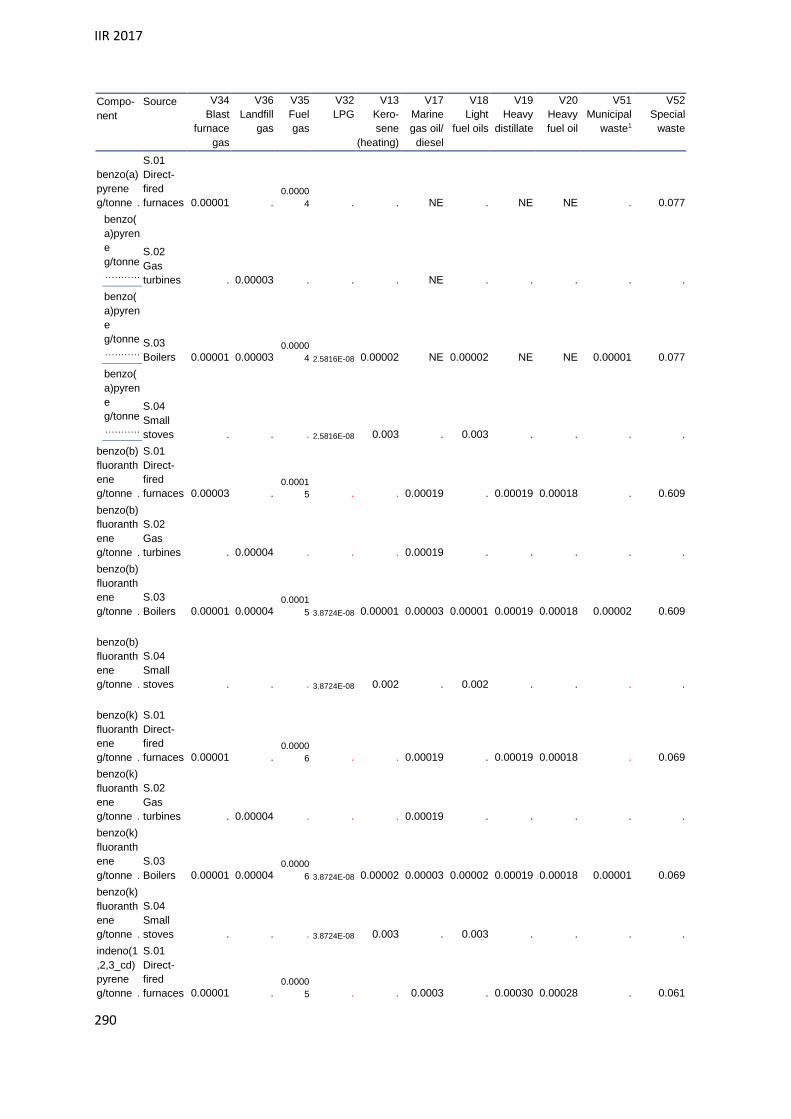
IIR 2017
290
Compo-
nent
Source V34
Blast
furnace
gas
V36
Landfill
gas
V35
Fuel
gas
V32
LPG
V13
Kero-
sene
(heating)
V17
Marine
gas oil/
diesel
V18
Light
fuel oils
V19
Heavy
distillate
V20
Heavy
fuel oil
V51
Municipal
waste1
V52
Special
waste
benzo(a)
pyrene
g/tonne .
S.01
Direct-
fired
furnaces 0.00001 . 0.0000
4 . . NE . NE NE . 0.077
benzo(
a)pyren
e
g/tonne
...........
S.02
Gas
turbines . 0.00003 . . . NE . . . . .
benzo(
a)pyren
e
g/tonne
........... S.03
Boilers 0.00001 0.00003 0.0000
4 2.5816E-08 0.00002 NE 0.00002 NE NE 0.00001 0.077
benzo(
a)pyren
e
g/tonne
...........
S.04
Small
stoves . . . 2.5816E-08 0.003 . 0.003 . . . .
benzo(b)
fluoranth
ene
g/tonne .
S.01
Direct-
fired
furnaces 0.00003 . 0.0001
5 . . 0.00019 . 0.00019 0.00018 . 0.609
benzo(b)
fluoranth
ene
g/tonne .
S.02
Gas
turbines . 0.00004 . . . 0.00019 . . . . .
benzo(b)
fluoranth
ene
g/tonne .
S.03
Boilers 0.00001 0.00004 0.0001
5 3.8724E-08 0.00001 0.00003 0.00001 0.00019 0.00018 0.00002 0.609
benzo(b)
fluoranth
ene
g/tonne .
S.04
Small
stoves . . . 3.8724E-08 0.002 . 0.002 . . . .
benzo(k)
fluoranth
ene
g/tonne .
S.01
Direct-
fired
furnaces 0.00001 . 0.0000
6 . . 0.00019 . 0.00019 0.00018 . 0.069
benzo(k)
fluoranth
ene
g/tonne .
S.02
Gas
turbines . 0.00004 . . . 0.00019 . . . . .
benzo(k)
fluoranth
ene
g/tonne .
S.03
Boilers 0.00001 0.00004 0.0000
6 3.8724E-08 0.00002 0.00003 0.00002 0.00019 0.00018 0.00001 0.069
benzo(k)
fluoranth
ene
g/tonne .
S.04
Small
stoves . . . 3.8724E-08 0.003 . 0.003 . . . .
indeno(1
,2,3_cd)
pyrene
g/tonne .
S.01
Direct-
fired
furnaces 0.00001 . 0.0000
5 . . 0.0003 . 0.00030 0.00028 . 0.061

IIR 2017
291
indeno(1
,2,3_cd)
pyrene
g/tonne .
S.02
Gas
turbines . 0.00004 . . . 0.0003 . . . . .
indeno(1
,2,3_cd)
pyrene
g/tonne .
S.03
Boilers 0.00001 0.00004 0.0000
5 3.8724E-08 0.00005 0.00004 0.00005 0.00030 0.00028 0.00001 0.061
indeno(1
,2,3_cd)
pyrene
g/tonne .
S.04
Small
stoves . . . 3.8724E-08 0.007 . 0.007 . . . .
Bold numbers are different for different years, see table B40. NE = Not estimated. 1Emission factor used for the years after 1995. Emission
factors for the years 1990 to 1994 can be given on request.
Source: Finstad et al. (2001). Fuel wood factor based on data from annual surveys on use of fuel wood in households. EEA (2013), EEA
(2016), . Allerup et. al (2015)
Table B32.Time series for variable emission factors for PAH1. Stationary combustion (g component /tonne
fuel)
Component Sou
rce
Fue
l
1990 1991 1992 1993 1994 1995 1996 1997 1998 1999 2000 2001
benzo(a)py
rene S.04 V41 0.74 0.74 0.74 0.74 0.74 0.74 0.74 0.74 0.74 0.72 0.69
0.66
benzo(b)flu
oranthene S.04 V41 1.17 1.17 1.17 1.17 1.17 1.17 1.17 1.17 1.16 1.13 1.09
1.03
benzo(k)flu
oranthene S.04 V41 0.27 0.27 0.27 0.27 0.27 0.27 0.27 0.27 0.27 0.26 0.25
0.24
indeno(1,2,
3_cd)pyren
e S.04 V41 0.53 0.53 0.53 0.53 0.53 0.53 0.53 0.53 0.53 0.52 0.50
0.47
2002 2003 2004 2005 2006 2007 2008 2009 2010 2011 2012 2013
benzo(a)py
rene S.04 V41 0.61 0.54 0.46 0.50 0.47 0.46 0.44 0.42 0.41 0.39 0.38
0.36
benzo(b)flu
oranthene S.04 V41 0.96 0.85 0.73 0.78 0.74 0.73 0.70 0.66 0.64 0.62 0.59
0.59
benzo(k)flu
oranthene S.04 V41 0.22 0.20 0.17 0.18 0.17 0.17 0.16 0.15 0.15 0.14 0.14
0
0
0.13
indeno(1,2,
3_cd)pyren
e S.04 V41 0.44 0.39 0.33 0.36 0.34 0.33 0.32 0.30 0.29 0.28
0.27 0.26
2014 2015
benzo(a)py
rene S.04 V41 0.36 0.31
benzo(b)flu
oranthene S.04 V41 0.57 0.49
benzo(k)flu
oranthene S.04 V41 0.13 0.12
indeno(1,2,
3_cd)pyren
e S.04 V41 0.26 0.23
Source: Emission factor: Finstad et al. (2001). PAH-profile: EEA (2013)
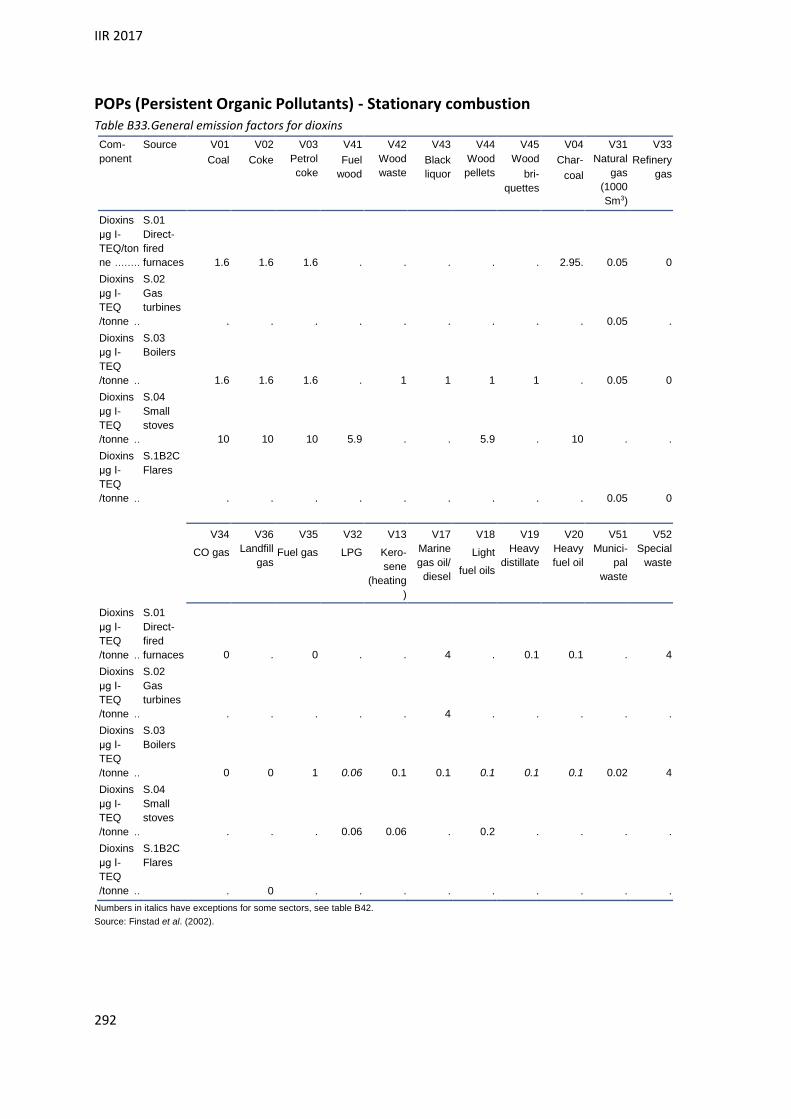
IIR 2017
292
POPs (Persistent Organic Pollutants) - Stationary combustion Table B33.General emission factors for dioxins
Com-
ponent
Source V01
Coal
V02
Coke
V03
Petrol
coke
V41
Fuel
wood
V42
Wood
waste
V43
Black
liquor
V44
Wood
pellets
V45
Wood
bri-
quettes
V04
Char-
coal
V31
Natural
gas
(1000
Sm3)
V33
Refinery
gas
Dioxins
μg I-
TEQ/ton
ne ........
S.01
Direct-
fired
furnaces 1.6 1.6 1.6 . . . . . 2.95. 0.05 0
Dioxins
μg I-
TEQ
/tonne ..
S.02
Gas
turbines
. . . . . . . . . 0.05 .
Dioxins
μg I-
TEQ
/tonne ..
S.03
Boilers
1.6 1.6 1.6 . 1 1 1 1 . 0.05 0
Dioxins
μg I-
TEQ
/tonne ..
S.04
Small
stoves
10 10 10 5.9 . . 5.9 . 10 . .
Dioxins
μg I-
TEQ
/tonne ..
S.1B2C
Flares
. . . . . . . . . 0.05 0
V34
CO gas
V36
Landfill
gas
V35
Fuel gas
V32
LPG
V13
Kero-
sene
(heating
)
V17
Marine
gas oil/
diesel
V18
Light
fuel oils
V19
Heavy
distillate
V20
Heavy
fuel oil
V51
Munici-
pal
waste
V52
Special
waste
Dioxins
μg I-
TEQ
/tonne ..
S.01
Direct-
fired
furnaces 0 . 0 . . 4 . 0.1 0.1 . 4
Dioxins
μg I-
TEQ
/tonne ..
S.02
Gas
turbines
. . . . . 4 . . . . .
Dioxins
μg I-
TEQ
/tonne ..
S.03
Boilers
0 0 1 0.06 0.1 0.1 0.1 0.1 0.1 0.02 4
Dioxins
μg I-
TEQ
/tonne ..
S.04
Small
stoves
. . . 0.06 0.06 . 0.2 . . . .
Dioxins
μg I-
TEQ
/tonne ..
S.1B2C
Flares
. 0 . . . . . . . . .
Numbers in italics have exceptions for some sectors, see table B42.
Source: Finstad et al. (2002).

IIR 2017
293
Table B34.Exceptions from the general factors for POPs. Stationary combustion
Emission factor
(ug
dioxin/tonne)
Fuel Source Sectors
0.2 V18, 19 Heavy distillate, heavy
fuel oil
S.03 Boilers 330000
The emission factors for BC, PCB and HCB vary greatly between sectors, combustion technology
and years. Table B35 presents some of the factors. In a number of cases, particularly for PCB and
HCB, factors are not available and emissions have not been estimated.
Table B35.Emission factors for BC, PCB and HCB
BC PCB HCB
kg/tonne ug/tonn ug/tonn
Coal ............................... 0.0161 161.1701 17.422
Coke .............................. 0.0161 161.1701 17.422
Petrol coke ..................... 0.0161 161.1701 NE
Charcoal ........................ 0.1801 161.1701 0.1501
Motor gasoline ................ 0.0092 203 0.4222
Aviation gasoline ............ 0.0054 NE NE
Kerosene (heating) ......... 0.0865 4.008 NE
Jet kerosene .................. 0.0054 NE NE
Auto diesel ..................... 0.1962 986.3392 456.0172
Marine gas oil/diesel ....... 0.6006 355.656 80
Light fuel oils .................. 4.0085 4.008 9.4827
Heavy distillate ............... 2.2106 603.4006 1406
Heavy fuel oil ................. 2.2106 603.4006 1406
Natural gas (1000 Sm3) ... 0.0098 NE NE
LPG ............................... 0.0098 NE NE
Refinery gas ................... 0.010 NE NE
CO gas .......................... 0.010 NE NE
Fuel gas ......................... 0.010 NE NE
Landfill gas ..................... 0.010 NE NE
Biogas ........................... 0.0108 4.518 NE
Fuel wood ...................... 0.9379 61.8329 84
Wood waste ................... 0.294 47.040 84
Black liquor .................... NE 19.395 2.381
Wood pellets .................. 0.40610 7.829 84
Wood briquettes ............. 0.813 7.829 84
Municipal waste .............. 0.005 0.03211 45.15012
Special waste ................. 1.0081 0.19511 225.75012
1 Industrial combustion. 2 Private cars in 2015. 3 1997-2015. 4 Cruise=0.001. 5 Households. 6 Ships. 7 Services. 8 Stationary combustion. 9 2015. 10 Households: 0.037. 11 2006-2015.
12 2005-2015.

IIR 2017
294
Appendix C
Uncertainty analysis
Long-range transboundary air pollutants
Source for the uncertainty estimates for long-range transboundary air pollutants is Rypdal and
Zhang (2001).

IIR 2017
295
Table C1.Summary of expert judgements of uncertainties in point sources
Production type Number of
plants
Pollutant Emission determination method and uncertainty
evaluation
Assessment
(average)
Pulp and paper 6 SO2 Continuous emission measurements and estimations
from sulphur content of fuel. Diffuse emissions of
sulphur compounds when producing sulphite pulp.
The latter has a higher uncertainty than both the
measured and estimated stack emissions.
4 %
Oil refineries 2 (3) SO2 Continuous emission measurements and estimations
from sulphur content of fuel.
5 %
NOx Based on measurements and calculations. 10 %
NMVOC Combination of point measurements and calculations.
Emissions are variable with possibilities of systematic
errors. Emissions from loading of products have lower
uncertainty than the fugitive. Differences between the
refineries due to different technology, products and
operations.
45 %
Petrochemical
industries and
gas terminal
4 NOx Annual measurements and/or calculations 7 %
NMVOC Several emission points. Difficult to measure properly
and high variability. Uncertainty is in any case lower
than for the refineries as mostly gas is handled (high
demand for security).
25 %
Cement 2 SO2 Continuous measurements and annual
measurements/calculations. High variability as
cement plants incinerates special waste.
12 %
NOx Continuous measurements and annual
measurements/calculations. High variability as
cement plants incinerates special waste.
12 %
Ammonia and
fertiliser
2 NOx Continuous/weekly measurements. 7 %
NH3 Several emission points. Several measurements
performed each year. Low variability.
10 %
Silicon carbide
(SiC)
3 SO2 Emissions are estimates based on consumption and
sulphur content of coke. The sulphur content is
measured independently for every delivery. There is,
however, uncertainty connected to the end products
and degree of oxidation and definition applied, so
reporting can seem inconsistent.
20 %
Ferroalloys 16 SO2 Emissions are estimates based on consumption and
sulphur content of coke and the sulphur in products.
The sulphur content is measured independently for
every delivery. The sulphur content of products are
measured regularly, but shows small variability.
2 %
NOx Estimates using emission factors. Emission factors
are based on measurements. Emission factors are,
however, only available for some types of ferroalloys
and emissions are not estimated for the others.
10-20 %*
Aluminium 8 SO2 Monthly measurements (covering emissions from
stack and ceiling)
7 %
NOx Emissions are estimated based on emission factors
(see table 4).
-
Waste
incineration
8 SO2 Annual representative measurements. Variable
emissions due to the waste fraction incinerated.
7 %
NOx Annual representative measurements. 10 %
* Additional uncertainty due to possible incomplete reporting.

IIR 2017
296
Table C2.Summary of standard deviation and probability density of activity data
SNAP
category
Pollutant source Important for Standard
deviation (2). %
Density
shape
Source/Comment
01, 02, 03 Gas combustion NOx 4 Normal Directorate of oil and
gas
01, 02, 03,
07, 08
Oil combustion (total) SO2, NOx 3 Normal Spread in data.
0102 Waste combustion - Energy
industries
SO2, NOx,
NMVOC
5 Normal Expert judgement
0202 Coal and coke combustion -
Residential
SO2, NOx,
NMVOC
20 Normal Expert judgement
090201 Waste combustion - Other
sectors
SO2, NOx,
NMVOC
30 Lognormal Expert judgement
01, 02, 03 Wood combustion - All
sectors
SO2, NOx,
NMVOC
30 Lognormal Expert judgement
01, 03 Coal and coke combustion-
Industry
SO2, NOx,
NMVOC
5 Normal Spread in data
07, 08 Oil, road/off-
road/catalytic/non-catalytic
SO2, NOx,
NMVOC, NH3
20 Normal Comparisons of data
0805 Oil combustion - Aviation SO2, NOx,
NMVOC
20 Normal Expert judgement
0804 Oil combustion - Shipping SO2, NOx,
NMVOC
10 Normal Comparisons of data
0401 Refineries (throughput) NMVOC 3 Normal Expert judgement
040301 Aluminium production NOx 3 Normal Expert judgement
040302 Ferroalloy production NOx 3 Normal Expert judgement
040605 Bread production NMVOC 30 Normal Expert judgement
040607 Beer production NMVOC 10 Normal Expert judgement
050202 Loading of crude oil NMVOC 3 Normal Expert judgement
0505 Gasoline distribution NMVOC 3 Normal Expert judgement
0601 Solvent use NMVOC See emission factor
09 Waste combustion in small
scale
SO2, NOx,
NMVOC
50 Lognormal Expert judgement
090201 Methane incineration
(landfills)
NOx, NMVOC 5 Normal Expert judgement
090204 Flaring of natural gas NOx, NMVOC 4 Normal As combustion of
gas
090204 "Flaring" of crude oil SO2, NOx,
NMVOC
10 Normal Expert judgement
090203/4 Other flaring NOx, NMVOC 5 Normal Expert judgement
090207 Incineration of hospital
waste
NOx, NMVOC 20 Normal Expert judgement
090901 Cremation SO2, NOx,
NMVOC
20 Normal Expert judgement
10 Animal population NH3 5-10 Normal Expert judgement
10 Agricultural soils - Treatment
of straw
NH3 See emission factor
1001 Agricultural soils - Fertiliser
use
NH3 5 Normal Agriculture
authorities
1009 Agricultural soils - Manure
use
NH3 20 Normal Expert judgement

IIR 2017
297
Table C3.Summary of standard deviation and probability density of emission factors
SNAP source
category
Pollutant source Standard deviation
(2). %
Density
shape
Source/Comment
01, 02, 03 SO2 - Oil combustion,
general
1 Normal Expert judgement. Oil companies
01, 02, 03 SO2 - Oil combustion, heavy
fuel oil
-50 - +100 Normal Expert judgement. Oil companies
01, 03 SO2 - Coal combustion -50 - +100 Lognormal Spread in data
01, 03 SO2 - Wood combustion -50 - +100 Lognormal Spread in data
0804 SO2 - Oil combustion,
domestic shipping
25 Normal Expert judgement. Oil companies
01, 02 (+03) NOx - Combustion in area
sources
40-50 Normal Spread in data
0105 NOx - Combustion off-shore 40 Lognormal Expert judgement
040301 NOx - Aluminium production -50 - +100 Lognormal Expert judgement
07 NOx - Road traffic 25-30 Normal Expert judgement, spread in data
0704/0705 NOx - Motorcycles 40 Normal Expert judgement, spread in data
0801-02, 0806-
09
NOx - Equipment and
railways
40 Normal Spread in data
0804 NOx - Shipping 15 Normal Spread in data
0805 NOx - Aircraft 20 Normal EEA (2000)
0902 NOx - Flaring 40 Lognormal Expert judgement
01, 02 (+03) NMVOC - Combustion in
area sources
40-50 Normal Spread in data
0105 NMVOC - Combustion
offshore
50 Lognormal Expert judgement
040605/07 NMVOC- Beer and bread
production
-50 - +100 Lognormal EEA (2000)
050201 NMVOC- Oil loading
onshore
30 Normal Rypdal (1999), Expert judgement
050202 NMVOC- Oil loading
offshore
40 Normal Rypdal (1999), Expert judgement
0505 NMVOC - Gasoline
distribution
50 Lognormal EEA (2000)
0601 NMVOC - Solvent use 30 Normal Rypdal (1995)
0701 NMVOC - Road traffic
(gasoline vehicles)
40-50 Normal Expert judgement, spread in data
0703 NMVOC - Road traffic
(diesel vehicles)
20-30 Normal Expert judgement, spread in data
0704/0705 NMVOC - Motorcycles 40 Normal Expert judgement, spread in data
0801-02, 0806-
09
NMVOC - Equipment and
railways
40 Normal Spread in data
0804 NMVOC - Shipping 50 Normal Spread in data
0805 NMVOC - Aircraft 25 Normal EEA (2000)
0902 NMVOC - Flaring 50 Lognormal Expert judgement
07 NH3 - Road traffic Factor 3 Lognormal Expert judgement, spread in data
1001 NH3 -Agriculture, fertiliser 20 Normal Expert judgement
1005 NH3 -Agriculture, animal
manure
30 Normal Expert judgement
10 NH3 -Agriculture, treatment
of straw
5 Normal Expert judgement

IIR 2017
298
Table C4.Uncertainty in emission level of pollutants. 1990, 1998 and 2010
1990 (mean) ktonnes
Relative standard deviation
(/)
Uncertainty
2 (% of mean)
Uncertainty
2 (ktonnes)
SO2 52.7 0.02 4.0 2 NOx 219.0 0.062 12 27 NMVOC 298.4 0.09 18 54 NH3 22.9 0.104 21 5
1998 (mean) ktonnes
Relative standard deviation
(/)
Uncertainty
2 (% of mean)
Uncertainty
2 (ktonnes)
SO2 29.8 0.021 4.2 1 NOx 224.0 0.062 12 27 NMVOC 344.5 0.105 21 72 NH3 27.0 0.091 18 5
2010* (mean) ktonnes
Relative standard deviation
(/)
Uncertainty
2 (% of mean)
Uncertainty
2 (ktonnes)
SO2 22.0 0.025 5.0 1 NOx 156.0 0.062 12 19 NMVOC 194.0 0.074 15 29 NH3 23.0 0.105 21 5
* Projected data with uncertainties as if they were historical.
Table C5.Uncertainties in emission trends 1990-1998 and 1990-2010
Absolute change
(2010-1990)
% change
((2010-
1990)*100/1990)
Relative standard
deviation
(/(2010-1990))
Uncertainty 2
(absolute change)
Uncertainty
2 (%-point of
change)
1990-1998
SO2 -23.0 -43 -0.04 1.7 3.2
NOx +4.8 +2 +3.00 28 13
NMVOC +43.8 +15 +0.40 35 12
NH3 +4.1 +18 +0.22 1.8 8.0
1990-2010
SO2 -30.7 -58 -0.03 1.8 3.4
NOx -62.8 -29 -0.21 26.9 12
NMVOC -104.9 -35 -0.18 38 13
NH3 +0.0 0 61.3 3.1 13
* Projected values with uncertainties as if they were historical.
IIR 2017
299
Appendix D
Economic sectors in the Norwegian emission model
The classification is an aggregated version of the one used in the national accounts. To make the
standard sectors more appropriate for emission calculations, a few changes have been made,
e.g. "Private households" is defined as a sector. The classification is aggregated from the
Norwegian Standard Industrial Classification, SIC2007 (Statistics Norway 2009). The SIC is
identical to the European NACE (rev. 2) classification up to the four-digit level. A national level
has been introduced at the five-digit level.
The sector numbers in the model have six or, in a few cases, eight digits. The first two digits
refer to the main sectors of the economy: 23 = private sector, 24 = central government,
25 = local government, 33 = private households, and 66 = foreign activity. For clarity, the two
first digits are only included for the first sector listed in each main sector in the table below.
The next four digits are approximate SIC codes. The first two of these in most cases correspond
to SIC at the two-digit level, but some sector numbers, particularly those used for service
industries, are aggregates of several SIC divisions. The detailed relationship is shown in the
following table, where the sectors are listed with the corresponding SIC codes.
For emissions from solvents and paraffin wax, figures are available at a somewhat more
disaggregated sector level, but since these sectors do not reflect the general detailing level in
the emission calculations, they are not included in the table below.
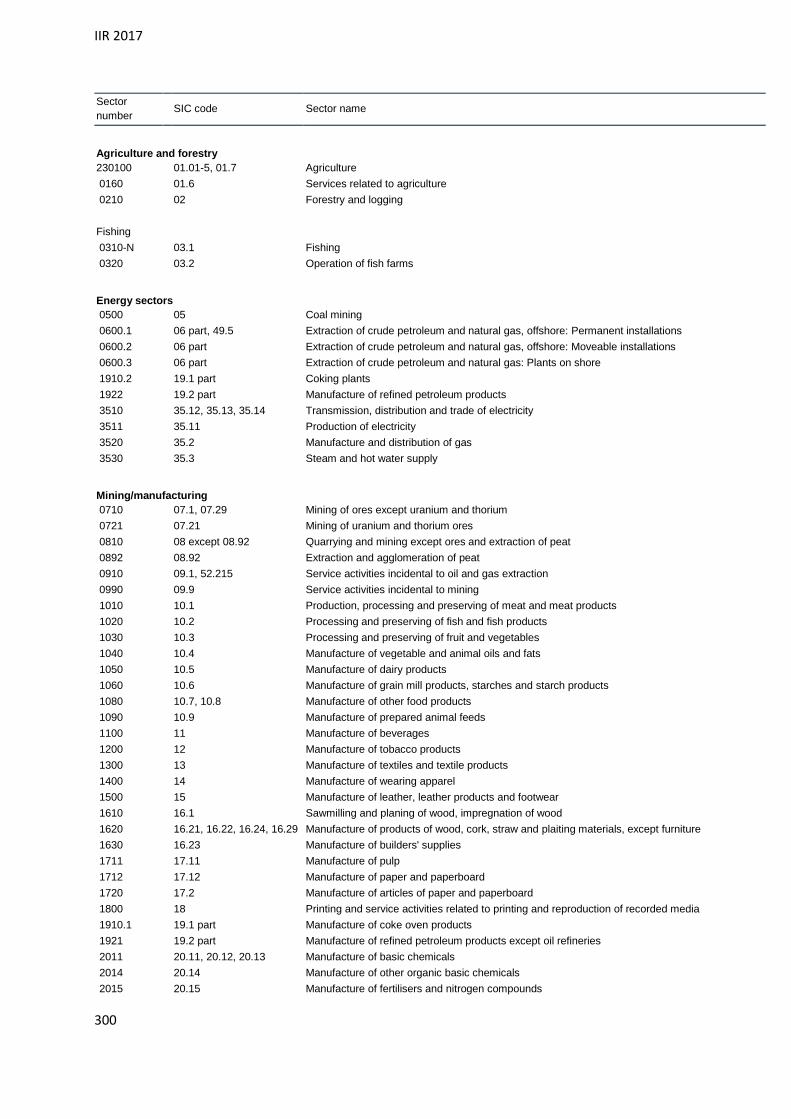
IIR 2017
300
Sector
number SIC code Sector name
Agriculture and forestry
230100 01.01-5, 01.7 Agriculture
0160 01.6 Services related to agriculture
0210 02 Forestry and logging
Fishing
0310-N 03.1 Fishing
0320 03.2 Operation of fish farms
Energy sectors
0500 05 Coal mining
0600.1 06 part, 49.5 Extraction of crude petroleum and natural gas, offshore: Permanent installations
0600.2 06 part Extraction of crude petroleum and natural gas, offshore: Moveable installations
0600.3 06 part Extraction of crude petroleum and natural gas: Plants on shore
1910.2 19.1 part Coking plants
1922 19.2 part Manufacture of refined petroleum products
3510 35.12, 35.13, 35.14 Transmission, distribution and trade of electricity
3511 35.11 Production of electricity
3520 35.2 Manufacture and distribution of gas
3530 35.3 Steam and hot water supply
Mining/manufacturing
0710 07.1, 07.29 Mining of ores except uranium and thorium
0721 07.21 Mining of uranium and thorium ores
0810 08 except 08.92 Quarrying and mining except ores and extraction of peat
0892 08.92 Extraction and agglomeration of peat
0910 09.1, 52.215 Service activities incidental to oil and gas extraction
0990 09.9 Service activities incidental to mining
1010 10.1 Production, processing and preserving of meat and meat products
1020 10.2 Processing and preserving of fish and fish products
1030 10.3 Processing and preserving of fruit and vegetables
1040 10.4 Manufacture of vegetable and animal oils and fats
1050 10.5 Manufacture of dairy products
1060 10.6 Manufacture of grain mill products, starches and starch products
1080 10.7, 10.8 Manufacture of other food products
1090 10.9 Manufacture of prepared animal feeds
1100 11 Manufacture of beverages
1200 12 Manufacture of tobacco products
1300 13 Manufacture of textiles and textile products
1400 14 Manufacture of wearing apparel
1500 15 Manufacture of leather, leather products and footwear
1610 16.1 Sawmilling and planing of wood, impregnation of wood
1620 16.21, 16.22, 16.24, 16.29 Manufacture of products of wood, cork, straw and plaiting materials, except furniture
1630 16.23 Manufacture of builders' supplies
1711 17.11 Manufacture of pulp
1712 17.12 Manufacture of paper and paperboard
1720 17.2 Manufacture of articles of paper and paperboard
1800 18 Printing and service activities related to printing and reproduction of recorded media
1910.1 19.1 part Manufacture of coke oven products
1921 19.2 part Manufacture of refined petroleum products except oil refineries
2011 20.11, 20.12, 20.13 Manufacture of basic chemicals
2014 20.14 Manufacture of other organic basic chemicals
2015 20.15 Manufacture of fertilisers and nitrogen compounds

IIR 2017
301
Sector
number SIC code Sector name
2016 20.16, 20.17 Manufacture of plastics and synthetic rubber in primary forms
2020 20.2 Manufacture of pesticides and other agrochemical products
2030 20.3 Manufacture of paints and varnishes, printing ink and mastics
2040 20.4 Manufacture of soap and detergents and toilet preparations
2050 20.5, 20.6 Manufacture of other chemical products
2100 21 Manufacture of basic pharmaceutical products and pharmaceutical preparations
2200 22 Manufacture of rubber and plastic products
2310 23.1 Manufacture of glass and glass products
2320 23.2, 23.3, 23.4 Manufacture of refractory products, clay building materials and other porcelain and ceramic
products
2350 23.5 Manufacture of cement, lime and plaster
2360 23,6, 23.7, 23.9 Manufacture of products of cement, lime and plaster and other non-metallic mineral products
2411 24.101, 24.2, 24.3 Manufacture of basic iron and steel
2412 24.102 Manufacture of ferroalloys
2440 24.4 except 24.42 Other non-ferrous metal production
2442 24.42 Aluminium production
2451 24.51, 24.52 Casting of iron and steel
2453 24.53, 24.54 Casting of light metals and other non-ferrous metals
2510 25.1, 25.2, 25.3 Manufacture of structural metal products, tanks, reservoirs and containers etc. of metal
2570 25.7 Manufacture of cutlery, tools and general hardware
2590 25.4, 25.5, 25.6, 25.9 Manufacture of other metal products
2610 26.1, 26.2 Manufacture of electronic components and computers
2630 26.3 Manufacture of communication equipment
2640 26.4 Manufacture of consumer electronics
2650 26.5, 26.6, 26.7, 26.8 Manufacture of other electronic and optical products
2750 27.5 Manufacture of domestic appliances
2790 27.1, 27.2, 27.3, 27.4, 27.9 Manufacture of other electrical apparatus and equipment
2810 28.1, 28.2 Manufacture of general-purpose machinery
2830 28.3, 28.4, 28.9 Manufacture of special-purpose machinery
2900 29 Manufacture of motor vehicles and parts and accessories for motor vehicles
3011 30.1 except 30.113 and
30.116
Building of ships and boats
3012 30.113, 30.116 Building of oil platforms
3020 30.2 Manufacture of railway and tramway locomotives and rolling stock
3030 30.3 Manufacture of aircraft and spacecraft
3090 30.4, 30.9 Manufacture of other transport equipment
3100 31 Manufacture of furniture
3210 32.1 Manufacture of jewellery, bijouterie and related articles
3290 32.2, 32.3, 32.4, 32.5, 32.9 Other manufacturing
3310 33.1 Repair of fabricated metal products, machinery and equipment
3320 33.2 Installation of industrial machinery and equipment
Water supply, sewerage, waste management and remediation activities
3600 36 Water collection, treatment and supply
3800 37-39 Sewerage, waste collection, treatment and disposal activities; materials recovery
Construction
4120 41.2, 42, 43 Construction
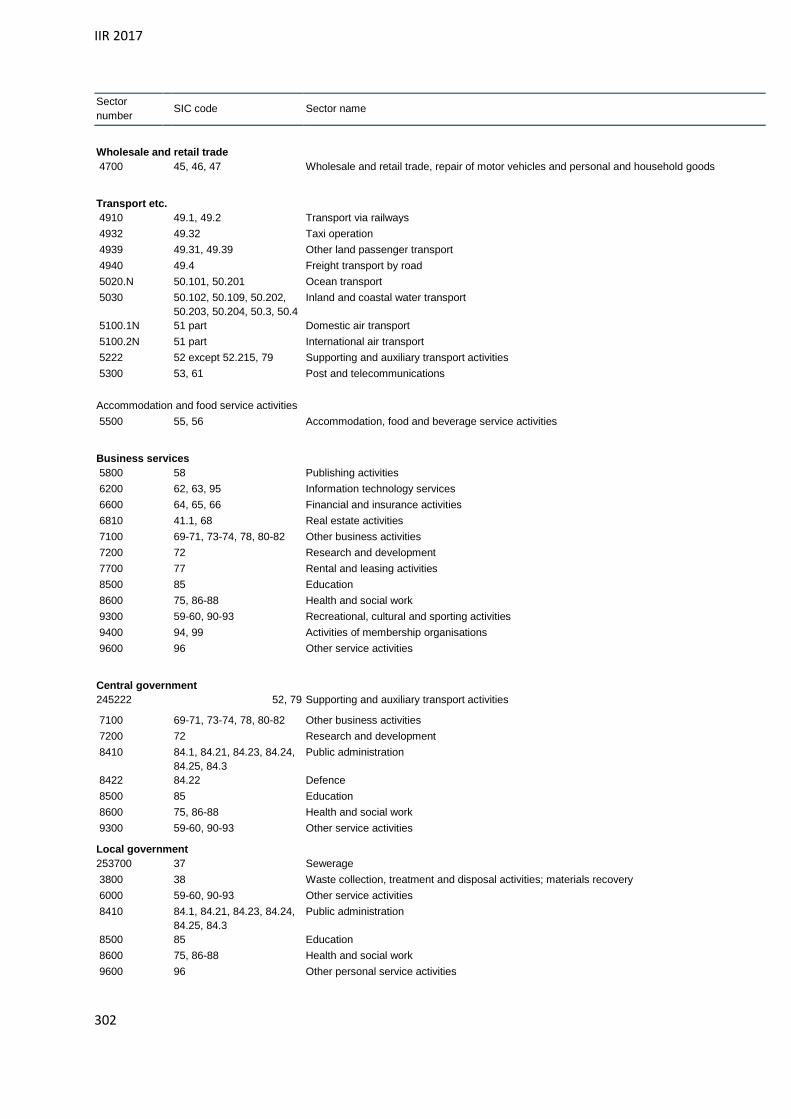
IIR 2017
302
Sector
number SIC code Sector name
Wholesale and retail trade
4700 45, 46, 47 Wholesale and retail trade, repair of motor vehicles and personal and household goods
Transport etc.
4910 49.1, 49.2 Transport via railways
4932 49.32 Taxi operation
4939 49.31, 49.39 Other land passenger transport
4940 49.4 Freight transport by road
5020.N 50.101, 50.201 Ocean transport
5030 50.102, 50.109, 50.202,
50.203, 50.204, 50.3, 50.4
Inland and coastal water transport
5100.1N 51 part Domestic air transport
5100.2N 51 part International air transport
5222 52 except 52.215, 79 Supporting and auxiliary transport activities
5300 53, 61 Post and telecommunications
Accommodation and food service activities
5500 55, 56 Accommodation, food and beverage service activities
Business services
5800 58 Publishing activities
6200 62, 63, 95 Information technology services
6600 64, 65, 66 Financial and insurance activities
6810 41.1, 68 Real estate activities
7100 69-71, 73-74, 78, 80-82 Other business activities
7200 72 Research and development
7700 77 Rental and leasing activities
8500 85 Education
8600 75, 86-88 Health and social work
9300 59-60, 90-93 Recreational, cultural and sporting activities
9400 94, 99 Activities of membership organisations
9600 96 Other service activities
Central government
245222 52, 79 Supporting and auxiliary transport activities
7100 69-71, 73-74, 78, 80-82 Other business activities
7200 72 Research and development
8410 84.1, 84.21, 84.23, 84.24,
84.25, 84.3
Public administration
8422 84.22 Defence
8500 85 Education
8600 75, 86-88 Health and social work
9300 59-60, 90-93 Other service activities
Local government
253700 37 Sewerage
3800 38 Waste collection, treatment and disposal activities; materials recovery
6000 59-60, 90-93 Other service activities
8410 84.1, 84.21, 84.23, 84.24,
84.25, 84.3
Public administration
8500 85 Education
8600 75, 86-88 Health and social work
9600 96 Other personal service activities

IIR 2017
303
Sector
number SIC code Sector name
Private households
330000 n.a. Private households
Foreign activities in Norway
665020 n.a. Foreign activities in Norway, ocean transport
665100.2 n.a. Foreign activities in Norway, air transport
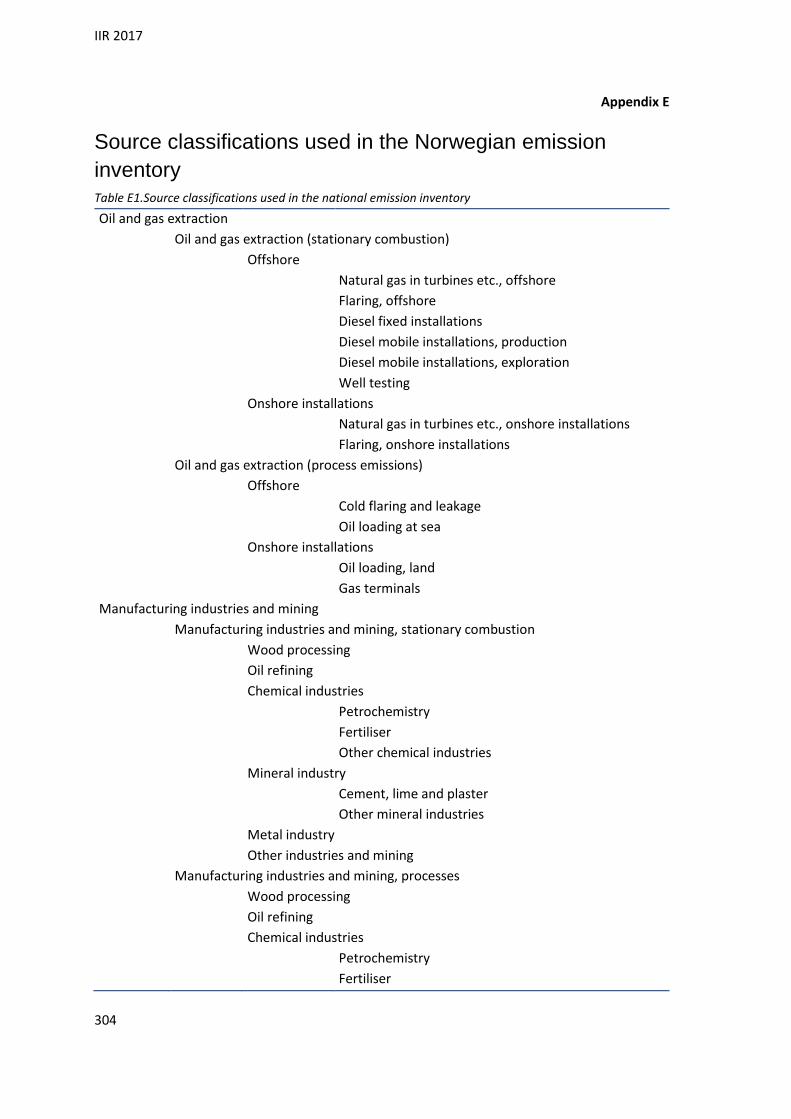
IIR 2017
304
Appendix E
Source classifications used in the Norwegian emission
inventory
Table E1.Source classifications used in the national emission inventory
Oil and gas extraction
Oil and gas extraction (stationary combustion)
Offshore
Natural gas in turbines etc., offshore
Flaring, offshore
Diesel fixed installations
Diesel mobile installations, production
Diesel mobile installations, exploration
Well testing
Onshore installations
Natural gas in turbines etc., onshore installations
Flaring, onshore installations
Oil and gas extraction (process emissions)
Offshore
Cold flaring and leakage
Oil loading at sea
Onshore installations
Oil loading, land
Gas terminals
Manufacturing industries and mining
Manufacturing industries and mining, stationary combustion
Wood processing
Oil refining
Chemical industries
Petrochemistry
Fertiliser
Other chemical industries
Mineral industry
Cement, lime and plaster
Other mineral industries
Metal industry
Other industries and mining
Manufacturing industries and mining, processes
Wood processing
Oil refining
Chemical industries
Petrochemistry
Fertiliser

IIR 2017
305
Carbides
Other chemical industries
Mineral industry
Cement
Other mineral industries
Metal industry
Iron, steel and ferro-alloys
Aluminium
Other metals
Anodes
Other manufacturing industries and mining
Coal mining
Other mining
Fermentation (bread and beer)
Asphalt production plants
Other industries
Energy supply
Heating in other industries and households
Heating in other industries
Heating in primary industries
Heating in construction and building
Heating in other service industries
Heating in households
Road
traffic
Passenger cars
Passenger cars - petrol
Passenger cars - diesel
Light duty vehicles
Light duty vehicles- petrol
Light duty vehicles - diesel
Heavy duty vehicles
Heavy duty vehicles - petrol
Heavy duty vehicles - diesel etc.
Motorcycles and mopeds
Motorcycles
Mopeds
Aviation, navigation, fishing, motorized equipment etc.
Railways
Domestic aviation
Domestic aviation < 1000 m
Domestic aviation > 1000 m
Coastal navigation
Navigation - Coastal traffic etc.
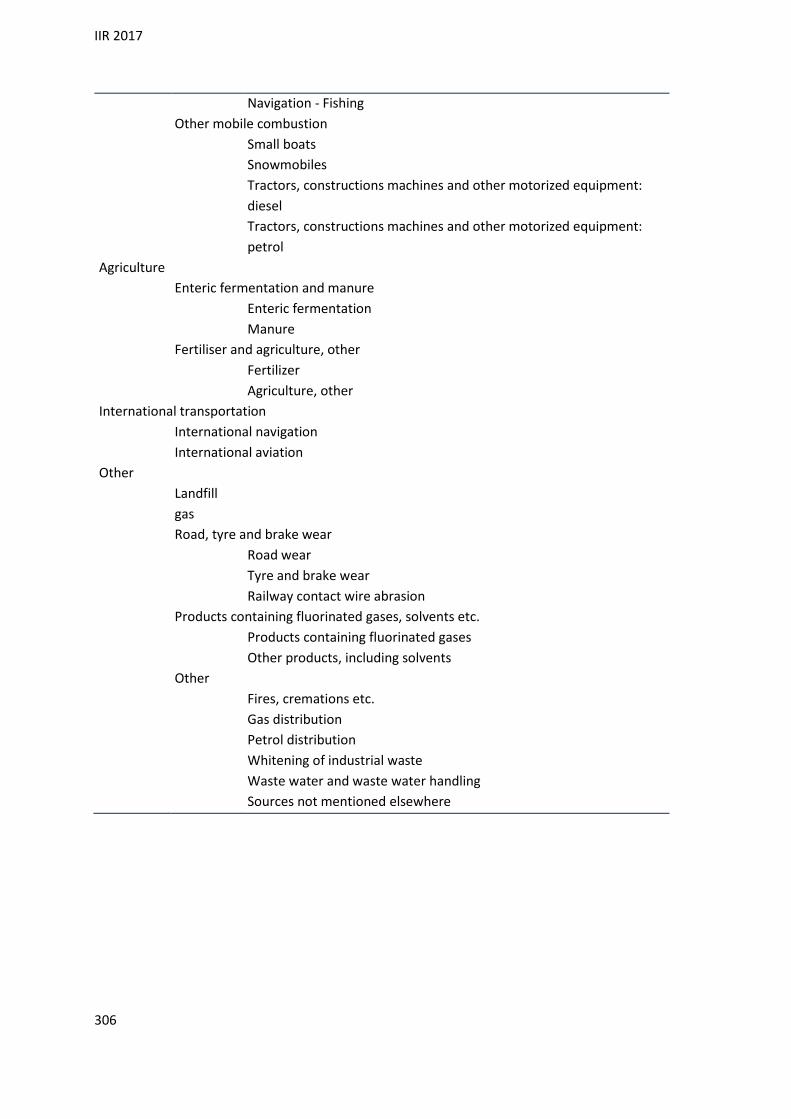
IIR 2017
306
Navigation - Fishing
Other mobile combustion
Small boats
Snowmobiles
Tractors, constructions machines and other motorized equipment:
diesel
Tractors, constructions machines and other motorized equipment:
petrol
Agriculture
Enteric fermentation and manure
Enteric fermentation
Manure
Fertiliser and agriculture, other
Fertilizer
Agriculture, other
International transportation
International navigation
International aviation
Other
Landfill
gas
Road, tyre and brake wear
Road wear
Tyre and brake wear
Railway contact wire abrasion
Products containing fluorinated gases, solvents etc.
Products containing fluorinated gases
Other products, including solvents
Other
Fires, cremations etc.
Gas distribution
Petrol distribution
Whitening of industrial waste
Waste water and waste water handling
Sources not mentioned elsewhere

IIR 2017
307
Table E2.EMEP/NFR14 source sector categories
1A1a Public electricity and heat production
1A1b Petroleum refining
1A1c Manufacture of solid fuels and other energy industries
1A2a Stationary combustion in manufacturing industries and construction: Iron and steel
1A2b Stationary combustion in manufacturing industries and construction: Non-ferrous
metals
1A2c Stationary combustion in manufacturing industries and construction: Chemicals
1A2d Stationary combustion in manufacturing industries and construction: Pulp, Paper
and Print
1A2e Stationary combustion in manufacturing industries and construction: Food
processing, beverages and tobacco
1A2f Stationary combustion in manufacturing industries and construction: Non-metallic
minerals
1A2gvii Mobile Combustion in manufacturing industries and construction: (please specify in
the IIR)
1A2gviii Stationary combustion in manufacturing industries and construction: Other (please
specify in the IIR)
1A3ai(i) International aviation LTO (civil)
1A3aii(i) Domestic aviation LTO (civil)
1A3bi Road transport: Passenger cars
1A3bii Road transport: Light duty vehicles
1A3biii Road transport: Heavy duty vehicles and buses
1A3biv Road transport: Mopeds & motorcycles
1A3bv Road transport: Gasoline evaporation
1A3bvi Road transport: Automobile tyre and brake wear
1A3bvii Road transport: Automobile road abrasion
1A3c Railways
1A3di(ii) International inland waterways
1A3dii National navigation (shipping)
1A3ei Pipeline transport
1A3eii Other (please specify in the IIR)
1A4ai Commercial/institutional: Stationary
1A4aii Commercial/institutional: Mobile
1A4bi Residential: Stationary
1A4bii Residential: Household and gardening (mobile)
1A4ci Agriculture/Forestry/Fishing: Stationary
1A4cii Agriculture/Forestry/Fishing: Off-road vehicles and other machinery
1A4ciii Agriculture/Forestry/Fishing: National fishing
1A5a Other stationary (including military)
1A5b Other, Mobile (including military, land based and recreational boats)

IIR 2017
308
1B1a Fugitive emission from solid fuels: Coal mining and handling
1B1b Fugitive emission from solid fuels: Solid fuel transformation
1B1c Other fugitive emissions from solid fuels
1B2ai Fugitive emissions oil: Exploration, production, transport
1B2aiv Fugitive emissions oil: Refining / storage
1B2av Distribution of oil products
1B2b Fugitive emissions from natural gas (exploration, production, processing,
transmission, storage, distribution and other)
1B2c Venting and flaring (oil, gas, combined oil and gas)
1B2d Other fugitive emissions from energy production
2A1 Cement production
2A2 Lime production
2A3 Glass production
2A5a Quarrying and mining of minerals other than coal
2A5b Construction and demolition
2A5c Storage, handling and transport of mineral products
2A6 Other mineral products (please specify in the IIR)
2B1 Ammonia production
2B2 Nitric acid production
2B3 Adipic acid production
2B5 Carbide production
2B6 Titanium dioxide production
2B7 Soda ash production
2B10a Chemical industry: Other (please specify in the IIR)
2B10b Storage, handling and transport of chemical products (please specify in the IIR)
2C1 Iron and steel production
2C2 Ferroalloys production
2C3 Aluminium production
2C4 Magnesium production
2C5 Lead production
2C6 Zinc production
2C7a Copper production
2C7b Nickel production
2C7c Other metal production (please specify in the IIR)
2C7d Storage, handling and transport of metal products
(please specify in the IIR)
2D3a Domestic solvent use including fungicides
2D3b Road paving with asphalt
2D3c Asphalt roofing
2D3d Coating applications
2D3e Degreasing
2D3f Dry cleaning

IIR 2017
309
2D3g Chemical products
2D3h Printing
2D3i Other solvent use (please specify in the IIR)
2G Other product use (please specify in the IIR)
2H1 Pulp and paper industry
2H2 Food and beverages industry
2H3 Other industrial processes (please specify in the IIR)
2I Wood processing
2J Production of POPs
2K Consumption of POPs and heavy metals
(e.g. electrical and scientific equipment)
2L Other production, consumption, storage, transportation or handling of bulk products
(please specify in the IIR)
3B1a Manure management - Dairy cattle
3B1b Manure management - Non-dairy cattle
3B2 Manure management - Sheep
3B3 Manure management - Swine
3B4a Manure management - Buffalo
3B4d Manure management - Goats
3B4e Manure management - Horses
3B4f Manure management - Mules and asses
3B4gi Manure mangement - Laying hens
3B4gii Manure mangement - Broilers
3B4giii Manure mangement - Turkeys
3B4giv Manure management - Other poultry
3B4h Manure management - Other animals (please specify in IIR)
3Da1 Inorganic N-fertilizers (includes also urea application)
3Da2a Animal manure applied to soils
3Da2b Sewage sludge applied to soils
3Da2c Other organic fertilisers applied to soils
(including compost)
3Da3 Urine and dung deposited by grazing animals
3Da4 Crop residues applied to soils
3Db Indirect emissions from managed soils
3Dc Farm-level agricultural operations including storage, handling and transport of
agricultural products
3Dd Off-farm storage, handling and transport of bulk agricultural products
3De Cultivated crops
3Df Use of pesticides
3F Field burning of agricultural residues
3I Agriculture other (please specify in the IIR)
5A Biological treatment of waste - Solid waste disposal on land
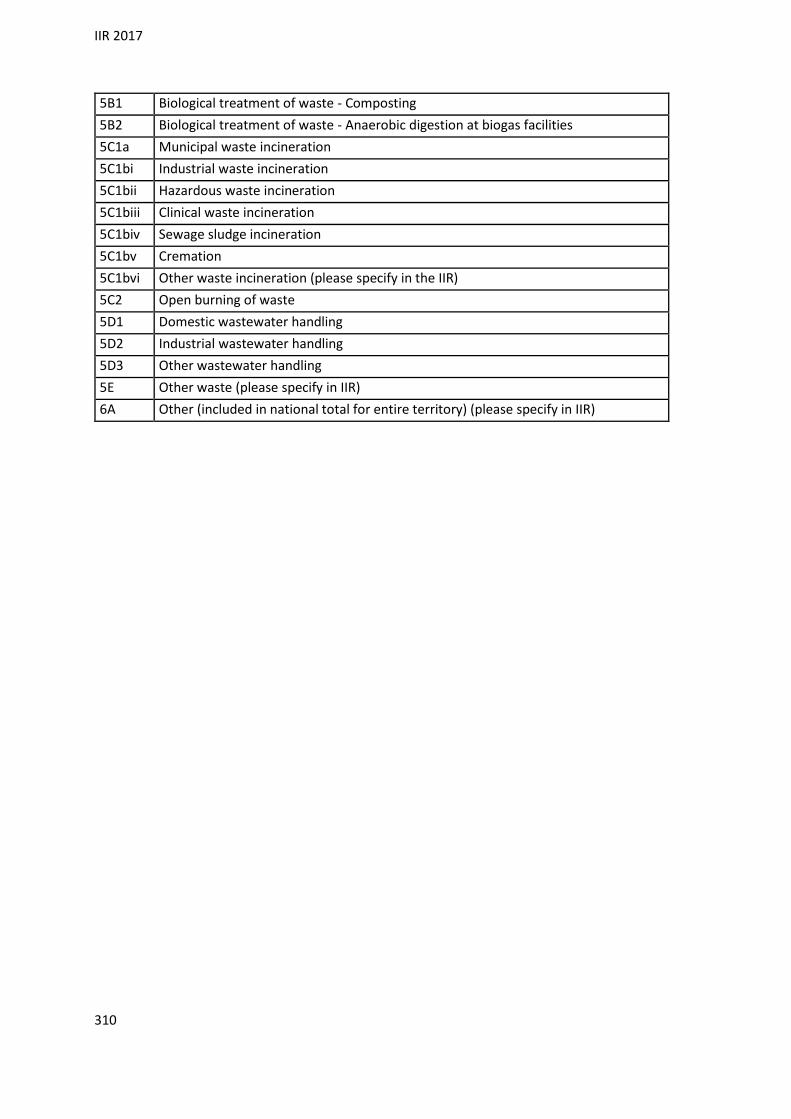
IIR 2017
310
5B1 Biological treatment of waste - Composting
5B2 Biological treatment of waste - Anaerobic digestion at biogas facilities
5C1a Municipal waste incineration
5C1bi Industrial waste incineration
5C1bii Hazardous waste incineration
5C1biii Clinical waste incineration
5C1biv Sewage sludge incineration
5C1bv Cremation
5C1bvi Other waste incineration (please specify in the IIR)
5C2 Open burning of waste
5D1 Domestic wastewater handling
5D2 Industrial wastewater handling
5D3 Other wastewater handling
5E Other waste (please specify in IIR)
6A Other (included in national total for entire territory) (please specify in IIR)

IIR 2017
311
The Norwegian Environment Agency is working for
a clean and diverse environment. Our primary
tasks are to reduce greenhouse gas emissions,
manage Norwegian nature, and prevent pollution.
We are a government agency under the Ministry
of Climate and Environment and have 700
employees at our two offices in Trondheim and
Oslo and at the Norwegian Nature Inspectorate’s
more than sixty local offices.
We implement and give advice on the
development of climate and environmental
policy. We are professionally independent. This
means that we act independently in the individual
cases that we decide and when we communicate
knowledge and information or give advice.
Our principal functions include collating and
communicating environmental information,
exercising regulatory authority, supervising and
guiding regional and local government level,
giving professional and technical advice, and
participating in international environmental
activities.
Norwegian Environment Agency
Telephone: +47 73 58 05 00 | Fax: +47 73 58 05 01
E-mail: [email protected]
Web: www.environmentagency.no
Postal address: Postboks 5672 Sluppen, N-7485 Trondheim
Visiting address Trondheim: Brattørkaia 15, 7010 Trondheim
Visiting address Oslo: Grensesvingen 7, 0661 Oslo


