Comparison of Nonroad Hazardous Air Pollutant Emissions Included in the National Emission Inventory Roger Chang, Richard Billings, and Heather Perez Eastern Research Group 1600 Perimeter Park Drive Morrisville, NC 27560 Laurel Driver U.S. Environmental Protection Agency Emission Factor Inventory Group Research Triangle Park, NC 27560 Carl Scarbro and Richard Cook U.S. Environmental Protection Agency Office of Transportation and Air Quality Ann Arbor, MI 48105 ABSTRACT The National Emission Inventory (NEI) includes criteria pollutants and hazardous air pollutants (HAPs) from all stationary and mobile sources. The mobile source emissions component of NEI contains estimates for onroad as well as nonroad source categories. Nonroad source categories include, aircraft, commercial marine vessel (CMV), locomotive, and “other” nonroad vehicle and engines 1 . The other nonroad source categories are the vehicles and engines included in U.S. Environmental Protection Agency’s (EPA’s) draft NONROAD model, such as construction and agricultural equipment, recreational engines, and portable commercial, institutional, and industrial equipment. The nonroad emission estimates have been significantly improved in the 1999 NEI, both in terms of the quality of the emissions estimates which were developed and the refinement of the spatial allocation methods used. This paper discusses the methods used and improvements made to estimate emissions for the other nonroad emission sources. This paper also compares the emission estimates between each of the individual other nonroad categories, identifying the most significant sources of the HAPs included in the NEI. Spatial assessments are performed to evaluate emission differences between urban and rural counties. BACKGROUND Under Section 112 of the Clean Air Act (CAA), as amended in 1990 requires the EPA to identify emission sources of criteria pollutants and HAPs, quantify emissions, develop regulations for the identified source categories, and assess the public health and environmental impacts after the regulations are put into effect. The NEI is a comprehensive inventory covering all criteria pollutants and HAPs for all areas of the United States. The NEI was created by the EPA’s Emission Factor and Inventory Group (EFIG) in Research Triangle Park, North Carolina. The NEI is a tool that EPA can use to meet the CAA mandates. The NEI data have been formatted according to protocols established for the EPA’s NEI submittals. The common data structure on which the NEI platform is based allow the NEI emission data to be transferred to multiple end-users for a variety of purposes. For example, the criteria and HAP
Transcript
Comparison of Nonroad Hazardous Air Pollutant Emissions Included in theNational Emission Inventory
Roger Chang, Richard Billings, and Heather PerezEastern Research Group
1600 Perimeter Park Drive Morrisville, NC 27560
Laurel DriverU.S. Environmental Protection Agency
Emission Factor Inventory Group Research Triangle Park, NC 27560
Carl Scarbro and Richard Cook
U.S. Environmental Protection AgencyOffice of Transportation and Air Quality
Ann Arbor, MI 48105
ABSTRACT
The National Emission Inventory (NEI) includes criteria pollutants and hazardous air pollutants(HAPs) from all stationary and mobile sources. The mobile source emissions component of NEIcontains estimates for onroad as well as nonroad source categories. Nonroad source categories include,aircraft, commercial marine vessel (CMV), locomotive, and “other” nonroad vehicle and engines1. Theother nonroad source categories are the vehicles and engines included in U.S. Environmental ProtectionAgency’s (EPA’s) draft NONROAD model, such as construction and agricultural equipment,recreational engines, and portable commercial, institutional, and industrial equipment.
The nonroad emission estimates have been significantly improved in the 1999 NEI, both in termsof the quality of the emissions estimates which were developed and the refinement of the spatialallocation methods used. This paper discusses the methods used and improvements made to estimateemissions for the other nonroad emission sources. This paper also compares the emission estimatesbetween each of the individual other nonroad categories, identifying the most significant sources of theHAPs included in the NEI. Spatial assessments are performed to evaluate emission differences betweenurban and rural counties.
BACKGROUND
Under Section 112 of the Clean Air Act (CAA), as amended in 1990 requires the EPA to identifyemission sources of criteria pollutants and HAPs, quantify emissions, develop regulations for theidentified source categories, and assess the public health and environmental impacts after the regulationsare put into effect. The NEI is a comprehensive inventory covering all criteria pollutants and HAPs forall areas of the United States. The NEI was created by the EPA’s Emission Factor and Inventory Group(EFIG) in Research Triangle Park, North Carolina. The NEI is a tool that EPA can use to meet the CAAmandates.
The NEI data have been formatted according to protocols established for the EPA’s NEIsubmittals. The common data structure on which the NEI platform is based allow the NEI emission datato be transferred to multiple end-users for a variety of purposes. For example, the criteria and HAP
emission estimates developed for the NEI are incorporated into the annual EPA publication entitledNational Air Quality and Emissions Trends Report, which is used to evaluate air pollution trends overtime. The NEI is also a critical component of the EPA's national Air Toxics Program (as described inEPA's July 19, 1999 Federal Register notice, 64 FR 38706). The initial objective of the Air ToxicsProgram is to make the data available for air quality modeling and subsequent exposure and riskanalyses use in the National Air Toxics Assessment (NATA).
The target inventory area of NEI includes every state in the United States and every countywithin a state. There are no boundary limitations pertaining to traditional criteria pollutantnonattainment areas or to designated urban areas. The pollutants inventoried included all criteriapollutants and the 188 HAPs identified in Section 112(b) of the CAA.
The mobile source component of the NEI is composed of onroad vehicles, aircraft, commercialmarine vessels (CMVs), locomotive, and other nonroad engines and equipment. Emission estimateswere developed for each mobile source category for each county in the U.S. Concurrent with thedevelopment of the national emission estimates, some state and local agencies developed and providedto the EPA emissions inventory data for their areas based on local knowledge and activity information. These state and local agency data replaced the national emission estimates when the pollutant, sourcecategory, and emission type matched with data in the NEI.
The other nonroad mobile source category includes vehicles and equipment that normally are notoperated on public roads nor provide transportation and are not considered aircraft, CMVs orlocomotives. Note, the individual source categories included in this group are the same sourcecategories included in the NONROAD model. These include categories such as lawn and gardenequipment, agricultural equipment, logging equipment, construction equipment, airport service vehicles,locomotive maintenance vehicles, and recreational equipment (including recreational marine engines). The other nonroad vehicles and equipment include both diesel-powered and gasoline-powered engines. Gasoline-powered engines can further be characterized into two engine categories, specifically 2- and 4-stroke engines.
Emission estimates for the other nonroad component of the NEI include all of the criteriapollutants and 22 HAPs (note that the polycyclic aromatic hydrocarbon (PAH) HAP group contains 16individual compounds. The HAP estimates include the pollutants listed below. These pollutants wereidentified based on available test data and accepted emission estimating procedures.
The nonroad emission estimates provided in the NEI were derived using a mixture of “top down”and “bottom up” approaches. Figure 1 provides an overview of the approaches used to estimateemissions from this source sector. Data submitted by state and local agencies, for some areas, replacedEPA’s nationally-developed estimates.
County Fuel Programis Identified
HAP/VOC SpeciationProfiles for Specific
Fuels Used inCounty are Appliedto VOC Estimate
Figure 1. Procedures for Estimating County Level HAP Emissionfrom Nonroad Mobile Sources
County Level VOC/PMEstimates from Nonroad
Model
NationalActivity/Fuel Usage
HAP/PM SpeciationProfiles are Appliedto County Level PM
Estimates
Nonroad MetalHAP Emission
Factors
County Level HAP Emission Estimates
Emissions Allocatedto County Based onCounty/National PM
Ratios
The emission estimates for organic HAPs were developed by applying HAP speciation profiles tocounty-level volatile organic compounds (VOC) estimates. A number of different fuels are used in
onroad vehicles. EPA assumed that these same fuels were used in other nonroad applications. Thesenonroad fuels included:
• Baseline gasoline, conventional lead-free fuel;• Winter oxygenated gasoline with methyl tertiary butyl ether (MTBE) or tertiary amyl
methyl ether (TAME);• Winter oxygenated gasoline with ethanol;• Reformulated fuels with MTBE or TAME;• Reformulated fuels with ethanol; and• Diesel.
In the NEI, the use of these different fuels was considered in calculating emission. Informationwas obtained from Office of Transportation and Air Quality (OTAQ) that indicated the percentage of theyear each gasoline fuel type was used in each county. These data were based on individual countyparticipation in the Federal Reformulated Gasoline Program and State Oxygenated Fuel Programs. The fuel usage data were considered in assigning appropriate speciation profiles to each county. Theseprofiles matched engine type (i.e., diesel, 2-stroke gasoline, 4-stroke gasoline), fuel type, and emissiontype (i.e., exhaust or evaporative), and were applied to the other nonroad VOC estimates for each countyto calculate the county-specific HAP emissions. The county-level VOC estimates were derived from1999 NONROAD model runs using the “lockdown C (May 2002)” version. It was assumed that dieselfuels have negligible evaporative emissions.
In some cases it was possible to obtain engine-specific HAP/VOC speciation profiles for certainpollutants. When specific HAP/VOC speciation profiles could not be obtained, average speciationprofiles for each nonroad engine type (i.e., 2-stoke, 4-stroke, and diesel) were developed and used. These profiles were based on recent test studies published in peer-reviewed journals, as well as profilescompiled in the EPA’s SPECIATE database.
It should be noted that different HAP/VOC speciation profiles for acetaldehyde, acrolein,formaldehyde, propionaldehyde, and 2, 2, 4-trimethylpentane were used to estimate other nonroad dieselemissions in California to account for the reformulated diesel fuel used in that state.
The approach used to develop HAP speciation profiles for diesel-powered nonroad equipment issimilar to the approach used to develop speciation profiles for gasoline-powered equipment, except inthe cases for polycyclic aromatic hydrocarbons (PAH) and aldehydes. These profiles were developed byOTAQ as follows. In the case of diesel PAH profiles, additional data on highway diesel fuel usage innonroad diesel fuel operations were available. Therefore, the nonroad diesel PAH speciation profileswere derived by the ratio of the percent of highway fuel usage and onroad diesel PAH data profiles withnonroad fuel consumption and nonroad diesel PAH data.
The emission estimates for dioxin/furans and metal HAPs, excluding lead, were estimated byapplying emission factors to vehicle activity or fuel consumption data. For these metal HAP estimates, itwas necessary to combine the 2- and 4-stroke engine-type categories into one category, called gasolineengines. Thus, dioxin/furans and metal HAP emissions for all gasoline engines, regardless of type, werebased on the same metal emission factor. A national estimate of other nonroad lead emissions wasobtained by multiplying the average lead content of mobile fuel with the amount of fuel used nationallyin nonroad applications. Note, the lead content of fuel is relatively small and represents tracecompounds in the extracted crude oil.
In contrast to earlier versions of the NEI, the current version includes several significant
improvements to the other nonroad component. For this version, EPA
• Developed 2,2,4-trimethylpentane estimates. Previously emission inventories did notinclude this pollutant for the other nonroad sources.
• Adjusted the PAH emission estimates to accounted for spillover usage of highway dieselfuel in nonroad applications. In earlier version of the inventory this spillover effect wasnot considered in estimating emissions.
• Revised metal HAP calculations using activity or fuel consumption. Previously metalHAP emissions were estimated by speciating the PM estimates.
• Revised mercury and arsenic emission estimates based on half of the detection limit tomore accurately represent expected emission levels. The emission factors used inpreviously inventories were considerably higher and based on test data which may not berepresentative.
• Speciated chromium emission estimates into trivalent and hexivalent chromium. Thesetwo pollutants have significantly different toxicities, such that disaggregating theseestimates will improve the NATA risk assessments that are based on the NEI emissioninventories.
• Dioxin emissions estimates were developed using vehicle miles traveled (VMT)-basedemission factors for gasoline and diesel powered equipment. Previously, dioxin was notone of the pollutants considered in estimating emissions for the other nonroad sourcecategories.
COMPARISON OF EMISSION ESTIMATES
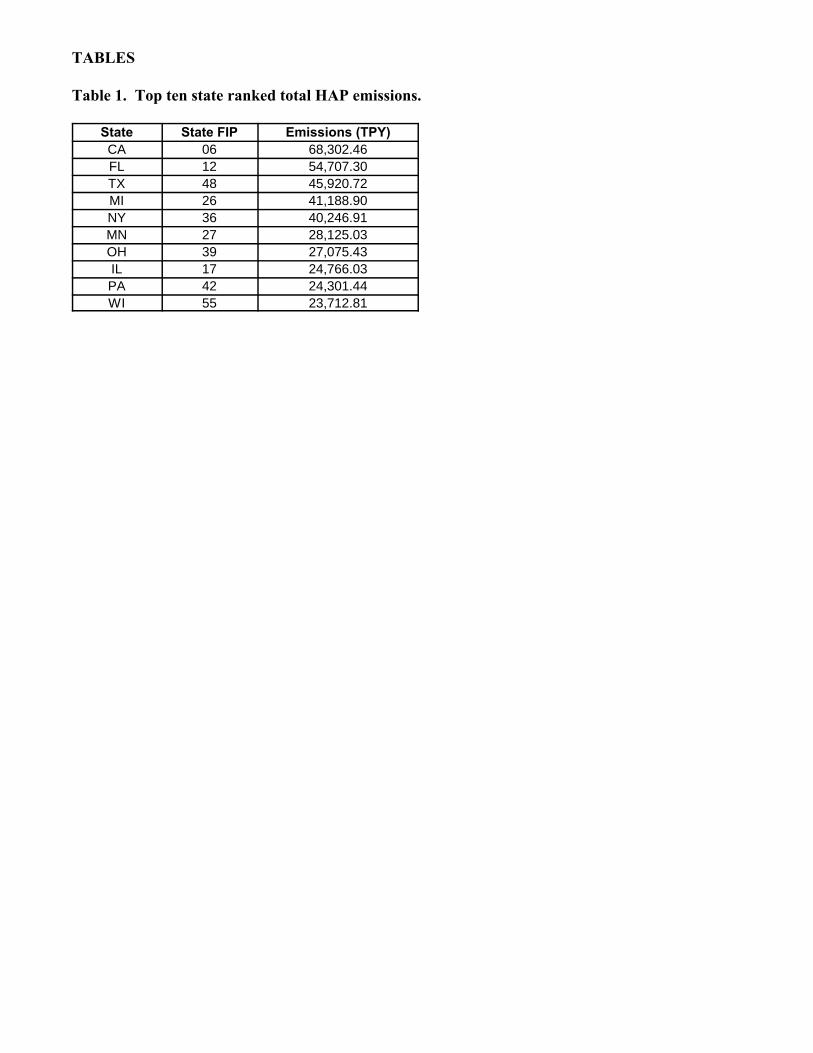
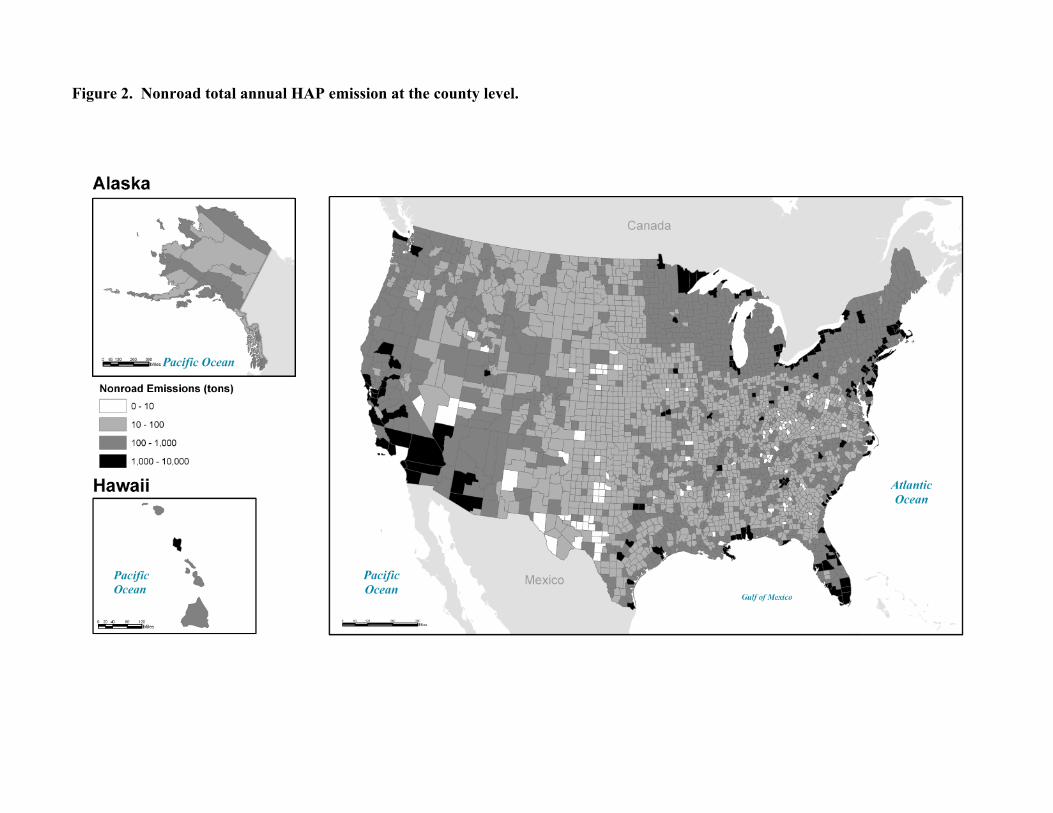
To easily compare the national HAP emissions, emission summaries are provided below in avariety of ways including: state, county, SCC tier II, SCC, and SCC by engine type. Not surprisingly,total HAP emissions are largest in the larger states (see Table 1), California being the top emitter. However it is unfair to say that the whole state is responsible for the high emissions. As Figure 2 notes,nonroad emissions vary from county to county.
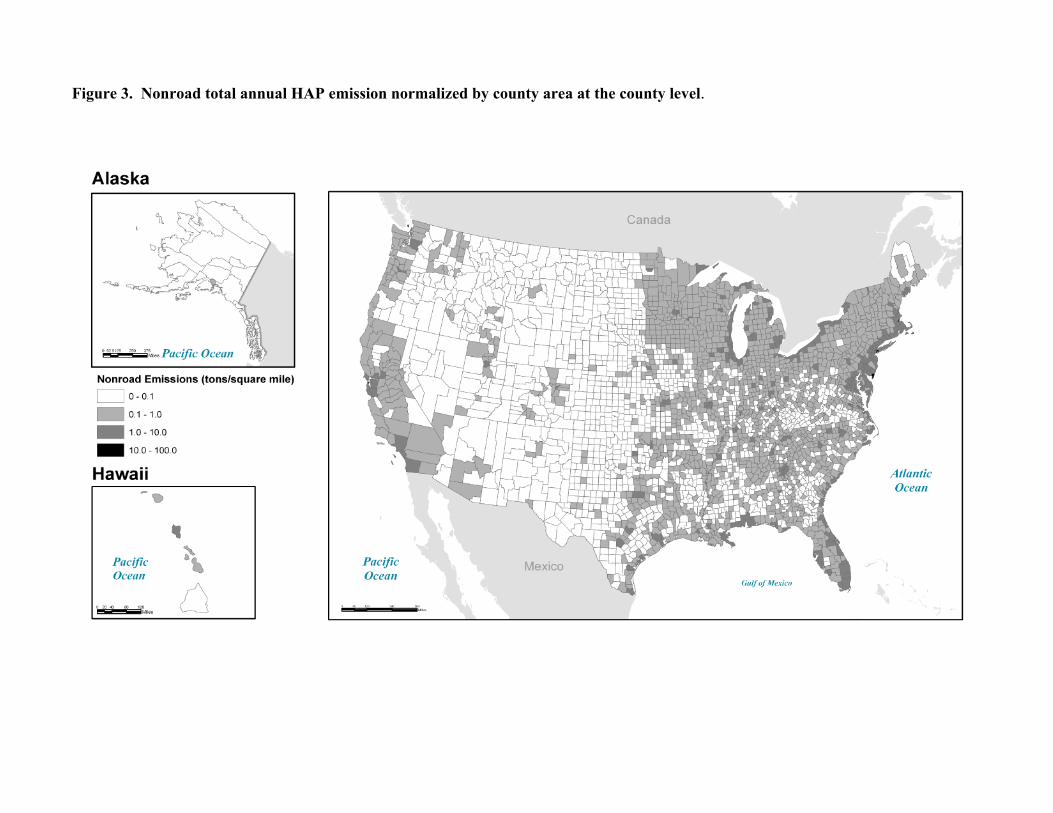
When the emissions are normalized for county surface area, the top ten states still have some ofthe highest emissions, but it also becomes apparent that emissions are concentrated in the eastern half ofthe United States and the west coast. It should be noted that there are a few very high emission densitylocations that appear as small black dots in California, Virginia, and New England states (see Figure 3). These are an artifact of the normalization calculations. These dots tend to be municipalities with smallsurface area such that a relative small nonroad emission source could make the municipality a highdensity emission center.
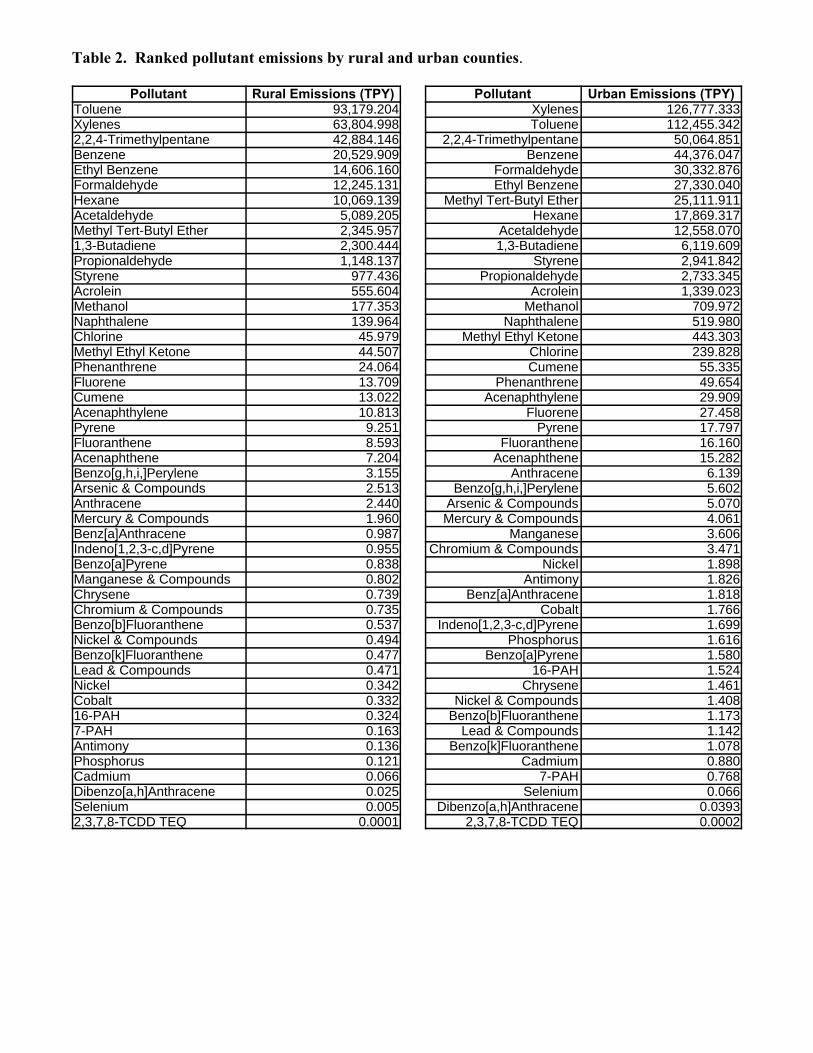
When the emissions are compared between the rural and urban counties by individual pollutants,the emissions are always higher in the urban counties than in the rural counties. However, it isinteresting to note that the actual ranking of the pollutants differ slightly between the rural counties andthe urban counties. For example, the top ten pollutants in both rural and urban counties are the samethough their order may be different (see Table 2).
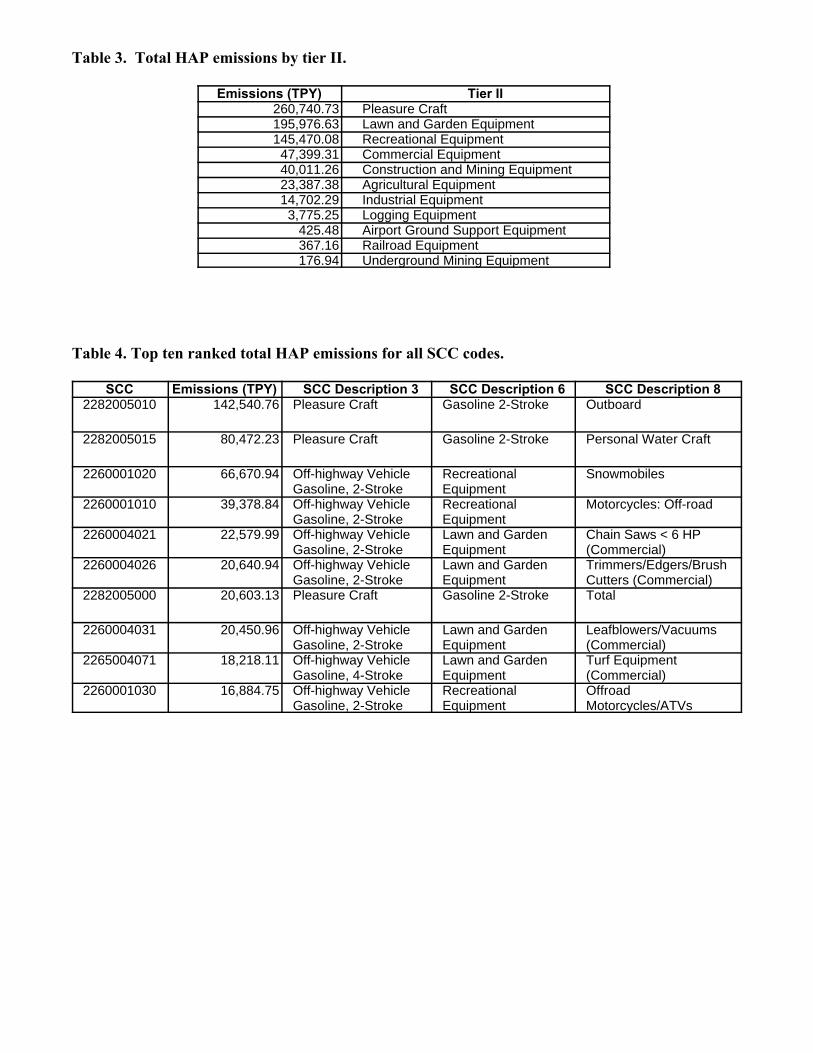
When the total emissions are ranked according to SCC tier II, pleasure craft, lawn and garden
equipment, and recreational equipment are the leading contributors and represent 82 percent of totalHAP emissions(see Table 3). When the emissions are ranked by the individual SCC codes, the top tenconsist of three pleasure craft SCC codes, three recreational equipment SCC codes, and four lawn andgarden equipment SCC codes (see Table 4), which is consistent with the tier II ranking.
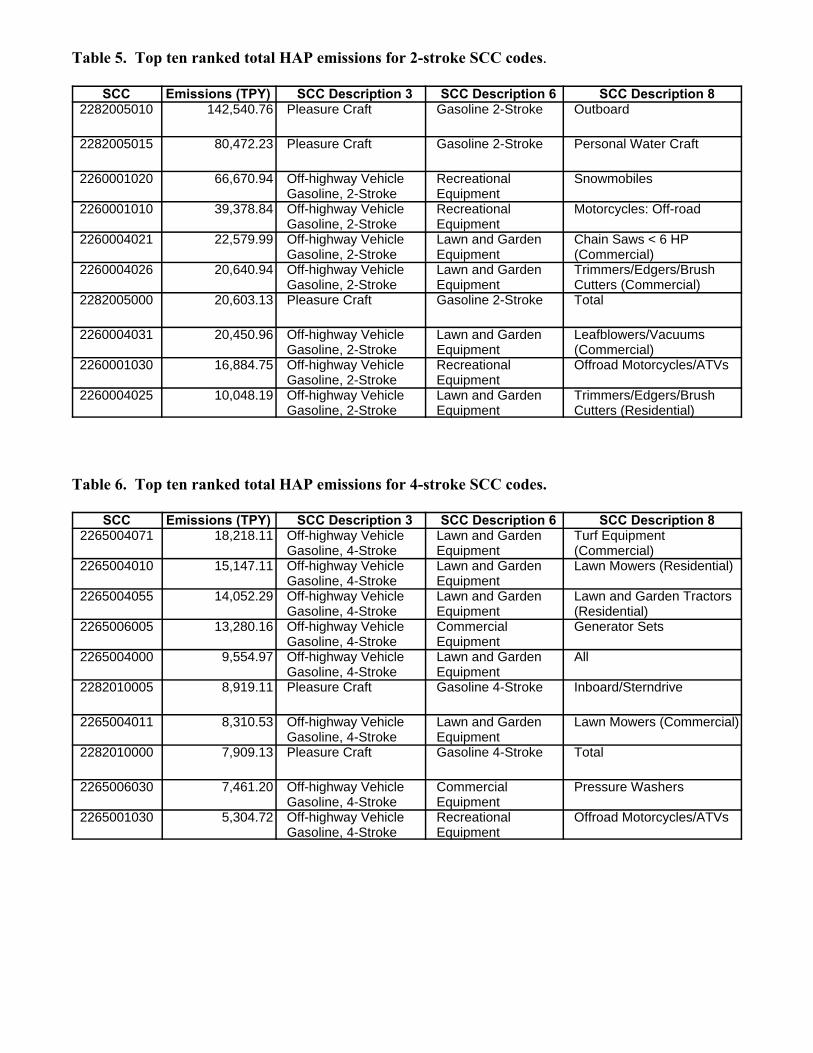
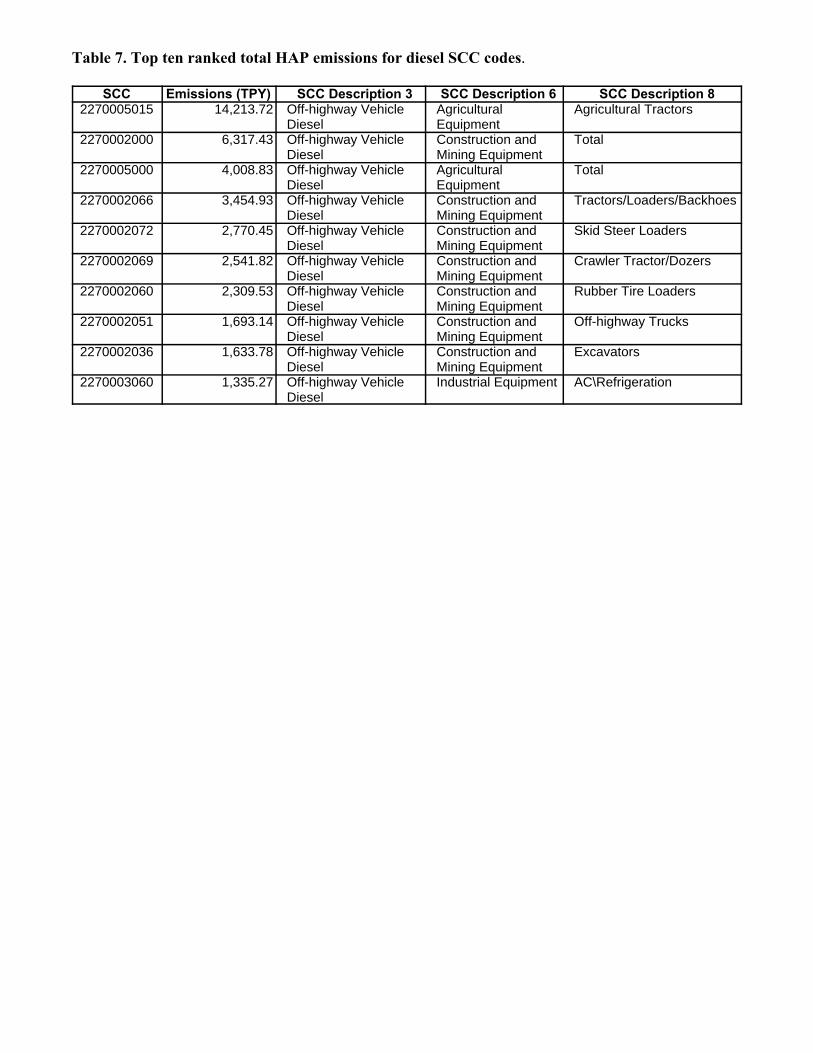
Emissions are also ranked according to the three different engine types: 2-stroke, 4-stroke, anddiesel. For 2-stroke ranking the top ten source categories consist of recreational vessels and equipmentand lawn and garden equipment. The largest contributor, 2-stroke outboard pleasure crafts, emitted142,540.76 tons (see Table 5). The top ten ranked emissions for 4-stroke SCC codes are somewhatdifferent, including a lot of lawn and garden equipment and some pleasure crafts. The top 4-strokecontributor, commercial lawn and garden equipment, emitted 18,218.11 tons, a magnitude smaller thanthe top 2-stroke contributors (see Table 6). Finally, the top ten ranked emissions for diesel SCC codesconsists of industrial equipment, agricultural equipment, and a large number of construction and miningequipment. The top contributor, agricultural tractors, emitted 14,213.72 tons, again a magnitude smallerthan the top 2-stroke contributor (see Table 7).
CONCLUSIONS
The major sources of nonroad emissions are from 2-stroke equipment, accounting for most of theHAP emissions. Specifically, recreational vessels and equipment and lawn and garden equipmentaccount for over 80 percent of HAP emissions. Urban emissions are consistently higher than the ruralemissions, which is not surprising. This is most apparent for counties in the Southeast, Southwest andNortheast. When pollutant emissions are ranked, metals and PAHs are on the lower side compared tothe other organic HAPs.
Improvements can still be made to the other nonroad emission estimates, particularly inincorporating into the emission estimating methods new, more representative emission factors andspeciation profiles. The inclusion of more state and local agency data into the NEI’s other nonroadcomponent should also lead to more accurate emission estimates. In addition, resources can be betterfocused on specific counties or states that have higher emissions for better accuracy. More attentiontoward developing improved emission estimation methodology for the higher emitted pollutants seemswarranted.
REFERENCES
1. U.S. EPA/Emission Factor and Inventory Group, Documentation for Aircraft, Commercial MarineVessel, Locomotive, and Other Nonroad Components of the National Emission Inventory: Volume I -Methodology. Research Triangle Park, NC, November 11, 2002.
TABLES
Table 1. Top ten state ranked total HAP emissions.