75
Canadian Environmental Sustainability Indicators Air pollutant emissions

Canadian Environmental Sustainability Indicators
Air pollutant emissions

Air pollutant emissions Page 2 of 75
Suggested citation for this document: Environment and Climate Change Canada (2019) Canadian Environmental Sustainability Indicators: Air pollutant emissions. Consulted on Month day, year. Available at: www.canada.ca/en/environment-climate-change/services/environmental-indicators/air-pollutant-emissions.html.
Cat. No.: En4-144/22-2019E-PDF ISBN: 978-0-660-30805-0
Unless otherwise specified, you may not reproduce materials in this publication, in whole or in part, for the purposes of commercial redistribution without prior written permission from Environment and Climate Change Canada's copyright administrator. To obtain permission to reproduce Government of Canada materials for commercial purposes, apply for Crown Copyright Clearance by contacting:
Environment and Climate Change Canada Public Inquiries Centre 12th floor, Fontaine Building 200 Sacré-Coeur boul. Gatineau, QC K1A 0H3 Telephone: 1-800-668-6767 (in Canada only) or 819-938-3860 Fax: 819-938-3318 Email: [email protected]
Photos: © Thinkstockphotos.ca; © Environment and Climate Change Canada
© Her Majesty the Queen in Right of Canada, represented by the Minister of Environment and Climate Change, 2019
Aussi disponible en français
Canadian Environmental Sustainability Indicators Page 3 of 75
Canadian Environmental Sustainability Indicators
Air pollutant emissions
June 2019
Table of Contents
Air pollutant emissions ........................................................................................................................ 7
Summary ............................................................................................................................................ 7
Key results ...................................................................................................................................... 7
Sulphur oxide emissions by source .................................................................................................. 10
Key results .................................................................................................................................... 10
Sulphur oxide emissions by province and territory ........................................................................... 11
Key results .................................................................................................................................... 11
Sulphur oxide emissions by facilities ................................................................................................ 12
Nitrogen oxide emissions by source ................................................................................................. 13
Key results .................................................................................................................................... 13
Nitrogen oxide emissions by province and territory ......................................................................... 14
Key results .................................................................................................................................... 14
Nitrogen oxide emissions by facilities ............................................................................................... 15
Volatile organic compound emissions by source ............................................................................. 16
Key results .................................................................................................................................... 16
Volatile organic compound emissions by province and territory ...................................................... 17
Key results .................................................................................................................................... 17
Volatile organic compound emissions by facilities ........................................................................... 18
Ammonia emissions by source ......................................................................................................... 19
Key results .................................................................................................................................... 19
Ammonia emissions by province and territory .................................................................................. 20
Key results .................................................................................................................................... 20
Ammonia emissions by facilities ....................................................................................................... 21

Air pollutant emissions Page 4 of 75
Carbon monoxide emissions by source ........................................................................................... 22
Key results .................................................................................................................................... 22
Carbon monoxide emissions by province and territory .................................................................... 23
Key results .................................................................................................................................... 23
Carbon monoxide emissions by facilities ......................................................................................... 24
Fine particulate matter emissions by source .................................................................................... 25
Key results .................................................................................................................................... 25
Fine particulate matter emissions by province and territory ............................................................. 27
Key results .................................................................................................................................... 27
Fine particulate matter emissions by facilities .................................................................................. 28
Black carbon emissions by source ................................................................................................... 29
Key results .................................................................................................................................... 29
Air pollutant emissions from transportation, off-road vehicles and mobile equipment ..................... 31
Key results .................................................................................................................................... 31
Changes in emissions from transportation, off-road vehicles and mobile equipment ...................... 32
Key results .................................................................................................................................... 32
Air pollutant emissions from the electric utilities ............................................................................... 34
Changes in emissions from the electric utilities................................................................................ 35
Key results .................................................................................................................................... 35
Air pollutant emissions from the oil and gas industry ....................................................................... 36
Key results .................................................................................................................................... 36
Changes in emissions from the oil and gas industry ........................................................................ 37
Key results .................................................................................................................................... 37
About the indicators .......................................................................................................................... 38
What the indicators measure ........................................................................................................ 38
Why these indicators are important .............................................................................................. 38
Related indicators ......................................................................................................................... 39
Data sources and methods............................................................................................................... 39
Data sources ................................................................................................................................ 39
Methods ........................................................................................................................................ 41
Recent changes ............................................................................................................................ 48
Caveats and limitations ................................................................................................................ 49
Resources......................................................................................................................................... 50
References ................................................................................................................................... 50
Related information ...................................................................................................................... 50
Annex ................................................................................................................................................... 51
Annex A. Data tables for the figures presented in this document .................................................... 51
Canadian Environmental Sustainability Indicators Page 5 of 75
List of Figures
Figure 1. Air pollutant emissions, Canada, 1990 to 2017 ................................................................. 7
Figure 2. Distribution of air pollutant emissions by source, Canada, 2017 ....................................... 8
Figure 3. Distribution of air pollutant emissions by province and territory, Canada, 2017 ................ 9
Figure 4. Total sulphur oxide emissions by source, Canada, 1990 to 2017 ................................... 10
Figure 5. Sulphur oxide emissions by province and territory, Canada, 1990 and 2017 ................. 11
Figure 6. Sulphur oxide emissions by reporting facilities, Canada, 2017 ....................................... 12
Figure 7. Total nitrogen oxide emissions by source, Canada, 1990 to 2017 .................................. 13
Figure 8. Nitrogen oxide emissions by province and territory, Canada, 1990 and 2017 ................ 14
Figure 9. Nitrogen oxide emissions by reporting facilities, Canada, 2017 ...................................... 15
Figure 10. Total volatile organic compound emissions by source, Canada, 1990 to 2017 ............. 16
Figure 11. Volatile organic compound emissions by province and territory, Canada, 1990 and 2017 ......................................................................................................................................................... 17
Figure 12. Volatile organic compound emissions by reporting facilities, Canada, 2017 ................. 18
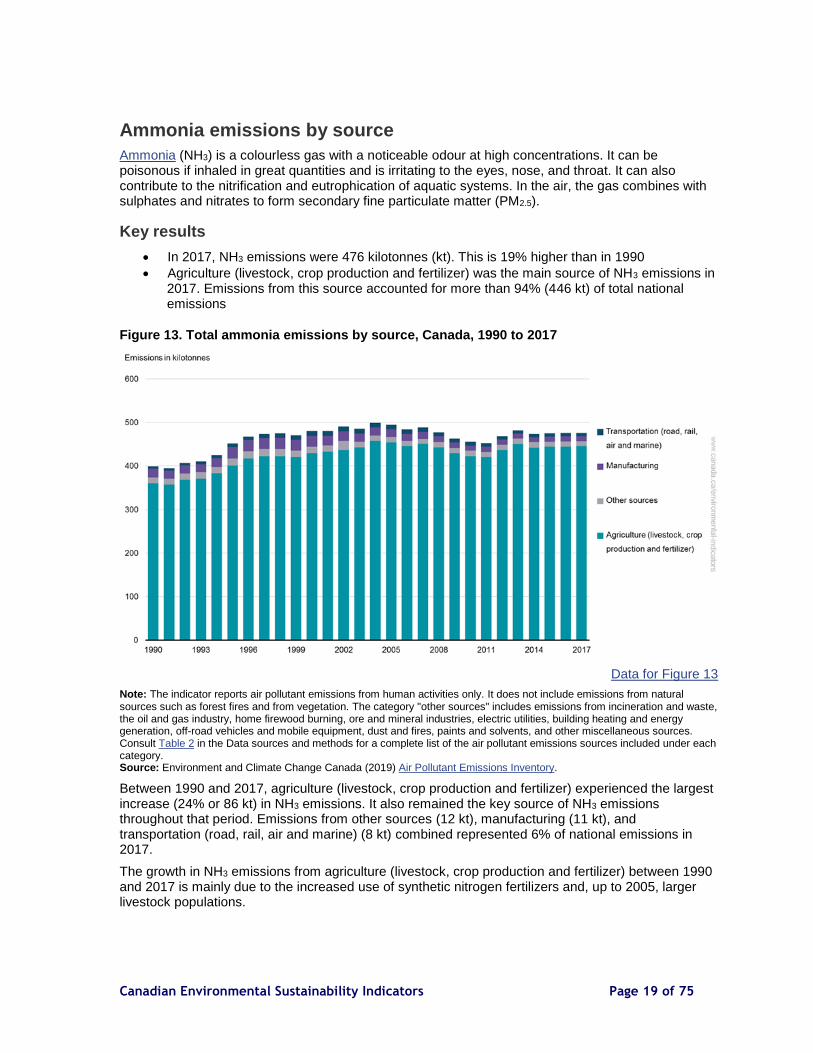
Figure 13. Total ammonia emissions by source, Canada, 1990 to 2017 ........................................ 19
Figure 14. Ammonia emissions by province and territory, Canada, 1990 and 2017 ...................... 20
Figure 15. Ammonia emissions by reporting facilities, Canada, 2017 ............................................ 21
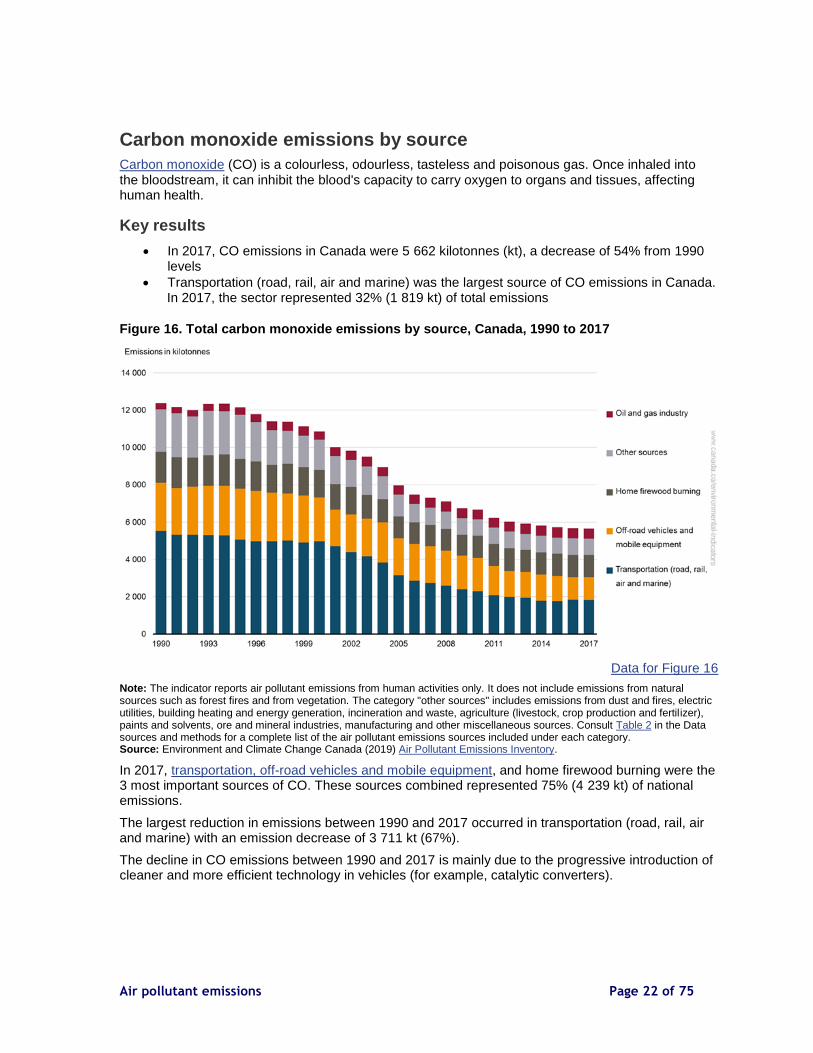
Figure 16. Total carbon monoxide emissions by source, Canada, 1990 to 2017 ........................... 22
Figure 17. Carbon monoxide emissions by province and territory, Canada, 1990 and 2017 ......... 23
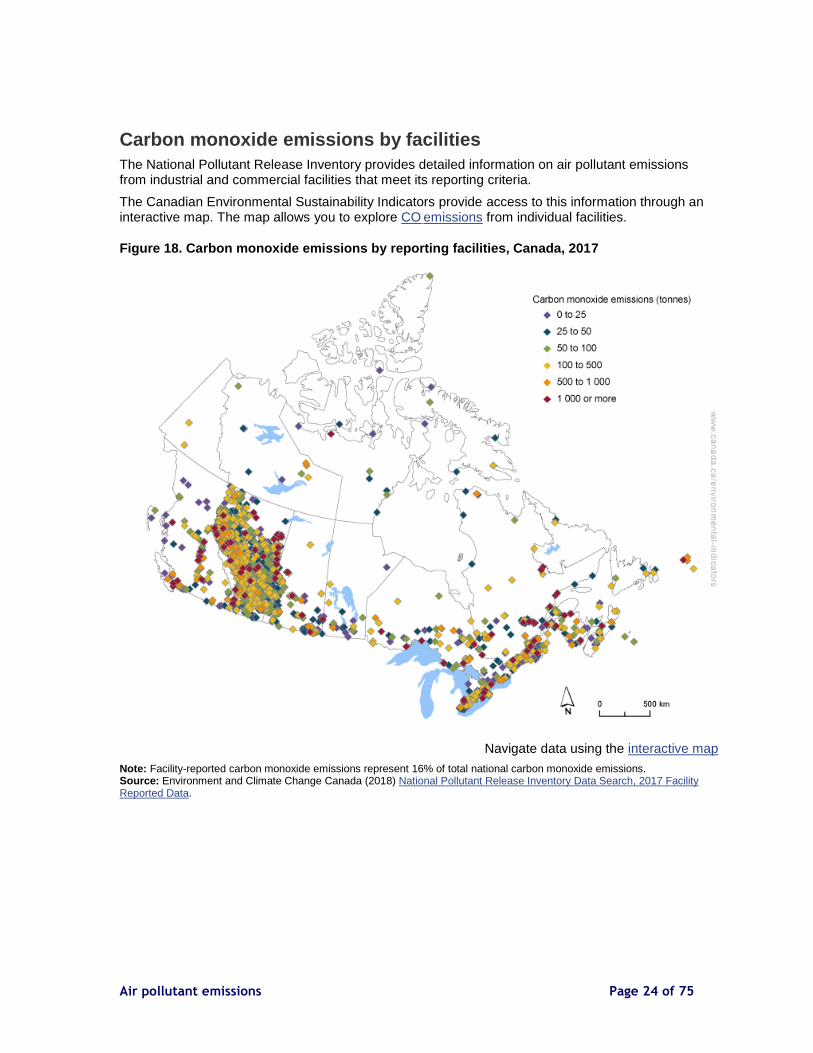
Figure 18. Carbon monoxide emissions by reporting facilities, Canada, 2017 ............................... 24
Figure 19. Total fine particulate matter emissions by source, Canada, 1990 to 2017 .................... 25
Figure 20. Fine particulate matter emissions by province and territory, Canada, 1990 and 2017 .. 27
Figure 21. Fine particulate matter by reporting facilities, Canada, 2017 ......................................... 28
Figure 22. Total black carbon emissions by source, Canada, 2017 ............................................... 29
Figure 23. Contribution of transportation, off-road vehicles and mobile equipment to total air pollutant emissions by transportation mode, Canada, 2017 ........................................................... 31
Figure 24. Changes in emissions of key air pollutants from transportation, off-road vehicles and mobile equipment, Canada, 1990 to 2017 ...................................................................................... 32
Figure 25. Contribution of electric utilities to total air pollutant emissions by fuel source, Canada, 2017 ................................................................................................................................................. 34
Figure 26. Changes in emissions of key air pollutants from electric utilities, Canada, 1990 to 2017 ......................................................................................................................................................... 35
Figure 27. Contribution of the oil and gas industry to total air pollutant emissions by activity type, Canada, 2017 .................................................................................................................................. 36
Figure 28. Changes in emissions of key air pollutants from the oil and gas industry, Canada, 1990 to 2017 ............................................................................................................................................. 37
List of Tables
Table 1. Source emissions changes between 1990 and 2017........................................................ 26
Table 2. Alignment of sources reported in the indicators with the sources and sectors from the Air Pollutant Emissions Inventory/Black Carbon Emissions Inventory ................................................. 44
Table 3. Alignment of sources reported in the transportation, off-road vehicles and mobile equipment indicator of Air pollutant emissions with the sources and sectors from the Air Pollutant Emissions Inventory/Black Carbon Emissions Inventory ................................................................ 47
Air pollutant emissions Page 6 of 75
Table 4. Alignment of sources reported in the electric utilities indicator of Air pollutant emissions with the sources and sectors from the Air Pollutant Emissions Inventory/Black Carbon Emissions Inventory .......................................................................................................................................... 48
Table 5. Alignment of sources reported in the oil and gas industry indicator of Air pollutant emissions with the sources and sectors from the Air Pollutant Emissions Inventory/Black Carbon Emissions Inventory ........................................................................................................................ 48
Table A.1. Data for Figure 1. Air pollutant emissions, Canada, 1990 to 2017 ................................ 51
Table A.2. Data for Figure 2. Distribution of air pollutant emissions by source, Canada, 2017 ...... 52
Table A.3. Data for Figure 3. Distribution of air pollutant emissions by province and territory, Canada, 2017 .................................................................................................................................. 53
Table A.4. Data for Figure 4. Total sulphur oxide emissions by source, Canada, 1990 to 2017 .... 54
Table A.5. Data for Figure 5. Sulphur oxide emissions by province and territory, Canada, 1990 and 2017 ................................................................................................................................................. 55
Table A.6. Data for Figure 7. Total nitrogen oxide emissions by source, Canada, 1990 to 2017 ... 55
Table A.7. Data for Figure 8. Nitrogen oxide emissions by province and territory, Canada, 1990 and 2017 .......................................................................................................................................... 57
Table A.8. Data for Figure 10. Total volatile organic compound emissions by source, Canada, 1990 to 2017 .................................................................................................................................... 57
Table A.9. Data for Figure 11. Volatile organic compound emissions by province and territory, Canada, 1990 and 2017 .................................................................................................................. 58
Table A.10. Data for Figure 13. Total ammonia emissions by source, Canada, 1990 to 2017 ...... 59
Table A.11. Data for Figure 14. Ammonia emissions by province and territory, Canada, 1990 and 2017 ................................................................................................................................................. 60
Table A.12. Data for Figure 16. Total carbon monoxide emissions by source, Canada, 1990 to 2017 ................................................................................................................................................. 60
Table A.13. Data for Figure 17. Carbon monoxide emissions by province and territory, Canada, 1990 and 2017 ................................................................................................................................. 61
Table A.14. Data for Figure 19. Total fine particulate matter emissions by source, Canada, 1990 to 2017 ................................................................................................................................................. 62
Table A.15. Data for Figure 20. Fine particulate matter emissions by province and territory, Canada, 1990 and 2017 .................................................................................................................. 65
Table A.16. Data for Figure 22. Total black carbon emissions by source, Canada, 2017 .............. 65
Table A.17. Data for Figure 23. Contribution of transportation, off-road vehicles and mobile equipment to total air pollutant emissions by transportation mode, Canada, 2017 ........................ 66
Table A.18. Data for Figure 24. Changes in emissions of key air pollutants from transportation, off-road vehicles and mobile equipment, Canada, 1990 to 2017 ......................................................... 67
Table A.19. Data for Figure 25. Contribution of electric utilities to total air pollutant emissions by fuel source, Canada, 2017 .............................................................................................................. 69
Table A.20. Data for Figure 26. Changes in emissions of key air pollutants from electric utilities, Canada, 1990 to 2017 ..................................................................................................................... 70
Table A.21. Data for Figure 27. Contribution of the oil and gas industry to total air pollutant emissions by activity type, Canada, 2017 ....................................................................................... 72
Table A.22. Data for Figure 28. Changes in emissions of key air pollutants from the oil and gas industry, Canada, 1990 to 2017 ...................................................................................................... 73

Canadian Environmental Sustainability Indicators Page 7 of 75
Air pollutant emissions
Air pollution problems, such as smog and acid rain, result from the release of pollutants into the atmosphere. The majority of these pollutants are released through human activities, such as transportation, the burning of fuels for electricity and heating, and a variety of industrial activities. The indicators on sulphur oxides (SOX), nitrogen oxides (NOX), volatile organic compounds (VOCs), carbon monoxide (CO), ammonia (NH3) and fine particulate matter (PM2.5) report emissions released through human activities.
Summary
Key results
In 2017, emissions of 5 key air pollutants SOX, NOX, VOCs, CO and PM2.5 ranged from 69% to 15% lower than in 1990
Emissions of NH3 were 19% higher than in 1990
Figure 1. Air pollutant emissions, Canada, 1990 to 2017
Data for Figure 1
Note: This indicator reports air pollutant emissions from human activities only. It does not include emissions from natural sources such as forest fires and from vegetation. Source: Environment and Climate Change Canada (2019) Air Pollutant Emissions Inventory.
Between 1990 and 2017, the largest emission reductions were observed for SOX, which decreased by 69%. It was followed by CO emissions (54% reduction), VOCs (40%), NOX (26%) and PM2.5 (15%). These reductions since 1990 are due in part to government actions and voluntary initiatives from key industrial emitters that were put in place to restrict or eliminate the release of air pollutants in Canada.

Air pollutant emissions Page 8 of 75
In 2017, the majority of emissions of the 6 key air pollutants in Canada came from ore and mineral industries, transportation, the oil and gas industry, agriculture, and dust and fires (for example, road dust, prescribed burning).
Figure 2. Distribution of air pollutant emissions by source, Canada, 2017
Data for Figure 2
Note: The indicator reports air pollutant emissions from human activities only. It does not include emissions from natural sources such as forest fires and from vegetation. Source: Environment and Climate Change Canada (2019) Air Pollutant Emissions Inventory.
The human made sources most contributing to Canada's air pollutant emissions in 2017 were the following:
the ore and mineral industries, electric utilities and the oil and gas industries together represented the majority of SOX emissions
transportation (road, rail, air and marine) was the main source of NOX and CO emissions
off-road vehicles and mobile equipment and home firewood burning were also important sources of CO emissions and the oil and gas industry was an important source of NOX emissions
most of the VOC emissions came from the oil and gas industry and from the use of paints and solvents
agriculture (livestock, crop production and fertilizer) accounted for the majority of NH3 emissions
dust and fires were the most important sources of PM2.5 emissions

Canadian Environmental Sustainability Indicators Page 9 of 75
At the provincial level, emissions of the 6 key air pollutants in 2017 were:
the highest in Alberta for SOX, (25% of national emissions), NOX (36%), VOCs (31%), NH3 (27%) and PM2.5 (35%)
the highest in Quebec for CO (28%)
the second highest in Ontario for SOX (19% of national emissions), NOX (17%), VOCs (20%) and CO (25%)
also important in Saskatchewan for NH3 and PM2.5, accounting for 22% and 21% of the national emissions of these pollutants
Figure 3. Distribution of air pollutant emissions by province and territory, Canada, 2017
Data for Figure 3
Note: The indicator reports air pollutant emissions from human activities only. It does not include emissions from natural sources such as forest fires and from vegetation. Source: Environment and Climate Change Canada (2019) Air Pollutant Emissions Inventory.

Air pollutant emissions Page 10 of 75
Sulphur oxide emissions by source
Emissions of sulphur oxides (SOX) in the atmosphere can have adverse effects on human health and the environment. The SOX emissions released by human activities consist mostly of sulphur dioxides (SO2). Sulphur dioxide can affect respiratory systems of humans and animals and cause damage to vegetation, buildings and materials. It is also a precursor to fine particulate matter (PM2.5) and acid rain.
Key results
Between 1990 and 2017, SOX emissions decreased by 69% to 954 kilotonnes (kt) in 2017
In 2017, the largest proportion of SOX emissions came from ore and mineral industries. The source represented 40% (377 kt) of total emissions
Figure 4. Total sulphur oxide emissions by source, Canada, 1990 to 2017
Data for Figure 4
Note: The indicator reports air pollutant emissions from human activities only. It does not include emissions from natural sources such as forest fires and from vegetation. The category "other sources" includes emissions from transportation (road, rail, air and marine), off-road vehicles and mobile equipment, home firewood burning, incineration and waste, agriculture (livestock, crop production and fertilizer), dust and fires, paints and solvents, building heating and energy generation, manufacturing, and other miscellaneous sources. Consult Table 2 in the Data sources and methods for a complete list of the air pollutant emissions sources included under each category. Source: Environment and Climate Change Canada (2019) Air Pollutant Emissions Inventory.
In 2017, the non-ferrous smelting and refining industry accounted for 71% (266 kt) of SOX emissions from the ore and mineral industries, the main contributor to total national emissions. Emissions from the oil and gas industry and electric utilities followed with 27% (256 kt) and 26% (246 kt) of total national emissions, respectively.
The largest reduction in emissions between 1990 and 2017 was from ore and mineral industries. The largest driver of the reduction from the source was from the non-ferrous smelting and refining industry with a reduction in emissions of 1 006 kt.

Canadian Environmental Sustainability Indicators Page 11 of 75
This significant decrease in SOX emissions from 1990 to 2017 is due in large part to government actions to fight acid rain and related federal-provincial and United States agreements1,2 on capping SOX emissions by 1994. Further reductions were also realized through:
technological upgrades, new air pollution controls for non-ferrous metal smelters and the closure of 3 major smelters in Manitoba, Ontario and Quebec
lower emissions from fossil-fuel-fired (for example, coal-fired) power-generating utilities as a result of better technologies and plant closures (for example, the phase-out of coal electricity generation in Ontario)
implementation of regulations on low-sulphur fuels3,4
Sulphur oxide emissions by province and territory
Key results
In 2017, Ontario and Alberta accounted for 44% (420 kt) of national SOX emissions
Between 1990 and 2017, o the largest reduction was observed in Ontario. Emissions in the province decreased
by 950 kt (84%) o Saskatchewan was the only province that experienced an increase in SOX (24%, or
23 kt)
Figure 5. Sulphur oxide emissions by province and territory, Canada, 1990 and 2017
Data for Figure 5
Note: The indicator reports air pollutant emissions from human activities only. It does not include emissions from natural sources such as forest fires and from vegetation. Source: Environment and Climate Change Canada (2019) Air Pollutant Emissions Inventory.
1 Environment and Climate Change Canada (1991) Canada-United States Air Quality Agreement. Retrieved on January 25, 2019. 2 Canadian Council of Ministers of the Environment (1998) The Canada-Wide Acid Rain Strategy for Post-2000. Retrieved on January 25, 2019. 3 Environment and Climate Change Canada (2015) Sulphur in Gasoline Regulations. Retrieved on January 25, 2019. 4 Environment and Climate Change Canada (2012) Sulphur in Diesel Fuel Regulations. Retrieved on January 25, 2019.
Air pollutant emissions Page 12 of 75
Alberta had the highest SOX emissions level in 2017, accounting for 25% (240 kt) of total national emissions. Emissions in the province mainly came from the oil and gas industry and electric utilities, combined accounting for 94% (226 kt) of the emissions.
Ontario was the second-highest emitter of SOX in 2017, accounting for 19% (180 kt) of total national emissions. Ore and mineral industries were the largest contributor to SOX emissions of the province in 2017. The sharp reduction in SOX emissions in Ontario between 1990 and 2017 was mainly due to emission reductions from ore and mineral industries (notably the non-ferrous smelting and refining industry) and electric utilities.
Saskatchewan and Manitoba both ranked third, with 13% (120 kt and 119 kt) of total national emissions; electric utilities was the most important source of emissions in Saskatchewan and ore and mineral industries in Manitoba.
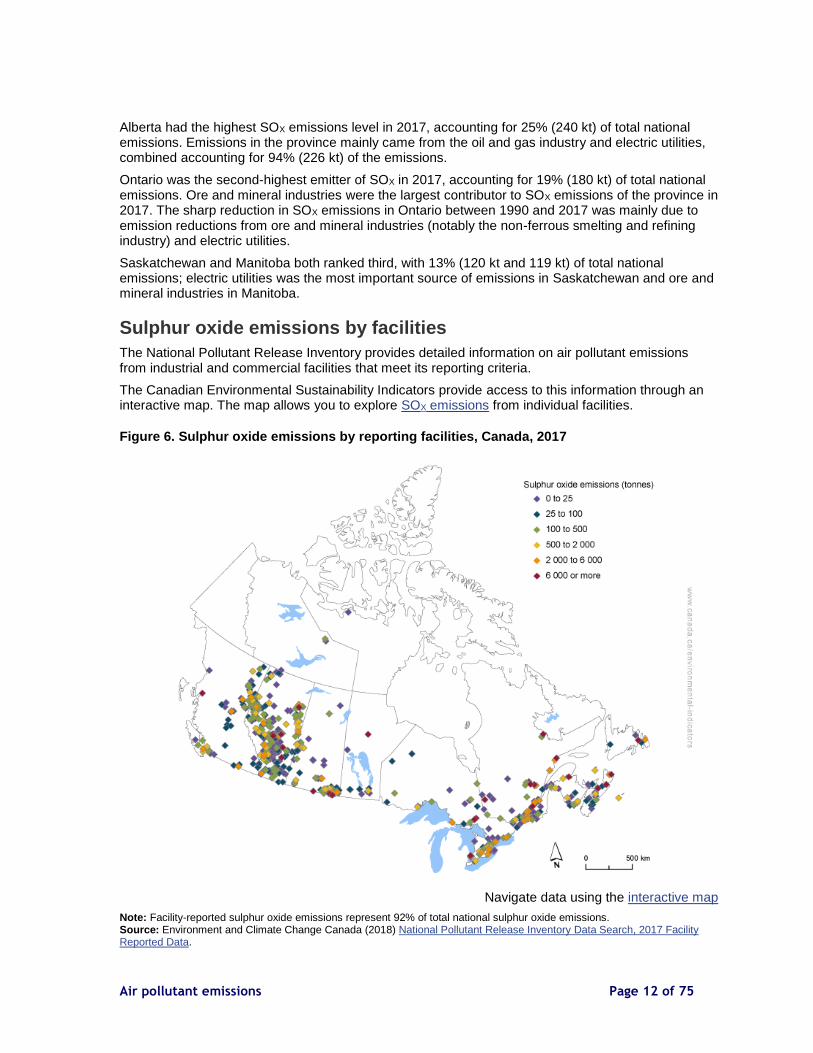
Sulphur oxide emissions by facilities
The National Pollutant Release Inventory provides detailed information on air pollutant emissions from industrial and commercial facilities that meet its reporting criteria.
The Canadian Environmental Sustainability Indicators provide access to this information through an interactive map. The map allows you to explore SOX emissions from individual facilities.
Figure 6. Sulphur oxide emissions by reporting facilities, Canada, 2017
Navigate data using the interactive map
Note: Facility-reported sulphur oxide emissions represent 92% of total national sulphur oxide emissions. Source: Environment and Climate Change Canada (2018) National Pollutant Release Inventory Data Search, 2017 Facility Reported Data.

Canadian Environmental Sustainability Indicators Page 13 of 75
Nitrogen oxide emissions by source
Nitrogen oxides (NOX) include emissions of nitric oxide (NO) and nitrogen dioxide (NO2). Nitrogen dioxide can have adverse effects on human health and the environment. Nitrogen oxides contribute to acid rain, which can lead to the acidification of aquatic and terrestrial ecosystems. It also contributes to the eutrophication of lakes and to the formation of ground-level ozone (O3) and fine particulate matter (PM2.5).
Key results
In 2017, NOX emissions were 1 783 kilotonnes (kt). This is 26% lower than in 1990
Transportation (road, rail, air and marine) was a major source of NOX representing 42% (754 kt) of total emissions in 2017
Figure 7. Total nitrogen oxide emissions by source, Canada, 1990 to 2017
Data for Figure 7
Note: The indicator reports air pollutant emissions from human activities only. It does not include emissions from natural sources such as forest fires and from vegetation. The category "other sources" includes emissions from ore and mineral industries, manufacturing, building heating and energy generation, home firewood burning, incineration and waste, agriculture (livestock, crop production and fertilizer), dust and fires, paints and solvents, and other miscellaneous sources. Consult Table 2 in the Data sources and methods for a complete list of the air pollutant emissions sources included under each category. Source: Environment and Climate Change Canada (2019) Air Pollutant Emissions Inventory.
While transportation (road, rail, air and marine) was the main contributor of NOX, it was also the sector that experienced the largest reduction between 1990 and 2017. Emissions of NOX from this sector decreased by 274 kt (27%) during that period.
The oil and gas industry emitted the next largest proportions of NOX emissions in 2017, representing 27% (481 kt) of total national emissions. This sector also experienced the largest increase 39% (135 kt) in emissions between 1990 and 2017, partly offsetting reductions from other sectors.

Air pollutant emissions Page 14 of 75
The decline in NOX emissions between 1990 and 2017 is mostly attributable to 2 factors:
the reduction in emissions from transportation after 2000, given the progressive introduction of cleaner technology and fuels for vehicles
lower emissions from fossil-fuel-fired (for example, coal-fired) power-generating utilities as a result of better emissions control technologies and certain plant closures (for example, the closure of coal power plants in Ontario)
Nitrogen oxide emissions by province and territory
Key results
Among provinces and territories, Alberta emitted the most NOX in 2017. The province accounted for 36% (637 kt) of national emissions
Between 1990 and 2017, o the largest reduction was observed in Ontario. Emissions decreased by 319 kt (52%)
in the province o NOX emissions only increased in Nunavut and Northwest Territories (38%, or 6 kt)
Figure 8. Nitrogen oxide emissions by province and territory, Canada, 1990 and 2017
Data for Figure 8
Note: The indicator reports air pollutant emissions from human activities only. It does not include emissions from natural sources such as forest fires and from vegetation. Source: Environment and Climate Change Canada (2019) Air Pollutant Emissions Inventory.
The oil and gas industry is an important source of NOX emissions in Alberta, accounting for 59% (374 kt) of the province's NOX emissions in 2017. The increasing contribution of this sector to the province's emissions between 1990 and 2017 was offset by similar emission reductions from the transport and electric utilities sectors.
Ontario contributed the second-largest proportion of NOX emissions in 2017, accounting for 17% (300 kt) of total national emissions, with transportation (road, rail, air and marine) being the most important source followed by off-road vehicles and mobile equipment. Ontario experienced the largest decrease in emissions levels (319 kt) between 1990 and 2017 in large part due to emission reductions from transportation, electric utilities and off-road vehicles and mobile equipment.

Canadian Environmental Sustainability Indicators Page 15 of 75
British Columbia ranked third, with 17% (295 kt) of total national emissions. Transportation (road, rail, air and marine) was the most important source of NOX in this province.
Nitrogen oxide emissions by facilities
The National Pollutant Release Inventory provides detailed information on air pollutant emissions from industrial and commercial facilities that meet its reporting criteria.
The Canadian Environmental Sustainability Indicators provide access to this information through an interactive map. The map allows you to explore NOX emissions from individual facilities.
Figure 9. Nitrogen oxide emissions by reporting facilities, Canada, 2017
Navigate data using the interactive map
Note: Facility-reported nitrogen oxide emissions represent 33% of total national nitrogen oxide emissions.
Source: Environment and Climate Change Canada (2018) National Pollutant Release Inventory Data Search, 2017 Facility Reported Data.

Air pollutant emissions Page 16 of 75
Volatile organic compound emissions by source
Volatile organic compounds (VOCs) are carbon-containing gases and vapours released into the atmosphere by natural sources and human activities.5 There are hundreds of VOCs that are emitted and that affect the health of Canadians and the environment. VOCs are primary precursors to the formation of ground-level ozone and particulate matter which are the main pollutants contributing to the formation of smog.
Key results
In 2017, VOC emissions in Canada were 1 811 kilotonnes (kt). This is a 1 224 kt (40%) decrease from 1990 levels
Since 2000, the oil and gas industry has been the highest contributor to VOC emissions. In 2017, the sector accounted for 37% (663 kt) of total emissions
Figure 10. Total volatile organic compound emissions by source, Canada, 1990 to 2017
Data for Figure 10
Note: The indicator reports air pollutant emissions from human activities only. It does not include emissions from natural sources such as forest fires and from vegetation. The category "other sources" includes emissions from incineration and waste, ore and mineral industries, dust and fires, building heating and energy generation, electric utilities, agriculture (livestock, crop production and fertilizer) and other miscellaneous sources. Consult Table 2 in the Data sources and methods for a complete list of the air pollutant emissions sources included under each category. Source: Environment and Climate Change Canada (2019) Air Pollutant Emissions Inventory.
The oil and gas industry was the main source of VOC emissions in 2017 with 663 kt emitted (37% of total emissions). Paints and solvents and home firewood burning were also important sources contributing 18% (335 kt) and 13% (230 kt) of total emissions.
The source with the largest emissions reduction between 1990 and 2017 was off-road vehicles and mobile equipment, with emissions reductions of 685 kt (84%). From 1990 to 1999, off-road vehicles and mobile equipment was the highest contributor to national VOC emissions.
5 Under the Canadian Environmental Protection Act, carbon dioxide, carbon monoxide, methane and chlorofluorocarbons are not considered volatile organic compounds.

Canadian Environmental Sustainability Indicators Page 17 of 75
The long-term decrease in VOC emissions is mainly attributable to 3 factors:
the progressive introduction of cleaner technologies and fuels resulting in emission reductions from transportation, off-road vehicles and mobile equipment
emission reductions from most industrial and non-industrial sources from improved emission controls
lower levels of VOCs in products such as paints, solvents and cleaners
The only source with significant emissions growth over the 1990 to 2017 period was the oil and gas industry with an increase of 63 kt (10%).
Volatile organic compound emissions by province and territory
Key results
Alberta emitted the highest proportion of VOCs in 2017. The province represented 31% (566 kt) of national emissions
Between 1990 and 2017, o Ontario experienced the largest reduction in VOC emissions. Emissions in the
province decreased by 60% (545 kt) o Saskatchewan was the only province that experienced an increase in VOC emissions
(52%, or 89 kt)
Figure 11. Volatile organic compound emissions by province and territory, Canada, 1990 and 2017
Data for Figure 11
Note: The indicator reports air pollutant emissions from human activities only. It does not include emissions from natural sources such as forest fires and from vegetation. Source: Environment and Climate Change Canada (2019) Air Pollutant Emissions Inventory.
Alberta was the highest emitting province of VOCs in 2017 (566 kt), with the oil and gas industry as the main source, contributing 72% (410 kt) of the province's emissions.
Ontario was the second-highest emitter of VOCs, accounting for 20% (360 kt) of total national emissions in 2017. The main emission sources are paints and solvents, home firewood burning and off-road vehicles and mobile equipment. Ontario also experienced the largest reduction in emissions,

Air pollutant emissions Page 18 of 75
with 545 kt (60%) between 1990 and 2017, mainly as a result of emission reductions from the closure of coal-fired power plants and from off-road vehicles and mobile equipment.
Quebec was the third largest emitter, with 16% (291 kt) of total national emissions, where home firewood burning and paints and solvents accounted for 62% of the emissions in that province.
Most provinces and territories experienced reductions in emissions of more than 35% between 1990 and 2017 with the exception of Alberta (a 14% reduction in emissions due to an increase in the oil and gas industry) and Saskatchewan, where emissions increased 52% over the period. The oil and gas industry is responsible for the increase in emissions in Saskatchewan.
Volatile organic compound emissions by facilities
The National Pollutant Release Inventory provides detailed information on air pollutant emissions from industrial and commercial facilities that meet its reporting criteria.
The Canadian Environmental Sustainability Indicators provide access to this information through an interactive map. The map allows you to explore VOC emissions from individual facilities.
Figure 12. Volatile organic compound emissions by reporting facilities, Canada, 2017
Navigate data using the interactive map
Note: Facility-reported volatile organic compound emissions represent 11% of total national volatile organic compound emissions. Source: Environment and Climate Change Canada (2018) National Pollutant Release Inventory Data Search, 2017 Facility Reported Data.
Canadian Environmental Sustainability Indicators Page 19 of 75
Ammonia emissions by source
Ammonia (NH3) is a colourless gas with a noticeable odour at high concentrations. It can be poisonous if inhaled in great quantities and is irritating to the eyes, nose, and throat. It can also contribute to the nitrification and eutrophication of aquatic systems. In the air, the gas combines with sulphates and nitrates to form secondary fine particulate matter (PM2.5).
Key results
In 2017, NH3 emissions were 476 kilotonnes (kt). This is 19% higher than in 1990
Agriculture (livestock, crop production and fertilizer) was the main source of NH3 emissions in 2017. Emissions from this source accounted for more than 94% (446 kt) of total national emissions
Figure 13. Total ammonia emissions by source, Canada, 1990 to 2017
Data for Figure 13
Note: The indicator reports air pollutant emissions from human activities only. It does not include emissions from natural sources such as forest fires and from vegetation. The category "other sources" includes emissions from incineration and waste, the oil and gas industry, home firewood burning, ore and mineral industries, electric utilities, building heating and energy generation, off-road vehicles and mobile equipment, dust and fires, paints and solvents, and other miscellaneous sources. Consult Table 2 in the Data sources and methods for a complete list of the air pollutant emissions sources included under each category. Source: Environment and Climate Change Canada (2019) Air Pollutant Emissions Inventory.
Between 1990 and 2017, agriculture (livestock, crop production and fertilizer) experienced the largest increase (24% or 86 kt) in NH3 emissions. It also remained the key source of NH3 emissions throughout that period. Emissions from other sources (12 kt), manufacturing (11 kt), and transportation (road, rail, air and marine) (8 kt) combined represented 6% of national emissions in 2017.
The growth in NH3 emissions from agriculture (livestock, crop production and fertilizer) between 1990 and 2017 is mainly due to the increased use of synthetic nitrogen fertilizers and, up to 2005, larger livestock populations.

Air pollutant emissions Page 20 of 75
Ammonia emissions by province and territory
Key results
In 2017, Alberta and Saskatchewan accounted for almost half (234 kt) of national NH3 emissions
Between 1990 and 2017, o Ontario experienced the largest emissions reduction. Emissions in the province
decreased by 25 kt (22%) o The largest increase in NH3 emissions was in Saskatchewan. Emissions in the
province doubled (a 54 kt increase)
Figure 14. Ammonia emissions by province and territory, Canada, 1990 and 2017
Data for Figure 14
Note: The indicator reports air pollutant emissions from human activities only. It does not include emissions from natural sources such as forest fires and from vegetation. Source: Environment and Climate Change Canada (2019) Air Pollutant Emissions Inventory.
In 2017, Alberta emitted the most NH3 of all the provinces and territories, accounting for 27% (131 kt) of total national emissions. Saskatchewan contributed the second-largest proportion of NH3, representing 22% (103 kt).
Ontario and Quebec followed with 18% and 13% (87 kt and 64 kt) of total national emissions, respectively. For all provinces, livestock farms and the application of fertilizers were the most important sources of NH3 emissions.
Almost all of the increase in emissions between 1990 and 2017 took place in Saskatchewan, Alberta and Manitoba.

Canadian Environmental Sustainability Indicators Page 21 of 75
Ammonia emissions by facilities
The National Pollutant Release Inventory provides detailed information on air pollutant emissions from industrial and commercial facilities that meet its reporting criteria..
The Canadian Environmental Sustainability Indicators provide access to this information through an interactive map. The map allows you to explore NH3 emissions from individual facilities.
Figure 15. Ammonia emissions by reporting facilities, Canada, 2017
Navigate data using the interactive map
Note: Facility-reported ammonia emissions represent 4% of total national ammonia emissions. Source: Environment and Climate Change Canada (2018) National Pollutant Release Inventory Data Search, 2017 Facility Reported Data.
Air pollutant emissions Page 22 of 75
Carbon monoxide emissions by source
Carbon monoxide (CO) is a colourless, odourless, tasteless and poisonous gas. Once inhaled into the bloodstream, it can inhibit the blood's capacity to carry oxygen to organs and tissues, affecting human health.
Key results
In 2017, CO emissions in Canada were 5 662 kilotonnes (kt), a decrease of 54% from 1990 levels
Transportation (road, rail, air and marine) was the largest source of CO emissions in Canada. In 2017, the sector represented 32% (1 819 kt) of total emissions
Figure 16. Total carbon monoxide emissions by source, Canada, 1990 to 2017
Data for Figure 16
Note: The indicator reports air pollutant emissions from human activities only. It does not include emissions from natural sources such as forest fires and from vegetation. The category "other sources" includes emissions from dust and fires, electric utilities, building heating and energy generation, incineration and waste, agriculture (livestock, crop production and fertilizer), paints and solvents, ore and mineral industries, manufacturing and other miscellaneous sources. Consult Table 2 in the Data sources and methods for a complete list of the air pollutant emissions sources included under each category. Source: Environment and Climate Change Canada (2019) Air Pollutant Emissions Inventory.
In 2017, transportation, off-road vehicles and mobile equipment, and home firewood burning were the 3 most important sources of CO. These sources combined represented 75% (4 239 kt) of national emissions.
The largest reduction in emissions between 1990 and 2017 occurred in transportation (road, rail, air and marine) with an emission decrease of 3 711 kt (67%).
The decline in CO emissions between 1990 and 2017 is mainly due to the progressive introduction of cleaner and more efficient technology in vehicles (for example, catalytic converters).

Canadian Environmental Sustainability Indicators Page 23 of 75
Carbon monoxide emissions by province and territory
Key results
In 2017, Ontario and Quebec accounted for 52% (2 952 kt) of national CO emissions
Between 1990 and 2017, o all provinces and territories experienced significant reductions in emissions o the largest reductions occurred in Ontario (by 2 149 kt or 61%), British Columbia (by
1 644 kt or 69%) and Quebec (by 1 111 kt or 42%)
Figure 17. Carbon monoxide emissions by province and territory, Canada, 1990 and 2017
Data for Figure 17
Note: The indicator reports air pollutant emissions from human activities only. It does not include emissions from natural sources such as forest fires and from vegetation. Source: Environment and Climate Change Canada (2019) Air Pollutant Emissions Inventory.
In 2017, Quebec emitted the most CO of all the provinces and territories, representing 28% (1 560 kt) of the total national emissions. Home firewood burning was the most important source of CO emissions for Quebec.
The province of Ontario ranked second, with 25% (1 392 kt) of total national emissions in 2017, with 36% of those emissions from transportation (road, rail, air and marine).
Alberta, the third largest CO emitter, accounted for 18% (1 016 kt) of total national emissions. The oil and gas industry accounted for 42% of the province's CO emissions.
The sharp decrease in emissions between 1990 and 2017 in all provinces is mainly attributable to emission reductions from transportation (road, rail, air and marine).
Air pollutant emissions Page 24 of 75
Carbon monoxide emissions by facilities
The National Pollutant Release Inventory provides detailed information on air pollutant emissions from industrial and commercial facilities that meet its reporting criteria.
The Canadian Environmental Sustainability Indicators provide access to this information through an interactive map. The map allows you to explore CO emissions from individual facilities.
Figure 18. Carbon monoxide emissions by reporting facilities, Canada, 2017
Navigate data using the interactive map
Note: Facility-reported carbon monoxide emissions represent 16% of total national carbon monoxide emissions. Source: Environment and Climate Change Canada (2018) National Pollutant Release Inventory Data Search, 2017 Facility Reported Data.

Canadian Environmental Sustainability Indicators Page 25 of 75
Fine particulate matter emissions by source
Particulate matter (PM) is directly emitted into the air in solid or liquid form. It is also formed in the air from precursor substances such as sulphur oxides, nitrogen oxides, volatile organic compounds and ammonia.6 Fine particulate matter (PM2.5) refers to particulate matter with a size of less than 2.5 micrometres (also called microns). It is one of the major components of smog. When inhaled deeply into the lungs, even small amounts of PM2.5 can cause serious health problems. It can also damage vegetation and structures, contribute to haze and reduce visibility.
Key results
In 2017, PM2.5 emissions were 1 674 kilotonnes (kt). This is 15% lower than in 1990
Emissions from dust and fires (for example, road dust and prescribed burning) accounted for the majority of PM2.5 emissions, reaching 60% (1 007 kt) of total national emissions in 2017. These emissions increased by almost 50% (333 kt) between 1990 and 2017
Figure 19. Total fine particulate matter emissions by source, Canada, 1990 to 2017
Data for Figure 19
Note: The indicator reports air pollutant emissions from human activities only. It does not include emissions from natural sources such as forest fires and from vegetation. The category "other sources" includes emissions from ore and mineral industries, transportation (road, rail, air and marine), manufacturing, off-road vehicles and mobile equipment, the oil and gas industry, building heating and energy generation, electric utilities, incineration and wastes, paints and solvents, and other miscellaneous sources. Consult Table 2 in the Data sources and methods for a complete list of the air pollutant emissions sources included under each category. Source: Environment and Climate Change Canada (2019) Air Pollutant Emissions Inventory.
In 2017, 83% of PM2.5 emissions came from open source emissions, such as dust and fires, and agriculture (livestock, crop production and fertilizer). In general, these emissions are spread over large geographical areas, are highly dependent on weather conditions (for example, wind and rain) and are located outside of urban areas.
6 Emissions of PM formed in the air from precursor substances are not included in the indicator.
Air pollutant emissions Page 26 of 75
The remaining 17% of PM2.5 emissions in 2017 came from home firewood burning (162 kt or 10%) and other sources, including:
ore and mineral industries, representing 2% (35 kt) of the emissions
transportation (road, rail, air and marine), representing 1% (20 kt)
manufacturing (16 kt) and off-road vehicles and mobile equipment (14 kt), each representing about 1% of emissions
miscellaneous sources, such as emissions from cigarette smoking, representing 1% (16 kt)
the oil and gas industry, representing less than 1% (13 kt)
other emissions (less than 1%) coming from building heating and energy generation, electric utilities, incineration and wastes, and the use of paints and solvents
Many of the sources above, despite representing a small proportion of national emissions, can have a disproportionate impact on the population because they are generally concentrated in populated areas.
The decreases in PM2.5 emissions between 1990 and 2017 are mainly attributable to emission reductions from agriculture (livestock, crop production and fertilizer) and home firewood burning. These reductions outweigh the increase in emissions from dust and fires over the period. The adoption of conservation practices in crop production and the use of new fireplace inserts, furnaces and stoves in homes that control emissions and burn more efficiently were the main drivers leading to the reductions.
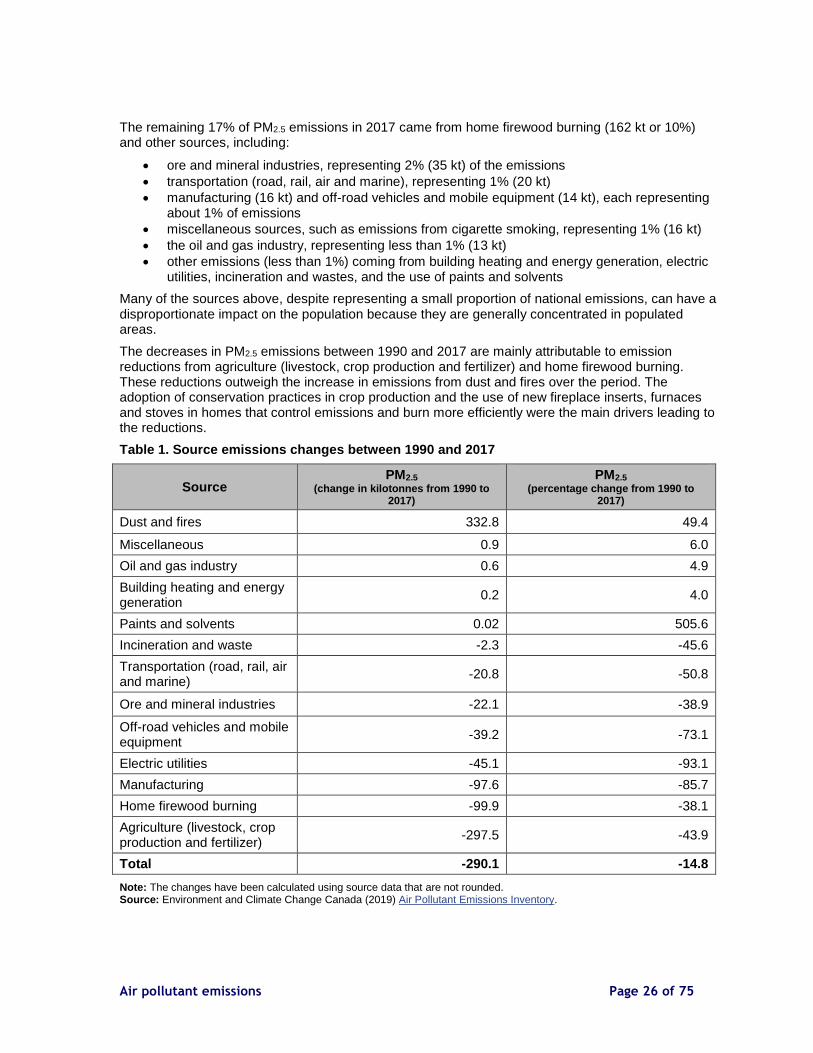
Table 1. Source emissions changes between 1990 and 2017
Source PM2.5
(change in kilotonnes from 1990 to 2017)
PM2.5
(percentage change from 1990 to 2017)
Dust and fires 332.8 49.4
Miscellaneous 0.9 6.0
Oil and gas industry 0.6 4.9
Building heating and energy generation
0.2 4.0
Paints and solvents 0.02 505.6
Incineration and waste -2.3 -45.6
Transportation (road, rail, air and marine)
-20.8 -50.8
Ore and mineral industries -22.1 -38.9
Off-road vehicles and mobile equipment
-39.2 -73.1
Electric utilities -45.1 -93.1
Manufacturing -97.6 -85.7
Home firewood burning -99.9 -38.1
Agriculture (livestock, crop production and fertilizer)
-297.5 -43.9
Total -290.1 -14.8
Note: The changes have been calculated using source data that are not rounded. Source: Environment and Climate Change Canada (2019) Air Pollutant Emissions Inventory.
Canadian Environmental Sustainability Indicators Page 27 of 75
Fine particulate matter emissions by province and territory
Key results
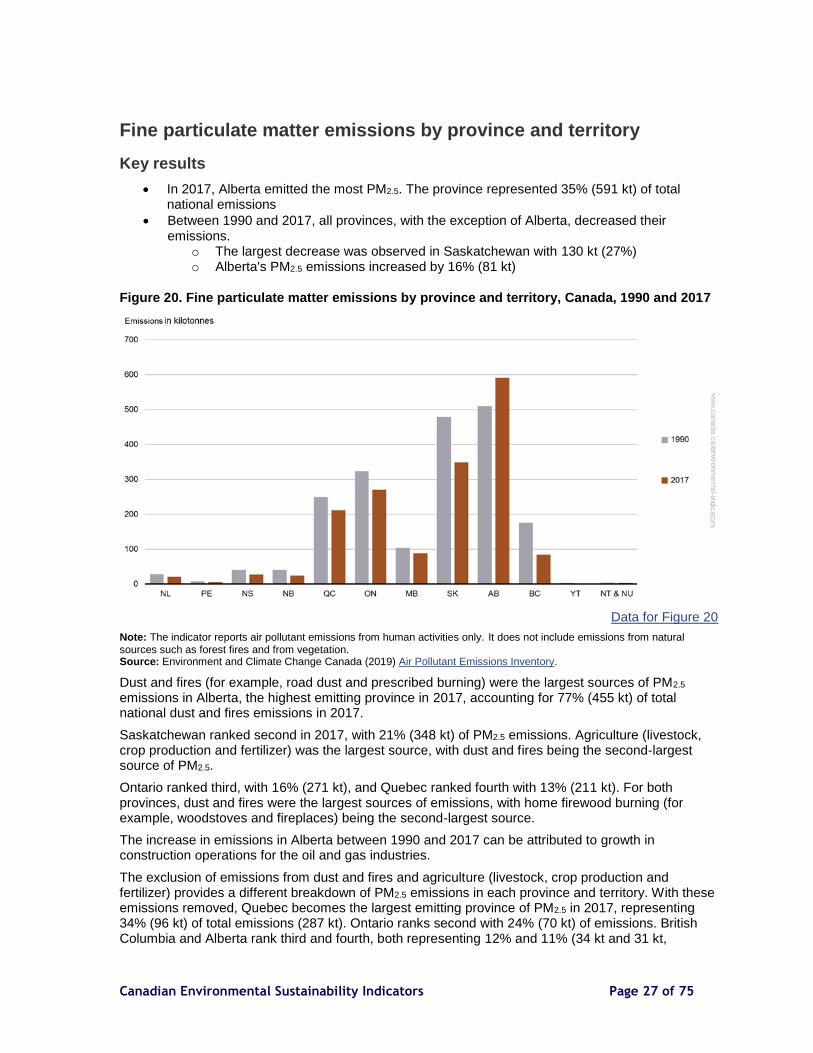
In 2017, Alberta emitted the most PM2.5. The province represented 35% (591 kt) of total national emissions
Between 1990 and 2017, all provinces, with the exception of Alberta, decreased their emissions.
o The largest decrease was observed in Saskatchewan with 130 kt (27%) o Alberta's PM2.5 emissions increased by 16% (81 kt)
Figure 20. Fine particulate matter emissions by province and territory, Canada, 1990 and 2017
Data for Figure 20
Note: The indicator reports air pollutant emissions from human activities only. It does not include emissions from natural sources such as forest fires and from vegetation. Source: Environment and Climate Change Canada (2019) Air Pollutant Emissions Inventory.
Dust and fires (for example, road dust and prescribed burning) were the largest sources of PM2.5 emissions in Alberta, the highest emitting province in 2017, accounting for 77% (455 kt) of total national dust and fires emissions in 2017.
Saskatchewan ranked second in 2017, with 21% (348 kt) of PM2.5 emissions. Agriculture (livestock, crop production and fertilizer) was the largest source, with dust and fires being the second-largest source of PM2.5.
Ontario ranked third, with 16% (271 kt), and Quebec ranked fourth with 13% (211 kt). For both provinces, dust and fires were the largest sources of emissions, with home firewood burning (for example, woodstoves and fireplaces) being the second-largest source.
The increase in emissions in Alberta between 1990 and 2017 can be attributed to growth in construction operations for the oil and gas industries.
The exclusion of emissions from dust and fires and agriculture (livestock, crop production and fertilizer) provides a different breakdown of PM2.5 emissions in each province and territory. With these emissions removed, Quebec becomes the largest emitting province of PM2.5 in 2017, representing 34% (96 kt) of total emissions (287 kt). Ontario ranks second with 24% (70 kt) of emissions. British Columbia and Alberta rank third and fourth, both representing 12% and 11% (34 kt and 31 kt,

Air pollutant emissions Page 28 of 75
respectively) of emissions. Between 1990 and 2017, all of the provinces and territories experienced emissions reductions between 68% (British Columbia) and 25% (Prince Edward Island).
Fine particulate matter emissions by facilities
The National Pollutant Release Inventory provides detailed information on air pollutant emissions from industrial and commercial facilities that meet its reporting criteria.
The Canadian Environmental Sustainability Indicators provide access to this information through an interactive map. The map allows you to explore PM2.5 emissions from individual facilities.
Figure 21. Fine particulate matter by reporting facilities, Canada, 2017
Navigate data using the interactive map
Note: Facility-reported fine particulate matter emissions represent 3% of total national fine particulate matter emissions. Source: Environment and Climate Change Canada (2018) National Pollutant Release Inventory Data Search, 2017 Facility Reported Data.

Canadian Environmental Sustainability Indicators Page 29 of 75
Black carbon emissions by source
Black carbon is a component of PM2.5 and is generated by the incomplete combustion of fossil fuels and biomass. It is a short-lived climate pollutant, and is linked to both climate warming and adverse human health effects. Reductions in black carbon emissions have near-immediate and local benefits to climate and air quality.
Key results
Emissions of black carbon were 36 kt in 2017
In 2017, 3 sectors accounted for 86% of national black carbon emissions: o home firewood burning o transportation (road, rail, air and marine) o off-road vehicles and mobile equipment
Figure 22. Total black carbon emissions by source, Canada, 2017
Data for Figure 22
Note: The indicator reports air pollutant emissions from human activities only. It does not include emissions from natural sources such as forest fires. The chart includes emissions from the most significant sources of black carbon. "Other sources" includes emissions from ore and mineral industries, manufacturing, electric utilities and agriculture. Consult Table 2 in the Data sources and methods for more details. Source: Environment and Climate Change Canada (2019) Canada's Black Carbon Emissions Inventory.
In 2017, home firewood burning and transportation (road, rail, air and marine) accounted for the largest proportions of total national emissions, representing 32% (11.5 kt) and 30% (11 kt) respectively. Off-road vehicles and mobile equipment (for example, lawn and garden equipment, recreational vehicles, excavators, graders) were also large contributors, representing about 24% (8.7 kt) of total national emissions. The remaining 14% of emissions came from the oil and gas industry, other sources (such as ore and mineral industries) and building heating and energy generation.
Air pollutant emissions Page 30 of 75
For both transportation and off-road vehicles and mobile equipment, the use of diesel engines was the main source of black carbon emissions.

Canadian Environmental Sustainability Indicators Page 31 of 75
Air pollutant emissions from transportation, off-road vehicles and mobile equipment
Transportation, off-road vehicles and mobile equipment are among the largest sources of air pollutants in Canada. Burning fossil fuels to power vehicles and engines causes emissions of many air pollutants. Air pollutants are responsible for the formation of fine particulate matter, ozone, smog and acid rain. They also adversely affect human heath, the environment and the economy.
Key results
In 2017, transportation, off-road vehicles and mobile equipment accounted for more than half of total national emissions of carbon monoxide (CO) and nitrogen oxides (NOX) and 16% of total emissions of volatile organic compounds (VOCs)
While also a source of emissions for fine particulate matter (PM2.5), sulphur oxides (SOX) and ammonia (NH3), the sectors represented less than 3% of total national emissions of these other pollutants
Figure 23. Contribution of transportation, off-road vehicles and mobile equipment to total air pollutant emissions by transportation mode, Canada, 2017
Data for Figure 23
Note: "Passenger cars and motorcycles" include cars powered by motor gasoline, diesel, liquefied petroleum gas and compressed natural gas engines as well as all types of motorcycles. "Passenger light trucks" include light-duty trucks powered by motor gasoline, diesel, liquefied petroleum gas and compressed natural gas engines. "Large trucks and buses" include heavy-duty trucks powered by motor gasoline, diesel, liquefied petroleum gas and compressed natural gas engines. Source: Environment and Climate Change Canada (2019) Air Pollutant Emissions Inventory.
The mix of fuels used explains in large part the contribution of each transportation mode to emissions of different air pollutants.
Large trucks and buses, and rail and marine mostly rely on diesel fuel. Aviation relies on aviation turbo fuel. These transportation modes are the largest sources of NOX transportation-related emissions accounting for 36% (634 kilotonnes [kt]) of total NOX emissions.

Air pollutant emissions Page 32 of 75
Passenger cars and light trucks mostly use gasoline and are a main source of pollutants, especially in urban centres. In 2017, emissions from passenger cars, motorcycles and light trucks amounted to 1 269 kt of CO, 120 kt of NOX and 109 kt of VOCs. These emissions represented 22%, 7% and 6% of all emissions of these pollutants respectively.
Other sources (mainly composed of off-road vehicles and equipment)7 are also a significant source of pollution. Their combined emissions make up 22%, 9% and 7% of the total emissions of CO, NOX and VOCs, respectively. Emissions mostly come from household use of gasoline- or diesel-powered recreational and lawn and garden equipment and from the operation of agricultural, construction and mining equipment.
The largest source of sulphur oxide (SOX) emissions in the transportation sector is marine vessels. Emissions of SOX from marine vessels decreased by 91% between 2014 and 2017 due to the introduction of more stringent regulations.
Changes in emissions from transportation, off-road vehicles and mobile equipment
Key results
Between 1990 and 2017, total emissions of NOX, CO and VOCs from transportation, off-road vehicles and mobile equipment decreased by 35%, 62% and 76%, respectively
Since 2000, all pollutants demonstrated the same downward trend in their emissions level
Figure 24. Changes in emissions of key air pollutants from transportation, off-road vehicles and mobile equipment, Canada, 1990 to 2017
Data for Figure 24
Note: Fine particulate matter, sulphur oxides and ammonia are not shown in the chart due to their low share (≤ 5%) of total emissions in 2017. Source: Environment and Climate Change Canada (2019) Air Pollutant Emissions Inventory.
7 Off-road vehicles and mobile equipment include airport ground support equipment, commercial equipment (such as forklifts and ice resurfacers), farming, construction, forestry and mining equipment, industrial equipment, lawn and garden equipment, railway maintenance equipment, and recreational equipment and recreational marine equipment.

Canadian Environmental Sustainability Indicators Page 33 of 75
Pollutant emissions have decreased despite economic and population growth as well as growth in transport activities for the period between 1990 and 2017. This decrease is mainly attributable to the adoption of new regulations that lead to the gradual introduction of technologies and clean fuel for vehicles.
Between 1990 and 2000, NOX emissions increased by 24%. It includes the increase in emissions of large trucks and buses (44%), marine (34%) and air (25%) transportation. From 2000 to 2017, new regulations contributed to a 49% decrease in emissions from large trucks and buses, while emissions from air and marine travel continued to increase by 25% and 3%, respectively. Emissions from air, marine and rail travel represented 20% of national emissions of NOX in 2017.
Transportation emissions are influenced by a variety of factors. These include population and economic growth, volume of passenger and freight travel, vehicle type, emission control technologies, fuel efficiency and fuel type.
Air pollutant emissions Page 34 of 75
Air pollutant emissions from the electric utilities
Electricity generation produces a large share of total national sulphur oxides (SOX) and nitrogen oxides (NOX). SOX and NOX are mostly emitted from power plants burning fossil fuels such as coal and, to a lesser extent, natural gas and diesel. These air pollutants are responsible for the formation of fine particulate matter, ozone, smog and acid rain. They also adversely affect human health, the environment, and the economy.
Key results
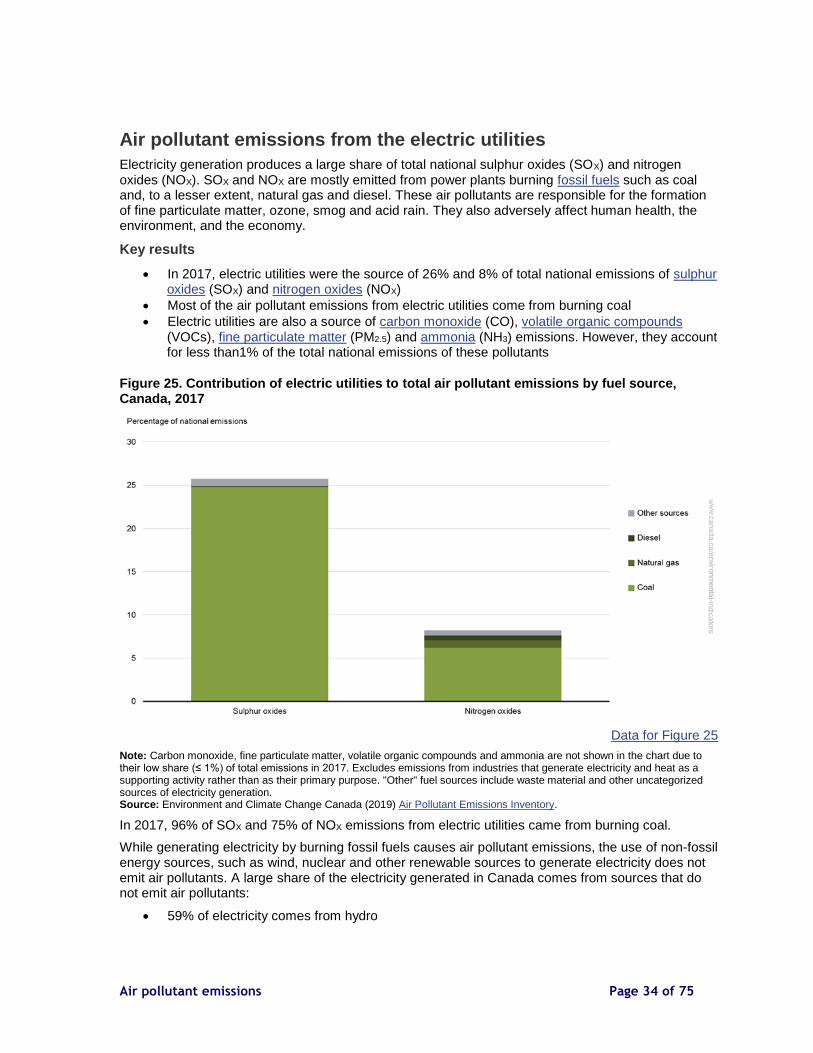
In 2017, electric utilities were the source of 26% and 8% of total national emissions of sulphur oxides (SOX) and nitrogen oxides (NOX)
Most of the air pollutant emissions from electric utilities come from burning coal
Electric utilities are also a source of carbon monoxide (CO), volatile organic compounds (VOCs), fine particulate matter (PM2.5) and ammonia (NH3) emissions. However, they account for less than1% of the total national emissions of these pollutants
Figure 25. Contribution of electric utilities to total air pollutant emissions by fuel source, Canada, 2017
Data for Figure 25
Note: Carbon monoxide, fine particulate matter, volatile organic compounds and ammonia are not shown in the chart due to their low share (≤ 1%) of total emissions in 2017. Excludes emissions from industries that generate electricity and heat as a supporting activity rather than as their primary purpose. "Other" fuel sources include waste material and other uncategorized sources of electricity generation. Source: Environment and Climate Change Canada (2019) Air Pollutant Emissions Inventory.
In 2017, 96% of SOX and 75% of NOX emissions from electric utilities came from burning coal.
While generating electricity by burning fossil fuels causes air pollutant emissions, the use of non-fossil energy sources, such as wind, nuclear and other renewable sources to generate electricity does not emit air pollutants. A large share of the electricity generated in Canada comes from sources that do not emit air pollutants:
59% of electricity comes from hydro

Canadian Environmental Sustainability Indicators Page 35 of 75
15% comes from nuclear power plants
7% comes from non-hydro renewable sources, such as wind, solar, tidal power and biomass8
Changes in emissions from the electric utilities
Key results
Emissions of SOX and NOX from electric utilities declined by 60% and 43%, respectively, between 1990 and 2017
Most of that decline occurred from 2005 onward
Figure 26. Changes in emissions of key air pollutants from electric utilities, Canada, 1990 to 2017
Data for Figure 26
Note: Carbon monoxide, fine particulate matter, volatile organic compounds and ammonia are not shown in the chart due to their low share (≤ 1%) of total emissions in 2017. Excludes emissions from industries that generate electricity and heat as a supporting activity rather than as their primary purpose. Source: Environment and Climate Change Canada (2019) Air Pollutant Emissions Inventory.
Between 2005 and 2017, emissions of NOX and SOX from electric utilities decreased by 42% and 53%, respectively. Over the same period, the share of electricity that came from burning fossil fuels fell from 26% to 20%. This decline was mostly the result of a gradual drop in electricity generation from coal power plants.9
The emissions reductions since 2005 are mainly due to:
the change in the mix of energy sources used to generate electricity
the introduction of regulations
domestic and international agreements
better removal technologies
plant closures
8 Natural Resources Canada (2018) Electricity facts. Retrieved on January 31, 2019.
9 Statistics Canada (2016) CANSIM Table 127-0007 - Electric power generation, by class of electricity producer, annual (megawatt hour). Retrieved on January 31, 2019.
Air pollutant emissions Page 36 of 75
Air pollutant emissions from the oil and gas industry
The oil and gas sector is an important contributor to air pollutant emissions. Air pollutants are responsible for the formation of fine particulate matter (PM2.5), ozone (O3), smog and acid rain. They also adversely affect human health, the environment, and the economy. Most emissions from the oil and gas sector come from activities such as exploration, drilling, production and field processing.
Key results
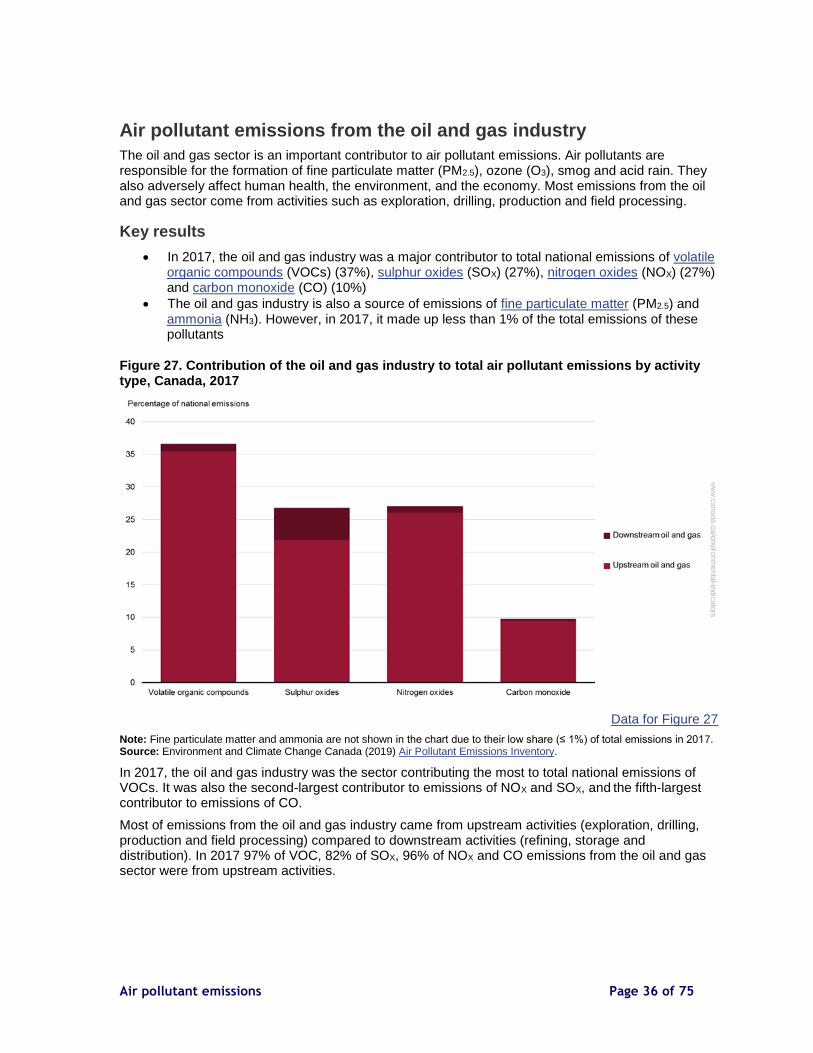
In 2017, the oil and gas industry was a major contributor to total national emissions of volatile organic compounds (VOCs) (37%), sulphur oxides (SOX) (27%), nitrogen oxides (NOX) (27%) and carbon monoxide (CO) (10%)
The oil and gas industry is also a source of emissions of fine particulate matter (PM2.5) and ammonia (NH3). However, in 2017, it made up less than 1% of the total emissions of these pollutants
Figure 27. Contribution of the oil and gas industry to total air pollutant emissions by activity type, Canada, 2017
Data for Figure 27
Note: Fine particulate matter and ammonia are not shown in the chart due to their low share (≤ 1%) of total emissions in 2017. Source: Environment and Climate Change Canada (2019) Air Pollutant Emissions Inventory.
In 2017, the oil and gas industry was the sector contributing the most to total national emissions of VOCs. It was also the second-largest contributor to emissions of NOX and SOX, and the fifth-largest contributor to emissions of CO.
Most of emissions from the oil and gas industry came from upstream activities (exploration, drilling, production and field processing) compared to downstream activities (refining, storage and distribution). In 2017 97% of VOC, 82% of SOX, 96% of NOX and CO emissions from the oil and gas sector were from upstream activities.

Canadian Environmental Sustainability Indicators Page 37 of 75
Changes in emissions from the oil and gas industry
Key results
Emissions of CO, NOX and VOCs increased by 64%, 39% and 10%, respectively, between 1990 and 2017
SOX emissions decreased (52%) over that period
Figure 28. Changes in emissions of key air pollutants from the oil and gas industry, Canada, 1990 to 2017
Data for Figure 28
Note: Fine particulate matter and ammonia are not shown in the chart due to their low share (≤ 1%) of total emissions in 2017. Source: Environment and Climate Change Canada (2019) Air Pollutant Emissions Inventory.
The increases in CO, NOX and VOC emissions were due to growth in oil and gas production (the upstream sector of the industry), as emissions from the downstream sector declined during that period. This increase is in part explained by the fact that crude oil production had more than doubled in Canada since 1990. The growth was mostly driven by a rapid increase in oil sands production. During the same period, production of natural gas from unconventional sources, such as those requiring the use of multi-stage fracturing techniques, also increased significantly.
The decrease in SOX emissions was mostly the result of a decrease in emissions from bitumen and heavy oil upgrading and natural gas processing, attributed to better emission control technologies.

Air pollutant emissions Page 38 of 75
About the indicators
What the indicators measure
Air pollutant emissions indicators track emissions from human activities of 6 key air pollutants: sulphur oxides (SOX), nitrogen oxides (NOX), volatile organic compounds (VOCs), ammonia (NH3), carbon monoxide (CO) and fine particulate matter (PM2.5). Black carbon, which is a component of PM2.5, is also reported.10 Sectoral indicators on air pollutant emissions from transportation, off-road vehicles and mobile equipment, electric utilities and the oil and gas industry provide additional analysis on the largest sources of Canada's air pollutant emissions.
For each air pollutant, the indicators are provided at the national and provincial/territorial levels. They also identify the major sources of emissions and provide links to detailed information on air pollutant emissions from facilities.11
Why these indicators are important
Canadians are exposed to air pollutants on a daily basis, which can cause adverse health and environmental effects. Fine particulate matter (PM2.5) and ground-level ozone (O3) are key components of smog and have been associated with pulmonary and cardiovascular health issues even at very low levels. While causing effects of their own, NOX (such as nitrogen dioxide [NO2]) and VOCs are the main contributors to the formation of O3. Nitrogen oxides, SOX (such as sulphur dioxide [SO2]), NH3 and VOCs also lead to the formation of PM2.5 in the air, in addition to the PM2.5 that is emitted directly. Sulphur oxides and NOX can also lead to the formation of acid deposition (acid rain) that can harm the environment, materials, living organisms, and humans.
Consult Air pollution: drivers and impacts for information on the impacts of air pollution on health, the economy and the environment, as well as information on the federal regulations administered under the Canadian Environmental Protection Act (1999) addressing air pollution.
Black carbon is estimated to be the third largest contributor in the world to current global warming. Black carbon is of particular significance in Polar Regions, where the deposition of particles on ice and snow darken the surface, increasing the absorption of sunlight, and accelerate melting.
The Air pollutant emissions indicators are intended to inform Canadians and decision makers about progress made towards reducing emissions from human-related sources of air pollutants and about the effectiveness of emission reduction measures implemented to improve ambient air quality in Canada.
10 Black carbon is emitted from combustion processes in the form of PM2.5. It is not emitted on its own, but as a component of PM2.5 along with other components, such as organic carbon and inorganic compounds like sulphates. Fine particulate matter emissions from non-combustion sources, such as dust raised by traffic on paved and unpaved roads or by wind and machinery on open fields or mine sites, are not considered sources of black carbon. Environment and Climate Change Canada (2019) Canada's Black Carbon Emissions Inventory. Retrieved on June 28, 2019.
11 Only facilities that had air pollutant emissions over a certain reporting threshold were included in the National Pollutant Releases Inventory (NPRI) reported data.
Canadian Environmental Sustainability Indicators Page 39 of 75
Safe and healthy communities
These indicators support the measurement of progress towards the following 2019 to 2022 Federal Sustainable Development Strategy long-term goal: All Canadians live in clean, sustainable communities that contribute to their health and well-being. It is used to assess progress towards the target: Continued decrease in emissions from 1990 of fine particulate matter, nitrogen oxides, sulphur oxides and volatile organic compounds from all sources.
In addition, the indicators contribute to the Sustainable Development Goals of the 2030 Agenda for Sustainable Development. They are linked to the 2030 Agenda's Goal 11: Sustainable cities and communities.
Related indicators
The International comparison of air pollutant emissions indicators compare Canada's emissions of 5 key air pollutants with those of top emitting member countries of the Organisation for Economic Co-operation and Development.
The Air health trends indicator provides an overview of the public health impacts attributable to outdoor air pollution in Canada.
The Air quality indicators track ambient concentrations of PM2.5, O3, SO2, NO2, and VOCs at the national and regional level and at local monitoring stations.
The Greenhouse gas emissions indicators report trends on Canada's GHG emissions nationally, by province and territory, per person and per unit gross domestic product, by economic sector.
The Greenhouse gas emissions from large facilities indicator reports GHG emissions from the largest GHG emitters in Canada (industrial and other types of facilities).
Data sources and methods
Data sources
The Air pollutant emissions indicators track emissions of 6 key air pollutants: sulphur oxides (SOX), nitrogen oxides (NOX), volatile organic compounds (VOCs), ammonia (NH3), carbon monoxide (CO) and fine particulate matter (PM2.5). The emissions data used are from Canada's Air Pollutant Emissions Inventory for the years 1990 to 2017.
Data for the black carbon indicator, a component of PM2.5, come from Canada's Black Carbon Emissions Inventory and are reported for 2017 by source at the national level.
Facility data for local air pollutant emissions reported in interactive maps come from the National Pollutant Release Inventory and are available for the years 2008 to 2017.
More information
The Air Pollutant Emissions Inventory and the Black Carbon Emissions Inventory provide data and estimates on releases of air pollutants from human activities. These pollutants contribute to the issues of smog, acid rain, reduced air quality and climate change. Improvements to data are made periodically as new emission estimation methodologies are adopted and additional information is made available. Historical emissions are updated on the basis of these improvements.

Air pollutant emissions Page 40 of 75
Air Pollutant Emissions Inventory
The Air Pollutant Emissions Inventory fulfills many of Canada's international pollution levels reporting obligations. It is a comprehensive inventory of 17 air pollutants,12 combining emissions reported by facilities to the National Pollutant Release Inventory, with emissions estimated by Environment and Climate Change Canada. Estimates are developed using the latest estimation methods and are based on published statistics or other sources of information such as surveys and reports. The Air Pollutant Emissions Inventory provides a comprehensive overview of pollutant emissions across Canada.
The national and provincial/territorial inventory data are current as of March 15, 2019, and cover the period from 1990 to 2017. Emissions data are reported in the inventory approximately one year after data collection, validation, calculation and interpretation have been completed. The indicators are reported following the public release of the inventory data.
Black carbon emissions inventory
As a member of the Arctic Council, Canada committed under the Framework for Action on Enhanced Black Carbon and Methane Emissions Reductions to submit annual inventories of its black carbon emissions to the United Nations Economic Commission for Europe beginning in 2015. The Black Carbon Emissions Inventory is compiled using PM2.5 emissions data from combustion-related sources from the Air Pollutant Emissions Inventory. Black carbon estimates are published separately from the Air Pollutant Emissions Inventory. The data are current as of June 28, 2019.
Black carbon is considered a short-lived climate pollutant, meaning it has a relatively short lifespan in the atmosphere (from a few days to a few weeks) compared to carbon dioxide (CO2) (which can persist in the atmosphere for thousands of years) and other longer-lived greenhouse gases (GHGs). Although their life spans are short, short-lived climate pollutants are potent global warmers contributing to warming of the Earth's surface.13 Black carbon absorbs solar radiation 460 to 1 500 times more than CO2.14 Short-lived climate pollutants, including black carbon, are important pollutants to consider when addressing climate change because they can respond relatively quickly to efforts to control their releases and thus impact near-term warming, which is particularly important in the Polar Regions, such as the Arctic.15 The Intergovernmental Panel on Climate Change (IPCC) special report on Global Warming states that reductions in short-lived climate pollutants are required to limit warming to a maximum of 1.5oC, and Canada's Changing Climate Report flags short-lived climate pollutants as an important part of climate policy discussions.
National Pollutant Release Inventory
The National Pollutant Release Inventory is a database of pollutant releases (to air, water and land), disposals and transfers for recycling from industrial, commercial and institutional facilities. The data from these facilities is provided by the operators of the facilities as mandated by the Canadian Environmental Protection Act (the Act). Under the Act, owners or operators of facilities that manufacture, process or otherwise use or release one or more of the substances tracked by the inventory, and meet substance-specific reporting thresholds and other requirements, must report their pollutant releases, disposals and transfers annually to the department. The inventory data from 1994 to 2017 are current as of September 13, 2018.
12 Includes the 6 key air pollutants (sulphur oxides, nitrogen oxides, volatile organic compounds, ammonia, carbon monoxide and fine particulate matter) along with cadmium, lead, mercury, dioxins and furans, 4 types of polycyclic aromatic hydrocarbons, hexachlorobenzene, coarse particulate matter and total particulate matter. 13 Environment and Climate Change Canada (2017) Short-lived climate pollutants. Retrieved on January 31, 2019. 14 Climate and Clean Air Coalition (2018) Science: Black carbon. Retrieved on January 31, 2019. 15 Environment and Climate Change Canada (2019). Canada's Black Carbon Inventory 2019: Executive summary. Retrieved on June 28, 2019.

Canadian Environmental Sustainability Indicators Page 41 of 75
Methods
Emissions data from Canada's national inventories are used to produce the indicators for the 6 key air pollutants. Data are grouped to report on the sources that contribute the majority of emissions for each pollutant. Canada's national inventories use the latest advancements in scientific knowledge to estimate or measure emissions for the various air pollutant sources.
More information
Compilation of air pollutant emissions
The Air Pollutant Emissions Inventory is developed using 2 types of information:
facility-reported data, consisting of emissions from relatively large industrial, commercial and institutional facilities
in-house estimates, including diffuse sources and other sources that are too numerous to be accounted for individually, such as road and non-road vehicles, agricultural activities, construction and solvent use
The Air Pollutant Emissions Inventory is developed using many sources of information, procedures and emission estimation models. Emissions data reported by individual facilities to the department's National Pollutant Release Inventory are supplemented with documented, science-based estimation tools to quantify total emissions. Together, these data sources provide a comprehensive overview of pollutant emissions across Canada.
A compilation framework has been developed that makes use of the best available data, while ensuring that there is no double-counting or omissions. Additional information on the inventory compilation process is provided in Annex 2 of the Air Pollutant Emissions Inventory Report.
Facility-reported emissions data
Facility-reported emissions data generally refers to any stationary sources that emit pollutants through stacks or other equipment at specific locations. The major source of facility-reported data is the National Pollutant Release Inventory.
Facility-reported data from the National Pollutant Release Inventory are used in the Air Pollutant Emissions Inventory without modifications, except when data quality issues are detected and not addressed during the quality control exercise. The National Pollutant Release Inventory reporting requirements and thresholds vary by pollutant and, in some cases, by industry. Details on these reporting requirements and thresholds are available on the National Pollutant Release Inventory website.
A distinction has been made between reporting facilities and non-reporting facilities. Reporting facilities meet the threshold required to report to the National Pollutant Release Inventory; while non-reporting facilities do not meet these thresholds due to their size or emission levels, and therefore are not required to report to the inventory. Some facilities may be required to report emissions on only certain pollutants. Therefore, emissions from the non-reporting facilities or of non-reported pollutants must be estimated in-house to ensure complete coverage.

Air pollutant emissions Page 42 of 75
In-house emission estimates
In-house emission estimates are calculated with information such as production data and activity data, using various estimation methodologies and emission models. These emission estimates are at the national level rather than at any specific geographic locations. These include emissions from non-industrial, residential, commercial, transportation, and other sources, such as open burning, agricultural activities and construction operations. The Air Pollutant Emissions Inventory uses in-house estimates for the following emission sources:
any residential, governmental, institutional, or commercial operation that does not report to the National Pollutant Release Inventory
on-site solid waste disposal facilities
motor vehicles, aircraft, vessels or other transportation equipment or devices
other sources, such as open burning, agricultural activities and construction operations
In general, in-house emission estimates are calculated from activity data and emission factors.16 Activity data usually comprise statistical production or process data at the provincial, territorial or national level. This information is typically provided by provincial/territorial agencies, federal government departments, industry associations, etc. For each source category, activity data are combined with emission factors to produce provincial/territorial-level emission estimates.
The in-house emission estimate methodologies and emission models used in Canada are often based on those developed by the United States Environmental Protection Agency (U.S. EPA) and are adapted to reflect the Canadian climate, fuels, technologies and practices. Methods used in Canada's Air Pollutants Emission Inventory are therefore generally consistent with those used in the United States or those recommended in the emission inventory guidebook.17
The Air Pollutant Emissions Inventory reports air pollutant emissions from mobile sources such as on-road vehicles, off-road vehicles and engines. For the current edition of the Air Pollutant Emissions Inventory, an emissions estimation model developed by the U.S. EPA (MOVES) was used. The emissions for off-road vehicles and engines (such as graders, heavy trucks, outboard motors and lawnmowers) were estimated using the U.S. EPA's NONROAD emission estimation model (see "off-road vehicles and equipment" in Table A2-5 of Annex 2 of the Air Pollutant Emissions Inventory Report). The parameters in both models were modified to take into account variations in the Canadian vehicle fleet, emission control technologies, types of fuels, vehicle standards, and types of equipment engines and their application in various industries. The emission estimates for civil and international aviation, railways and navigation are estimated using detailed vehicle movement statistics coupled with fuel consumption, engine information, and emission rates by vehicle types.
16 The United States Environmental Protection Agency defines an emission factor as "…a representative value that attempts to relate the quantity of a pollutant released to the atmosphere with an activity associated with the release of that pollutant. These factors are usually expressed as the weight of pollutant divided by a unit weight, volume, distance, or duration of the activity emitting the pollutant (for example, kilograms of particulate emitted per megagram of coal burned)."
17 European Monitoring and Evaluation Programme / European Environment Agency (2013) EMEP/EEA Air Pollutant Emissions Inventory Guidebook 2013. Technical Guidance to Prepare National Emission Inventories. Luxembourg: Publications Office of the European Union. Technical Report No. 12/2013.

Canadian Environmental Sustainability Indicators Page 43 of 75
Calculation of black carbon emissions
Emissions of black carbon are calculated by applying factors to estimate the fraction of black carbon in PM2.5 emissions from combustion-related sources, with the exception of mobile sources, where models are used. The factors primarily come from the United States Environmental Protection Agency's SPECIATE database. SPECIATE is a repository of particulate matter speciation profiles18 of air pollution sources. Annex B of Canada's Black Carbon Emissions Inventory lists all the ratios used for each source.
Recalculations
Emission recalculation is an essential practice in the maintenance of an up-to-date air pollutant emissions inventory. The Air Pollutant Emissions Inventory is continuously updated with improved estimation methodologies, statistics and more recent and appropriate emission factors. As new information and data become available, previous estimates are updated and recalculated to ensure a consistent and comparable trend in emissions. Recalculations of previously reported emission estimates are common for both in-house estimates and facility-reported emission data. More information on recalculations is provided in Annex 2 of the Air Pollutant Emissions Inventory Report.
Emissions reconciliation
In several sectors, estimation of total emissions involves combining estimates provided by facilities with estimates developed in-house by the department. To prevent double counting of emissions and to confirm that the Air Pollutant Emissions Inventory includes all emissions, a comparison and reconciliation of emission estimates from various sources is performed for each pollutant, industry sector and geographical region, as appropriate. More information on the reconciliation process is provided in Annex 2 of the Air Pollutant Emissions Inventory Report.
Temporal coverage
Historical data are provided at the national level for the period from 1990 to 2017. For the regional indicators (provincial/territorial), emissions are presented for 1990 and 2017. Facility level emissions information are available from 2008 to 2017.
Air pollutant emissions by source classification
For the purpose of reporting the indicators, calculated emissions data from the Air Pollutant Emissions Inventory and Black Carbon Emissions Inventory are grouped into the following 13 sources:
1. agriculture (livestock, crop production and fertilizer) 2. building heating and energy generation 3. dust and fires 4. electric utilities 5. home firewood burning 6. incineration and waste 7. manufacturing 8. miscellaneous 9. off-road vehicles and mobile equipment 10. oil and gas industry 11. ore and mineral industries 12. paints and solvents 13. transportation (road, rail, air and marine)
18 A speciation profile is the dataset that breaks down PM2.5 emitted from a particular source into its different components (black carbon and organic carbon). Environment and Climate Change Canada (2019) Canada's Black Carbon Emissions Inventory. Retrieved on June 28, 2019.

Air pollutant emissions Page 44 of 75
Table 2 shows the allocation of air pollutant emission sources reported in the indicators compared with the sources and sectors reported by the Air Pollutant Emissions Inventory.
Table 2. Alignment of sources reported in the indicators with the sources and sectors from the Air Pollutant Emissions Inventory/Black Carbon Emissions Inventory
Sources in the indicators Sources and sectors in the Air Pollutant Emissions Inventory and Black Carbon Emissions Inventory
Agriculture (livestock, crop production and fertilizer)
Agriculture: Animal production
Agriculture (livestock, crop production and fertilizer)
Agriculture: Crop production
Agriculture (livestock, crop production and fertilizer)
Agriculture: Fuel use
Building heating and energy generation
Commercial/Residential/Institutional: Commercial and institutional fuel combustion
Building heating and energy generation
Commercial/Residential/Institutional: Construction fuel combustion
Building heating and energy generation
Commercial/Residential/Institutional: Residential fuel combustion
Dust and fires Dust: Coal transportation
Dust and fires Dust: Construction operations
Dust and fires Dust: Mine tailings
Dust and fires Dust: Paved roads
Dust and fires Dust: Unpaved roads
Dust and fires Fires: Prescribed burning
Dust and fires Fires: Structural fires
Electric utilities Electric power generation (utilities): Coal
Electric utilities Electric power generation (utilities): Diesel
Electric utilities Electric power generation (utilities): Natural gas
Electric utilities Electric power generation (utilities): Waste materials[A]
Electric utilities Electric power generation (utilities): Other (electric power generation)
Home firewood burning Commercial/Residential/Institutional: Home firewood burning
Incineration and waste Incineration and waste: Crematoriums
Incineration and waste Incineration and waste: Waste incineration
Incineration and waste Incineration and waste: Waste treatment and disposal
Manufacturing Manufacturing: Abrasives manufacture
Manufacturing Manufacturing: Bakeries
Manufacturing Manufacturing: Biofuel production
Manufacturing Manufacturing: Chemicals industry
Manufacturing Manufacturing: Electronics
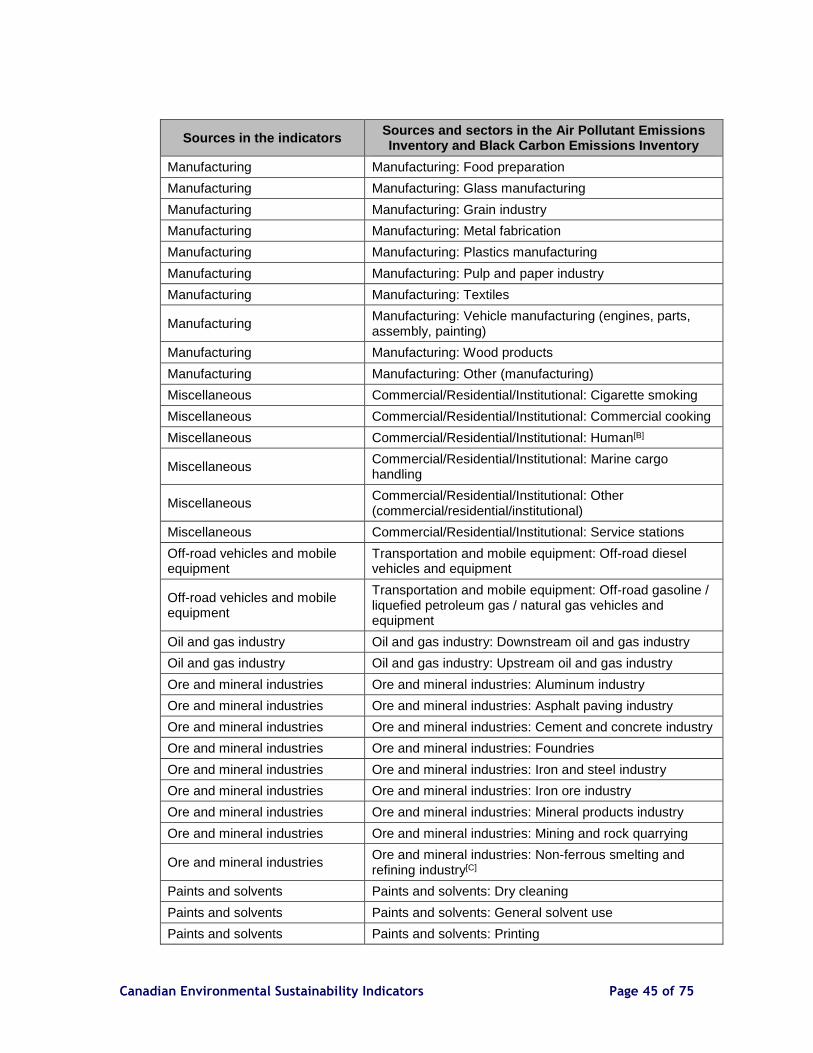
Canadian Environmental Sustainability Indicators Page 45 of 75
Sources in the indicators Sources and sectors in the Air Pollutant Emissions Inventory and Black Carbon Emissions Inventory
Manufacturing Manufacturing: Food preparation
Manufacturing Manufacturing: Glass manufacturing
Manufacturing Manufacturing: Grain industry
Manufacturing Manufacturing: Metal fabrication
Manufacturing Manufacturing: Plastics manufacturing
Manufacturing Manufacturing: Pulp and paper industry
Manufacturing Manufacturing: Textiles
Manufacturing Manufacturing: Vehicle manufacturing (engines, parts, assembly, painting)
Manufacturing Manufacturing: Wood products
Manufacturing Manufacturing: Other (manufacturing)
Miscellaneous Commercial/Residential/Institutional: Cigarette smoking
Miscellaneous Commercial/Residential/Institutional: Commercial cooking
Miscellaneous Commercial/Residential/Institutional: Human[B]
Miscellaneous Commercial/Residential/Institutional: Marine cargo handling
Miscellaneous Commercial/Residential/Institutional: Other (commercial/residential/institutional)
Miscellaneous Commercial/Residential/Institutional: Service stations
Off-road vehicles and mobile equipment
Transportation and mobile equipment: Off-road diesel vehicles and equipment
Off-road vehicles and mobile equipment
Transportation and mobile equipment: Off-road gasoline / liquefied petroleum gas / natural gas vehicles and equipment
Oil and gas industry Oil and gas industry: Downstream oil and gas industry
Oil and gas industry Oil and gas industry: Upstream oil and gas industry
Ore and mineral industries Ore and mineral industries: Aluminum industry
Ore and mineral industries Ore and mineral industries: Asphalt paving industry
Ore and mineral industries Ore and mineral industries: Cement and concrete industry
Ore and mineral industries Ore and mineral industries: Foundries
Ore and mineral industries Ore and mineral industries: Iron and steel industry
Ore and mineral industries Ore and mineral industries: Iron ore industry
Ore and mineral industries Ore and mineral industries: Mineral products industry
Ore and mineral industries Ore and mineral industries: Mining and rock quarrying
Ore and mineral industries Ore and mineral industries: Non-ferrous smelting and refining industry[C]
Paints and solvents Paints and solvents: Dry cleaning
Paints and solvents Paints and solvents: General solvent use
Paints and solvents Paints and solvents: Printing

Air pollutant emissions Page 46 of 75
Sources in the indicators Sources and sectors in the Air Pollutant Emissions Inventory and Black Carbon Emissions Inventory
Paints and solvents Paints and solvents: Surface coatings
Transportation (road, rail, air and marine)
Transportation and mobile equipment: Air transportation
Transportation (road, rail, air and marine)
Transportation and mobile equipment: Heavy-duty diesel vehicles
Transportation (road, rail, air and marine)
Transportation and mobile equipment: Heavy-duty gasoline vehicles
Transportation (road, rail, air and marine)
Transportation and mobile equipment: Heavy-duty liquefied petroleum gas / natural gas vehicles
Transportation (road, rail, air and marine)
Transportation and mobile equipment: Light-duty diesel trucks
Transportation (road, rail, air and marine)
Transportation and mobile equipment: Light-duty diesel vehicles
Transportation (road, rail, air and marine)
Transportation and mobile equipment: Light-duty gasoline trucks
Transportation (road, rail, air and marine)
Transportation and mobile equipment: Light-duty gasoline vehicles
Transportation (road, rail, air and marine)
Transportation and mobile equipment: Light-duty liquefied petroleum gas / natural gas trucks
Transportation (road, rail, air and marine)
Transportation and mobile equipment: Light-duty liquefied petroleum gas / natural gas vehicles
Transportation (road, rail, air and marine)
Transportation and mobile equipment: Marine transportation
Transportation (road, rail, air and marine)
Transportation and mobile equipment: Motorcycles
Transportation (road, rail, air and marine)
Transportation and mobile equipment: Rail transportation
Transportation (road, rail, air and marine)
Transportation and mobile equipment: Tire wear and brake lining
Note: [A] Includes electric power generation from combustion of waste materials by utilities and by industry for commercial sale and/or private use. [B] Includes human respiration, perspiration and dental amalgams. [C] These sectors from the Air Pollutant Emissions Inventory are sometimes shown as individual sources in the indicators.
For display purposes, smaller emitting sources are sometimes grouped together under the title "other sources" in the charts of air pollutant emissions by source. The names of the sources grouped as such are listed in the notes of each chart.
Sectoral indicators
Sectoral indicators on air pollutant emissions from transportation, off-road vehicles and mobile equipment, electric utilities and the oil and gas industry provide additional analysis on the largest sources of Canada's air pollutant emissions. These indicators also rely on calculated emissions data from the Air Pollutant Emissions Inventory.
These indicators are provided at the national level. They identify the contribution of each sector to the national emissions of air pollutants for the year 2017. They also provide information about emissions of selected pollutant, by sector, for the period from 1990 to 2017.

Canadian Environmental Sustainability Indicators Page 47 of 75
Tables 3 through 5 below show the alignment of air pollutant emission sources reported in the Air pollutant emissions indicators compared with those reported by the sectoral indicators.
Table 3. Alignment of sources reported in the transportation, off-road vehicles and mobile equipment indicator of Air pollutant emissions with the sources and sectors from the Air Pollutant Emissions Inventory/Black Carbon Emissions Inventory
Air pollutant emissions from transportation, off-road vehicles
and mobile equipment
Sources and sectors in the Air Pollutant Emissions Inventory and Black Carbon
Emissions Inventory
Air, marine and rail travel Transportation and mobile equipment: Air transportation
Air, marine and rail travel Transportation and mobile equipment: Marine transportation
Air, marine and rail travel Transportation and mobile equipment: Rail transportation
Large trucks and buses Transportation and mobile equipment: Heavy-duty diesel vehicles
Large trucks and buses Transportation and mobile equipment: Heavy-duty gasoline vehicles
Large trucks and buses Transportation and mobile equipment: Heavy-duty liquefied petroleum gas / natural gas vehicles
Off-road vehicles and equipment, tire wear and brake lining
Transportation and mobile equipment: Off-road diesel vehicles and equipment
Off-road vehicles and equipment, tire wear and brake lining
Transportation and mobile equipment: Off-road gasoline / liquefied petroleum gas / natural gas vehicles and equipment
Off-road vehicles and equipment, tire wear and brake lining
Transportation and mobile equipment: Tire wear and brake lining
Passenger cars and motorcycles Transportation and mobile equipment: Light-duty diesel vehicles
Passenger cars and motorcycles Transportation and mobile equipment: Light-duty gasoline vehicles
Passenger cars and motorcycles Transportation and mobile equipment: Light-duty liquefied petroleum gas / natural gas vehicles
Passenger cars and motorcycles Transportation and mobile equipment: Motorcycles
Passenger light trucks Transportation and mobile equipment: Light-duty diesel trucks
Passenger light trucks Transportation and mobile equipment: Light-duty gasoline trucks
Passenger light trucks Transportation and mobile equipment: Light-duty liquefied petroleum gas / natural gas trucks
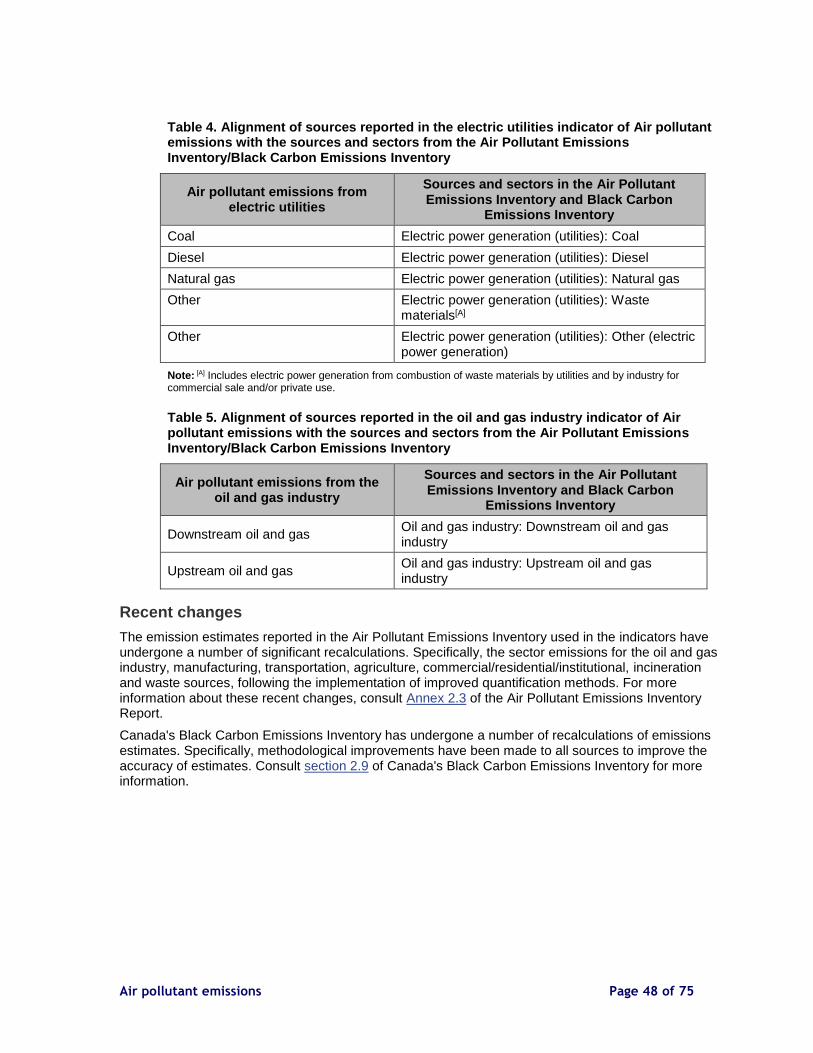
Air pollutant emissions Page 48 of 75
Table 4. Alignment of sources reported in the electric utilities indicator of Air pollutant emissions with the sources and sectors from the Air Pollutant Emissions Inventory/Black Carbon Emissions Inventory
Air pollutant emissions from electric utilities
Sources and sectors in the Air Pollutant Emissions Inventory and Black Carbon
Emissions Inventory
Coal Electric power generation (utilities): Coal
Diesel Electric power generation (utilities): Diesel
Natural gas Electric power generation (utilities): Natural gas
Other Electric power generation (utilities): Waste materials[A]
Other Electric power generation (utilities): Other (electric power generation)
Note: [A] Includes electric power generation from combustion of waste materials by utilities and by industry for commercial sale and/or private use.
Table 5. Alignment of sources reported in the oil and gas industry indicator of Air pollutant emissions with the sources and sectors from the Air Pollutant Emissions Inventory/Black Carbon Emissions Inventory
Air pollutant emissions from the oil and gas industry
Sources and sectors in the Air Pollutant Emissions Inventory and Black Carbon
Emissions Inventory
Downstream oil and gas Oil and gas industry: Downstream oil and gas industry
Upstream oil and gas Oil and gas industry: Upstream oil and gas industry
Recent changes
The emission estimates reported in the Air Pollutant Emissions Inventory used in the indicators have undergone a number of significant recalculations. Specifically, the sector emissions for the oil and gas industry, manufacturing, transportation, agriculture, commercial/residential/institutional, incineration and waste sources, following the implementation of improved quantification methods. For more information about these recent changes, consult Annex 2.3 of the Air Pollutant Emissions Inventory Report.
Canada's Black Carbon Emissions Inventory has undergone a number of recalculations of emissions estimates. Specifically, methodological improvements have been made to all sources to improve the accuracy of estimates. Consult section 2.9 of Canada's Black Carbon Emissions Inventory for more information.
Canadian Environmental Sustainability Indicators Page 49 of 75
Caveats and limitations
The methodologies for compiling air pollutant emissions generally improve over time, and revisions are made to the Air Pollution Emission Inventory. As a result of this, the emissions and trends reported for the indicators may be different from those previously published.
Some area source emissions were not updated for 2017 due to the unavailability of activity-level statistics at the time of compilation. In these cases, the emission estimates from the most recent year available were used.
The Air Pollutant Emissions Inventory uses facility information from the National Pollutant Release Inventory and other sources. The version of the data published by the National Pollutant Release Inventory may not be identical to that used in the Air Pollutant Emissions Inventory at a given time because of updates to point source data from National Pollutant Release Inventory reporting.
Only the most significant sources of black carbon have been reported. It is estimated that emissions from these sources (home firewood burning, off-road vehicles and mobile equipment and transportation) represent approximately 86% of the national anthropogenic black carbon emissions.

Air pollutant emissions Page 50 of 75
Resources
References
Environment and Climate Change Canada (2019) Air Pollutant Emissions Inventory report - 2019. Retrieved on March 15, 2019.
Environment and Climate Change Canada (2019) Canada's Black Carbon Inventory 2019. Retrieved on June 28, 2019.
Environment and Climate Change Canada (2019) Climate and Clean Air Coalition. Retrieved on January 31, 2019.
Environment and Climate Change Canada (2019) Access data from the National Pollutant Release Inventory (NPRI). February 12, 2019 version. Retrieved on March 15, 2019.
Environment and Climate Change Canada (2018) Tools and resources for the National Pollutant Release Inventory data. Retrieved on March 15, 2019.
Environment and Climate Change Canada (2017) Using and interpreting data from the National Pollutant Release Inventory. Retrieved on March 15, 2019.
Related information
Air pollution: drivers and impacts
Air Pollutant Emissions Inventory: overview
Air Pollutant Emissions Inventory online search
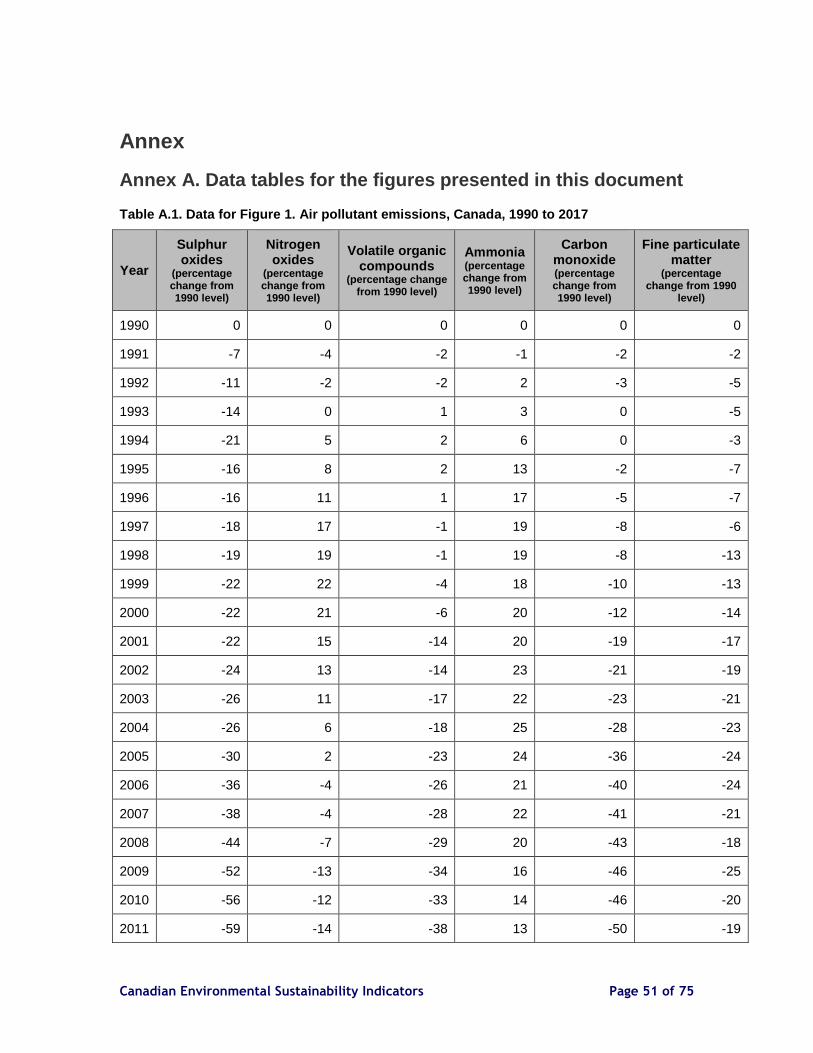
Canadian Environmental Sustainability Indicators Page 51 of 75
Annex
Annex A. Data tables for the figures presented in this document
Table A.1. Data for Figure 1. Air pollutant emissions, Canada, 1990 to 2017
Year
Sulphur oxides
(percentage change from 1990 level)
Nitrogen oxides
(percentage change from 1990 level)
Volatile organic compounds
(percentage change from 1990 level)
Ammonia (percentage change from 1990 level)
Carbon monoxide (percentage change from 1990 level)
Fine particulate matter
(percentage change from 1990
level)
1990 0 0 0 0 0 0
1991 -7 -4 -2 -1 -2 -2
1992 -11 -2 -2 2 -3 -5
1993 -14 0 1 3 0 -5
1994 -21 5 2 6 0 -3
1995 -16 8 2 13 -2 -7
1996 -16 11 1 17 -5 -7
1997 -18 17 -1 19 -8 -6
1998 -19 19 -1 19 -8 -13
1999 -22 22 -4 18 -10 -13
2000 -22 21 -6 20 -12 -14
2001 -22 15 -14 20 -19 -17
2002 -24 13 -14 23 -21 -19
2003 -26 11 -17 22 -23 -21
2004 -26 6 -18 25 -28 -23
2005 -30 2 -23 24 -36 -24
2006 -36 -4 -26 21 -40 -24
2007 -38 -4 -28 22 -41 -21
2008 -44 -7 -29 20 -43 -18
2009 -52 -13 -34 16 -46 -25
2010 -56 -12 -33 14 -46 -20
2011 -59 -14 -38 13 -50 -19

Air pollutant emissions Page 52 of 75
Year
Sulphur oxides
(percentage change from 1990 level)
Nitrogen oxides
(percentage change from 1990 level)
Volatile organic compounds
(percentage change from 1990 level)
Ammonia (percentage change from 1990 level)
Carbon monoxide (percentage change from 1990 level)
Fine particulate matter
(percentage change from 1990
level)
2012 -59 -18 -37 17 -51 -14
2013 -59 -20 -36 21 -52 -15
2014 -61 -22 -36 19 -53 -14
2015 -65 -25 -38 19 -54 -15
2016 -66 -27 -40 19 -54 -15
2017 -69 -26 -40 19 -54 -15
Note: The indicator reports air pollutant emissions from human activities only. It does not include emissions from natural sources such as forest fires and from vegetation. Source: Environment and Climate Change Canada (2019) Air Pollutant Emissions Inventory.
Table A.2. Data for Figure 2. Distribution of air pollutant emissions by source, Canada, 2017
Source
Sulphur oxides
(percentage of national emissions)
Nitrogen oxides
(percentage of national emissions)
Volatile organic
compounds (percentage of
national emissions)
Ammonia (percentage of national emissions)
Carbon monoxide (percentage of national emissions)
Fine particulate
matter (percentage of national emissions)
Oil and gas industry
26.8 27.0 36.6 0.6 9.8 0.8
Manufacturing 4.4 3.9 5.3 2.4 2.4 1.0
Ore and mineral industries
39.6 4.3 0.7 0.3 10.2 2.1
Transportation (road, rail, air and marine)
1.7 42.3 8.7 1.6 32.1 1.2
Off-road vehicles and mobile equipment
<0.1 9.4 7.3 <0.1 21.8 0.9
Building heating and energy generation
0.5 3.3 0.2 0.1 0.6 0.3
Electric utilities 25.7 8.2 0.1 0.1 0.7 0.2
Home firewood burning
0.3 1.1 12.7 0.4 21.0 9.7
Incineration and waste
0.3 0.3 0.6 0.8 0.3 0.2
Paints and <0.1 <0.1 18.5 n/a <0.1 <0.1

Canadian Environmental Sustainability Indicators Page 53 of 75
Source
Sulphur oxides
(percentage of national emissions)
Nitrogen oxides
(percentage of national emissions)
Volatile organic
compounds (percentage of
national emissions)
Ammonia (percentage of national emissions)
Carbon monoxide (percentage of national emissions)
Fine particulate
matter (percentage of national emissions)
solvents
Agriculture (livestock, crop production and fertilizer)
0.7 0.2 6.4 93.6 <0.1 22.7
Dust and fires <0.1 0.1 0.2 <0.1 0.9 60.1
Miscellaneous <0.1 <0.1 2.9 0.1 0.1 0.9
Note: n/a = not available. The indicator reports air pollutant emissions from human activities only. It does not include emissions from natural sources such as forest fires and from vegetation. The percentages have been rounded off and their sum may not add up to 100. Source: Environment and Climate Change Canada (2019) Air Pollutant Emissions Inventory.
Table A.3. Data for Figure 3. Distribution of air pollutant emissions by province and territory, Canada, 2017
Province or territory
Sulphur oxides
(percentage of national emissions)
Nitrogen oxides
(percentage of national emissions)
Volatile organic
compounds (percentage of
national emissions)
Ammonia (percentage of national emissions)
Carbon monoxide (percentage of national emissions)
Fine particulate
matter (percentage of national emissions)
Newfoundland and Labrador
1.7 2.7 1.6 0.2 1.8 1.2
Prince Edward Island
<0.1 0.2 0.4 0.6 0.5 0.3
Nova Scotia 7.1 3.6 2.2 0.7 2.9 1.6
New Brunswick 2.2 1.7 1.9 0.7 2.7 1.5
Quebec 11.4 11.0 16.1 13.4 27.5 12.6
Ontario 18.9 16.8 19.9 18.4 24.6 16.2
Manitoba 12.5 2.5 3.4 12.8 3.0 5.3
Saskatchewan 12.6 7.9 14.3 21.7 5.7 20.8
Alberta 25.2 35.7 31.3 27.4 17.9 35.3
British Columbia 8.2 16.5 8.7 4.1 13.0 5.0
Yukon <0.1 0.1 0.1 <0.1 0.1 <0.1
Northwest Territories and Nunavut
0.2 1.2 0.1 <0.1 0.3 0.2
Note: The indicator reports air pollutant emissions from human activities only. It does not include emissions from natural sources such as forest fires and from vegetation. The percentages have been rounded off and their sum may not add up to 100. Source: Environment and Climate Change Canada (2019) Air Pollutant Emissions Inventory.

Air pollutant emissions Page 54 of 75
Table A.4. Data for Figure 4. Total sulphur oxide emissions by source, Canada, 1990 to 2017
Year
Ore and mineral industries (emissions in kilotonnes)
Oil and gas industry
(emissions in kilotonnes)
Electric utilities
(emissions in kilotonnes)
Other sources (emissions in kilotonnes)
Total emissions (emissions in kilotonnes)
1990 1483.8 533.9 618.4 429.3 3 065.4
1991 1335.3 535.6 592.1 381.0 2 844.0
1992 1169.7 574.9 610.7 366.6 2 721.9
1993 1112.6 605.0 547.2 373.2 2 637.9
1994 891.9 598.5 559.8 375.5 2 425.8
1995 1105.9 593.9 532.7 330.4 2 562.9
1996 1089.1 590.8 542.2 350.4 2 572.4
1997 1032.1 547.3 591.4 354.4 2 525.3
1998 1019.4 513.4 603.6 353.3 2 489.7
1999 925.3 509.5 601.1 359.3 2 395.2
2000 915.9 504.7 619.2 361.2 2 401.0
2001 912.8 486.6 623.9 356.5 2 379.7
2002 895.6 457.3 624.3 351.6 2 328.8
2003 799.6 468.5 630.5 362.4 2 260.9
2004 862.6 460.3 581.6 368.4 2 272.8
2005 841.8 452.4 522.0 341.3 2 157.4
2006 810.2 415.6 458.9 269.3 1 954.1
2007 761.3 390.6 491.9 259.9 1 903.7
2008 699.9 368.7 427.5 227.3 1 723.4
2009 514.5 365.5 384.0 203.6 1 467.7
2010 489.7 332.9 334.0 198.2 1 354.9
2011 457.2 323.5 293.3 194.8 1 268.7
2012 465.2 325.2 284.3 181.0 1 255.7
2013 481.1 313.0 278.2 171.3 1 243.6
2014 477.3 280.9 269.2 170.9 1 198.3
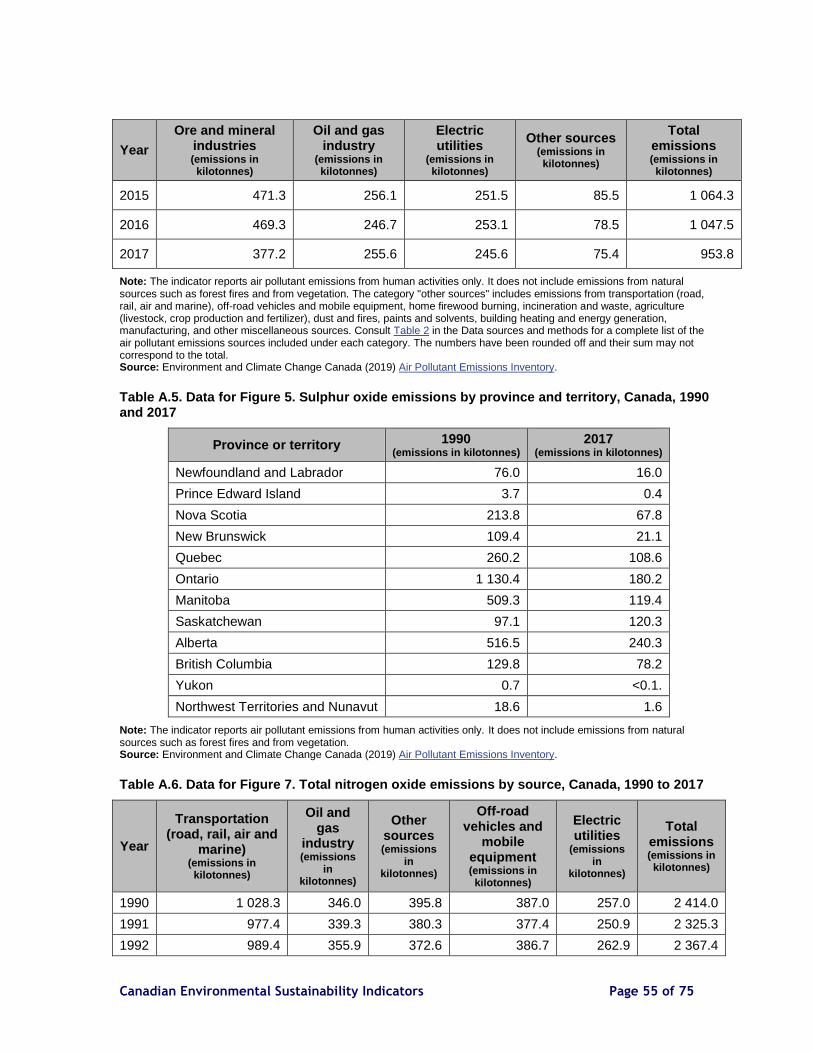
Canadian Environmental Sustainability Indicators Page 55 of 75
Year
Ore and mineral industries (emissions in kilotonnes)
Oil and gas industry
(emissions in kilotonnes)
Electric utilities
(emissions in kilotonnes)
Other sources (emissions in kilotonnes)
Total emissions (emissions in kilotonnes)
2015 471.3 256.1 251.5 85.5 1 064.3
2016 469.3 246.7 253.1 78.5 1 047.5
2017 377.2 255.6 245.6 75.4 953.8
Note: The indicator reports air pollutant emissions from human activities only. It does not include emissions from natural sources such as forest fires and from vegetation. The category "other sources" includes emissions from transportation (road, rail, air and marine), off-road vehicles and mobile equipment, home firewood burning, incineration and waste, agriculture (livestock, crop production and fertilizer), dust and fires, paints and solvents, building heating and energy generation, manufacturing, and other miscellaneous sources. Consult Table 2 in the Data sources and methods for a complete list of the air pollutant emissions sources included under each category. The numbers have been rounded off and their sum may not correspond to the total. Source: Environment and Climate Change Canada (2019) Air Pollutant Emissions Inventory.
Table A.5. Data for Figure 5. Sulphur oxide emissions by province and territory, Canada, 1990 and 2017
Province or territory 1990 (emissions in kilotonnes)
2017 (emissions in kilotonnes)
Newfoundland and Labrador 76.0 16.0
Prince Edward Island 3.7 0.4
Nova Scotia 213.8 67.8
New Brunswick 109.4 21.1
Quebec 260.2 108.6
Ontario 1 130.4 180.2
Manitoba 509.3 119.4
Saskatchewan 97.1 120.3
Alberta 516.5 240.3
British Columbia 129.8 78.2
Yukon 0.7 <0.1.
Northwest Territories and Nunavut 18.6 1.6
Note: The indicator reports air pollutant emissions from human activities only. It does not include emissions from natural sources such as forest fires and from vegetation. Source: Environment and Climate Change Canada (2019) Air Pollutant Emissions Inventory.
Table A.6. Data for Figure 7. Total nitrogen oxide emissions by source, Canada, 1990 to 2017
Year
Transportation (road, rail, air and
marine) (emissions in kilotonnes)
Oil and gas
industry (emissions
in kilotonnes)
Other sources (emissions
in kilotonnes)
Off-road vehicles and
mobile equipment (emissions in kilotonnes)
Electric utilities
(emissions in
kilotonnes)
Total emissions (emissions in kilotonnes)
1990 1 028.3 346.0 395.8 387.0 257.0 2 414.0
1991 977.4 339.3 380.3 377.4 250.9 2 325.3
1992 989.4 355.9 372.6 386.7 262.9 2 367.4
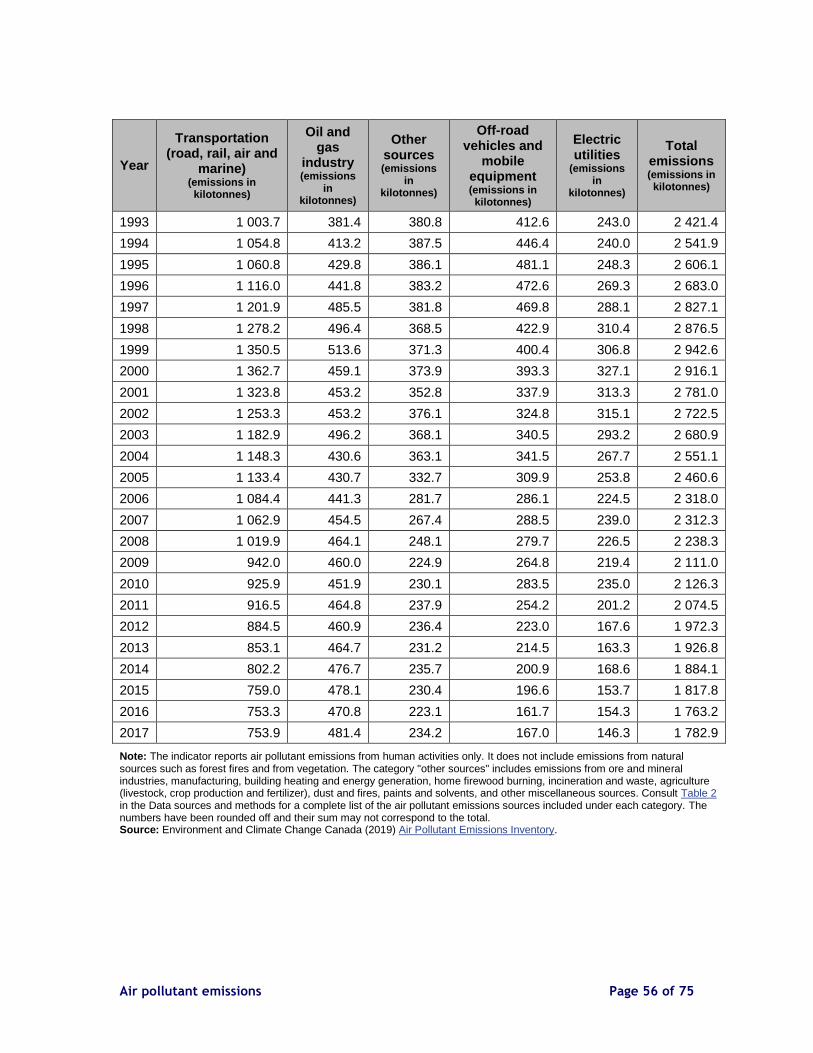
Air pollutant emissions Page 56 of 75
Year
Transportation (road, rail, air and
marine) (emissions in kilotonnes)
Oil and gas
industry (emissions
in kilotonnes)
Other sources (emissions
in kilotonnes)
Off-road vehicles and
mobile equipment (emissions in kilotonnes)
Electric utilities
(emissions in
kilotonnes)
Total emissions (emissions in kilotonnes)
1993 1 003.7 381.4 380.8 412.6 243.0 2 421.4
1994 1 054.8 413.2 387.5 446.4 240.0 2 541.9
1995 1 060.8 429.8 386.1 481.1 248.3 2 606.1
1996 1 116.0 441.8 383.2 472.6 269.3 2 683.0
1997 1 201.9 485.5 381.8 469.8 288.1 2 827.1
1998 1 278.2 496.4 368.5 422.9 310.4 2 876.5
1999 1 350.5 513.6 371.3 400.4 306.8 2 942.6
2000 1 362.7 459.1 373.9 393.3 327.1 2 916.1
2001 1 323.8 453.2 352.8 337.9 313.3 2 781.0
2002 1 253.3 453.2 376.1 324.8 315.1 2 722.5
2003 1 182.9 496.2 368.1 340.5 293.2 2 680.9
2004 1 148.3 430.6 363.1 341.5 267.7 2 551.1
2005 1 133.4 430.7 332.7 309.9 253.8 2 460.6
2006 1 084.4 441.3 281.7 286.1 224.5 2 318.0
2007 1 062.9 454.5 267.4 288.5 239.0 2 312.3
2008 1 019.9 464.1 248.1 279.7 226.5 2 238.3
2009 942.0 460.0 224.9 264.8 219.4 2 111.0
2010 925.9 451.9 230.1 283.5 235.0 2 126.3
2011 916.5 464.8 237.9 254.2 201.2 2 074.5
2012 884.5 460.9 236.4 223.0 167.6 1 972.3
2013 853.1 464.7 231.2 214.5 163.3 1 926.8
2014 802.2 476.7 235.7 200.9 168.6 1 884.1
2015 759.0 478.1 230.4 196.6 153.7 1 817.8
2016 753.3 470.8 223.1 161.7 154.3 1 763.2
2017 753.9 481.4 234.2 167.0 146.3 1 782.9
Note: The indicator reports air pollutant emissions from human activities only. It does not include emissions from natural sources such as forest fires and from vegetation. The category "other sources" includes emissions from ore and mineral industries, manufacturing, building heating and energy generation, home firewood burning, incineration and waste, agriculture (livestock, crop production and fertilizer), dust and fires, paints and solvents, and other miscellaneous sources. Consult Table 2 in the Data sources and methods for a complete list of the air pollutant emissions sources included under each category. The numbers have been rounded off and their sum may not correspond to the total. Source: Environment and Climate Change Canada (2019) Air Pollutant Emissions Inventory.
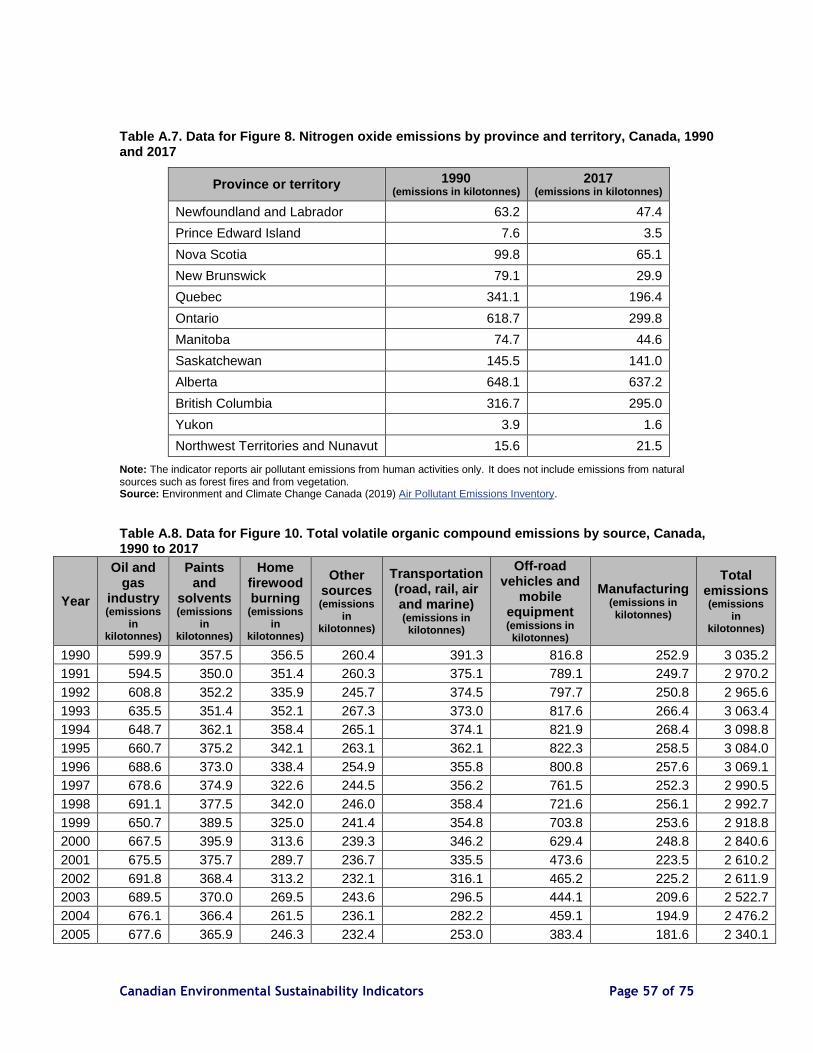
Canadian Environmental Sustainability Indicators Page 57 of 75
Table A.7. Data for Figure 8. Nitrogen oxide emissions by province and territory, Canada, 1990 and 2017
Province or territory 1990 (emissions in kilotonnes)
2017 (emissions in kilotonnes)
Newfoundland and Labrador 63.2 47.4
Prince Edward Island 7.6 3.5
Nova Scotia 99.8 65.1
New Brunswick 79.1 29.9
Quebec 341.1 196.4
Ontario 618.7 299.8
Manitoba 74.7 44.6
Saskatchewan 145.5 141.0
Alberta 648.1 637.2
British Columbia 316.7 295.0
Yukon 3.9 1.6
Northwest Territories and Nunavut 15.6 21.5
Note: The indicator reports air pollutant emissions from human activities only. It does not include emissions from natural sources such as forest fires and from vegetation. Source: Environment and Climate Change Canada (2019) Air Pollutant Emissions Inventory.
Table A.8. Data for Figure 10. Total volatile organic compound emissions by source, Canada, 1990 to 2017
Year
Oil and gas
industry (emissions
in kilotonnes)
Paints and
solvents (emissions
in kilotonnes)
Home firewood burning
(emissions in
kilotonnes)
Other sources (emissions
in kilotonnes)
Transportation (road, rail, air and marine) (emissions in kilotonnes)
Off-road vehicles and
mobile equipment (emissions in kilotonnes)
Manufacturing (emissions in kilotonnes)
Total emissions (emissions
in kilotonnes)
1990 599.9 357.5 356.5 260.4 391.3 816.8 252.9 3 035.2
1991 594.5 350.0 351.4 260.3 375.1 789.1 249.7 2 970.2
1992 608.8 352.2 335.9 245.7 374.5 797.7 250.8 2 965.6
1993 635.5 351.4 352.1 267.3 373.0 817.6 266.4 3 063.4
1994 648.7 362.1 358.4 265.1 374.1 821.9 268.4 3 098.8
1995 660.7 375.2 342.1 263.1 362.1 822.3 258.5 3 084.0
1996 688.6 373.0 338.4 254.9 355.8 800.8 257.6 3 069.1
1997 678.6 374.9 322.6 244.5 356.2 761.5 252.3 2 990.5
1998 691.1 377.5 342.0 246.0 358.4 721.6 256.1 2 992.7
1999 650.7 389.5 325.0 241.4 354.8 703.8 253.6 2 918.8
2000 667.5 395.9 313.6 239.3 346.2 629.4 248.8 2 840.6
2001 675.5 375.7 289.7 236.7 335.5 473.6 223.5 2 610.2
2002 691.8 368.4 313.2 232.1 316.1 465.2 225.2 2 611.9
2003 689.5 370.0 269.5 243.6 296.5 444.1 209.6 2 522.7
2004 676.1 366.4 261.5 236.1 282.2 459.1 194.9 2 476.2
2005 677.6 365.9 246.3 232.4 253.0 383.4 181.6 2 340.1

Air pollutant emissions Page 58 of 75
Year
Oil and gas
industry (emissions
in kilotonnes)
Paints and
solvents (emissions
in kilotonnes)
Home firewood burning
(emissions in
kilotonnes)
Other sources (emissions
in kilotonnes)
Transportation (road, rail, air and marine) (emissions in kilotonnes)
Off-road vehicles and
mobile equipment (emissions in kilotonnes)
Manufacturing (emissions in kilotonnes)
Total emissions (emissions
in kilotonnes)
2006 665.4 351.0 237.7 219.6 235.5 366.1 159.4 2 234.7
2007 661.4 348.9 234.9 214.4 232.9 359.0 144.5 2 195.9
2008 673.4 339.9 235.3 209.3 241.9 335.1 129.6 2 164.5
2009 630.4 309.6 224.3 207.3 206.5 320.4 111.2 2 009.8
2010 634.6 316.4 235.9 206.0 200.6 310.5 116.4 2 020.4
2011 627.6 304.4 235.2 205.3 186.7 207.9 114.7 1 881.8
2012 682.0 309.2 234.4 202.3 178.2 181.1 115.1 1 902.3
2013 737.3 313.0 233.0 197.6 171.2 167.4 114.4 1 934.0
2014 767.2 322.2 231.5 203.9 158.2 161.5 107.4 1 951.9
2015 727.8 325.2 230.0 200.8 154.2 154.0 103.4 1 895.5
2016 661.0 326.0 231.3 199.2 158.5 128.7 101.9 1 806.6
2017 662.7 334.6 229.9 199.0 156.8 131.6 96.7 1 811.2
Note: The indicator reports air pollutant emissions from human activities only. It does not include emissions from natural sources such as forest fires and from vegetation. The category "other sources" includes emissions from incineration and waste, ore and mineral industries, dust and fires, building heating and energy generation, electric utilities, agriculture (livestock, crop production and fertilizer) and other miscellaneous sources. Consult Table 2 in the Data sources and methods for a complete list of the air pollutant emissions sources included under each category. The numbers have been rounded off and their sum may not correspond to the total. Source: Environment and Climate Change Canada (2019) Air Pollutant Emissions Inventory.
Table A.9. Data for Figure 11. Volatile organic compound emissions by province and territory, Canada, 1990 and 2017
Province or territory 1990
(emissions in kilotonnes)
2017 (emissions in kilotonnes)
Newfoundland and Labrador 54.6 29.1
Prince Edward Island 12.5 7.1
Nova Scotia 78.5 39.9
New Brunswick 89.8 34.4
Quebec 576.4 291.1
Ontario 904.6 359.6
Manitoba 97.4 62.3
Saskatchewan 170.8 259.8
Alberta 660.7 566.3
British Columbia 377.4 158.2
Yukon 2.0 0.9
Northwest Territories and Nunavut 10.4 2.5
Note: The indicator reports air pollutant emissions from human activities only. It does not include emissions from natural sources such as forest fires and from vegetation. Source: Environment and Climate Change Canada (2019) Air Pollutant Emissions Inventory.
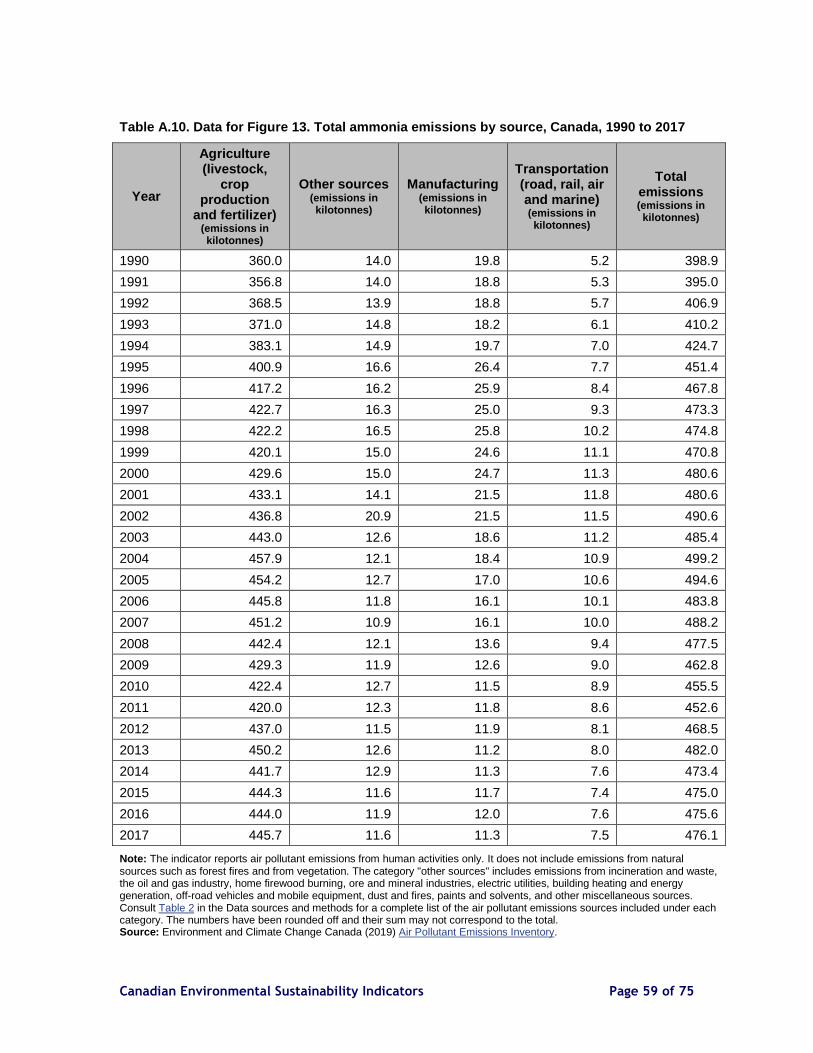
Canadian Environmental Sustainability Indicators Page 59 of 75
Table A.10. Data for Figure 13. Total ammonia emissions by source, Canada, 1990 to 2017
Year
Agriculture (livestock,
crop production
and fertilizer) (emissions in kilotonnes)
Other sources (emissions in kilotonnes)
Manufacturing (emissions in kilotonnes)
Transportation (road, rail, air and marine) (emissions in kilotonnes)
Total emissions (emissions in kilotonnes)
1990 360.0 14.0 19.8 5.2 398.9
1991 356.8 14.0 18.8 5.3 395.0
1992 368.5 13.9 18.8 5.7 406.9
1993 371.0 14.8 18.2 6.1 410.2
1994 383.1 14.9 19.7 7.0 424.7
1995 400.9 16.6 26.4 7.7 451.4
1996 417.2 16.2 25.9 8.4 467.8
1997 422.7 16.3 25.0 9.3 473.3
1998 422.2 16.5 25.8 10.2 474.8
1999 420.1 15.0 24.6 11.1 470.8
2000 429.6 15.0 24.7 11.3 480.6
2001 433.1 14.1 21.5 11.8 480.6
2002 436.8 20.9 21.5 11.5 490.6
2003 443.0 12.6 18.6 11.2 485.4
2004 457.9 12.1 18.4 10.9 499.2
2005 454.2 12.7 17.0 10.6 494.6
2006 445.8 11.8 16.1 10.1 483.8
2007 451.2 10.9 16.1 10.0 488.2
2008 442.4 12.1 13.6 9.4 477.5
2009 429.3 11.9 12.6 9.0 462.8
2010 422.4 12.7 11.5 8.9 455.5
2011 420.0 12.3 11.8 8.6 452.6
2012 437.0 11.5 11.9 8.1 468.5
2013 450.2 12.6 11.2 8.0 482.0
2014 441.7 12.9 11.3 7.6 473.4
2015 444.3 11.6 11.7 7.4 475.0
2016 444.0 11.9 12.0 7.6 475.6
2017 445.7 11.6 11.3 7.5 476.1
Note: The indicator reports air pollutant emissions from human activities only. It does not include emissions from natural sources such as forest fires and from vegetation. The category "other sources" includes emissions from incineration and waste, the oil and gas industry, home firewood burning, ore and mineral industries, electric utilities, building heating and energy generation, off-road vehicles and mobile equipment, dust and fires, paints and solvents, and other miscellaneous sources. Consult Table 2 in the Data sources and methods for a complete list of the air pollutant emissions sources included under each category. The numbers have been rounded off and their sum may not correspond to the total. Source: Environment and Climate Change Canada (2019) Air Pollutant Emissions Inventory.

Air pollutant emissions Page 60 of 75
Table A.11. Data for Figure 14. Ammonia emissions by province and territory, Canada, 1990 and 2017
Province or territory 1990 (emissions in kilotonnes)
2017 (emissions in kilotonnes)
Newfoundland and Labrador 1.1 1.0
Prince Edward Island 3.5 2.7
Nova Scotia 5.0 3.4
New Brunswick 4.6 3.4
Quebec 67.0 63.8
Ontario 112.1 87.5
Manitoba 38.4 60.9
Saskatchewan 48.9 103.3
Alberta 95.7 130.6
British Columbia 22.6 19.6
Yukon <0.1 <0.1
Northwest Territories and Nunavut <0.1 <0.1
Note: The indicator reports air pollutant emissions from human activities only. It does not include emissions from natural sources such as forest fires and from vegetation. Source: Environment and Climate Change Canada (2019) Air Pollutant Emissions Inventory.
Table A.12. Data for Figure 16. Total carbon monoxide emissions by source, Canada, 1990 to 2017
Year
Transportation (road, rail, air and
marine) (emissions in kilotonnes)
Off-road vehicles and
mobile equipment (emissions in kilotonnes)
Home firewood burning
(emissions in kilotonnes)
Other sources
(emissions in kilotonnes)
Oil and gas
industry (emissions in kilotonnes)
Total emissions (emissions in kilotonnes)
1990 5 530.3 2 581.7 1 660.4 2 277.1 336.3 12 385.8
1991 5 321.9 2 511.4 1 636.4 2 373.5 324.8 12 168.0
1992 5 320.2 2 572.2 1 564.8 2 199.9 339.6 11 996.7
1993 5 305.5 2 640.0 1 637.9 2 378.9 363.1 12 325.4
1994 5 281.4 2 672.0 1 668.5 2 324.8 399.4 12 346.2
1995 5 067.6 2 720.3 1 593.1 2 367.1 407.9 12 156.0
1996 4 968.7 2 698.4 1 573.8 2 116.3 420.0 11 777.2
1997 4 968.2 2 606.6 1 502.7 1 849.2 469.8 11 396.5
1998 5 001.3 2 532.2 1 597.0 1 760.4 486.9 11 377.8
1999 4 895.0 2 525.4 1 521.8 1 688.7 499.3 11 130.2
2000 4 969.6 2 352.2 1 472.7 1 618.6 443.7 10 856.8
2001 4 716.3 1 956.4 1 364.1 1 510.2 467.8 10 014.8
2002 4 388.4 2 016.4 1 482.7 1 438.4 499.5 9825.5
2003 4 163.5 2 023.7 1 278.9 1 509.5 530.2 9505.7
2004 3 837.5 2 151.0 1 247.9 1 212.8 502.7 8951.9
2005 3 157.1 1 969.5 1 180.0 1 168.9 494.9 7970.5
2006 2 858.8 1 981.2 1 144.8 978.7 505.6 7469.1
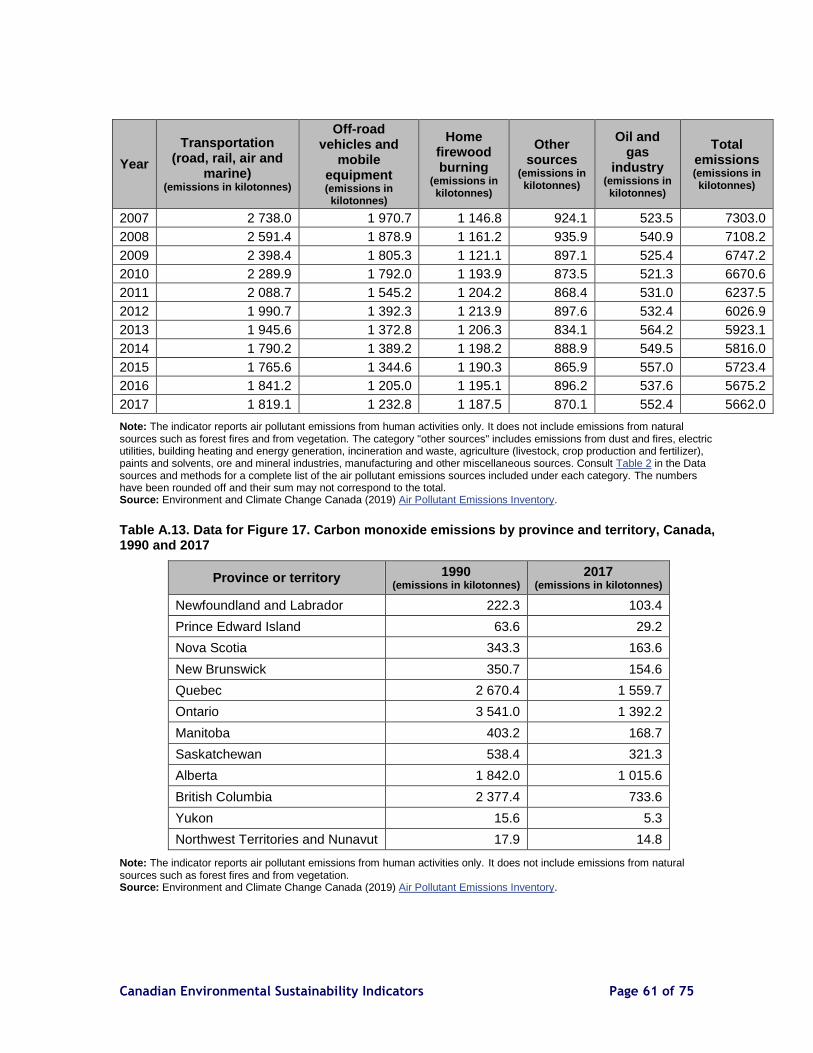
Canadian Environmental Sustainability Indicators Page 61 of 75
Year
Transportation (road, rail, air and
marine) (emissions in kilotonnes)
Off-road vehicles and
mobile equipment (emissions in kilotonnes)
Home firewood burning
(emissions in kilotonnes)
Other sources
(emissions in kilotonnes)
Oil and gas
industry (emissions in kilotonnes)
Total emissions (emissions in kilotonnes)
2007 2 738.0 1 970.7 1 146.8 924.1 523.5 7303.0
2008 2 591.4 1 878.9 1 161.2 935.9 540.9 7108.2
2009 2 398.4 1 805.3 1 121.1 897.1 525.4 6747.2
2010 2 289.9 1 792.0 1 193.9 873.5 521.3 6670.6
2011 2 088.7 1 545.2 1 204.2 868.4 531.0 6237.5
2012 1 990.7 1 392.3 1 213.9 897.6 532.4 6026.9
2013 1 945.6 1 372.8 1 206.3 834.1 564.2 5923.1
2014 1 790.2 1 389.2 1 198.2 888.9 549.5 5816.0
2015 1 765.6 1 344.6 1 190.3 865.9 557.0 5723.4
2016 1 841.2 1 205.0 1 195.1 896.2 537.6 5675.2
2017 1 819.1 1 232.8 1 187.5 870.1 552.4 5662.0
Note: The indicator reports air pollutant emissions from human activities only. It does not include emissions from natural sources such as forest fires and from vegetation. The category "other sources" includes emissions from dust and fires, electric utilities, building heating and energy generation, incineration and waste, agriculture (livestock, crop production and fertilizer), paints and solvents, ore and mineral industries, manufacturing and other miscellaneous sources. Consult Table 2 in the Data sources and methods for a complete list of the air pollutant emissions sources included under each category. The numbers have been rounded off and their sum may not correspond to the total. Source: Environment and Climate Change Canada (2019) Air Pollutant Emissions Inventory.
Table A.13. Data for Figure 17. Carbon monoxide emissions by province and territory, Canada, 1990 and 2017
Province or territory 1990 (emissions in kilotonnes)
2017 (emissions in kilotonnes)
Newfoundland and Labrador 222.3 103.4
Prince Edward Island 63.6 29.2
Nova Scotia 343.3 163.6
New Brunswick 350.7 154.6
Quebec 2 670.4 1 559.7
Ontario 3 541.0 1 392.2
Manitoba 403.2 168.7
Saskatchewan 538.4 321.3
Alberta 1 842.0 1 015.6
British Columbia 2 377.4 733.6
Yukon 15.6 5.3
Northwest Territories and Nunavut 17.9 14.8
Note: The indicator reports air pollutant emissions from human activities only. It does not include emissions from natural sources such as forest fires and from vegetation. Source: Environment and Climate Change Canada (2019) Air Pollutant Emissions Inventory.
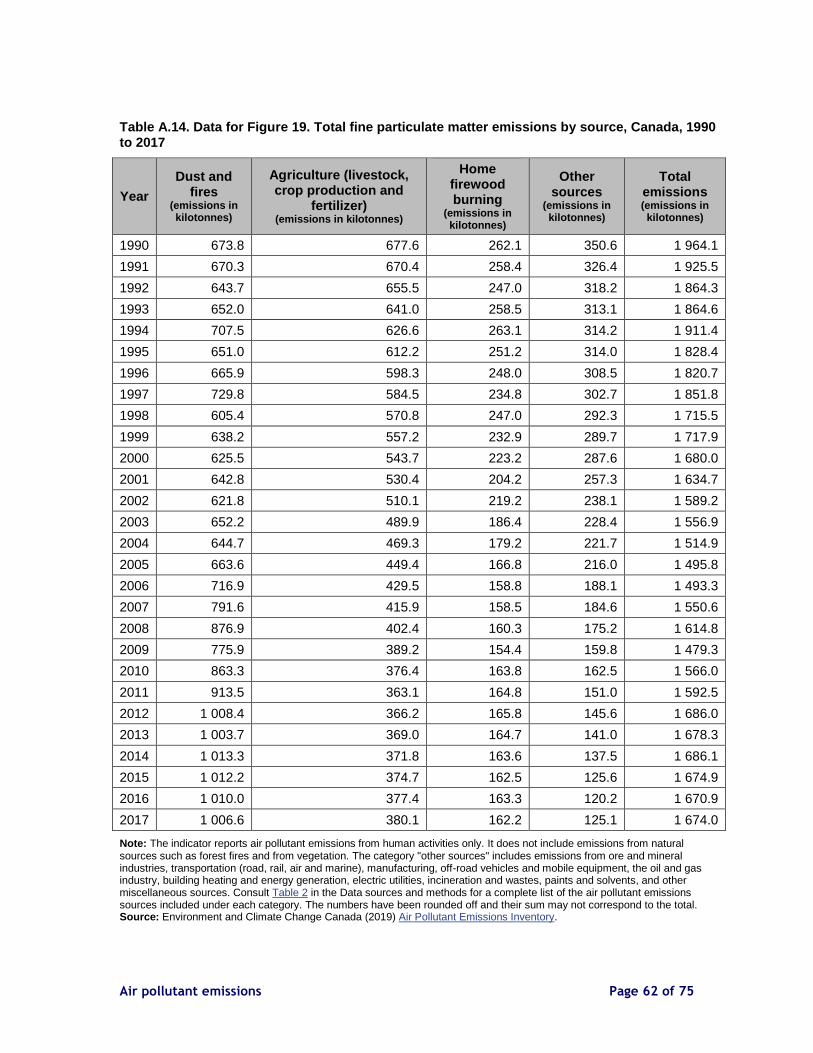
Air pollutant emissions Page 62 of 75
Table A.14. Data for Figure 19. Total fine particulate matter emissions by source, Canada, 1990 to 2017
Year
Dust and fires
(emissions in kilotonnes)
Agriculture (livestock, crop production and
fertilizer) (emissions in kilotonnes)
Home firewood burning
(emissions in kilotonnes)
Other sources
(emissions in kilotonnes)
Total emissions (emissions in kilotonnes)
1990 673.8 677.6 262.1 350.6 1 964.1
1991 670.3 670.4 258.4 326.4 1 925.5
1992 643.7 655.5 247.0 318.2 1 864.3
1993 652.0 641.0 258.5 313.1 1 864.6
1994 707.5 626.6 263.1 314.2 1 911.4
1995 651.0 612.2 251.2 314.0 1 828.4
1996 665.9 598.3 248.0 308.5 1 820.7
1997 729.8 584.5 234.8 302.7 1 851.8
1998 605.4 570.8 247.0 292.3 1 715.5
1999 638.2 557.2 232.9 289.7 1 717.9
2000 625.5 543.7 223.2 287.6 1 680.0
2001 642.8 530.4 204.2 257.3 1 634.7
2002 621.8 510.1 219.2 238.1 1 589.2
2003 652.2 489.9 186.4 228.4 1 556.9
2004 644.7 469.3 179.2 221.7 1 514.9
2005 663.6 449.4 166.8 216.0 1 495.8
2006 716.9 429.5 158.8 188.1 1 493.3
2007 791.6 415.9 158.5 184.6 1 550.6
2008 876.9 402.4 160.3 175.2 1 614.8
2009 775.9 389.2 154.4 159.8 1 479.3
2010 863.3 376.4 163.8 162.5 1 566.0
2011 913.5 363.1 164.8 151.0 1 592.5
2012 1 008.4 366.2 165.8 145.6 1 686.0
2013 1 003.7 369.0 164.7 141.0 1 678.3
2014 1 013.3 371.8 163.6 137.5 1 686.1
2015 1 012.2 374.7 162.5 125.6 1 674.9
2016 1 010.0 377.4 163.3 120.2 1 670.9
2017 1 006.6 380.1 162.2 125.1 1 674.0
Note: The indicator reports air pollutant emissions from human activities only. It does not include emissions from natural sources such as forest fires and from vegetation. The category "other sources" includes emissions from ore and mineral industries, transportation (road, rail, air and marine), manufacturing, off-road vehicles and mobile equipment, the oil and gas industry, building heating and energy generation, electric utilities, incineration and wastes, paints and solvents, and other miscellaneous sources. Consult Table 2 in the Data sources and methods for a complete list of the air pollutant emissions sources included under each category. The numbers have been rounded off and their sum may not correspond to the total. Source: Environment and Climate Change Canada (2019) Air Pollutant Emissions Inventory.
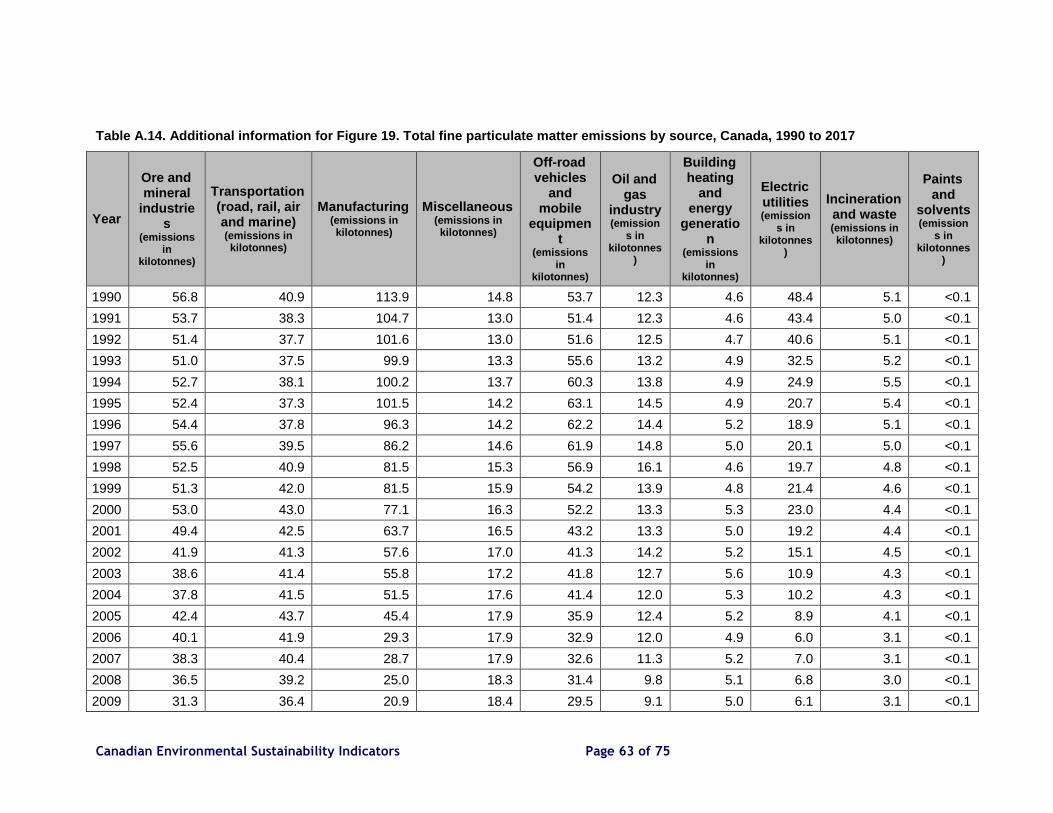
Canadian Environmental Sustainability Indicators Page 63 of 75
Table A.14. Additional information for Figure 19. Total fine particulate matter emissions by source, Canada, 1990 to 2017
Year
Ore and mineral
industries
(emissions in
kilotonnes)
Transportation (road, rail, air and marine) (emissions in kilotonnes)
Manufacturing
(emissions in kilotonnes)
Miscellaneous (emissions in kilotonnes)
Off-road vehicles
and mobile
equipment
(emissions in
kilotonnes)
Oil and gas
industry (emission
s in kilotonnes
)
Building heating
and energy
generation
(emissions in
kilotonnes)
Electric utilities (emission
s in kilotonnes
)
Incineration and waste (emissions in kilotonnes)
Paints and
solvents (emission
s in kilotonnes
)
1990 56.8 40.9 113.9 14.8 53.7 12.3 4.6 48.4 5.1 <0.1
1991 53.7 38.3 104.7 13.0 51.4 12.3 4.6 43.4 5.0 <0.1
1992 51.4 37.7 101.6 13.0 51.6 12.5 4.7 40.6 5.1 <0.1
1993 51.0 37.5 99.9 13.3 55.6 13.2 4.9 32.5 5.2 <0.1
1994 52.7 38.1 100.2 13.7 60.3 13.8 4.9 24.9 5.5 <0.1
1995 52.4 37.3 101.5 14.2 63.1 14.5 4.9 20.7 5.4 <0.1
1996 54.4 37.8 96.3 14.2 62.2 14.4 5.2 18.9 5.1 <0.1
1997 55.6 39.5 86.2 14.6 61.9 14.8 5.0 20.1 5.0 <0.1
1998 52.5 40.9 81.5 15.3 56.9 16.1 4.6 19.7 4.8 <0.1
1999 51.3 42.0 81.5 15.9 54.2 13.9 4.8 21.4 4.6 <0.1
2000 53.0 43.0 77.1 16.3 52.2 13.3 5.3 23.0 4.4 <0.1
2001 49.4 42.5 63.7 16.5 43.2 13.3 5.0 19.2 4.4 <0.1
2002 41.9 41.3 57.6 17.0 41.3 14.2 5.2 15.1 4.5 <0.1
2003 38.6 41.4 55.8 17.2 41.8 12.7 5.6 10.9 4.3 <0.1
2004 37.8 41.5 51.5 17.6 41.4 12.0 5.3 10.2 4.3 <0.1
2005 42.4 43.7 45.4 17.9 35.9 12.4 5.2 8.9 4.1 <0.1
2006 40.1 41.9 29.3 17.9 32.9 12.0 4.9 6.0 3.1 <0.1
2007 38.3 40.4 28.7 17.9 32.6 11.3 5.2 7.0 3.1 <0.1
2008 36.5 39.2 25.0 18.3 31.4 9.8 5.1 6.8 3.0 <0.1
2009 31.3 36.4 20.9 18.4 29.5 9.1 5.0 6.1 3.1 <0.1
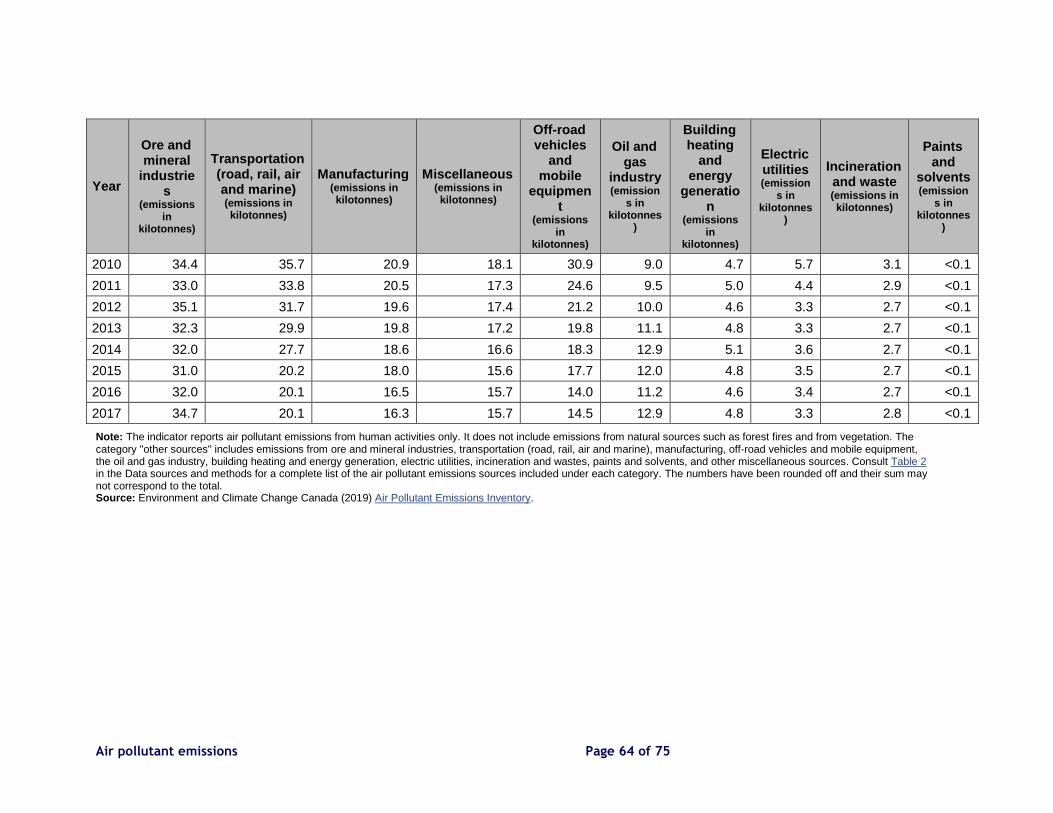
Air pollutant emissions Page 64 of 75
Year
Ore and mineral
industries
(emissions in
kilotonnes)
Transportation (road, rail, air and marine) (emissions in kilotonnes)
Manufacturing
(emissions in kilotonnes)
Miscellaneous (emissions in kilotonnes)
Off-road vehicles
and mobile
equipment
(emissions in
kilotonnes)
Oil and gas
industry (emission
s in kilotonnes
)
Building heating
and energy
generation
(emissions in
kilotonnes)
Electric utilities (emission
s in kilotonnes
)
Incineration and waste (emissions in kilotonnes)
Paints and
solvents (emission
s in kilotonnes
)
2010 34.4 35.7 20.9 18.1 30.9 9.0 4.7 5.7 3.1 <0.1
2011 33.0 33.8 20.5 17.3 24.6 9.5 5.0 4.4 2.9 <0.1
2012 35.1 31.7 19.6 17.4 21.2 10.0 4.6 3.3 2.7 <0.1
2013 32.3 29.9 19.8 17.2 19.8 11.1 4.8 3.3 2.7 <0.1
2014 32.0 27.7 18.6 16.6 18.3 12.9 5.1 3.6 2.7 <0.1
2015 31.0 20.2 18.0 15.6 17.7 12.0 4.8 3.5 2.7 <0.1
2016 32.0 20.1 16.5 15.7 14.0 11.2 4.6 3.4 2.7 <0.1
2017 34.7 20.1 16.3 15.7 14.5 12.9 4.8 3.3 2.8 <0.1
Note: The indicator reports air pollutant emissions from human activities only. It does not include emissions from natural sources such as forest fires and from vegetation. The category "other sources" includes emissions from ore and mineral industries, transportation (road, rail, air and marine), manufacturing, off-road vehicles and mobile equipment, the oil and gas industry, building heating and energy generation, electric utilities, incineration and wastes, paints and solvents, and other miscellaneous sources. Consult Table 2 in the Data sources and methods for a complete list of the air pollutant emissions sources included under each category. The numbers have been rounded off and their sum may not correspond to the total. Source: Environment and Climate Change Canada (2019) Air Pollutant Emissions Inventory.
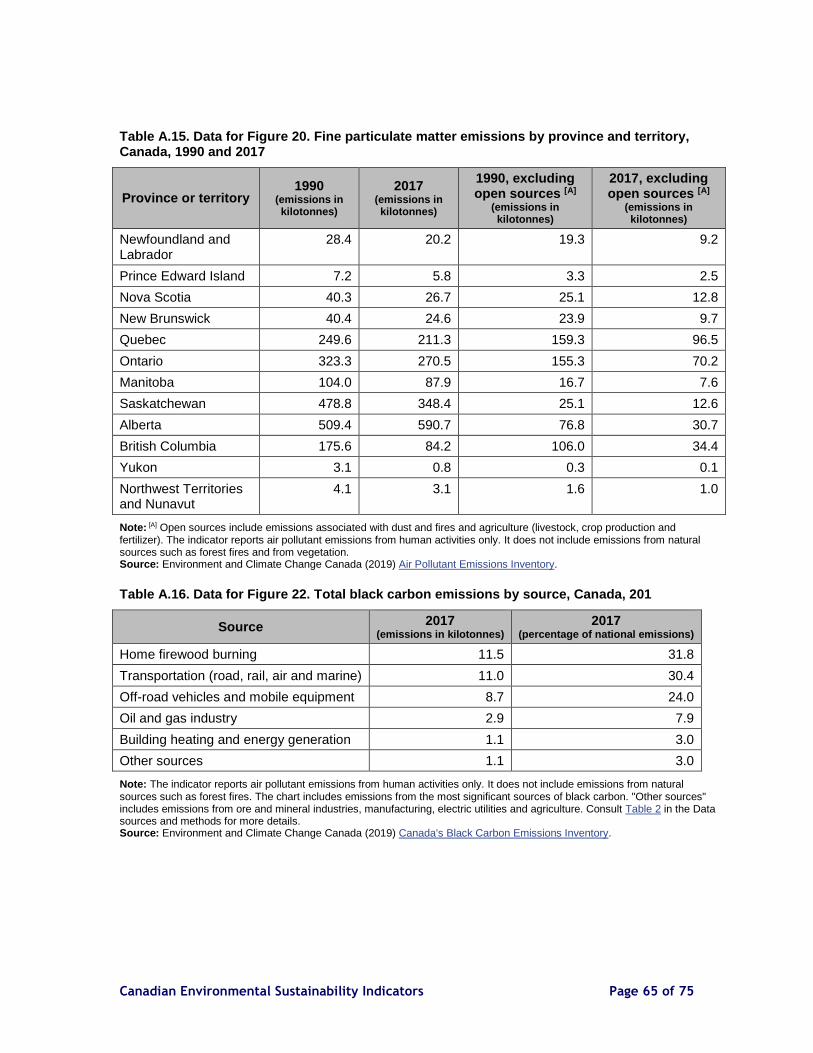
Canadian Environmental Sustainability Indicators Page 65 of 75
Table A.15. Data for Figure 20. Fine particulate matter emissions by province and territory, Canada, 1990 and 2017
Province or territory 1990
(emissions in kilotonnes)
2017 (emissions in kilotonnes)
1990, excluding open sources [A]
(emissions in kilotonnes)
2017, excluding open sources [A]
(emissions in kilotonnes)
Newfoundland and Labrador
28.4 20.2 19.3 9.2
Prince Edward Island 7.2 5.8 3.3 2.5
Nova Scotia 40.3 26.7 25.1 12.8
New Brunswick 40.4 24.6 23.9 9.7
Quebec 249.6 211.3 159.3 96.5
Ontario 323.3 270.5 155.3 70.2
Manitoba 104.0 87.9 16.7 7.6
Saskatchewan 478.8 348.4 25.1 12.6
Alberta 509.4 590.7 76.8 30.7
British Columbia 175.6 84.2 106.0 34.4
Yukon 3.1 0.8 0.3 0.1
Northwest Territories and Nunavut
4.1 3.1 1.6 1.0
Note: [A] Open sources include emissions associated with dust and fires and agriculture (livestock, crop production and
fertilizer). The indicator reports air pollutant emissions from human activities only. It does not include emissions from natural sources such as forest fires and from vegetation. Source: Environment and Climate Change Canada (2019) Air Pollutant Emissions Inventory.
Table A.16. Data for Figure 22. Total black carbon emissions by source, Canada, 201
Source 2017 (emissions in kilotonnes)
2017 (percentage of national emissions)
Home firewood burning 11.5 31.8
Transportation (road, rail, air and marine) 11.0 30.4
Off-road vehicles and mobile equipment 8.7 24.0
Oil and gas industry 2.9 7.9
Building heating and energy generation 1.1 3.0
Other sources 1.1 3.0
Note: The indicator reports air pollutant emissions from human activities only. It does not include emissions from natural sources such as forest fires. The chart includes emissions from the most significant sources of black carbon. "Other sources" includes emissions from ore and mineral industries, manufacturing, electric utilities and agriculture. Consult Table 2 in the Data sources and methods for more details. Source: Environment and Climate Change Canada (2019) Canada's Black Carbon Emissions Inventory.
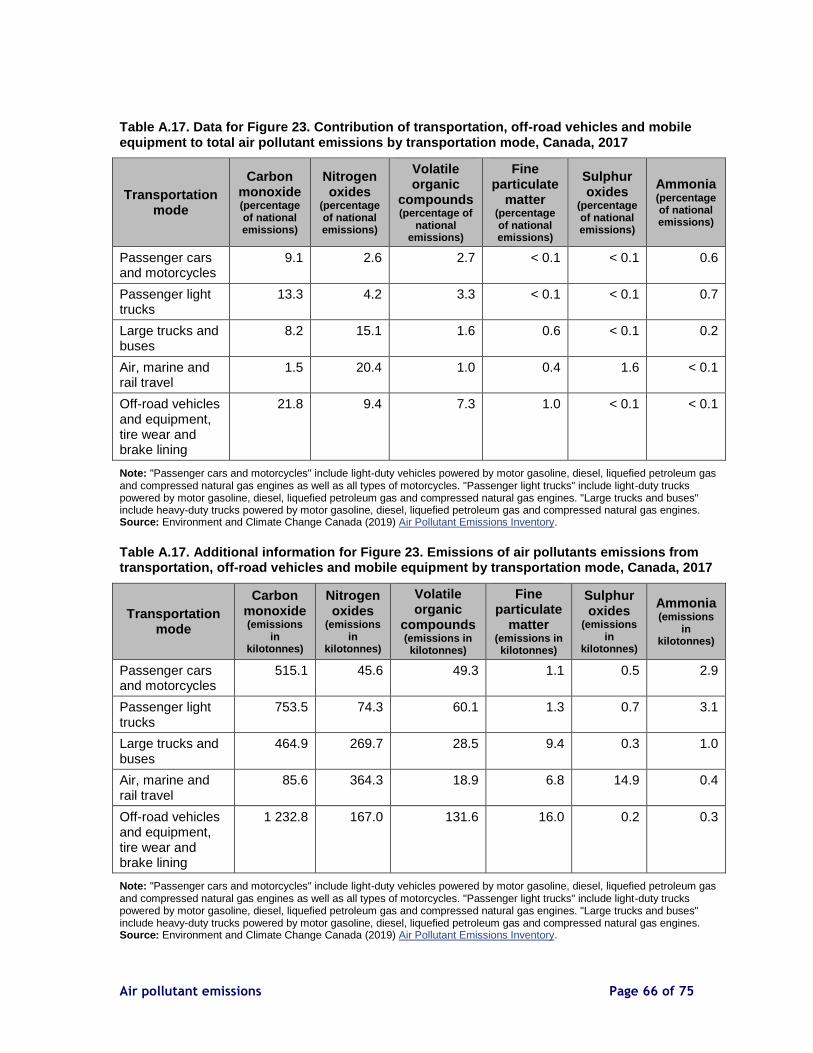
Air pollutant emissions Page 66 of 75
Table A.17. Data for Figure 23. Contribution of transportation, off-road vehicles and mobile equipment to total air pollutant emissions by transportation mode, Canada, 2017
Transportation mode
Carbon monoxide (percentage of national emissions)
Nitrogen oxides
(percentage of national emissions)
Volatile organic
compounds (percentage of
national emissions)
Fine particulate
matter (percentage of national emissions)
Sulphur oxides
(percentage of national emissions)
Ammonia (percentage of national emissions)
Passenger cars and motorcycles
9.1 2.6 2.7 < 0.1 < 0.1 0.6
Passenger light trucks
13.3 4.2 3.3 < 0.1 < 0.1 0.7
Large trucks and buses
8.2 15.1 1.6 0.6 < 0.1 0.2
Air, marine and rail travel
1.5 20.4 1.0 0.4 1.6 < 0.1
Off-road vehicles and equipment, tire wear and brake lining
21.8 9.4 7.3 1.0 < 0.1 < 0.1
Note: "Passenger cars and motorcycles" include light-duty vehicles powered by motor gasoline, diesel, liquefied petroleum gas and compressed natural gas engines as well as all types of motorcycles. "Passenger light trucks" include light-duty trucks powered by motor gasoline, diesel, liquefied petroleum gas and compressed natural gas engines. "Large trucks and buses" include heavy-duty trucks powered by motor gasoline, diesel, liquefied petroleum gas and compressed natural gas engines. Source: Environment and Climate Change Canada (2019) Air Pollutant Emissions Inventory.
Table A.17. Additional information for Figure 23. Emissions of air pollutants emissions from transportation, off-road vehicles and mobile equipment by transportation mode, Canada, 2017
Transportation mode
Carbon monoxide (emissions
in kilotonnes)
Nitrogen oxides
(emissions in
kilotonnes)
Volatile organic
compounds (emissions in kilotonnes)
Fine particulate
matter (emissions in kilotonnes)
Sulphur oxides
(emissions in
kilotonnes)
Ammonia (emissions
in kilotonnes)
Passenger cars and motorcycles
515.1 45.6 49.3 1.1 0.5 2.9
Passenger light trucks
753.5 74.3 60.1 1.3 0.7 3.1
Large trucks and buses
464.9 269.7 28.5 9.4 0.3 1.0
Air, marine and rail travel
85.6 364.3 18.9 6.8 14.9 0.4
Off-road vehicles and equipment, tire wear and brake lining
1 232.8 167.0 131.6 16.0 0.2 0.3
Note: "Passenger cars and motorcycles" include light-duty vehicles powered by motor gasoline, diesel, liquefied petroleum gas and compressed natural gas engines as well as all types of motorcycles. "Passenger light trucks" include light-duty trucks powered by motor gasoline, diesel, liquefied petroleum gas and compressed natural gas engines. "Large trucks and buses" include heavy-duty trucks powered by motor gasoline, diesel, liquefied petroleum gas and compressed natural gas engines. Source: Environment and Climate Change Canada (2019) Air Pollutant Emissions Inventory.

Canadian Environmental Sustainability Indicators Page 67 of 75
Table A.18. Data for Figure 24. Changes in emissions of key air pollutants from transportation, off-road vehicles and mobile equipment, Canada, 1990 to 2017
Year Nitrogen oxides
(percentage change from 1990 level)
Carbon monoxide (percentage change from 1990
level)
Volatile organic compounds
(percentage change from 1990 level)
1990 0 0 0
1991 -4 -3 -4
1992 -3 -3 -3
1993 0 -2 -1
1994 6 -2 -1
1995 9 -4 -2
1996 12 -5 -4
1997 18 -7 -7
1998 20 -7 -11
1999 24 -9 -12
2000 24 -10 -19
2001 17 -18 -33
2002 11 -21 -35
2003 8 -24 -39
2004 5 -26 -39
2005 2 -37 -47
2006 -3 -40 -50
2007 -5 -42 -51
2008 -8 -45 -52
2009 -15 -48 -56
2010 -15 -50 -58
2011 -17 -55 -67
2012 -22 -58 -70
2013 -25 -59 -72
2014 -29 -61 -74
2015 -32 -62 -74
2016 -35 -62 -76
2017 -35 -62 -76
Note: Fine particulate matter, sulphur oxides and ammonia are not shown in the chart due to their low share (≤ 5%) of total emissions in 2017. Source: Environment and Climate Change Canada (2019) Air Pollutant Emissions Inventory.
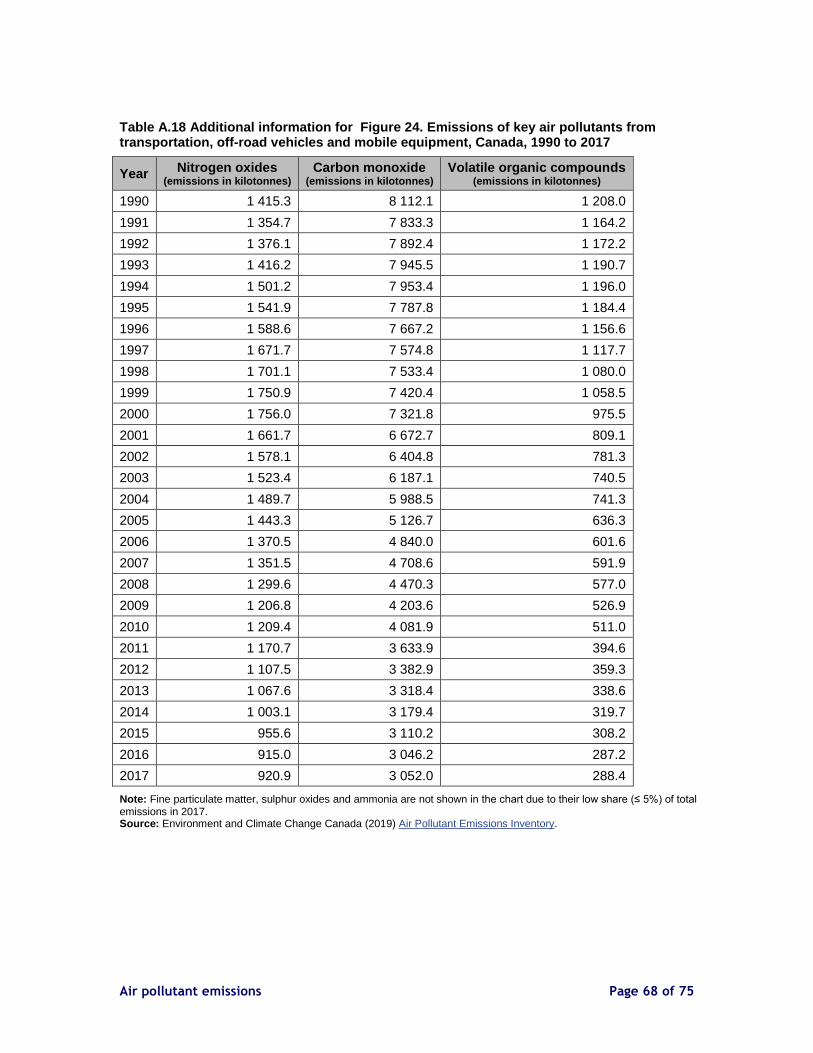
Air pollutant emissions Page 68 of 75
Table A.18 Additional information for Figure 24. Emissions of key air pollutants from transportation, off-road vehicles and mobile equipment, Canada, 1990 to 2017
Year Nitrogen oxides (emissions in kilotonnes)
Carbon monoxide (emissions in kilotonnes)
Volatile organic compounds (emissions in kilotonnes)
1990 1 415.3 8 112.1 1 208.0
1991 1 354.7 7 833.3 1 164.2
1992 1 376.1 7 892.4 1 172.2
1993 1 416.2 7 945.5 1 190.7
1994 1 501.2 7 953.4 1 196.0
1995 1 541.9 7 787.8 1 184.4
1996 1 588.6 7 667.2 1 156.6
1997 1 671.7 7 574.8 1 117.7
1998 1 701.1 7 533.4 1 080.0
1999 1 750.9 7 420.4 1 058.5
2000 1 756.0 7 321.8 975.5
2001 1 661.7 6 672.7 809.1
2002 1 578.1 6 404.8 781.3
2003 1 523.4 6 187.1 740.5
2004 1 489.7 5 988.5 741.3
2005 1 443.3 5 126.7 636.3
2006 1 370.5 4 840.0 601.6
2007 1 351.5 4 708.6 591.9
2008 1 299.6 4 470.3 577.0
2009 1 206.8 4 203.6 526.9
2010 1 209.4 4 081.9 511.0
2011 1 170.7 3 633.9 394.6
2012 1 107.5 3 382.9 359.3
2013 1 067.6 3 318.4 338.6
2014 1 003.1 3 179.4 319.7
2015 955.6 3 110.2 308.2
2016 915.0 3 046.2 287.2
2017 920.9 3 052.0 288.4
Note: Fine particulate matter, sulphur oxides and ammonia are not shown in the chart due to their low share (≤ 5%) of total emissions in 2017. Source: Environment and Climate Change Canada (2019) Air Pollutant Emissions Inventory.

Canadian Environmental Sustainability Indicators Page 69 of 75
Table A.19. Data for Figure 25. Contribution of electric utilities to total air pollutant emissions by fuel source, Canada, 2017
Fuel source
Sulphur oxides
(percentage of national emissions)
Nitrogen oxides
(percentage of national emissions)
Carbon monoxide
(percentage of national
emissions)
Fine particulate
matter (percentage of
national emissions)
Volatile organic
compounds (percentage of
national emissions)
Ammonia (percentage of
national emissions)
Coal 24.8 6.2 0.3 0.1 <0.1 <0.1
Natural gas 0.1 0.9 0.2 <0.1 <0.1 <0.1
Diesel <0.1 0.5 <0.1 <0.1 <0.1 n/a
Other sources 0.9 0.6 0.1 <0.1 <0.1 <0.1
Note: Carbon monoxide, fine particulate matter, volatile organic compounds and ammonia are not shown in the chart due to their low share (≤ 1%) of total emissions in 2017. Excludes emissions from industries that generate electricity and heat as a supporting activity rather than as their primary purpose. "Other" fuel sources include waste material and other uncategorized sources of electricity generation. Source: Environment and Climate Change Canada (2019) Air Pollutant Emissions Inventory.

Air pollutant emissions Page 70 of 75
Table A.19. Additional information for Figure 25. Emissions of air pollutants from electric utilities by fuel source, Canada, 2017
Fuel source
Sulphur oxides
(emissions in kilotonnes)
Nitrogen oxides
(emissions in kilotonnes)
Carbon monoxide (emissions in kilotonnes)
Fine particulate
matter (emissions in kilotonnes)
Volatile organic
compounds (emissions in kilotonnes)
Ammonia (emissions in kilotonnes)
Coal 236.1 110.4 18.7 2.2 0.4 0.2
Natural gas 1.1 15.8 14.0 0.3 0.5 <0.1
Diesel 0.1 9.8 1.4 0.2 0.1 n/a
Other sources 8.3 10.4 8.1 0.6 0.3 0.1
Note: Carbon monoxide, fine particulate matter, volatile organic compounds and ammonia are not shown in the chart due to their low share (≤ 1%) of total emissions in 2017. Excludes emissions from industries that generate electricity and heat as a supporting activity rather than as their primary purpose. "Other" fuel sources include waste material and other uncategorized sources of electricity generation. Source: Environment and Climate Change Canada (2019) Air Pollutant Emissions Inventory.
Table A.20. Data for Figure 26. Changes in emissions of key air pollutants from electric utilities, Canada, 1990 to 2017
Year Sulphur oxides (percentage change from 1990 level)
Nitrogen oxides (percentage change from 1990 level)
1990 0 0
1991 -4 -2
1992 -1 2
1993 -12 -5
1994 -9 -7
1995 -14 -3
1996 -12 5
1997 -4 12
1998 -2 21
1999 -3 19
2000 0 27
2001 1 22
2002 1 23
2003 2 14
2004 -6 4
2005 -16 -1
2006 -26 -13
2007 -20 -7
2008 -31 -12
2009 -38 -15
2010 -46 -9
2011 -53 -22
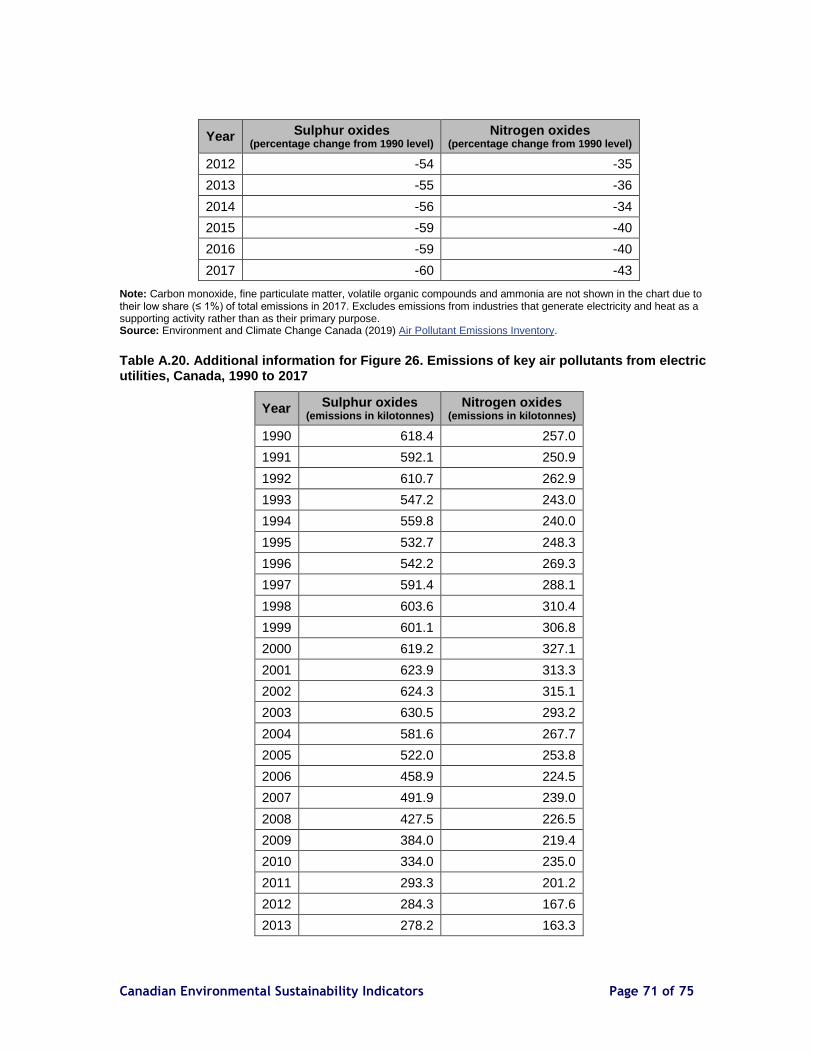
Canadian Environmental Sustainability Indicators Page 71 of 75
Year Sulphur oxides (percentage change from 1990 level)
Nitrogen oxides (percentage change from 1990 level)
2012 -54 -35
2013 -55 -36
2014 -56 -34
2015 -59 -40
2016 -59 -40
2017 -60 -43
Note: Carbon monoxide, fine particulate matter, volatile organic compounds and ammonia are not shown in the chart due to their low share (≤ 1%) of total emissions in 2017. Excludes emissions from industries that generate electricity and heat as a supporting activity rather than as their primary purpose. Source: Environment and Climate Change Canada (2019) Air Pollutant Emissions Inventory.
Table A.20. Additional information for Figure 26. Emissions of key air pollutants from electric utilities, Canada, 1990 to 2017
Year Sulphur oxides (emissions in kilotonnes)
Nitrogen oxides (emissions in kilotonnes)
1990 618.4 257.0
1991 592.1 250.9
1992 610.7 262.9
1993 547.2 243.0
1994 559.8 240.0
1995 532.7 248.3
1996 542.2 269.3
1997 591.4 288.1
1998 603.6 310.4
1999 601.1 306.8
2000 619.2 327.1
2001 623.9 313.3
2002 624.3 315.1
2003 630.5 293.2
2004 581.6 267.7
2005 522.0 253.8
2006 458.9 224.5
2007 491.9 239.0
2008 427.5 226.5
2009 384.0 219.4
2010 334.0 235.0
2011 293.3 201.2
2012 284.3 167.6
2013 278.2 163.3

Air pollutant emissions Page 72 of 75
Year Sulphur oxides (emissions in kilotonnes)
Nitrogen oxides (emissions in kilotonnes)
2014 269.2 168.6
2015 251.5 153.7
2016 253.1 154.3
2017 245.6 146.3
Note: Carbon monoxide, fine particulate matter, volatile organic compounds and ammonia are not shown in the chart due to their low share (≤ 1%) of total emissions in 2017. Excludes emissions from industries that generate electricity and heat as a supporting activity rather than as their primary purpose. Source: Environment and Climate Change Canada (2019) Air Pollutant Emissions Inventory.
Table A.21. Data for Figure 27. Contribution of the oil and gas industry to total air pollutant emissions by activity type, Canada, 2017
Activity type
Volatile organic
compounds (percentage of
national emissions)
Sulphur oxides
(percentage of national emissions)
Nitrogen oxides
(percentage of national emissions)
Carbon monoxide (percentage of national emissions)
Fine particulate matter
(percentage of national emissions)
Ammonia (percentage of national emissions)
Upstream oil and gas
35.4 21.9 26.0 9.4 0.7 0.5
Downstream oil and gas
1.2 4.9 1.0 0.4 0.1 <0.1
Note: Fine particulate matter and ammonia are not shown in the chart due to their low share (≤ 1%) of total emissions in 2017. Source: Environment and Climate Change Canada (2019) Air Pollutant Emissions Inventory.
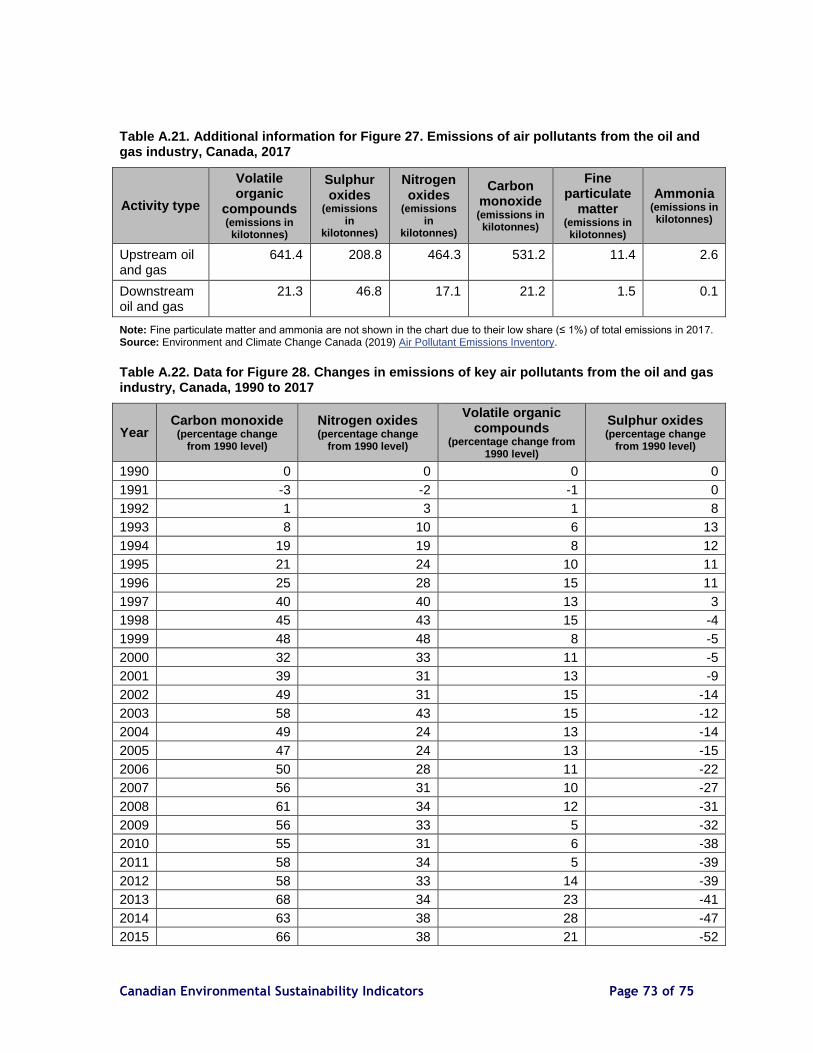
Canadian Environmental Sustainability Indicators Page 73 of 75
Table A.21. Additional information for Figure 27. Emissions of air pollutants from the oil and gas industry, Canada, 2017
Activity type
Volatile organic
compounds (emissions in kilotonnes)
Sulphur oxides
(emissions in
kilotonnes)
Nitrogen oxides
(emissions in
kilotonnes)
Carbon monoxide (emissions in kilotonnes)
Fine particulate
matter (emissions in kilotonnes)
Ammonia (emissions in kilotonnes)
Upstream oil and gas
641.4 208.8 464.3 531.2 11.4 2.6
Downstream oil and gas
21.3 46.8 17.1 21.2 1.5 0.1
Note: Fine particulate matter and ammonia are not shown in the chart due to their low share (≤ 1%) of total emissions in 2017. Source: Environment and Climate Change Canada (2019) Air Pollutant Emissions Inventory.
Table A.22. Data for Figure 28. Changes in emissions of key air pollutants from the oil and gas industry, Canada, 1990 to 2017
Year Carbon monoxide
(percentage change from 1990 level)
Nitrogen oxides (percentage change
from 1990 level)
Volatile organic compounds
(percentage change from 1990 level)
Sulphur oxides (percentage change
from 1990 level)
1990 0 0 0 0
1991 -3 -2 -1 0
1992 1 3 1 8
1993 8 10 6 13
1994 19 19 8 12
1995 21 24 10 11
1996 25 28 15 11
1997 40 40 13 3
1998 45 43 15 -4
1999 48 48 8 -5
2000 32 33 11 -5
2001 39 31 13 -9
2002 49 31 15 -14
2003 58 43 15 -12
2004 49 24 13 -14
2005 47 24 13 -15
2006 50 28 11 -22
2007 56 31 10 -27
2008 61 34 12 -31
2009 56 33 5 -32
2010 55 31 6 -38
2011 58 34 5 -39
2012 58 33 14 -39
2013 68 34 23 -41
2014 63 38 28 -47
2015 66 38 21 -52

Air pollutant emissions Page 74 of 75
Year Carbon monoxide
(percentage change from 1990 level)
Nitrogen oxides (percentage change
from 1990 level)
Volatile organic compounds
(percentage change from 1990 level)
Sulphur oxides (percentage change
from 1990 level)
2016 60 36 10 -54
2017 64 39 10 -52
Note: Fine particulate matter and ammonia are not shown in the chart due to their low share (≤ 1%) of total emissions in 2017. Source: Environment and Climate Change Canada (2019) Air Pollutant Emissions Inventory.
Table A.22. Additional information for Figure 28. Emissions of key air pollutants from the oil and gas industry, Canada, 1990 t0 2017
Year Carbon monoxide
(emissions in kilotonnes)
Nitrogen oxides (emissions in kilotonnes)
Volatile organic compounds
(emissions in kilotonnes)
Sulphur oxides (emissions in kilotonnes)
1990 336.3 346.0 599.9 533.9
1991 324.8 339.3 594.5 535.6
1992 339.6 355.9 608.8 574.9
1993 363.1 381.4 635.5 605.0
1994 399.4 413.2 648.7 598.5
1995 407.9 429.8 660.7 593.9
1996 420.0 441.8 688.6 590.8
1997 469.8 485.5 678.6 547.3
1998 486.9 496.4 691.1 513.4
1999 499.3 513.6 650.7 509.5
2000 443.7 459.1 667.5 504.7
2001 467.8 453.2 675.5 486.6
2002 499.5 453.2 691.8 457.3
2003 530.2 496.2 689.5 468.5
2004 502.7 430.6 676.1 460.3
2005 494.9 430.7 677.6 452.4
2006 505.6 441.3 665.4 415.6
2007 523.5 454.5 661.4 390.6
2008 540.9 464.1 673.4 368.7
2009 525.4 460.0 630.4 365.5
2010 521.3 451.9 634.6 332.9
2011 531.0 464.8 627.6 323.5
2012 532.4 460.9 682.0 325.2
2013 564.2 464.7 737.3 313.0
2014 549.5 476.7 767.2 280.9
2015 557.0 478.1 727.8 256.1
2016 537.6 470.8 661.0 246.7
2017 552.4 481.4 662.7 255.6
Note: Fine particulate matter and ammonia are not shown in the chart due to their low share (≤ 1%) of total emissions in 2017. Source: Environment and Climate Change Canada (2019) Air Pollutant Emissions Inventory.

Canadian Environmental Sustainability Indicators Page 75 of 75
Additional information can be obtained at:
Environment and Climate Change Canada
Public Inquiries Centre
12th Floor, Fontaine Building
200 Sacré-Coeur boul.
Gatineau, QC K1A 0H3
Telephone: 1-800-668-6767 (in Canada only) or 819-938-3860
Fax: 819-938-3318
Email: [email protected]


